UNITED STATES
SECURITIES AND EXCHANGE COMMISSION
Washington, D.C. 20549
FORM N-CSR
CERTIFIED
SHAREHOLDER REPORT OF REGISTERED
MANAGEMENT INVESTMENT COMPANIES
Investment Company Act file number 811-21343
Western Asset Emerging Markets Debt Fund Inc.
(Exact name of registrant as specified in charter)
620 Eighth
Avenue, 47th Floor, New York, NY 10018
(Address of principal executive offices)
(Zip code)
George P. Hoyt
Franklin
Templeton
100 First Stamford Place
Stamford, CT 06902
(Name
and address of agent for service)
Registrant’s telephone number, including area code: 1-888-777-0102
Date of fiscal year end: December 31
Date of reporting period: June 30, 2023
| ITEM 1. |
REPORT TO STOCKHOLDERS. |
The Semi-Annual Report to Stockholders is filed herewith.

|
|
|
|
Semi-Annual Report
|
|
June 30, 2023
|
WESTERN ASSET
EMERGING MARKETS
DEBT FUND INC. (EMD)

|
| INVESTMENT PRODUCTS: NOT FDIC INSURED • NO BANK GUARANTEE • MAY LOSE VALUE |
Managed Distribution Policy: The Fund’s Board of Directors (the
“Board”) has authorized a managed distribution plan pursuant to which the Fund makes monthly distributions to shareholders at a fixed rate of $0.0700 per common share, which rate may be adjusted from time to time by the Fund’s Board
(the “Plan”). The Plan is intended to provide shareholders with a constant, but not guaranteed, fixed minimum rate of distribution each month. The Fund is managed with a goal of generating as much of the distribution as possible from net
ordinary income and short-term capital gains that is consistent with the Fund’s investment strategy and risk profile. To the extent that sufficient distributable income is not available on a monthly basis, the Fund will distribute long-term
capital gains and/or return of capital in order to maintain its managed distribution rate. A return of capital may occur, for example, when some or all of the money that was invested in the Fund is paid back to shareholders. A return of capital
distribution does not necessarily reflect the Fund’s investment performance and should not be confused with “yield” or “income”. Even though the Fund may realize current year capital gains, such gains may be offset, in whole
or in part, by the Fund’s capital loss carryovers from prior years.
The Board may amend the terms of the Plan or terminate the
Plan at any time without prior notice to the Fund’s shareholders, however, at this time there are no reasonably foreseeable circumstances that might cause the termination of the Plan. The amendment or termination of the Plan could have an
adverse effect on the market price of the Fund’s common shares. The Plan is subject to the periodic review by the Board to determine if an adjustment should be made.
Shareholders should not draw any conclusions about the Fund’s investment performance from the amount of the current distribution or
from the terms of the Fund’s Plan. The Fund will send a Form 1099-DIV to shareholders for the calendar year that will describe how to report the Fund’s distributions for federal income tax purposes.
Fund objectives
The Fund’s primary investment objective is to seek high current income. As a secondary objective, the Fund seeks capital appreciation.
The Fund invests primarily in U.S. dollar and non-U.S. dollar denominated debt securities of issuers in emerging market
countries.
|
|
|
| Western Asset Emerging Markets Debt Fund Inc. |
|
II |
Letter from the chairman

Dear Shareholder,
We are pleased to provide the semi-annual report of Western Asset Emerging Markets Debt Fund Inc. for the six-month reporting
period ended June 30, 2023. Please read on for Fund performance information during the Fund’s reporting period.
As always, we remain committed to
providing you with excellent service and a full spectrum of investment choices. We also remain committed to supplementing the support you receive from your financial advisor. One way we accomplish this is through our website,
www.franklintempleton.com. Here you can gain immediate access to market and investment information, including:
• Fund prices and performance,
• Market insights and commentaries from our portfolio managers, and
• A
host of educational resources.
We look forward to helping you meet your financial goals.
Sincerely,

Jane Trust, CFA
Chairman, President and Chief Executive Officer
July 31, 2023
|
|
|
|
III |
|
Western Asset Emerging Markets Debt Fund Inc. |
Performance review
For the six months ended June 30, 2023, Western Asset Emerging Markets Debt Fund Inc.
returned 3.11% based on its net asset value (“NAV”)i and -0.61% based on its New York Stock Exchange (“NYSE”) market price per share.
The Fund’s unmanaged benchmark, the JPMorgan Emerging Markets Bond Index Global Diversifiedii, returned 4.09% for the same period.
The Fund has adopted a managed distribution policy (the “Managed Distribution Policy”). Pursuant to this policy, the Fund intends to make regular monthly
distributions to common shareholders at a fixed rate per common share, which rate may be adjusted from time to time by the Fund’s Board of Directors. This policy has no impact on the Fund’s investment strategy and may reduce the
Fund’s NAV. The Fund’s manager believes the policy helps maintain the Fund’s competitiveness and may benefit the Fund’s market price and premium/discount to the Fund’s NAV.
During the six-month period, the Fund made distributions to shareholders totaling $0.44 per share. As of June 30, 2023, the
Fund estimates that 73% of the distributions during the period were sourced from net investment income and 27% constituted a return of capital.* The performance table shows the Fund’s six-month total
return based on its NAV and market price as of June 30, 2023. Past performance is no guarantee of future results.
|
|
|
|
|
| Performance Snapshot as of June 30, 2023
(unaudited) |
|
| Price Per Share |
|
6-Month
Total Return** |
|
| $10.11 (NAV) |
|
|
3.11 |
%† |
| $8.62 (Market Price) |
|
|
-0.61 |
%‡ |
All figures represent past performance and are not a guarantee of future results. Performance figures for periods shorter than one year
represent cumulative figures and are not annualized.
** Total returns are based on changes in NAV or market price, respectively. Returns reflect the deduction
of all Fund expenses, including management fees, operating expenses, and other Fund expenses. Returns do not reflect the deduction of brokerage commissions or taxes that investors may pay on distributions or the sale of shares.
† Total return assumes the reinvestment of all distributions, including returns of capital, if any, at NAV.
‡ Total return assumes the reinvestment of all distributions, including returns of capital, if any, in additional shares in accordance with the Fund’s
Dividend Reinvestment Plan.
Looking for additional information?
The Fund is traded under the symbol “EMD” and its closing market price is available in most newspapers under the NYSE listings. The daily NAV is available
online under the symbol
| * |
These estimates are not for tax purposes. The Fund will issue a Form 1099 with final composition of the distributions for
tax purposes after year-end. A return of capital is not taxable and results in a reduction in the tax basis of a shareholder’s investment. For more information about a distribution’s composition,
please refer to the Fund’s distribution press release or, if applicable, the Section 19 notice located in the press release section of our website, www.franklintempleton.com. |
|
|
|
| Western Asset Emerging Markets Debt Fund Inc. |
|
IV |
Performance review (cont’d)
“XEMDX” on most financial websites. Barron’s and The Wall Street
Journal’s Monday edition both carry closed-end fund tables that provide additional information. In addition, the Fund issues a quarterly press release that can be found on most major financial
websites as well as www.franklintempleton.com.
In a continuing effort to provide information concerning the Fund, shareholders may call 1-888-777-0102 (toll free), Monday through Friday from 8:00 a.m. to 5:30 p.m. Eastern Time, for the Fund’s current NAV, market
price and other information.
Thank you for your investment in Western Asset Emerging Markets Debt Fund Inc. As always, we appreciate that you have chosen us to
manage your assets and we remain focused on achieving the Fund’s investment goals.
Sincerely,
Jane Trust, CFA
Chairman, President and Chief Executive Officer
July 31, 2023
RISKS: The Fund is a non-diversified,
closed-end management investment company designed primarily as a long-term investment and not as a trading vehicle. The Fund is not intended to be a complete investment program and, due to the uncertainty
inherent in all investments, there can be no assurance that the Fund will achieve its investment objective. The Fund’s common stock is traded on the New York Stock Exchange. Similar to stocks, the Fund’s share price will fluctuate with
market conditions and, at the time of sale, may be worth more or less than the original investment. Shares of closed-end funds often trade at a discount to their net asset value. Because the Fund is non-diversified, it may be more susceptible to economic, political, or regulatory events than a diversified fund. The Fund’s investments are subject to a number of risks, including credit risk, inflation risk
and interest rate risk. As interest rates rise, bond prices fall, reducing the value of the Fund’s fixed income holdings. Investing in foreign securities is subject to certain risks not associated with domestic investing, such as currency
fluctuations, and social, political, and economic uncertainties which could result in significant volatility. These risks are magnified in emerging or developing markets. Emerging market countries tend to have economic, political, and legal systems
that are less developed and are less stable than those of more developed countries. High yield bonds (commonly known as “junk bonds”) involve greater credit and liquidity risks than investment grade bonds. The Fund may make significant
investments in derivative instruments, such as options and futures, which can be illiquid, may disproportionately increase losses, and have a potentially large impact on Fund performance. Leverage may result in greater volatility of NAV and the
market price of common shares and increases a shareholder’s risk of loss. The market values of securities or other assets will fluctuate, sometimes sharply and unpredictably, due to changes in general market conditions,
|
|
|
|
V |
|
Western Asset Emerging Markets Debt Fund Inc. |
overall economic trends or events, governmental actions or intervention, actions taken by the U.S. Federal Reserve or
foreign central banks, market disruptions caused by trade disputes or other factors, political developments, armed conflicts, economic sanctions and countermeasures in response to sanctions, major cybersecurity events, investor sentiment, the global
and domestic effects of a pandemic, and other factors that may or may not be related to the issuer of the security or other asset. The Fund may also invest in money market funds, including funds affiliated with the Fund’s manager and
subadvisers.
All investments are subject to risk including the possible loss of principal. Past performance is no guarantee of future results. All index
performance reflects no deduction for fees, expenses or taxes. Please note that an investor cannot invest directly in an index.
| i |
Net asset value (“NAV”) is calculated by subtracting total liabilities, including liabilities associated with
financial leverage (if any), from the closing value of all securities held by the Fund (plus all other assets) and dividing the result (total net assets) by the total number of the common shares outstanding. The NAV fluctuates with changes in the
market prices of securities in which the Fund has invested. However, the price at which an investor may buy or sell shares of the Fund is the Fund’s market price as determined by supply of and demand for the Fund’s shares.
|
| ii |
The JPMorgan Emerging Markets Bond Index Global Diversified is an unmanaged, market-capitalization weighted, total-return
index tracking the traded market for U.S.-dollar-denominated Brady bonds, Eurobonds, traded loans, and local market debt instruments issued by sovereign and quasi-sovereign entities. |
|
|
|
| Western Asset Emerging Markets Debt Fund Inc. |
|
VI |
Fund at a glance† (unaudited)
Investment breakdown (%) as a percent of total investments
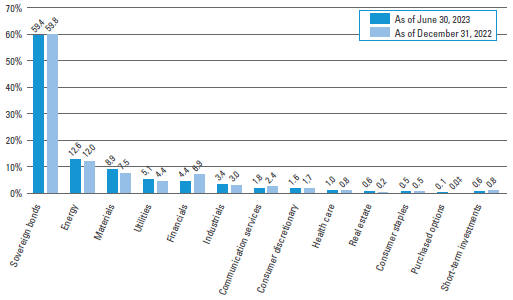
| † |
The bar graph above represents the composition of the Fund’s investments as of June 30, 2023 and
December 31, 2022 and does not include derivatives, such as written options, futures contracts and forward foreign currency contracts. The Fund is actively managed. As a result, the composition of the Fund’s investments is subject to
change at any time. |
| ‡ |
Represents less than 0.1%. |
|
|
|
|
|
| Western Asset Emerging Markets Debt Fund Inc. 2023 Semi-Annual Report |
|
|
|
1 |
Schedule of investments (unaudited)
June 30, 2023
Western Asset Emerging Markets
Debt Fund Inc.
(Percentages shown based on Fund net assets)
|
|
|
|
|
|
|
|
|
|
|
|
|
|
|
|
|
| Security |
|
Rate |
|
|
Maturity
Date |
|
|
Face
Amount† |
|
|
Value |
|
| Sovereign Bonds — 82.9% |
|
|
|
|
|
|
|
|
|
|
|
|
|
|
|
|
| Angola — 1.9% |
|
|
|
|
|
|
|
|
|
|
|
|
|
|
|
|
| Angolan Government International Bond, Senior Notes |
|
|
8.250 |
% |
|
|
5/9/28 |
|
|
|
9,650,000 |
|
|
$ |
8,586,281 |
(a) |
| Angolan Government International Bond, Senior Notes |
|
|
8.750 |
% |
|
|
4/14/32 |
|
|
|
1,000,000 |
|
|
|
844,075 |
(b) |
| Angolan Government International Bond, Senior Notes |
|
|
9.125 |
% |
|
|
11/26/49 |
|
|
|
3,000,000 |
|
|
|
2,321,250 |
(a) |
| Total Angola |
|
|
|
|
|
|
|
|
|
|
|
|
|
|
11,751,606 |
|
| Argentina — 4.6% |
|
|
|
|
|
|
|
|
|
|
|
|
|
|
|
|
| Argentine Bonos del Tesoro, Bonds |
|
|
16.000 |
% |
|
|
10/17/23 |
|
|
|
82,130,000 |
ARS |
|
|
129,339 |
(c) |
| Argentine Bonos del Tesoro, Bonds |
|
|
15.500 |
% |
|
|
10/17/26 |
|
|
|
157,160,000 |
ARS |
|
|
63,672 |
(c) |
| Argentine Republic Government International Bond, Senior Notes, Step bond (1.500% to
7/9/23 then 3.625%) |
|
|
1.500 |
% |
|
|
7/9/35 |
|
|
|
25,300,000 |
|
|
|
7,610,416 |
|
| Ciudad Autonoma De Buenos Aires, Senior Notes |
|
|
7.500 |
% |
|
|
6/1/27 |
|
|
|
5,500,000 |
|
|
|
5,171,485 |
(b) |
| Provincia de Buenos Aires, Senior Notes, Step bond (5.250% to 9/1/23, 6.375% to 9/1/24
then 6.625%) |
|
|
5.250 |
% |
|
|
9/1/37 |
|
|
|
20,601,128 |
|
|
|
7,905,683 |
(b) |
| Provincia de Cordoba, Senior Notes |
|
|
6.990 |
% |
|
|
6/1/27 |
|
|
|
9,949,022 |
|
|
|
6,864,825 |
(b) |
| Provincia de Cordoba, Senior Notes |
|
|
6.990 |
% |
|
|
6/1/27 |
|
|
|
550,000 |
|
|
|
379,500 |
(a) |
| Total Argentina |
|
|
|
|
|
|
|
|
|
|
|
|
|
|
28,124,920 |
|
| Armenia — 0.9% |
|
|
|
|
|
|
|
|
|
|
|
|
|
|
|
|
| Republic of Armenia International Bond, Senior Notes |
|
|
3.600 |
% |
|
|
2/2/31 |
|
|
|
7,000,000 |
|
|
|
5,504,800 |
(b) |
| Bahamas — 1.6% |
|
|
|
|
|
|
|
|
|
|
|
|
|
|
|
|
| Bahamas Government International Bond, Senior Notes |
|
|
9.000 |
% |
|
|
6/16/29 |
|
|
|
8,000,000 |
|
|
|
7,118,183 |
(b) |
| Bahamas Government International Bond, Senior Notes |
|
|
6.950 |
% |
|
|
11/20/29 |
|
|
|
3,000,000 |
|
|
|
2,392,841 |
(b) |
| Total Bahamas |
|
|
|
|
|
|
|
|
|
|
|
|
|
|
9,511,024 |
|
| Bahrain — 3.9% |
|
|
|
|
|
|
|
|
|
|
|
|
|
|
|
|
| Bahrain Government International Bond, Senior Notes |
|
|
7.000 |
% |
|
|
10/12/28 |
|
|
|
2,000,000 |
|
|
|
2,053,090 |
(a) |
| Bahrain Government International Bond, Senior Notes |
|
|
5.625 |
% |
|
|
9/30/31 |
|
|
|
10,000,000 |
|
|
|
9,273,700 |
(a) |
| Bahrain Government International Bond, Senior Notes |
|
|
6.000 |
% |
|
|
9/19/44 |
|
|
|
6,000,000 |
|
|
|
4,789,230 |
(b) |
See Notes to Financial Statements.
|
|
|
|
|
|
2 |
|
|
|
Western Asset Emerging Markets Debt Fund Inc. 2023 Semi-Annual Report |
Western Asset Emerging Markets Debt Fund Inc.
(Percentages shown based on Fund net assets)
|
|
|
|
|
|
|
|
|
|
|
|
|
|
|
|
|
| Security |
|
Rate |
|
|
Maturity
Date |
|
|
Face
Amount† |
|
|
Value |
|
| Bahrain — continued |
|
|
|
|
|
|
|
|
|
|
|
|
|
|
|
|
| Bahrain Government International Bond, Senior Notes |
|
|
7.500 |
% |
|
|
9/20/47 |
|
|
|
7,400,000 |
|
|
$ |
6,757,443 |
(b) |
| Bahrain Government International Bond, Senior Notes |
|
|
6.250 |
% |
|
|
1/25/51 |
|
|
|
1,000,000 |
|
|
|
790,629 |
(a) |
| Total Bahrain |
|
|
|
|
|
|
|
|
|
|
|
|
|
|
23,664,092 |
|
| Brazil — 0.9% |
|
|
|
|
|
|
|
|
|
|
|
|
|
|
|
|
| Brazil Letras do Tesouro Nacional |
|
|
0.000 |
% |
|
|
1/1/24 |
|
|
|
9,500,000 |
BRL |
|
|
1,869,115 |
|
| Brazil Notas do Tesouro Nacional Serie F, Notes |
|
|
10.000 |
% |
|
|
1/1/33 |
|
|
|
18,200,000 |
BRL |
|
|
3,663,942 |
|
| Total Brazil |
|
|
|
|
|
|
|
|
|
|
|
|
|
|
5,533,057 |
|
| Chile — 0.3% |
|
|
|
|
|
|
|
|
|
|
|
|
|
|
|
|
| Bonos de la Tesoreria de la Republica en pesos, Bonds |
|
|
5.800 |
% |
|
|
6/1/24 |
|
|
|
1,280,000,000 |
CLP |
|
|
1,573,751 |
(a)
|
| Colombia — 1.7% |
|
|
|
|
|
|
|
|
|
|
|
|
|
|
|
|
| Colombia Government International Bond, Senior Notes |
|
|
3.250 |
% |
|
|
4/22/32 |
|
|
|
5,000,000 |
|
|
|
3,711,549 |
(d) |
| Colombia Government International Bond, Senior Notes |
|
|
4.125 |
% |
|
|
2/22/42 |
|
|
|
10,000,000 |
|
|
|
6,401,887 |
(d) |
| Total Colombia |
|
|
|
|
|
|
|
|
|
|
|
|
|
|
10,113,436 |
|
| Costa Rica — 1.1% |
|
|
|
|
|
|
|
|
|
|
|
|
|
|
|
|
| Banco Nacional de Costa Rica |
|
|
6.250 |
% |
|
|
11/1/23 |
|
|
|
1,220,000 |
|
|
|
1,216,114 |
(b)(d) |
| Costa Rica Government International Bond, Senior Notes |
|
|
6.125 |
% |
|
|
2/19/31 |
|
|
|
1,050,000 |
|
|
|
1,044,977 |
(a) |
| Costa Rica Government International Bond, Senior Notes |
|
|
7.158 |
% |
|
|
3/12/45 |
|
|
|
4,200,000 |
|
|
|
4,169,980 |
(b)(d) |
| Total Costa Rica |
|
|
|
|
|
|
|
|
|
|
|
|
|
|
6,431,071 |
|
| Dominican Republic —
3.7% |
|
|
|
|
|
|
|
|
|
|
|
|
|
|
|
|
| Dominican Republic International Bond, Senior Notes |
|
|
9.750 |
% |
|
|
6/5/26 |
|
|
|
136,500,000 |
DOP |
|
|
2,527,732 |
(a) |
| Dominican Republic International Bond, Senior Notes |
|
|
6.000 |
% |
|
|
7/19/28 |
|
|
|
7,300,000 |
|
|
|
7,133,027 |
(b)(d) |
| Dominican Republic International Bond, Senior Notes |
|
|
4.875 |
% |
|
|
9/23/32 |
|
|
|
3,800,000 |
|
|
|
3,243,834 |
(a)(d) |
| Dominican Republic International Bond, Senior Notes |
|
|
5.300 |
% |
|
|
1/21/41 |
|
|
|
8,000,000 |
|
|
|
6,289,110 |
(a)(d) |
| Dominican Republic International Bond, Senior Notes |
|
|
5.875 |
% |
|
|
1/30/60 |
|
|
|
4,400,000 |
|
|
|
3,420,730 |
(a)(d) |
| Total Dominican Republic |
|
|
|
|
|
|
|
|
|
|
|
|
|
|
22,614,433 |
|
See Notes to Financial Statements.
|
|
|
|
|
| Western Asset Emerging Markets Debt Fund Inc. 2023 Semi-Annual Report |
|
|
|
3 |
Schedule of investments
(unaudited) (cont’d)
June 30, 2023
Western Asset Emerging Markets Debt Fund Inc.
(Percentages shown based on Fund net assets)
|
|
|
|
|
|
|
|
|
|
|
|
|
|
|
|
|
| Security |
|
Rate |
|
|
Maturity
Date |
|
|
Face
Amount† |
|
|
Value |
|
| Ecuador — 0.9% |
|
|
|
|
|
|
|
|
|
|
|
|
|
|
|
|
| Ecuador Government International Bond, Senior Notes |
|
|
0.000 |
% |
|
|
7/31/30 |
|
|
|
1,010,709 |
|
|
$ |
296,016 |
(b) |
| Ecuador Government International Bond, Senior Notes, Step Bond (2.500% to 7/31/23 then
3.500%) |
|
|
2.500 |
% |
|
|
7/31/35 |
|
|
|
2,920,000 |
|
|
|
1,020,625 |
(a) |
| Ecuador Government International Bond, Senior Notes, Step bond (1.500% to 7/31/23 then
2.500%) |
|
|
1.500 |
% |
|
|
7/31/40 |
|
|
|
12,680,000 |
|
|
|
3,975,180 |
(b) |
| Total Ecuador |
|
|
|
|
|
|
|
|
|
|
|
|
|
|
5,291,821 |
|
| Egypt — 2.3% |
|
|
|
|
|
|
|
|
|
|
|
|
|
|
|
|
| Egypt Government International Bond, Senior Notes |
|
|
3.875 |
% |
|
|
2/16/26 |
|
|
|
2,400,000 |
|
|
|
1,698,881 |
(a) |
| Egypt Government International Bond, Senior Notes |
|
|
6.588 |
% |
|
|
2/21/28 |
|
|
|
2,000,000 |
|
|
|
1,318,880 |
(a) |
| Egypt Government International Bond, Senior Notes |
|
|
5.875 |
% |
|
|
2/16/31 |
|
|
|
5,000,000 |
|
|
|
2,766,000 |
(a) |
| Egypt Government International Bond, Senior Notes |
|
|
7.625 |
% |
|
|
5/29/32 |
|
|
|
1,600,000 |
|
|
|
933,600 |
(b) |
| Egypt Government International Bond, Senior Notes |
|
|
7.903 |
% |
|
|
2/21/48 |
|
|
|
14,000,000 |
|
|
|
7,228,060 |
(a) |
| Total Egypt |
|
|
|
|
|
|
|
|
|
|
|
|
|
|
13,945,421 |
|
| Ethiopia — 0.4% |
|
|
|
|
|
|
|
|
|
|
|
|
|
|
|
|
| Ethiopia International Bond, Senior Notes |
|
|
6.625 |
% |
|
|
12/11/24 |
|
|
|
3,500,000 |
|
|
|
2,427,737 |
(a)
|
| Gabon — 1.0% |
|
|
|
|
|
|
|
|
|
|
|
|
|
|
|
|
| Gabon Government International Bond, Senior Notes |
|
|
6.625 |
% |
|
|
2/6/31 |
|
|
|
5,000,000 |
|
|
|
3,989,300 |
(a) |
| Gabon Government International Bond, Senior Notes |
|
|
7.000 |
% |
|
|
11/24/31 |
|
|
|
2,300,000 |
|
|
|
1,831,260 |
(b) |
| Total Gabon |
|
|
|
|
|
|
|
|
|
|
|
|
|
|
5,820,560 |
|
| Ghana — 1.2% |
|
|
|
|
|
|
|
|
|
|
|
|
|
|
|
|
| Ghana Government International Bond, Senior Notes |
|
|
7.625 |
% |
|
|
5/16/29 |
|
|
|
5,700,000 |
|
|
|
2,455,879 |
*(a)(e) |
| Ghana Government International Bond, Senior Notes |
|
|
10.750 |
% |
|
|
10/14/30 |
|
|
|
7,600,000 |
|
|
|
5,137,251 |
(b) |
| Total Ghana |
|
|
|
|
|
|
|
|
|
|
|
|
|
|
7,593,130 |
|
| Guatemala — 1.7% |
|
|
|
|
|
|
|
|
|
|
|
|
|
|
|
|
| Guatemala Government Bond, Senior Notes |
|
|
5.375 |
% |
|
|
4/24/32 |
|
|
|
6,800,000 |
|
|
|
6,472,839 |
(b)(d) |
See Notes to Financial Statements.
|
|
|
|
|
|
4 |
|
|
|
Western Asset Emerging Markets Debt Fund Inc. 2023 Semi-Annual Report |
Western Asset Emerging Markets Debt Fund Inc.
(Percentages shown based on Fund net assets)
|
|
|
|
|
|
|
|
|
|
|
|
|
|
|
|
|
| Security |
|
Rate |
|
|
Maturity
Date |
|
|
Face
Amount† |
|
|
Value |
|
| Guatemala —
continued |
|
|
|
|
|
|
|
|
|
|
|
|
|
|
|
|
| Guatemala Government Bond, Senior Notes |
|
|
6.600 |
% |
|
|
6/13/36 |
|
|
|
3,000,000 |
|
|
$ |
3,022,258 |
(b)(d) |
| Guatemala Government Bond, Senior Notes |
|
|
4.650 |
% |
|
|
10/7/41 |
|
|
|
1,000,000 |
|
|
|
802,125 |
(b)(d) |
| Total Guatemala |
|
|
|
|
|
|
|
|
|
|
|
|
|
|
10,297,222 |
|
| Hungary — 1.2% |
|
|
|
|
|
|
|
|
|
|
|
|
|
|
|
|
| Hungary Government Bond |
|
|
1.000 |
% |
|
|
11/26/25 |
|
|
|
1,449,570,000 |
HUF |
|
|
3,548,236 |
|
| Hungary Government International Bond, Senior Notes |
|
|
5.750 |
% |
|
|
11/22/23 |
|
|
|
2,098,000 |
|
|
|
2,098,845 |
|
| Magyar Export-Import Bank Zrt |
|
|
6.125 |
% |
|
|
12/4/27 |
|
|
|
1,900,000 |
|
|
|
1,883,048 |
(b)(d) |
| Total Hungary |
|
|
|
|
|
|
|
|
|
|
|
|
|
|
7,530,129 |
|
| Indonesia — 5.8% |
|
|
|
|
|
|
|
|
|
|
|
|
|
|
|
|
| Indonesia Government International |
|
|
|
|
|
|
|
|
|
|
|
|
|
|
|
|
| Bond, Senior Notes |
|
|
6.625 |
% |
|
|
2/17/37 |
|
|
|
3,210,000 |
|
|
|
3,670,551 |
(a)(d) |
| Indonesia Government International |
|
|
|
|
|
|
|
|
|
|
|
|
|
|
|
|
| Bond, Senior Notes |
|
|
5.250 |
% |
|
|
1/17/42 |
|
|
|
14,000,000 |
|
|
|
14,003,129 |
(b)(d) |
| Indonesia Treasury Bond |
|
|
8.375 |
% |
|
|
9/15/26 |
|
|
|
131,422,000,000 |
IDR |
|
|
9,397,009 |
|
| Indonesia Treasury Bond |
|
|
8.375 |
% |
|
|
3/15/34 |
|
|
|
106,475,000,000 |
IDR |
|
|
8,181,912 |
|
| Total Indonesia |
|
|
|
|
|
|
|
|
|
|
|
|
|
|
35,252,601 |
|
| Ivory Coast — 1.8% |
|
|
|
|
|
|
|
|
|
|
|
|
|
|
|
|
| Ivory Coast Government International Bond, Senior Notes |
|
|
5.375 |
% |
|
|
7/23/24 |
|
|
|
1,350,000 |
|
|
|
1,322,257 |
(b)(d) |
| Ivory Coast Government International Bond, Senior Notes |
|
|
5.250 |
% |
|
|
3/22/30 |
|
|
|
4,800,000 |
EUR |
|
|
4,441,359 |
(a) |
| Ivory Coast Government International Bond, Senior Notes |
|
|
6.125 |
% |
|
|
6/15/33 |
|
|
|
2,500,000 |
|
|
|
2,196,815 |
(a) |
| Ivory Coast Government International Bond, Senior Notes |
|
|
6.125 |
% |
|
|
6/15/33 |
|
|
|
3,540,000 |
|
|
|
3,110,690 |
(b) |
| Total Ivory Coast |
|
|
|
|
|
|
|
|
|
|
|
|
|
|
11,071,121 |
|
| Jamaica — 1.0% |
|
|
|
|
|
|
|
|
|
|
|
|
|
|
|
|
| Jamaica Government International Bond, Senior Notes |
|
|
6.750 |
% |
|
|
4/28/28 |
|
|
|
1,390,000 |
|
|
|
1,456,143 |
|
| Jamaica Government International Bond, Senior Notes |
|
|
8.000 |
% |
|
|
3/15/39 |
|
|
|
1,760,000 |
|
|
|
2,105,013 |
|
| Jamaica Government International Bond, Senior Notes |
|
|
7.875 |
% |
|
|
7/28/45 |
|
|
|
2,000,000 |
|
|
|
2,313,007 |
(d) |
| Total Jamaica |
|
|
|
|
|
|
|
|
|
|
|
|
|
|
5,874,163 |
|
| Jordan — 2.5% |
|
|
|
|
|
|
|
|
|
|
|
|
|
|
|
|
| Jordan Government International Bond, Senior Notes |
|
|
6.125 |
% |
|
|
1/29/26 |
|
|
|
440,000 |
|
|
|
432,579 |
(b) |
See Notes to Financial Statements.
|
|
|
|
|
| Western Asset Emerging Markets Debt Fund Inc. 2023 Semi-Annual Report |
|
|
|
5 |
Schedule of investments
(unaudited) (cont’d)
June 30, 2023
Western Asset Emerging Markets Debt Fund Inc.
(Percentages shown based on Fund net assets)
|
|
|
|
|
|
|
|
|
|
|
|
|
|
|
|
|
| Security |
|
Rate |
|
|
Maturity
Date |
|
|
Face
Amount† |
|
|
Value |
|
| Jordan — continued |
|
|
|
|
|
|
|
|
|
|
|
|
|
|
|
|
| Jordan Government International Bond, Senior Notes |
|
|
7.750 |
% |
|
|
1/15/28 |
|
|
|
3,120,000 |
|
|
$ |
3,180,450 |
(b) |
| Jordan Government International Bond, Senior Notes |
|
|
7.750 |
% |
|
|
1/15/28 |
|
|
|
1,600,000 |
|
|
|
1,631,000 |
(a) |
| Jordan Government International Bond, Senior Notes |
|
|
5.850 |
% |
|
|
7/7/30 |
|
|
|
6,350,000 |
|
|
|
5,833,809 |
(a) |
| Jordan Government International Bond, Senior Notes |
|
|
7.375 |
% |
|
|
10/10/47 |
|
|
|
5,020,000 |
|
|
|
4,340,392 |
(b) |
| Total Jordan |
|
|
|
|
|
|
|
|
|
|
|
|
|
|
15,418,230 |
|
| Kazakhstan — 1.5% |
|
|
|
|
|
|
|
|
|
|
|
|
|
|
|
|
| Kazakhstan Government International Bond, Senior Notes |
|
|
3.875 |
% |
|
|
10/14/24 |
|
|
|
3,000,000 |
|
|
|
3,002,310 |
(a) |
| Tengizchevroil Finance Co. |
|
|
|
|
|
|
|
|
|
|
|
|
|
|
|
|
| International Ltd., Senior Secured Notes |
|
|
4.000 |
% |
|
|
8/15/26 |
|
|
|
6,800,000 |
|
|
|
6,205,000 |
(a) |
| Total Kazakhstan |
|
|
|
|
|
|
|
|
|
|
|
|
|
|
9,207,310 |
|
| Kenya — 1.6% |
|
|
|
|
|
|
|
|
|
|
|
|
|
|
|
|
| Republic of Kenya Government International Bond, Senior Notes |
|
|
6.875 |
% |
|
|
6/24/24 |
|
|
|
2,000,000 |
|
|
|
1,907,340 |
(a) |
| Republic of Kenya Government International Bond, Senior Notes |
|
|
7.250 |
% |
|
|
2/28/28 |
|
|
|
4,400,000 |
|
|
|
3,828,035 |
(a) |
| Republic of Kenya Government International Bond, Senior Notes |
|
|
8.000 |
% |
|
|
5/22/32 |
|
|
|
4,400,000 |
|
|
|
3,728,191 |
(a) |
| Republic of Kenya Government International Bond, Senior Notes |
|
|
6.300 |
% |
|
|
1/23/34 |
|
|
|
200,000 |
|
|
|
151,565 |
(a) |
| Total Kenya |
|
|
|
|
|
|
|
|
|
|
|
|
|
|
9,615,131 |
|
| Mexico — 3.4% |
|
|
|
|
|
|
|
|
|
|
|
|
|
|
|
|
| Mexican Bonos, Bonds |
|
|
8.000 |
% |
|
|
9/5/24 |
|
|
|
115,300,000 |
MXN |
|
|
6,519,316 |
|
| Mexican Bonos, Bonds |
|
|
5.000 |
% |
|
|
3/6/25 |
|
|
|
258,260,000 |
MXN |
|
|
13,940,186 |
|
| Total Mexico |
|
|
|
|
|
|
|
|
|
|
|
|
|
|
20,459,502 |
|
| Nigeria — 2.5% |
|
|
|
|
|
|
|
|
|
|
|
|
|
|
|
|
| Nigeria Government International Bond, Senior Notes |
|
|
6.125 |
% |
|
|
9/28/28 |
|
|
|
6,700,000 |
|
|
|
5,597,280 |
(a) |
| Nigeria Government International Bond, Senior Notes |
|
|
8.375 |
% |
|
|
3/24/29 |
|
|
|
1,500,000 |
|
|
|
1,354,088 |
(a) |
| Nigeria Government International Bond, Senior Notes |
|
|
7.875 |
% |
|
|
2/16/32 |
|
|
|
2,600,000 |
|
|
|
2,187,006 |
(a) |
| Nigeria Government International Bond, Senior Notes |
|
|
7.696 |
% |
|
|
2/23/38 |
|
|
|
7,800,000 |
|
|
|
5,864,274 |
(a) |
| Total Nigeria |
|
|
|
|
|
|
|
|
|
|
|
|
|
|
15,002,648 |
|
See Notes to Financial Statements.
|
|
|
|
|
|
6 |
|
|
|
Western Asset Emerging Markets Debt Fund Inc. 2023 Semi-Annual Report |
Western Asset Emerging Markets Debt Fund Inc.
(Percentages shown based on Fund net assets)
|
|
|
|
|
|
|
|
|
|
|
|
|
|
|
|
|
| Security |
|
Rate |
|
|
Maturity
Date |
|
|
Face
Amount† |
|
|
Value |
|
| Oman — 4.8% |
|
|
|
|
|
|
|
|
|
|
|
|
|
|
|
|
| Oman Government International Bond, Senior Notes |
|
|
4.750 |
% |
|
|
6/15/26 |
|
|
|
3,200,000 |
|
|
$ |
3,116,029 |
(a) |
| Oman Government International Bond, Senior Notes |
|
|
4.750 |
% |
|
|
6/15/26 |
|
|
|
5,270,000 |
|
|
|
5,131,710 |
(b) |
| Oman Government International Bond, Senior Notes |
|
|
5.625 |
% |
|
|
1/17/28 |
|
|
|
9,000,000 |
|
|
|
8,919,117 |
(b) |
| Oman Government International Bond, Senior Notes |
|
|
6.000 |
% |
|
|
8/1/29 |
|
|
|
6,000,000 |
|
|
|
6,013,782 |
(b) |
| Oman Government International Bond, Senior Notes |
|
|
6.750 |
% |
|
|
1/17/48 |
|
|
|
6,500,000 |
|
|
|
6,261,203 |
(a) |
| Total Oman |
|
|
|
|
|
|
|
|
|
|
|
|
|
|
29,441,841 |
|
| Panama — 1.4% |
|
|
|
|
|
|
|
|
|
|
|
|
|
|
|
|
| Panama Government International Bond, Senior Notes |
|
|
9.375 |
% |
|
|
4/1/29 |
|
|
|
910,000 |
|
|
|
1,098,319 |
(d) |
| Panama Government International Bond, Senior Notes |
|
|
6.700 |
% |
|
|
1/26/36 |
|
|
|
159,000 |
|
|
|
170,648 |
|
| Panama Government International Bond, Senior Notes |
|
|
4.500 |
% |
|
|
5/15/47 |
|
|
|
5,000,000 |
|
|
|
3,989,170 |
|
| Panama Government International Bond, Senior Notes |
|
|
4.500 |
% |
|
|
1/19/63 |
|
|
|
4,200,000 |
|
|
|
3,083,311 |
|
| Total Panama |
|
|
|
|
|
|
|
|
|
|
|
|
|
|
8,341,448 |
|
| Paraguay — 1.2% |
|
|
|
|
|
|
|
|
|
|
|
|
|
|
|
|
| Paraguay Government International Bond, Senior Notes |
|
|
5.000 |
% |
|
|
4/15/26 |
|
|
|
2,110,000 |
|
|
|
2,096,795 |
(b)(d) |
| Paraguay Government International Bond, Senior Notes |
|
|
4.950 |
% |
|
|
4/28/31 |
|
|
|
3,950,000 |
|
|
|
3,804,290 |
(b)(d) |
| Paraguay Government International Bond, Senior Notes |
|
|
5.400 |
% |
|
|
3/30/50 |
|
|
|
1,910,000 |
|
|
|
1,636,434 |
(b)(d) |
| Total Paraguay |
|
|
|
|
|
|
|
|
|
|
|
|
|
|
7,537,519 |
|
| Peru — 3.6% |
|
|
|
|
|
|
|
|
|
|
|
|
|
|
|
|
| Peruvian Government International Bond, Senior Notes |
|
|
7.350 |
% |
|
|
7/21/25 |
|
|
|
10,300,000 |
|
|
|
10,689,206 |
(d) |
| Peruvian Government International Bond, Senior Notes |
|
|
8.750 |
% |
|
|
11/21/33 |
|
|
|
8,998,000 |
|
|
|
11,434,388 |
(d) |
| Total Peru |
|
|
|
|
|
|
|
|
|
|
|
|
|
|
22,123,594 |
|
| Poland — 0.5% |
|
|
|
|
|
|
|
|
|
|
|
|
|
|
|
|
| Bank Gospodarstwa Krajowego |
|
|
5.375 |
% |
|
|
5/22/33 |
|
|
|
3,000,000 |
|
|
|
2,987,928 |
(b)(d) |
| Qatar — 4.0% |
|
|
|
|
|
|
|
|
|
|
|
|
|
|
|
|
| Qatar Government International Bond, Senior Notes |
|
|
5.103 |
% |
|
|
4/23/48 |
|
|
|
7,920,000 |
|
|
|
7,907,059 |
(b)(d) |
See Notes to Financial Statements.
|
|
|
|
|
| Western Asset Emerging Markets Debt Fund Inc. 2023 Semi-Annual Report |
|
|
|
7 |
Schedule of investments
(unaudited) (cont’d)
June 30, 2023
Western Asset Emerging Markets Debt Fund Inc.
(Percentages shown based on Fund net assets)
|
|
|
|
|
|
|
|
|
|
|
|
|
|
|
|
|
| Security |
|
Rate |
|
|
Maturity
Date |
|
|
Face
Amount† |
|
|
Value |
|
| Qatar — continued |
|
|
|
|
|
|
|
|
|
|
|
|
|
|
|
|
| Qatar Government International Bond, Senior Notes |
|
|
4.817 |
% |
|
|
3/14/49 |
|
|
|
14,100,000 |
|
|
$ |
13,579,921 |
(b)(d) |
| Qatar Government International Bond, Senior Notes |
|
|
4.400 |
% |
|
|
4/16/50 |
|
|
|
2,900,000 |
|
|
|
2,644,217 |
(b)(d) |
| Total Qatar |
|
|
|
|
|
|
|
|
|
|
|
|
|
|
24,131,197 |
|
| Romania — 0.3% |
|
|
|
|
|
|
|
|
|
|
|
|
|
|
|
|
| Romanian Government International Bond, Senior Notes |
|
|
4.875 |
% |
|
|
1/22/24 |
|
|
|
1,570,000 |
|
|
|
1,563,057 |
(b)(d) |
| Russia — 0.2% |
|
|
|
|
|
|
|
|
|
|
|
|
|
|
|
|
| Russian Federal Bond — OFZ |
|
|
7.250 |
% |
|
|
5/10/34 |
|
|
|
400,000,000 |
RUB |
|
|
1,497,207 |
*(e)(f) |
| Rwanda — 0.5% |
|
|
|
|
|
|
|
|
|
|
|
|
|
|
|
|
| Rwanda International Government Bond, Senior Notes |
|
|
5.500 |
% |
|
|
8/9/31 |
|
|
|
4,050,000 |
|
|
|
3,075,278 |
(b)
|
| Senegal — 1.3% |
|
|
|
|
|
|
|
|
|
|
|
|
|
|
|
|
| Senegal Government International Bond, Senior Notes |
|
|
6.250 |
% |
|
|
7/30/24 |
|
|
|
2,170,000 |
|
|
|
2,135,128 |
(a) |
| Senegal Government International Bond, Senior Notes |
|
|
6.250 |
% |
|
|
5/23/33 |
|
|
|
2,000,000 |
|
|
|
1,679,372 |
(a) |
| Senegal Government International Bond, Senior Notes |
|
|
6.750 |
% |
|
|
3/13/48 |
|
|
|
6,000,000 |
|
|
|
4,314,270 |
(b) |
| Total Senegal |
|
|
|
|
|
|
|
|
|
|
|
|
|
|
8,128,770 |
|
| South Africa — 1.3% |
|
|
|
|
|
|
|
|
|
|
|
|
|
|
|
|
| Republic of South Africa Government Bond, Senior Notes |
|
|
8.500 |
% |
|
|
1/31/37 |
|
|
|
81,280,000 |
ZAR |
|
|
3,303,022 |
|
| Republic of South Africa Government International Bond, Senior Notes |
|
|
5.000 |
% |
|
|
10/12/46 |
|
|
|
5,000,000 |
|
|
|
3,339,850 |
(d) |
| Republic of South Africa Government International Bond, Senior Notes |
|
|
5.750 |
% |
|
|
9/30/49 |
|
|
|
2,000,000 |
|
|
|
1,420,700 |
(d) |
| Total South Africa |
|
|
|
|
|
|
|
|
|
|
|
|
|
|
8,063,572 |
|
| South Korea — 1.2% |
|
|
|
|
|
|
|
|
|
|
|
|
|
|
|
|
| Export-Import Bank of Korea, Senior Notes |
|
|
5.750 |
% |
|
|
3/5/24 |
|
|
|
37,400,000,000 |
IDR |
|
|
2,481,734 |
(a) |
| Korea Housing Finance Corp., Senior Notes |
|
|
4.625 |
% |
|
|
2/24/33 |
|
|
|
5,000,000 |
|
|
|
4,901,487 |
(b)(d) |
| Total South Korea |
|
|
|
|
|
|
|
|
|
|
|
|
|
|
7,383,221 |
|
| Supranational —
4.1% |
|
|
|
|
|
|
|
|
|
|
|
|
|
|
|
|
| Africa Finance Corp., Senior Notes |
|
|
3.750 |
% |
|
|
10/30/29 |
|
|
|
3,000,000 |
|
|
|
2,491,980 |
(a) |
| African Export-Import Bank, Senior Notes |
|
|
3.798 |
% |
|
|
5/17/31 |
|
|
|
3,000,000 |
|
|
|
2,418,285 |
(b)(d) |
See Notes to Financial Statements.
|
|
|
|
|
|
8 |
|
|
|
Western Asset Emerging Markets Debt Fund Inc. 2023 Semi-Annual Report |
Western Asset Emerging Markets Debt Fund Inc.
(Percentages shown based on Fund net assets)
|
|
|
|
|
|
|
|
|
|
|
|
|
|
|
|
|
| Security |
|
Rate |
|
|
Maturity
Date |
|
|
Face
Amount† |
|
|
Value |
|
| Supranational —
continued |
|
|
|
|
|
|
|
|
|
|
|
|
|
|
|
|
| European Bank for Reconstruction & Development, Senior Notes |
|
|
5.150 |
% |
|
|
2/16/24 |
|
|
|
102,600,000 |
INR |
|
$ |
1,236,093 |
|
| European Investment Bank, Senior Notes |
|
|
10.000 |
% |
|
|
12/6/23 |
|
|
|
40,900,000 |
EGP |
|
|
1,185,588 |
(a) |
| Inter-American Development Bank, Senior Notes |
|
|
7.900 |
% |
|
|
3/2/25 |
|
|
|
900,000,000 |
CRC |
|
|
1,634,104 |
|
| International Bank for Reconstruction & Development, Senior Notes |
|
|
8.500 |
% |
|
|
9/15/23 |
|
|
|
1,492,000,000 |
KZT |
|
|
3,268,696 |
|
| International Finance Corp., Senior Notes |
|
|
2.900 |
% |
|
|
1/16/24 |
|
|
|
7,700,000,000 |
COP |
|
|
1,744,826 |
|
| International Finance Corp., Senior Notes |
|
|
14.750 |
% |
|
|
4/17/24 |
|
|
|
39,000,000,000 |
UZS |
|
|
3,373,185 |
|
| International Finance Corp., Senior Notes |
|
|
6.280 |
% |
|
|
5/27/24 |
|
|
|
304,000,000 |
UYU |
|
|
7,829,067 |
|
| Total Supranational |
|
|
|
|
|
|
|
|
|
|
|
|
|
|
25,181,824 |
|
| Tunisia — 0.4% |
|
|
|
|
|
|
|
|
|
|
|
|
|
|
|
|
| Banque Centrale de Tunisie International Bond, Senior Notes |
|
|
5.750 |
% |
|
|
1/30/25 |
|
|
|
3,760,000 |
|
|
|
2,515,628 |
(a)
|
| Turkey — 1.6% |
|
|
|
|
|
|
|
|
|
|
|
|
|
|
|
|
| Turkey Government International Bond, Senior Notes |
|
|
5.125 |
% |
|
|
2/17/28 |
|
|
|
4,000,000 |
|
|
|
3,488,400 |
|
| Turkey Government International Bond, Senior Notes |
|
|
9.375 |
% |
|
|
3/14/29 |
|
|
|
3,000,000 |
|
|
|
3,014,370 |
|
| Turkey Government International Bond, Senior Notes |
|
|
4.875 |
% |
|
|
4/16/43 |
|
|
|
5,160,000 |
|
|
|
3,325,104 |
|
| Total Turkey |
|
|
|
|
|
|
|
|
|
|
|
|
|
|
9,827,874 |
|
| Ukraine — 1.0% |
|
|
|
|
|
|
|
|
|
|
|
|
|
|
|
|
| Ukraine Government International Bond, Senior Notes |
|
|
6.750 |
% |
|
|
6/20/28 |
|
|
|
1,700,000 |
EUR |
|
|
400,911 |
*(a)(e) |
| Ukraine Government International Bond, Senior Notes |
|
|
7.750 |
% |
|
|
9/1/29 |
|
|
|
8,800,000 |
|
|
|
2,131,527 |
*(a)(e) |
| Ukraine Government International Bond, Senior Notes |
|
|
9.750 |
% |
|
|
11/1/30 |
|
|
|
15,080,000 |
|
|
|
3,775,806 |
*(a)(e) |
| Total Ukraine |
|
|
|
|
|
|
|
|
|
|
|
|
|
|
6,308,244 |
|
| United Arab Emirates —
0.8% |
|
|
|
|
|
|
|
|
|
|
|
|
|
|
|
|
| Finance Department Government of Sharjah, Senior Notes |
|
|
4.000 |
% |
|
|
7/28/50 |
|
|
|
3,000,000 |
|
|
|
1,927,776 |
(a) |
| Finance Department Government of Sharjah, Senior Notes |
|
|
4.375 |
% |
|
|
3/10/51 |
|
|
|
4,000,000 |
|
|
|
2,748,180 |
(a) |
| Total United Arab
Emirates |
|
|
|
|
|
|
|
|
|
|
|
|
|
|
4,675,956 |
|
See Notes to Financial Statements.
|
|
|
|
|
| Western Asset Emerging Markets Debt Fund Inc. 2023 Semi-Annual Report |
|
|
|
9 |
Schedule of investments
(unaudited) (cont’d)
June 30, 2023
Western Asset Emerging Markets Debt Fund Inc.
(Percentages shown based on Fund net assets)
|
|
|
|
|
|
|
|
|
|
|
|
|
|
|
|
|
| Security |
|
Rate |
|
|
Maturity
Date |
|
|
Face
Amount† |
|
|
Value |
|
| Uruguay — 2.7% |
|
|
|
|
|
|
|
|
|
|
|
|
|
|
|
|
| Uruguay Government International Bond, Senior Notes |
|
|
5.750 |
% |
|
|
10/28/34 |
|
|
|
10,408,526 |
|
|
$ |
11,263,511 |
|
| Uruguay Government International Bond, Senior Notes |
|
|
5.100 |
% |
|
|
6/18/50 |
|
|
|
4,341,000 |
|
|
|
4,336,429 |
|
| Uruguay Government International Bond, Senior Notes |
|
|
4.975 |
% |
|
|
4/20/55 |
|
|
|
1,180,000 |
|
|
|
1,151,163 |
|
| Total Uruguay |
|
|
|
|
|
|
|
|
|
|
|
|
|
|
16,751,103 |
|
| Uzbekistan — 0.8% |
|
|
|
|
|
|
|
|
|
|
|
|
|
|
|
|
| Republic of Uzbekistan International Bond, Senior Notes |
|
|
3.700 |
% |
|
|
11/25/30 |
|
|
|
4,000,000 |
|
|
|
3,242,080 |
(a) |
| Republic of Uzbekistan International Bond, Senior Notes |
|
|
3.900 |
% |
|
|
10/19/31 |
|
|
|
2,000,000 |
|
|
|
1,612,500 |
(b) |
| Total Uzbekistan |
|
|
|
|
|
|
|
|
|
|
|
|
|
|
4,854,580 |
|
| Venezuela — 0.4% |
|
|
|
|
|
|
|
|
|
|
|
|
|
|
|
|
| Venezuela Government International Bond, Senior Notes |
|
|
— |
|
|
|
10/13/19 |
|
|
|
22,130,000 |
|
|
|
1,327,800 |
*(a)(g) |
| Venezuela Government International Bond, Senior Notes |
|
|
8.250 |
% |
|
|
10/13/24 |
|
|
|
7,000,000 |
|
|
|
647,500 |
*(a)(e) |
| Venezuela Government International Bond, Senior Notes |
|
|
9.250 |
% |
|
|
9/15/27 |
|
|
|
4,205,000 |
|
|
|
378,450 |
*(e) |
| Total Venezuela |
|
|
|
|
|
|
|
|
|
|
|
|
|
|
2,353,750 |
|
| Vietnam — 1.1% |
|
|
|
|
|
|
|
|
|
|
|
|
|
|
|
|
| Vietnam Government International Bond, Senior Notes |
|
|
4.800 |
% |
|
|
11/19/24 |
|
|
|
6,700,000 |
|
|
|
6,592,728 |
(b)(d) |
| Zambia — 0.3% |
|
|
|
|
|
|
|
|
|
|
|
|
|
|
|
|
| Zambia Government International Bond, Senior Notes |
|
|
8.500 |
% |
|
|
4/14/24 |
|
|
|
3,440,000 |
|
|
|
2,007,481 |
*(b)(e) |
| Total Sovereign Bonds (Cost —
$564,964,311) |
|
|
|
|
|
|
|
|
|
|
|
504,972,716 |
|
| Corporate Bonds & Notes — 55.7% |
|
|
|
|
|
|
|
|
|
|
|
|
|
|
|
|
| Communication Services — 2.5% |
|
|
|
|
|
|
|
|
|
|
|
|
|
|
|
|
| Diversified Telecommunication
Services — 0.7% |
|
|
|
|
|
|
|
|
|
|
|
|
|
| Turk Telekomunikasyon AS, Senior Notes |
|
|
4.875 |
% |
|
|
6/19/24 |
|
|
|
4,600,000 |
|
|
|
4,393,460 |
(a)
|
| Media — 0.7% |
|
|
|
|
|
|
|
|
|
|
|
|
|
|
|
|
| Cable Onda SA, Senior Notes |
|
|
4.500 |
% |
|
|
1/30/30 |
|
|
|
3,290,000 |
|
|
|
2,800,833 |
(b)(d) |
| Grupo Televisa SAB, Senior Notes |
|
|
6.625 |
% |
|
|
1/15/40 |
|
|
|
1,480,000 |
|
|
|
1,537,466 |
(d) |
| Total Media |
|
|
|
|
|
|
|
|
|
|
|
|
|
|
4,338,299 |
|
See Notes to Financial Statements.
|
|
|
|
|
|
10 |
|
|
|
Western Asset Emerging Markets Debt Fund Inc. 2023 Semi-Annual Report |
Western Asset Emerging Markets Debt Fund Inc.
(Percentages shown based on Fund net assets)
|
|
|
|
|
|
|
|
|
|
|
|
|
|
|
|
|
| Security |
|
Rate |
|
|
Maturity
Date |
|
|
Face
Amount† |
|
|
Value |
|
| Wireless Telecommunication Services —
1.1% |
|
|
|
|
|
|
|
|
|
|
|
|
|
|
|
|
| Millicom International Cellular SA, Senior Notes |
|
|
6.250 |
% |
|
|
3/25/29 |
|
|
|
6,624,000 |
|
|
$ |
5,944,518 |
(b)(d) |
| VTR Comunicaciones SpA, Senior Secured Notes |
|
|
5.125 |
% |
|
|
1/15/28 |
|
|
|
1,713,000 |
|
|
|
894,250 |
(b)(d) |
| Total Wireless Telecommunication
Services |
|
|
|
|
|
|
|
|
|
|
|
|
|
|
6,838,768 |
|
| Total Communication Services |
|
|
|
|
|
|
|
|
|
|
|
|
|
|
15,570,527 |
|
| Consumer Discretionary — 2.3% |
|
|
|
|
|
|
|
|
|
|
|
|
|
|
|
|
| Broadline Retail —
0.5% |
|
|
|
|
|
|
|
|
|
|
|
|
|
|
|
|
| Prosus NV, Senior Notes |
|
|
3.680 |
% |
|
|
1/21/30 |
|
|
|
3,200,000 |
|
|
|
2,717,736 |
(a)(d) |
| Hotels, Restaurants & Leisure
— 1.8% |
|
|
|
|
|
|
|
|
|
|
|
|
|
|
|
|
| Gohl Capital Ltd., Senior Notes |
|
|
4.250 |
% |
|
|
1/24/27 |
|
|
|
3,130,000 |
|
|
|
2,907,842 |
(a) |
| Melco Resorts Finance Ltd., Senior Notes |
|
|
5.750 |
% |
|
|
7/21/28 |
|
|
|
4,400,000 |
|
|
|
3,894,000 |
(b)(d) |
| Sands China Ltd., Senior Notes |
|
|
5.900 |
% |
|
|
8/8/28 |
|
|
|
1,700,000 |
|
|
|
1,622,055 |
|
| Wynn Macau Ltd., Senior Notes |
|
|
5.500 |
% |
|
|
10/1/27 |
|
|
|
3,000,000 |
|
|
|
2,673,675 |
(b) |
| Total Hotels, Restaurants &
Leisure |
|
|
|
|
|
|
|
|
|
|
|
|
|
|
11,097,572 |
|
| Total Consumer Discretionary |
|
|
|
|
|
|
|
|
|
|
|
|
|
|
13,815,308 |
|
| Consumer Staples — 0.6% |
|
|
|
|
|
|
|
|
|
|
|
|
|
|
|
|
| Beverages — 0.6% |
|
|
|
|
|
|
|
|
|
|
|
|
|
|
|
|
| Central American Bottling Corp./CBC Bottling Holdco SL/Beliv Holdco SL, Senior
Notes |
|
|
5.250 |
% |
|
|
4/27/29 |
|
|
|
4,150,000 |
|
|
|
3,838,353 |
(b)(d) |
| Energy — 17.6% |
|
|
|
|
|
|
|
|
|
|
|
|
|
|
|
|
| Oil, Gas & Consumable Fuels —
17.6% |
|
|
|
|
|
|
|
|
|
|
|
|
|
|
|
|
| Ecopetrol SA, Senior Notes |
|
|
5.875 |
% |
|
|
5/28/45 |
|
|
|
9,060,000 |
|
|
|
6,215,928 |
(d) |
| Ecopetrol SA, Senior Notes |
|
|
5.875 |
% |
|
|
11/2/51 |
|
|
|
3,000,000 |
|
|
|
1,988,167 |
(d) |
| Empresa Generadora de Electricidad Haina SA, Senior Notes |
|
|
5.625 |
% |
|
|
11/8/28 |
|
|
|
4,250,000 |
|
|
|
3,796,610 |
(b)(d) |
| KazMunayGas National Co. JSC, Senior Notes |
|
|
3.500 |
% |
|
|
4/14/33 |
|
|
|
11,000,000 |
|
|
|
8,545,460 |
(a) |
| KazMunayGas National Co. JSC, Senior Notes |
|
|
6.375 |
% |
|
|
10/24/48 |
|
|
|
5,300,000 |
|
|
|
4,543,097 |
(b)(d) |
| KazTransGas JSC, Senior Notes |
|
|
4.375 |
% |
|
|
9/26/27 |
|
|
|
3,200,000 |
|
|
|
2,987,312 |
(a) |
| Oleoducto Central SA, Senior Notes |
|
|
4.000 |
% |
|
|
7/14/27 |
|
|
|
2,400,000 |
|
|
|
2,104,598 |
(b)(d) |
| Pertamina Persero PT, Senior Notes |
|
|
6.500 |
% |
|
|
5/27/41 |
|
|
|
3,500,000 |
|
|
|
3,631,986 |
(b)(d) |
| Pertamina Persero PT, Senior Notes |
|
|
4.150 |
% |
|
|
2/25/60 |
|
|
|
2,000,000 |
|
|
|
1,494,778 |
(a)(d) |
| Petrobras Global Finance BV, Senior Notes |
|
|
7.375 |
% |
|
|
1/17/27 |
|
|
|
5,600,000 |
|
|
|
5,825,588 |
(d) |
| Petrobras Global Finance BV, Senior Notes |
|
|
5.750 |
% |
|
|
2/1/29 |
|
|
|
6,000,000 |
|
|
|
5,904,000 |
(d) |
See Notes to Financial Statements.
|
|
|
|
|
| Western Asset Emerging Markets Debt Fund Inc. 2023 Semi-Annual Report |
|
|
|
11 |
Schedule of investments
(unaudited) (cont’d)
June 30, 2023
Western Asset Emerging Markets Debt Fund Inc.
(Percentages shown based on Fund net assets)
|
|
|
|
|
|
|
|
|
|
|
|
|
|
|
|
|
| Security |
|
Rate |
|
|
Maturity
Date |
|
|
Face
Amount† |
|
|
Value |
|
| Oil, Gas & Consumable Fuels —
continued |
|
|
|
|
|
|
|
|
|
|
|
|
|
|
|
|
| Petrobras Global Finance BV, Senior Notes |
|
|
6.850 |
% |
|
|
6/5/2115 |
|
|
|
13,800,000 |
|
|
$ |
12,019,089 |
(d) |
| Petroleos de Venezuela SA, Senior Notes |
|
|
— |
|
|
|
11/17/21 |
|
|
|
16,630,000 |
|
|
|
644,413 |
*(a)(g) |
| Petroleos de Venezuela SA, Senior Notes |
|
|
6.000 |
% |
|
|
5/16/24 |
|
|
|
8,145,000 |
|
|
|
315,619 |
*(a)(e) |
| Petroleos del Peru SA, Senior Notes |
|
|
5.625 |
% |
|
|
6/19/47 |
|
|
|
6,800,000 |
|
|
|
4,392,343 |
(a)(d) |
| Petroleos Mexicanos, Senior Notes |
|
|
6.500 |
% |
|
|
3/13/27 |
|
|
|
2,000,000 |
|
|
|
1,780,954 |
(d) |
| Petroleos Mexicanos, Senior Notes |
|
|
5.350 |
% |
|
|
2/12/28 |
|
|
|
15,500,000 |
|
|
|
12,774,502 |
(d) |
| Petroleos Mexicanos, Senior Notes |
|
|
6.500 |
% |
|
|
6/2/41 |
|
|
|
8,200,000 |
|
|
|
5,214,548 |
(d) |
| Petroleos Mexicanos, Senior Notes |
|
|
5.500 |
% |
|
|
6/27/44 |
|
|
|
200,000 |
|
|
|
115,389 |
(d) |
| Petronas Capital Ltd., Senior Notes |
|
|
4.800 |
% |
|
|
4/21/60 |
|
|
|
7,000,000 |
|
|
|
6,597,589 |
(b)(d) |
| QazaqGaz NC JSC, Senior Notes |
|
|
4.375 |
% |
|
|
9/26/27 |
|
|
|
3,000,000 |
|
|
|
2,800,605 |
(b)(d) |
| Transportadora de Gas del Peru SA, Senior Notes |
|
|
4.250 |
% |
|
|
4/30/28 |
|
|
|
1,080,000 |
|
|
|
1,041,698 |
(a) |
| Transportadora de Gas Internacional SA ESP, Senior Notes |
|
|
5.550 |
% |
|
|
11/1/28 |
|
|
|
2,300,000 |
|
|
|
2,228,000 |
(b)(d) |
| Ultrapar International SA, Senior Notes |
|
|
5.250 |
% |
|
|
10/6/26 |
|
|
|
3,190,000 |
|
|
|
3,102,307 |
(b)(d) |
| YPF SA, Senior Notes |
|
|
8.500 |
% |
|
|
3/23/25 |
|
|
|
750,000 |
|
|
|
718,946 |
(a) |
| YPF SA, Senior Notes |
|
|
8.500 |
% |
|
|
7/28/25 |
|
|
|
5,430,000 |
|
|
|
4,999,625 |
(b)(d) |
| YPF SA, Senior Notes |
|
|
8.500 |
% |
|
|
7/28/25 |
|
|
|
500,000 |
|
|
|
460,371 |
(a)(d) |
| YPF SA, Senior Notes |
|
|
6.950 |
% |
|
|
7/21/27 |
|
|
|
1,320,000 |
|
|
|
1,084,915 |
(b)(d) |
| Total Energy |
|
|
|
|
|
|
|
|
|
|
|
|
|
|
107,328,437 |
|
| Financials — 6.1% |
|
|
|
|
|
|
|
|
|
|
|
|
|
|
|
|
| Banks — 3.8% |
|
|
|
|
|
|
|
|
|
|
|
|
|
|
|
|
| Banco de Credito del Peru, Subordinated Notes (3.250% to 9/30/26 then 5 year Treasury
Constant Maturity Rate + 2.450%) |
|
|
3.250 |
% |
|
|
9/30/31 |
|
|
|
1,000,000 |
|
|
|
881,359 |
(b)(d)(h) |
| Banco Mercantil del Norte SA, Junior Subordinated Notes (7.625% to 1/10/28 then 10 year
Treasury Constant Maturity Rate + 5.353%) |
|
|
7.625 |
% |
|
|
1/10/28 |
|
|
|
5,900,000 |
|
|
|
5,375,579 |
(b)(d)(h)(i) |
| Banco Nacional de Comercio Exterior SNC, Subordinated Notes (2.720% to 8/11/26 then 5 year
Treasury Constant Maturity Rate + 2.000%) |
|
|
2.720 |
% |
|
|
8/11/31 |
|
|
|
2,300,000 |
|
|
|
1,937,750 |
(a)(d)(h) |
| Banco Nacional de Panama, Senior Notes |
|
|
2.500 |
% |
|
|
8/11/30 |
|
|
|
4,000,000 |
|
|
|
3,151,305 |
(a)(d) |
See Notes to Financial Statements.
|
|
|
|
|
|
12 |
|
|
|
Western Asset Emerging Markets Debt Fund Inc. 2023 Semi-Annual Report |
Western Asset Emerging Markets Debt Fund Inc.
(Percentages shown based on Fund net assets)
|
|
|
|
|
|
|
|
|
|
|
|
|
|
|
|
|
| Security |
|
Rate |
|
|
Maturity
Date |
|
|
Face
Amount† |
|
|
Value |
|
| Banks — continued |
|
|
|
|
|
|
|
|
|
|
|
|
|
|
|
|
| Bank Leumi Le-Israel BM, Senior Notes |
|
|
5.125 |
% |
|
|
7/27/27 |
|
|
|
3,300,000 |
|
|
$ |
3,281,467 |
(a) |
| Bank of East Asia Ltd., Subordinated Notes (4.875% to 4/22/27 then 5 year Treasury
Constant Maturity Rate + 2.300%) |
|
|
4.875 |
% |
|
|
4/22/32 |
|
|
|
2,800,000 |
|
|
|
2,526,452 |
(a)(h) |
| BBVA Bancomer SA, Subordinated Notes (5.350% to 11/12/24 then 5 year Treasury Constant
Maturity Rate + 3.000%) |
|
|
5.350 |
% |
|
|
11/12/29 |
|
|
|
1,350,000 |
|
|
|
1,301,205 |
(b)(d)(h) |
| HSBC Holdings PLC, Junior Subordinated Notes (8.000% to 9/7/28 then 5 year Treasury
Constant Maturity Rate + 3.858%) |
|
|
8.000 |
% |
|
|
3/7/28 |
|
|
|
1,800,000 |
|
|
|
1,791,459 |
(d)(h)(i) |
| UniCredit SpA, Subordinated Notes (7.296% to 4/2/29 then USD 5 year ICE Swap Rate +
4.914%) |
|
|
7.296 |
% |
|
|
4/2/34 |
|
|
|
3,080,000 |
|
|
|
2,904,139 |
(b)(d)(h) |
| Total Banks |
|
|
|
|
|
|
|
|
|
|
|
|
|
|
23,150,715 |
|
| Capital Markets —
0.2% |
|
|
|
|
|
|
|
|
|
|
|
|
|
|
|
|
| Credit Suisse Group AG, Junior Subordinated Notes |
|
|
9.750 |
% |
|
|
6/23/27 |
|
|
|
2,000,000 |
|
|
|
84,660 |
*(a)(e)(i) |
| UBS Group AG, Junior Subordinated Notes (7.000% to 1/31/24 then USD 5 year ICE Swap Rate +
4.344%) |
|
|
7.000 |
% |
|
|
1/31/24 |
|
|
|
1,000,000 |
|
|
|
968,148 |
(b)(d)(h)(i) |
| Total Capital Markets |
|
|
|
|
|
|
|
|
|
|
|
|
|
|
1,052,808 |
|
| Financial Services —
1.5% |
|
|
|
|
|
|
|
|
|
|
|
|
|
|
|
|
| Huarong Finance 2019 Co. Ltd., Senior Notes |
|
|
2.125 |
% |
|
|
9/30/23 |
|
|
|
6,000,000 |
|
|
|
5,930,508 |
(a) |
| Indian Railway Finance Corp. Ltd., Senior Notes |
|
|
2.800 |
% |
|
|
2/10/31 |
|
|
|
1,800,000 |
|
|
|
1,488,146 |
(a)(d) |
| Park Aerospace Holdings Ltd., Senior Notes |
|
|
5.500 |
% |
|
|
2/15/24 |
|
|
|
1,980,000 |
|
|
|
1,957,956 |
(b)(d) |
| Total Financial Services |
|
|
|
|
|
|
|
|
|
|
|
|
|
|
9,376,610 |
|
| Insurance — 0.6% |
|
|
|
|
|
|
|
|
|
|
|
|
|
|
|
|
| Sagicor Financial Co. Ltd., Senior Notes |
|
|
5.300 |
% |
|
|
5/13/28 |
|
|
|
3,600,000 |
|
|
|
3,403,080 |
(b)(d) |
| Total Financials |
|
|
|
|
|
|
|
|
|
|
|
|
|
|
36,983,213 |
|
See Notes to Financial
Statements.
|
|
|
|
|
| Western Asset Emerging Markets Debt Fund Inc. 2023 Semi-Annual Report |
|
|
|
13 |
Schedule of investments
(unaudited) (cont’d)
June 30, 2023
Western Asset Emerging Markets Debt Fund Inc.
(Percentages shown based on Fund net assets)
|
|
|
|
|
|
|
|
|
|
|
|
|
|
|
|
|
| Security |
|
Rate |
|
|
Maturity
Date |
|
|
Face
Amount† |
|
|
Value |
|
| Health Care — 1.4% |
|
|
|
|
|
|
|
|
|
|
|
|
|
|
|
|
| Pharmaceuticals —
1.4% |
|
|
|
|
|
|
|
|
|
|
|
|
|
|
|
|
| Teva Pharmaceutical Finance Netherlands III BV, Senior Notes |
|
|
3.150 |
% |
|
|
10/1/26 |
|
|
|
8,000,000 |
|
|
$ |
7,178,446 |
|
| Teva Pharmaceutical Finance Netherlands III BV, Senior Notes |
|
|
8.125 |
% |
|
|
9/15/31 |
|
|
|
1,630,000 |
|
|
|
1,710,410 |
|
| Total Health Care |
|
|
|
|
|
|
|
|
|
|
|
|
|
|
8,888,856 |
|
| Industrials — 4.8% |
|
|
|
|
|
|
|
|
|
|
|
|
|
|
|
|
| Aerospace & Defense —
0.3% |
|
|
|
|
|
|
|
|
|
|
|
|
|
|
|
|
| Avolon Holdings Funding Ltd., Senior Notes |
|
|
2.125 |
% |
|
|
2/21/26 |
|
|
|
2,000,000 |
|
|
|
1,778,974 |
(b)(d) |
| Air Freight & Logistics —
0.7% |
|
|
|
|
|
|
|
|
|
|
|
|
|
|
|
|
| DP World Ltd., Senior Notes |
|
|
5.625 |
% |
|
|
9/25/48 |
|
|
|
3,400,000 |
|
|
|
3,183,097 |
(b)(d) |
| ENA Master Trust, Senior Secured Notes |
|
|
4.000 |
% |
|
|
5/19/48 |
|
|
|
1,850,000 |
|
|
|
1,390,978 |
(b)(d) |
| Total Air Freight &
Logistics |
|
|
|
|
|
|
|
|
|
|
|
|
|
|
4,574,075 |
|
| Construction & Engineering —
1.1% |
|
|
|
|
|
|
|
|
|
|
|
|
|
|
|
|
| ATP Tower Holdings LLC/Andean Tower Partners Colombia SAS/Andean Telecom Par, Senior
Secured Notes |
|
|
4.050 |
% |
|
|
4/27/26 |
|
|
|
7,650,000 |
|
|
|
6,586,145 |
(b)(d) |
| Ground Transportation —
1.5% |
|
|
|
|
|
|
|
|
|
|
|
|
|
|
|
|
| Empresa de los Ferrocarriles del Estado, Senior Notes |
|
|
3.830 |
% |
|
|
9/14/61 |
|
|
|
1,800,000 |
|
|
|
1,228,166 |
(b)(d) |
| Empresa de Transporte de Pasajeros Metro SA, Senior Notes |
|
|
5.000 |
% |
|
|
1/25/47 |
|
|
|
2,560,000 |
|
|
|
2,228,823 |
(b)(d) |
| Lima Metro Line 2 Finance Ltd., Senior Secured Notes |
|
|
4.350 |
% |
|
|
4/5/36 |
|
|
|
3,333,943 |
|
|
|
2,948,055 |
(b)(d) |
| Transnet SOC Ltd., Senior Notes |
|
|
8.250 |
% |
|
|
2/6/28 |
|
|
|
3,100,000 |
|
|
|
3,018,625 |
(b)(d) |
| Total Ground
Transportation |
|
|
|
|
|
|
|
|
|
|
|
|
|
|
9,423,669 |
|
| Industrial Conglomerates —
0.2% |
|
|
|
|
|
|
|
|
|
|
|
|
|
|
|
|
| Alfa SAB de CV, Senior Notes |
|
|
6.875 |
% |
|
|
3/25/44 |
|
|
|
1,000,000 |
|
|
|
1,005,052 |
(b)(d) |
| Passenger Airlines —
0.9% |
|
|
|
|
|
|
|
|
|
|
|
|
|
|
|
|
| Mileage Plus Holdings LLC/Mileage Plus Intellectual Property Assets Ltd., Senior Secured
Notes |
|
|
6.500 |
% |
|
|
6/20/27 |
|
|
|
1,600,000 |
|
|
|
1,605,435 |
(b)(d) |
| Singapore Airlines Ltd., Senior Notes |
|
|
3.375 |
% |
|
|
1/19/29 |
|
|
|
4,000,000 |
|
|
|
3,677,220 |
(a) |
| Total Passenger Airlines |
|
|
|
|
|
|
|
|
|
|
|
|
|
|
5,282,655 |
|
| Transportation Infrastructure —
0.1% |
|
|
|
|
|
|
|
|
|
|
|
|
|
|
|
|
| Adani Ports & Special Economic Zone Ltd., Senior Notes |
|
|
3.828 |
% |
|
|
2/2/32 |
|
|
|
700,000 |
|
|
|
507,166 |
(a)
|
| Total Industrials |
|
|
|
|
|
|
|
|
|
|
|
|
|
|
29,157,736 |
|
See Notes to Financial
Statements.
|
|
|
|
|
|
14 |
|
|
|
Western Asset Emerging Markets Debt Fund Inc. 2023 Semi-Annual Report |
Western Asset Emerging Markets Debt Fund Inc.
(Percentages shown based on Fund net assets)
|
|
|
|
|
|
|
|
|
|
|
|
|
|
|
|
|
| Security |
|
Rate |
|
|
Maturity
Date |
|
|
Face
Amount† |
|
|
Value |
|
| Materials — 12.5% |
|
|
|
|
|
|
|
|
|
|
|
|
|
|
|
|
| Chemicals — 4.9% |
|
|
|
|
|
|
|
|
|
|
|
|
|
|
|
|
| Braskem America Finance Co., Senior Notes |
|
|
7.125 |
% |
|
|
7/22/41 |
|
|
|
210,000 |
|
|
$ |
202,971 |
(a)(d) |
| Braskem Netherlands Finance BV, Senior Notes |
|
|
7.250 |
% |
|
|
2/13/33 |
|
|
|
4,680,000 |
|
|
|
4,602,217 |
(b)(d) |
| GC Treasury Center Co. Ltd., Senior Notes |
|
|
4.400 |
% |
|
|
3/30/32 |
|
|
|
1,193,000 |
|
|
|
1,078,719 |
(a) |
| GC Treasury Center Co. Ltd., Senior Notes |
|
|
4.300 |
% |
|
|
3/18/51 |
|
|
|
1,000,000 |
|
|
|
735,831 |
(b) |
| MEGlobal BV, Senior Notes |
|
|
2.625 |
% |
|
|
4/28/28 |
|
|
|
1,600,000 |
|
|
|
1,398,226 |
(b)(d) |
| MEGlobal Canada ULC, Senior Notes |
|
|
5.875 |
% |
|
|
5/18/30 |
|
|
|
4,100,000 |
|
|
|
4,151,516 |
(b)(d) |
| OCP SA, Senior Notes |
|
|
3.750 |
% |
|
|
6/23/31 |
|
|
|
7,000,000 |
|
|
|
5,806,710 |
(a) |
| Orbia Advance Corp. SAB de CV, Senior Notes |
|
|
5.875 |
% |
|
|
9/17/44 |
|
|
|
2,800,000 |
|
|
|
2,451,687 |
(a)(d) |
| Orbia Advance Corp. SAB de CV, Senior Notes |
|
|
5.875 |
% |
|
|
9/17/44 |
|
|
|
4,960,000 |
|
|
|
4,342,788 |
(b)(d) |
| Sasol Financing USA LLC, Senior Notes |
|
|
5.500 |
% |
|
|
3/18/31 |
|
|
|
5,900,000 |
|
|
|
4,651,423 |
(d) |
| Total Chemicals |
|
|
|
|
|
|
|
|
|
|
|
|
|
|
29,422,088 |
|
| Construction Materials —
1.0% |
|
|
|
|
|
|
|
|
|
|
|
|
|
|
|
|
| Cemex SAB de CV, Senior Notes |
|
|
5.450 |
% |
|
|
11/19/29 |
|
|
|
4,200,000 |
|
|
|
4,053,104 |
(a)(d) |
| Cemex SAB de CV, Senior Subordinated Notes (9.125% to 6/14/28 then 5 year Treasury
Constant Maturity Rate + 4.907%) |
|
|
9.125 |
% |
|
|
3/14/28 |
|
|
|
2,000,000 |
|
|
|
2,027,994 |
(b)(d)(h)(i) |
| Total Construction
Materials |
|
|
|
|
|
|
|
|
|
|
|
|
|
|
6,081,098 |
|
| Metals & Mining —
5.4% |
|
|
|
|
|
|
|
|
|
|
|
|
|
|
|
|
| Antofagasta PLC, Senior Notes |
|
|
5.625 |
% |
|
|
5/13/32 |
|
|
|
3,100,000 |
|
|
|
3,084,969 |
(b)(d) |
| First Quantum Minerals Ltd., Senior Notes |
|
|
6.875 |
% |
|
|
10/15/27 |
|
|
|
2,000,000 |
|
|
|
1,954,030 |
(b)(d) |
| Freeport Indonesia PT, Senior Notes |
|
|
4.763 |
% |
|
|
4/14/27 |
|
|
|
2,000,000 |
|
|
|
1,940,329 |
(b)(d) |
| Fresnillo PLC, Senior Notes |
|
|
4.250 |
% |
|
|
10/2/50 |
|
|
|
4,000,000 |
|
|
|
3,001,100 |
(b)(d) |
| Indonesia Asahan Aluminium Persero PT, Senior Notes |
|
|
5.710 |
% |
|
|
11/15/23 |
|
|
|
10,120,000 |
|
|
|
10,079,520 |
(b)(d) |
| POSCO, Senior Notes |
|
|
5.750 |
% |
|
|
1/17/28 |
|
|
|
5,000,000 |
|
|
|
5,074,428 |
(b)(d) |
| Southern Copper Corp., Senior Notes |
|
|
7.500 |
% |
|
|
7/27/35 |
|
|
|
310,000 |
|
|
|
360,291 |
(d) |
| Southern Copper Corp., Senior Notes |
|
|
6.750 |
% |
|
|
4/16/40 |
|
|
|
5,490,000 |
|
|
|
6,056,592 |
(d) |
| Volcan Cia Minera SAA, Senior Notes |
|
|
4.375 |
% |
|
|
2/11/26 |
|
|
|
2,000,000 |
|
|
|
1,489,674 |
(a)(d) |
| Total Metals &
Mining |
|
|
|
|
|
|
|
|
|
|
|
|
|
|
33,040,933 |
|
See Notes to Financial
Statements.
|
|
|
|
|
| Western Asset Emerging Markets Debt Fund Inc. 2023 Semi-Annual Report |
|
|
|
15 |
Schedule of investments
(unaudited) (cont’d)
June 30, 2023
Western Asset Emerging Markets Debt Fund Inc.
(Percentages shown based on Fund net assets)
|
|
|
|
|
|
|
|
|
|
|
|
|
|
|
|
|
| Security |
|
Rate |
|
|
Maturity
Date |
|
|
Face
Amount† |
|
|
Value |
|
| Paper & Forest Products —
1.2% |
|
|
|
|
|
|
|
|
|
|
|
|
|
|
|
|
| Suzano Austria GmbH, Senior Notes |
|
|
5.750 |
% |
|
|
7/14/26 |
|
|
|
3,450,000 |
|
|
$ |
3,452,587 |
(b)(d) |
| Suzano Austria GmbH, Senior Notes |
|
|
6.000 |
% |
|
|
1/15/29 |
|
|
|
3,940,000 |
|
|
|
3,918,527 |
(d)
|
| Total Paper & Forest
Products |
|
|
|
|
|
|
|
|
|
|
|
|
|
|
7,371,114 |
|
| Total Materials |
|
|
|
|
|
|
|
|
|
|
|
|
|
|
75,915,233 |
|
| Real Estate — 0.8% |
|
|
|
|
|
|
|
|
|
|
|
|
|
|
|
|
| Diversified REITs —
0.6% |
|
|
|
|
|
|
|
|
|
|
|
|
|
|
|
|
| Trust Fibra Uno, Senior Notes |
|
|
4.869 |
% |
|
|
1/15/30 |
|
|
|
4,200,000 |
|
|
|
3,714,736 |
(b)(d) |
| Real Estate
Management & Development — 0.2% |
|
|
|
|
|
|
|
|
|
|
|
|
|
| China Aoyuan Group Ltd., Senior Secured Notes |
|
|
— |
|
|
|
1/23/22 |
|
|
|
4,050,000 |
|
|
|
214,635 |
*(a)(g) |
| China Aoyuan Group Ltd., Senior Secured Notes |
|
|
— |
|
|
|
2/19/23 |
|
|
|
2,400,000 |
|
|
|
127,819 |
*(a)(g) |
| China Aoyuan Group Ltd., Senior Secured Notes |
|
|
6.350 |
% |
|
|
2/8/24 |
|
|
|
2,400,000 |
|
|
|
138,000 |
*(a)(e) |
| China Aoyuan Group Ltd., Senior Secured Notes |
|
|
7.950 |
% |
|
|
6/21/24 |
|
|
|
2,000,000 |
|
|
|
110,993 |
*(a)(e) |
| China Aoyuan Group Ltd., Senior Secured Notes |
|
|
5.880 |
% |
|
|
3/1/27 |
|
|
|
700,000 |
|
|
|
37,097 |
*(a)(e) |
| Times China Holdings Ltd., Senior Secured Notes |
|
|
6.750 |
% |
|
|
7/8/25 |
|
|
|
2,000,000 |
|
|
|
151,985 |
*(a)(e) |
| Yuzhou Group Holdings Co. Ltd., Senior Secured Notes |
|
|
— |
|
|
|
2/4/23 |
|
|
|
2,850,000 |
|
|
|
133,048 |
*(a)(g) |
| Yuzhou Group Holdings Co. Ltd., Senior Secured Notes |
|
|
8.375 |
% |
|
|
10/30/24 |
|
|
|
2,000,000 |
|
|
|
93,367 |
*(a)(e) |
| Yuzhou Group Holdings Co. Ltd., Senior Secured Notes |
|
|
7.375 |
% |
|
|
1/13/26 |
|
|
|
1,000,000 |
|
|
|
46,683 |
*(a)(e) |
| Total Real Estate
Management & Development |
|
|
|
|
|
|
|
|
|
|
|
1,053,627 |
|
| Total Real Estate |
|
|
|
|
|
|
|
|
|
|
|
|
|
|
4,768,363 |
|
| Utilities — 7.1% |
|
|
|
|
|
|
|
|
|
|
|
|
|
|
|
|
| Electric Utilities —
5.4% |
|
|
|
|
|
|
|
|
|
|
|
|
|
|
|
|
| Comision Federal de Electricidad, Senior Notes |
|
|
4.875 |
% |
|
|
1/15/24 |
|
|
|
1,800,000 |
|
|
|
1,788,093 |
(a)(d) |
| Comision Federal de Electricidad, Senior Notes |
|
|
4.677 |
% |
|
|
2/9/51 |
|
|
|
1,000,000 |
|
|
|
677,810 |
(a)(d) |
| Enel Chile SA, Senior Notes |
|
|
4.875 |
% |
|
|
6/12/28 |
|
|
|
5,150,000 |
|
|
|
4,955,261 |
(d) |
| Engie Energia Chile SA, Senior Notes |
|
|
4.500 |
% |
|
|
1/29/25 |
|
|
|
4,000,000 |
|
|
|
3,862,176 |
(a)(d) |
| Eskom Holdings SOC Ltd. |
|
|
4.314 |
% |
|
|
7/23/27 |
|
|
|
9,600,000 |
|
|
|
8,508,557 |
(a) |
| Instituto Costarricense de Electricidad, Senior Notes |
|
|
6.750 |
% |
|
|
10/7/31 |
|
|
|
3,100,000 |
|
|
|
3,061,250 |
(b)(d) |
See Notes to Financial
Statements.
|
|
|
|
|
|
16 |
|
|
|
Western Asset Emerging Markets Debt Fund Inc. 2023 Semi-Annual Report |
Western Asset Emerging Markets Debt Fund Inc.
(Percentages shown based on Fund net assets)
|
|
|
|
|
|
|
|
|
|
|
|
|
|
|
|
|
|
|
|
|
| Security |
|
|
|
|
Rate |
|
|
Maturity
Date |
|
|
Face
Amount† |
|
|
Value |
|
| Electric Utilities —
continued |
|
|
|
|
|
|
|
|
|
|
|
|
|
|
|
|
|
| Korea Electric Power Corp., Senior Notes |
|
|
|
5.375% |
|
|
|
4/6/26 |
|
|
|
800,000 |
|
|
$ |
797,623 |
(b)(d)
|
| Lamar Funding Ltd., Senior Notes |
|
|
|
3.958% |
|
|
|
5/7/25 |
|
|
|
4,000,000 |
|
|
|
3,838,400 |
(a) |
| Perusahaan Listrik Negara, Senior Notes |
|
|
|
5.250% |
|
|
|
5/15/47 |
|
|
|
5,810,000 |
|
|
|
5,105,807 |
(a)(d) |
| Total Electric
Utilities |
|
|
|
|
|
|
|
|
|
|
|
|
|
|
|
32,594,977 |
|
| Gas Utilities —
0.4% |
|
|
|
|
|
|
|
|
|
|
|
|
|
|
|
|
|
|
|
|
| Promigas SA ESP/Gases del Pacifico SAC, Senior Notes |
|
|
|
3.750% |
|
|
|
10/16/29 |
|
|
|
3,000,000 |
|
|
|
2,545,377 |
(a)
|
| Independent Power and Renewable
Electricity Producers — 0.5% |
|
|
|
|
|
|
|
|
|
| Enel Generacion Chile SA, Senior Notes |
|
|
|
4.250% |
|
|
|
4/15/24 |
|
|
|
500,000 |
|
|
|
490,150 |
(d) |
| Minejesa Capital BV, Senior Secured Notes |
|
|
|
5.625% |
|
|
|
8/10/37 |
|
|
|
3,100,000 |
|
|
|
2,437,025 |
(b)(d) |
| Total Independent Power and
Renewable Electricity Producers |
|
|
|
|
|
|
|
2,927,175 |
|
| Multi-Utilities —
0.8% |
|
|
|
|
|
|
|
|
|
|
|
|
|
|
|
|
|
|
|
|
| Abu Dhabi National Energy Co. PJSC, Senior Notes |
|
|
|
4.875% |
|
|
|
4/23/30 |
|
|
|
5,100,000 |
|
|
|
5,150,669 |
(b)(d)
|
| Total Utilities |
|
|
|
|
|
|
|
|
|
|
|
|
|
|
|
|
|
|
43,218,198 |
|
| Total Corporate Bonds & Notes (Cost —
$377,808,948) |
|
|
|
|
|
|
|
339,484,224 |
|
|
|
|
|
|
|
| |
|
Counterparty |
|
|
Expiration
Date |
|
|
Contracts |
|
|
Notional
Amount† |
|
|
|
|
| Purchased Options — 0.1% |
|
|
|
|
|
|
|
|
|
|
|
|
|
|
|
|
|
| OTC Purchased Options — 0.1% |
|
|
|
|
|
|
|
|
|
|
|
|
|
|
|
|
|
| U.S. Dollar/Brazilian Real, Put @
5.000BRL |
|
|
BNP Paribas
SA |
|
|
|
11/9/23 |
|
|
|
6,000,000 |
|
|
|
6,000,000 |
|
|
|
267,514 |
|
| U.S. Dollar/Chilean Peso, Put @
800.000CLP |
|
|
JPMorgan
Chase & Co. |
|
|
|
8/4/23 |
|
|
|
9,050,000 |
|
|
|
9,050,000 |
|
|
|
119,963 |
|
| U.S. Dollar/Mexican Peso, Put @
16.900MXN |
|
|
Goldman Sachs
Group Inc. |
|
|
|
9/26/23 |
|
|
|
9,180,000 |
|
|
|
9,180,000 |
|
|
|
64,547 |
|
| U.S. Dollar/Mexican Peso, Put @
18.000MXN |
|
|
Citibank N.A. |
|
|
|
11/8/23 |
|
|
|
9,000,000 |
|
|
|
9,000,000 |
|
|
|
372,348 |
|
| Total Purchased Options (Cost —
$666,307) |
|
|
|
|
|
|
|
|
|
|
|
824,372 |
|
| Total Investments before Short-Term Investments
(Cost — $943,439,566) |
|
|
|
845,281,312 |
|
See Notes to Financial
Statements.
|
|
|
|
|
| Western Asset Emerging Markets Debt Fund Inc. 2023 Semi-Annual Report |
|
|
|
17 |
Schedule of investments
(unaudited) (cont’d)
June 30, 2023
Western Asset Emerging Markets Debt Fund Inc.
(Percentages shown based on Fund net assets)
|
|
|
|
|
|
|
|
|
|
|
|
|
|
|
|
|
|
|
| Security |
|
|
|
Rate |
|
|
|
|
|
Shares |
|
|
Value |
|
| Short-Term Investments — 0.9% |
|
|
|
|
|
|
|
|
|
|
|
|
|
|
|
|
|
|
| Western Asset Premier Institutional Government Reserves, Premium
Shares
(Cost — $5,207,760) |
|
|
5.044 |
% |
|
|
|
|
|
|
5,207,760 |
|
|
$ |
5,207,760 |
(j)(k)
|
| Total Investments — 139.6% (Cost —
$948,647,326) |
|
|
|
|
|
|
|
|
|
|
|
|
|
|
|
|
850,489,072 |
|
| Liabilities in Excess of Other Assets — (39.6)% |
|
|
|
|
|
|
|
|
|
|
|
|
|
|
|
|
(241,177,809 |
) |
| Total Net Assets — 100.0% |
|
|
|
|
|
|
|
|
|
|
|
|
|
|
|
$ |
609,311,263 |
|
| † |
Face amount/notional amount denominated in U.S. dollars, unless otherwise noted. |
| * |
Non-income producing security. |
| (a) |
Security is exempt from registration under Regulation S of the Securities Act of 1933. Regulation S applies to securities
offerings that are made outside of the United States and do not involve direct selling efforts in the United States. This security has been deemed liquid pursuant to guidelines approved by the Board of Directors. |
| (b) |
Security is exempt from registration under Rule 144A of the Securities Act of 1933. This security may be resold in
transactions that are exempt from registration, normally to qualified institutional buyers. This security has been deemed liquid pursuant to guidelines approved by the Board of Directors. |
| (c) |
Security is valued in good faith in accordance with procedures approved by the Board of Directors (Note 1).
|
| (d) |
All or a portion of this security is pledged as collateral pursuant to the loan agreement (Note 5). |
| (e) |
The coupon payment on this security is currently in default as of June 30, 2023. |
| (f) |
Security is valued using significant unobservable inputs (Note 1). |
| (g) |
The maturity principal is currently in default as of June 30, 2023. |
| (h) |
Variable rate security. Interest rate disclosed is as of the most recent information available. Certain variable rate
securities are not based on a published reference rate and spread but are determined by the issuer or agent and are based on current market conditions. These securities do not indicate a reference rate and spread in their description above.
|
| (i) |
Security has no maturity date. The date shown represents the next call date. |
| (j) |
Rate shown is one-day yield as of the end of the reporting period.
|
| (k) |
In this instance, as defined in the Investment Company Act of 1940, an “Affiliated Company” represents Fund
ownership of at least 5% of the outstanding voting securities of an issuer, or a company which is under common ownership or control with the Fund. At June 30, 2023, the total market value of investments in Affiliated Companies was $5,207,760
and the cost was $5,207,760 (Note 8). |
See Notes to Financial Statements.
|
|
|
|
|
|
18 |
|
|
|
Western Asset Emerging Markets Debt Fund Inc. 2023 Semi-Annual Report |
Western Asset Emerging Markets Debt Fund Inc.
|
|
|
| Abbreviation(s) used in this
schedule: |
|
|
| ARS |
|
— Argentine Peso |
|
|
| BRL |
|
— Brazilian Real |
|
|
| CLP |
|
— Chilean Peso |
|
|
| COP |
|
— Colombian Peso |
|
|
| DOP |
|
— Dominican Peso |
|
|
| EGP |
|
— Egyptian Pound |
|
|
| EUR |
|
— Euro |
|
|
| HUF |
|
— Hungarian Forint |
|
|
| ICE |
|
— Intercontinental Exchange |
|
|
| IDR |
|
— Indonesian Rupiah |
|
|
| INR |
|
— Indian Rupee |
|
|
| JSC |
|
— Joint Stock Company |
|
|
| MXN |
|
— Mexican Peso |
|
|
| OFZ |
|
— Obligatsyi Federal’novo Zaima (Russian Federal Loan Obligation) |
|
|
| PJSC |
|
— Private Joint Stock Company |
|
|
| RUB |
|
— Russian Ruble |
|
|
| USD |
|
— United States Dollar |
|
|
| UYU |
|
— Uruguayan Peso |
|
|
| UZS |
|
— Uzbekistani Som |
|
|
| ZAR |
|
— South African Rand |
At June 30, 2023, the Fund had the following written options contracts:
|
|
|
|
|
|
|
|
|
|
|
|
|
|
|
|
|
|
|
|
|
|
|
| OTC Written Options |
|
| Security |
|
Counterparty |
|
Expiration
Date |
|
|
Strike
Price |
|
|
Contracts |
|
|
Notional
Amount† |
|
|
Value |
|
| U.S. Dollar/Brazilian Real, Call |
|
BNP Paribas SA |
|
|
11/9/23 |
|
|
|
5.600 |
BRL |
|
|
6,000,000 |
|
|
|
6,000,000 |
|
|
$ |
(31,383) |
|
| U.S. Dollar/Brazilian Real, Put |
|
BNP Paribas SA |
|
|
11/9/23 |
|
|
|
4.800 |
BRL |
|
|
6,000,000 |
|
|
|
6,000,000 |
|
|
|
(130,711) |
|
| U.S. Dollar/Chilean Peso, Call |
|
JPMorgan
Chase & Co. |
|
|
8/4/23 |
|
|
|
855.000 |
CLP |
|
|
9,050,000 |
|
|
|
9,050,000 |
|
|
|
(28,892) |
|
| U.S. Dollar/Chilean Peso, Put |
|
JPMorgan
Chase & Co. |
|
|
8/4/23 |
|
|
|
778.000 |
CLP |
|
|
9,050,000 |
|
|
|
9,050,000 |
|
|
|
(36,809) |
|
| U.S. Dollar/Mexican Peso, Call |
|
Goldman Sachs
Group Inc. |
|
|
9/26/23 |
|
|
|
18.400 |
MXN |
|
|
9,180,000 |
|
|
|
9,180,000 |
|
|
|
(57,958) |
|
See Notes to Financial
Statements.
|
|
|
|
|
| Western Asset Emerging Markets Debt Fund Inc. 2023 Semi-Annual Report |
|
|
|
19 |
Schedule of investments
(unaudited) (cont’d)
June 30, 2023
Western Asset Emerging Markets Debt Fund Inc.
|
|
|
|
|
|
|
|
|
|
|
|
|
|
|
|
|
|
|
|
|
|
|
| Security |
|
Counterparty |
|
|
Expiration
Date |
|
|
Strike
Price |
|
Contracts |
|
|
Notional
Amount† |
|
|
Value |
|
| U.S. Dollar/Mexican Peso, Call |
|
|
Citibank N.A. |
|
|
|
11/8/23 |
|
|
19.500 MXN |
|
|
9,000,000 |
|
|
|
9,000,000 |
|
|
$ |
(46,494) |
|
| U.S. Dollar/Mexican Peso, Put |
|
|
Citibank N.A. |
|
|
|
11/8/23 |
|
|
16.945 MXN |
|
|
9,000,000 |
|
|
|
9,000,000 |
|
|
|
(87,347) |
|
| Total OTC Written Options (Premiums received — $675,300) |
|
|
|
|
|
|
|
|
|
$ |
(419,594) |
|
| † |
Notional amount denominated in U.S. dollars, unless otherwise noted. |
|
|
|
| Abbreviation(s) used in this
schedule: |
|
|
| BRL |
|
— Brazilian Real |
|
|
| CLP |
|
— Chilean Peso |
|
|
| MXN |
|
— Mexican Peso |
At June 30, 2023, the Fund had the following open futures contracts:
|
|
|
|
|
|
|
|
|
|
|
|
|
|
|
|
|
|
|
|
|
| |
|
Number of
Contracts |
|
|
Expiration
Date |
|
|
Notional
Amount |
|
|
Market
Value |
|
|
Unrealized
Appreciation
(Depreciation) |
|
| Contracts to Sell: |
|
|
|
|
|
|
|
|
|
|
|
|
|
|
|
|
|
|
|
|
| U.S. Treasury 10-Year Notes |
|
|
404 |
|
|
|
9/23 |
|
|
$ |
46,306,893 |
|
|
$ |
45,355,314 |
|
|
$ |
951,579 |
|
| U.S. Treasury Long-Term Bonds |
|
|
115 |
|
|
|
9/23 |
|
|
|
14,568,231 |
|
|
|
14,594,219 |
|
|
|
(25,988) |
|
| Net unrealized appreciation on open futures contracts |
|
|
|
|
|
|
$ |
925,591 |
|
At June 30, 2023, the Fund had the following open forward foreign currency contracts:
|
|
|
|
|
|
|
|
|
|
|
|
|
|
|
|
|
|
|
|
|
| Currency
Purchased |
|
|
Currency
Sold |
|
|
Counterparty |
|
Settlement
Date |
|
|
Unrealized
Appreciation (Depreciation) |
|
| USD |
|
|
3,485,030 |
|
|
ZAR |
|
|
64,020,000 |
|
|
Bank of America N.A. |
|
|
7/14/23 |
|
|
$ |
88,397 |
|
| ZAR |
|
|
64,020,000 |
|
|
USD |
|
|
3,423,072 |
|
|
Bank of America N.A. |
|
|
7/14/23 |
|
|
|
(26,439) |
|
| BRL |
|
|
10,214,000 |
|
|
USD |
|
|
2,132,359 |
|
|
Citibank N.A. |
|
|
7/14/23 |
|
|
|
(4,784) |
|
| USD |
|
|
1,988,707 |
|
|
BRL |
|
|
10,214,000 |
|
|
Citibank N.A. |
|
|
7/14/23 |
|
|
|
(138,868) |
|
| USD |
|
|
446,818 |
|
|
MXN |
|
|
8,200,000 |
|
|
Citibank N.A. |
|
|
7/14/23 |
|
|
|
(30,899) |
|
| USD |
|
|
11,738,496 |
|
|
MXN |
|
|
219,306,799 |
|
|
Citibank N.A. |
|
|
7/14/23 |
|
|
|
(1,037,913) |
|
| SGD |
|
|
8,144,433 |
|
|
USD |
|
|
6,051,741 |
|
|
Deutsche Bank AG |
|
|
7/14/23 |
|
|
|
(26,405) |
|
| USD |
|
|
6,138,866 |
|
|
SGD |
|
|
8,144,433 |
|
|
Deutsche Bank AG |
|
|
7/14/23 |
|
|
|
113,530 |
|
| COP |
|
|
6,822,169,000 |
|
|
USD |
|
|
1,440,796 |
|
|
JPMorgan Chase & Co. |
|
|
7/14/23 |
|
|
|
186,884 |
|
| IDR |
|
|
257,827,088,494 |
|
|
USD |
|
|
17,236,735 |
|
|
JPMorgan Chase & Co. |
|
|
7/14/23 |
|
|
|
(41,903) |
|
| MXN |
|
|
227,506,799 |
|
|
USD |
|
|
13,298,288 |
|
|
JPMorgan Chase & Co. |
|
|
7/14/23 |
|
|
|
(44,161) |
|
| USD |
|
|
3,089,298 |
|
|
COP |
|
|
14,090,289,000 |
|
|
JPMorgan Chase & Co. |
|
|
7/14/23 |
|
|
|
(272,460) |
|
See Notes to Financial Statements.
|
|
|
|
|
|
20 |
|
|
|
Western Asset Emerging Markets Debt Fund Inc. 2023 Semi-Annual Report |
Western Asset Emerging Markets Debt Fund Inc.
|
|
|
|
|
|
|
|
|
|
|
|
|
|
|
|
|
|
|
|
|
| Currency
Purchased |
|
|
Currency
Sold |
|
|
Counterparty |
|
Settlement
Date |
|
|
Unrealized
Appreciation (Depreciation) |
|
| USD |
|
|
17,205,678 |
|
|
IDR |
|
|
257,827,088,494 |
|
|
JPMorgan Chase & Co. |
|
|
7/14/23 |
|
|
$ |
10,846 |
|
| USD |
|
|
3,432,759 |
|
|
CLP |
|
|
2,776,071,900 |
|
|
JPMorgan Chase & Co. |
|
|
8/8/23 |
|
|
|
(11,157) |
|
| USD |
|
|
1,604,211 |
|
|
CLP |
|
|
1,291,710,404 |
|
|
Bank of America N.A. |
|
|
9/15/23 |
|
|
|
8,029 |
|
| USD |
|
|
399,096 |
|
|
HUF |
|
|
140,641,378 |
|
|
Bank of America N.A. |
|
|
9/15/23 |
|
|
|
(5,174) |
|
| USD |
|
|
5,849,160 |
|
|
CNY |
|
|
41,458,850 |
|
|
JPMorgan Chase & Co. |
|
|
9/15/23 |
|
|
|
91,946 |
|
| USD |
|
|
8,200,100 |
|
|
EUR |
|
|
7,574,230 |
|
|
JPMorgan Chase & Co. |
|
|
9/15/23 |
|
|
|
(96,503) |
|
| USD |
|
|
3,391,770 |
|
|
ZAR |
|
|
64,020,000 |
|
|
Bank of America N.A. |
|
|
10/13/23 |
|
|
|
25,938 |
|
| USD |
|
|
2,099,745 |
|
|
BRL |
|
|
10,214,000 |
|
|
Citibank N.A. |
|
|
10/13/23 |
|
|
|
4,547 |
|
| USD |
|
|
6,073,403 |
|
|
SGD |
|
|
8,144,433 |
|
|
Deutsche Bank AG |
|
|
10/13/23 |
|
|
|
26,467 |
|
| USD |
|
|
17,202,234 |
|
|
IDR |
|
|
257,827,088,494 |
|
|
JPMorgan Chase & Co. |
|
|
10/13/23 |
|
|
|
18,494 |
|
| USD |
|
|
13,067,961 |
|
|
MXN |
|
|
227,506,800 |
|
|
JPMorgan Chase & Co. |
|
|
10/13/23 |
|
|
|
35,559 |
|
| USD |
|
|
2,232,550 |
|
|
BRL |
|
|
11,437,800 |
|
|
BNP Paribas SA |
|
|
11/13/23 |
|
|
|
(104,816) |
|
| Net unrealized depreciation on open forward foreign currency contracts |
|
|
|
|
|
$ |
(1,230,845) |
|
|
|
|
| Abbreviation(s) used in this
table: |
|
|
| BRL |
|
— Brazilian Real |
|
|
| CLP |
|
— Chilean Peso |
|
|
| CNY |
|
— Chinese Yuan Renminbi |
|
|
| COP |
|
— Colombian Peso |
|
|
| EUR |
|
— Euro |
|
|
| HUF |
|
— Hungarian Forint |
|
|
| IDR |
|
— Indonesian Rupiah |
|
|
| MXN |
|
— Mexican Peso |
|
|
| SGD |
|
— Singapore Dollar |
|
|
| USD |
|
— United States Dollar |
|
|
| ZAR |
|
— South African Rand |
|
|
|
|
|
| Summary of Investments by Country** |
|
|
|
| Mexico |
|
|
8.6 |
% |
| Indonesia |
|
|
7.0 |
|
| Brazil |
|
|
5.2 |
|
| Peru |
|
|
4.6 |
|
| Argentina |
|
|
4.2 |
|
| Oman |
|
|
3.9 |
|
| Colombia |
|
|
3.7 |
|
| Kazakhstan |
|
|
3.3 |
|
| Dominican Republic |
|
|
3.1 |
|
| Supranational |
|
|
3.0 |
|
| Chile |
|
|
2.9 |
|
| South Africa |
|
|
2.9 |
|
See Notes to Financial
Statements.
|
|
|
|
|
| Western Asset Emerging Markets Debt Fund Inc. 2023 Semi-Annual Report |
|
|
|
21 |
Schedule of investments
(unaudited) (cont’d)
June 30, 2023
Western Asset Emerging Markets Debt Fund Inc.
|
|
|
|
|
| Summary of Investments by Country** (cont’d) |
|
|
|
| Qatar |
|
|
2.8 |
% |
| Bahrain |
|
|
2.8 |
|
| Uruguay |
|
|
2.0 |
|
| Panama |
|
|
1.8 |
|
| Jordan |
|
|
1.8 |
|
| Nigeria |
|
|
1.8 |
|
| Turkey |
|
|
1.7 |
|
| Guatemala |
|
|
1.7 |
|
| Egypt |
|
|
1.6 |
|
| South Korea |
|
|
1.6 |
|
| United Arab Emirates |
|
|
1.5 |
|
| Israel |
|
|
1.4 |
|
| Angola |
|
|
1.4 |
|
| Ivory Coast |
|
|
1.3 |
|
| China |
|
|
1.1 |
|
| Kenya |
|
|
1.1 |
|
| Bahamas |
|
|
1.1 |
|
| Malaysia |
|
|
1.1 |
|
| Costa Rica |
|
|
1.1 |
|
| Senegal |
|
|
1.0 |
|
| Ghana |
|
|
0.9 |
|
| Paraguay |
|
|
0.9 |
|
| Hungary |
|
|
0.9 |
|
| Vietnam |
|
|
0.8 |
|
| Hong Kong |
|
|
0.8 |
|
| Ukraine |
|
|
0.7 |
|
| Jamaica |
|
|
0.7 |
|
| Gabon |
|
|
0.7 |
|
| Morocco |
|
|
0.7 |
|
| Kuwait |
|
|
0.7 |
|
| Armenia |
|
|
0.6 |
|
| Ecuador |
|
|
0.6 |
|
| United States |
|
|
0.6 |
|
| Uzbekistan |
|
|
0.6 |
|
| Macau |
|
|
0.5 |
|
| Zambia |
|
|
0.5 |
|
| Ireland |
|
|
0.4 |
|
| Singapore |
|
|
0.4 |
|
| Venezuela |
|
|
0.4 |
|
| Rwanda |
|
|
0.4 |
|
| Poland |
|
|
0.4 |
|
See Notes to Financial
Statements.
|
|
|
|
|
|
22 |
|
|
|
Western Asset Emerging Markets Debt Fund Inc. 2023 Semi-Annual Report |
Western Asset Emerging Markets Debt Fund Inc.
|
|
|
|
|
| Summary of Investments by Country** (cont’d) |
|
|
|
| Italy |
|
|
0.3 |
% |
| Tunisia |
|
|
0.3 |
|
| Ethiopia |
|
|
0.3 |
|
| India |
|
|
0.2 |
|
| Thailand |
|
|
0.2 |
|
| United Kingdom |
|
|
0.2 |
|
| Romania |
|
|
0.2 |
|
| Russia |
|
|
0.2 |
|
| Switzerland |
|
|
0.1 |
|
| Purchased Options |
|
|
0.1 |
|
| Short-Term Investments |
|
|
0.6 |
|
| |
|
|
100.0 |
% |
| ** |
As a percentage of total investments. Please note that the Fund holdings are as of June 30, 2023 and are subject to
change. |
See Notes to Financial
Statements.
|
|
|
|
|
| Western Asset Emerging Markets Debt Fund Inc. 2023 Semi-Annual Report |
|
|
|
23 |
Statement of assets and liabilities (unaudited)
June 30, 2023
|
|
|
|
|
|
|
| Assets: |
|
|
|
|
| Investments in unaffiliated securities, at value (Cost — $943,439,566) |
|
$ |
845,281,312 |
|
| Investments in affiliated securities, at value (Cost — $5,207,760) |
|
|
5,207,760 |
|
| Foreign currency, at value (Cost — $1,034,412) |
|
|
703,934 |
|
| Interest receivable |
|
|
14,855,479 |
|
| Receivable for securities sold |
|
|
8,828,444 |
|
| Deposits with brokers for open futures contracts |
|
|
1,494,681 |
|
| Unrealized appreciation on forward foreign currency contracts |
|
|
610,637 |
|
| Dividends receivable from affiliated investments |
|
|
13,490 |
|
| Prepaid expenses |
|
|
851 |
|
| Total Assets |
|
|
876,996,588 |
|
|
|
| Liabilities: |
|
|
|
|
| Loan payable (Note 5) |
|
|
250,000,000 |
|
| Payable for securities purchased |
|
|
8,819,544 |
|
| Distributions payable |
|
|
4,217,221 |
|
| Unrealized depreciation on forward foreign currency contracts |
|
|
1,841,482 |
|
| Interest expense payable |
|
|
1,200,286 |
|
| Investment management fee payable |
|
|
595,775 |
|
| Written options, at value (premiums received — $675,300) |
|
|
419,594 |
|
| Payable to brokers — net variation margin on open futures contracts |
|
|
143,065 |
|
| Deposits from brokers for OTC derivatives |
|
|
120,000 |
|
| Accrued foreign capital gains tax |
|
|
41,847 |
|
| Directors’ fees payable |
|
|
33,302 |
|
| Accrued expenses |
|
|
253,209 |
|
| Total Liabilities |
|
|
267,685,325 |
|
| Total Net Assets |
|
$ |
609,311,263 |
|
|
|
| Net Assets: |
|
|
|
|
| Par value ($0.001 par value; 60,246,012 shares issued and outstanding; 100,000,000 shares
authorized) |
|
$ |
60,246 |
|
| Paid-in capital in excess of par value |
|
|
1,016,516,506 |
|
| Total distributable earnings (loss) |
|
|
(407,265,489) |
|
| Total Net Assets |
|
$ |
609,311,263 |
|
|
|
| Shares Outstanding |
|
|
60,246,012 |
|
|
|
| Net Asset Value |
|
|
$10.11 |
|
See Notes to Financial
Statements.
|
|
|
|
|
|
24 |
|
|
|
Western Asset Emerging Markets Debt Fund Inc. 2023 Semi-Annual Report |
Statement of operations (unaudited)
For the Six Months Ended June 30, 2023
|
|
|
|
|
|
|
| Investment Income: |
|
|
|
|
| Interest |
|
$ |
32,324,452 |
|
| Dividends from affiliated investments |
|
|
112,716 |
|
| Less: Foreign taxes withheld |
|
|
(147,486) |
|
| Total Investment
Income |
|
|
32,289,682 |
|
|
|
| Expenses: |
|
|
|
|
| Interest expense (Note 5) |
|
|
6,714,067 |
|
| Investment management fee (Note 2) |
|
|
3,605,784 |
|
| Legal fees |
|
|
155,787 |
|
| Transfer agent fees |
|
|
139,586 |
|
| Directors’ fees |
|
|
93,084 |
|
| Fund accounting fees |
|
|
37,305 |
|
| Commitment fees (Note 5) |
|
|
36,875 |
|
| Audit and tax fees |
|
|
33,541 |
|
| Stock exchange listing fees |
|
|
15,438 |
|
| Shareholder reports |
|
|
12,288 |
|
| Custody fees |
|
|
11,605 |
|
| Insurance |
|
|
2,796 |
|
| Miscellaneous expenses |
|
|
9,144 |
|
| Total Expenses |
|
|
10,867,300 |
|
| Less: Fee waivers and/or expense reimbursements (Note 2) |
|
|
(2,180) |
|
| Net Expenses |
|
|
10,865,120 |
|
| Net Investment Income |
|
|
21,424,562 |
|
|
|
| Realized and Unrealized Gain (Loss) on Investments, Futures Contracts, Written Options, Forward Foreign Currency Contracts and Foreign Currency Transactions (Notes 1,
3 and 4): |
|
|
|
|
| Net Realized Gain (Loss) From: |
|
|
|
|
| Investment transactions in unaffiliated securities |
|
|
(27,075,830) |
|
| Futures contracts |
|
|
(573,869) |
|
| Written options |
|
|
446,084 |
|
| Forward foreign currency contracts |
|
|
(493,144) |
|
| Foreign currency transactions |
|
|
48,443 |
|
| Net Realized Loss |
|
|
(27,648,316) |
|
| Change in Net Unrealized Appreciation (Depreciation) From: |
|
|
|
|
| Investments in unaffiliated securities |
|
|
26,316,321 |
† |
| Futures contracts |
|
|
169,470 |
|
| Written options |
|
|
190,613 |
|
| Forward foreign currency contracts |
|
|
(1,379,263) |
|
| Foreign currencies |
|
|
(61,428) |
|
| Change in Net Unrealized Appreciation
(Depreciation) |
|
|
25,235,713 |
|
| Net Loss on Investments, Futures Contracts, Written Options, Forward Foreign Currency Contracts and Foreign Currency Transactions |
|
|
(2,412,603) |
|
| Increase in Net Assets From Operations |
|
$ |
19,011,959 |
|
| † |
Net of change in accrued foreign capital gains tax of $23,860. |
See Notes to Financial Statements.
|
|
|
|
|
| Western Asset Emerging Markets Debt Fund Inc. 2023 Semi-Annual Report |
|
|
|
25 |
Statements of changes in net assets
|
|
|
|
|
|
|
|
|
For the Six Months Ended June 30, 2023 (unaudited)
and the Year Ended December 31, 2022 |
|
2023 |
|
|
2022 |
|
|
|
|
| Operations: |
|
|
|
|
|
|
|
|
| Net investment income |
|
$ |
21,424,562 |
|
|
$ |
45,477,649 |
|
| Net realized loss |
|
|
(27,648,316) |
|
|
|
(66,261,223) |
|
| Change in net unrealized appreciation (depreciation) |
|
|
25,235,713 |
|
|
|
(128,825,392) |
|
| Increase (Decrease) in Net Assets From
Operations |
|
|
19,011,959 |
|
|
|
(149,608,966) |
|
|
|
|
| Distributions to Shareholders From (Note 1): |
|
|
|
|
|
|
|
|
| Total distributable earnings |
|
|
(26,508,245) |
|
|
|
(43,737,196) |
|
| Return of capital |
|
|
— |
|
|
|
(17,206,640) |
|
| Decrease in Net Assets From Distributions
to Shareholders |
|
|
(26,508,245) |
|
|
|
(60,943,836) |
|
|
|
|
| Fund Share Transactions: |
|
|
|
|
|
|
|
|
| Cost of shares repurchased (0 and 500,000 shares repurchased, respectively) (Note
7) |
|
|
— |
|
|
|
(5,175,727) |
|
| Decrease in Net Assets From Fund Share
Transactions |
|
|
— |
|
|
|
(5,175,727) |
|
| Decrease in Net
Assets |
|
|
(7,496,286) |
|
|
|
(215,728,529) |
|
|
|
|
| Net Assets: |
|
|
|
|
|
|
|
|
| Beginning of period |
|
|
616,807,549 |
|
|
|
832,536,078 |
|
| End of period |
|
$ |
609,311,263 |
|
|
$ |
616,807,549 |
|
See Notes to Financial
Statements.
|
|
|
|
|
|
26 |
|
|
|
Western Asset Emerging Markets Debt Fund Inc. 2023 Semi-Annual Report |
Statement of cash flows (unaudited)
For the Six Months Ended June 30, 2023
|
|
|
|
|
|
|
| Increase (Decrease) in Cash: |
|
|
|
|
| Cash Flows from Operating Activities: |
|
|
|
|
| Net increase in net assets resulting from operations |
|
$ |
19,011,959 |
|
| Adjustments to reconcile net increase in net assets resulting from operations
to net
cash provided (used) by operating activities: |
|
|
|
|
| Purchases of portfolio securities |
|
|
(349,157,661) |
|
| Sales of portfolio securities |
|
|
344,344,770 |
|
| Net purchases, sales and maturities of short-term investments |
|
|
(5,276,459) |
|
| Net amortization of premium (accretion of discount) |
|
|
(5,067,760) |
|
| Increase in receivable for securities sold |
|
|
(8,828,444) |
|
| Increase in interest receivable |
|
|
(346,999) |
|
| Decrease in prepaid expenses |
|
|
2,795 |
|
| Decrease in dividends receivable from affiliated investments |
|
|
7,271 |
|
| Decrease in receivable from brokers — net variation margin on open futures
contracts |
|
|
101,498 |
|
| Decrease in deposits from brokers for OTC derivatives |
|
|
(20,000) |
|
| Increase in payable for securities purchased |
|
|
6,347,132 |
|
| Decrease in investment management fee payable |
|
|
(22,234) |
|
| Decrease in Directors’ fees payable |
|
|
(3,325) |
|
| Increase in interest expense payable |
|
|
231,057 |
|
| Increase in accrued expenses |
|
|
76,060 |
|
| Increase in premiums received from written options |
|
|
508,007 |
|
| Increase in payable to brokers — net variation margin on open futures
contracts |
|
|
143,065 |
|
| Net realized loss on investments |
|
|
27,075,830 |
|
| Change in net unrealized appreciation (depreciation) of investments, written options and
forward foreign currency contracts |
|
|
(25,127,671) |
|
| Net Cash Provided in Operating
Activities* |
|
|
3,998,891 |
|
|
|
| Cash Flows from Financing Activities: |
|
|
|
|
| Distributions paid on common stock (net of distributions payable) |
|
|
(22,291,024) |
|
| Proceeds from loan facility borrowings |
|
|
15,000,000 |
|
| Net Cash Used by Financing
Activities |
|
|
(7,291,024) |
|
| Net Decrease in Cash and Restricted Cash |
|
|
(3,292,133) |
|
| Cash and restricted cash at beginning of period |
|
|
5,490,748 |
|
| Cash and restricted cash at end of period |
|
$ |
2,198,615 |
|
| * |
Included in operating expenses is $6,564,885 paid for interest and commitment fees on borrowings. |
| |
The following table provides a reconciliation of cash (including foreign currency) and restricted cash reported within the
Statement of Assets and Liabilities that sums to the total of such amounts shown on the Statement of Cash Flows. |
|
|
|
|
|
| |
|
June 30, 2023 |
|
| Cash |
|
$ |
703,934 |
|
| Restricted cash |
|
|
1,494,681 |
|
| Total cash and restricted cash shown in the Statement of Cash Flows |
|
$ |
2,198,615 |
|
| |
Restricted cash consists of cash that has been segregated to cover the Fund’s collateral or margin obligations under
derivative contracts. It is separately reported on the Statement of Assets and Liabilities as Deposits with brokers. |
See Notes to Financial Statements.
|
|
|
|
|
| Western Asset Emerging Markets Debt Fund Inc. 2023 Semi-Annual Report |
|
|
|
27 |
Financial highlights
|
|
|
|
|
|
|
|
|
|
|
|
|
|
|
|
|
|
|
|
|
|
|
|
|
For a share of capital stock outstanding throughout each year ended December 31,
unless otherwise noted: |
|
| |
|
20231,2 |
|
|
20221 |
|
|
20211 |
|
|
20201 |
|
|
20191 |
|
|
20181 |
|
|
|
|
|
|
|
|
| Net asset value, beginning of period |
|
|
$10.24 |
|
|
|
$13.71 |
|
|
|
$15.38 |
|
|
|
$15.78 |
|
|
|
$14.71 |
|
|
|
$17.59 |
|
|
|
|
|
|
|
|
| Income (loss) from operations: |
|
|
|
|
|
|
|
|
|
|
|
|
|
|
|
|
|
|
|
|
|
|
|
|
| Net investment income |
|
|
0.36 |
|
|
|
0.75 |
|
|
|
0.94 |
|
|
|
0.96 |
|
|
|
1.16 |
|
|
|
1.06 |
|
| Net realized and unrealized gain (loss) |
|
|
(0.05) |
|
|
|
(3.22) |
|
|
|
(1.53) |
|
|
|
(0.18) |
|
|
|
1.11 |
|
|
|
(2.74) |
|
| Total income (loss) from
operations |
|
|
0.31 |
|
|
|
(2.47) |
|
|
|
(0.59) |
|
|
|
0.78 |
|
|
|
2.27 |
|
|
|
(1.68) |
|
|
|
|
|
|
|
|
| Less distributions from: |
|
|
|
|
|
|
|
|
|
|
|
|
|
|
|
|
|
|
|
|
|
|
|
|
| Net investment income |
|
|
(0.44) |
3 |
|
|
(0.72) |
|
|
|
(0.64) |
|
|
|
(0.62) |
|
|
|
(1.02) |
|
|
|
(1.07) |
|
| Return of capital |
|
|
— |
|
|
|
(0.29) |
|
|
|
(0.44) |
|
|
|
(0.56) |
|
|
|
(0.18) |
|
|
|
(0.13) |
|
| Total
distributions |
|
|
(0.44) |
|
|
|
(1.01) |
|
|
|
(1.08) |
|
|
|
(1.18) |
|
|
|
(1.20) |
|
|
|
(1.20) |
|
| Anti-dilutive impact of repurchase plan |
|
|
— |
|
|
|
0.01 |
4 |
|
|
— |
|
|
|
— |
|
|
|
— |
|
|
|
— |
|
|
|
|
|
|
|
|
| Net asset value, end of period |
|
|
$10.11 |
|
|
|
$10.24 |
|
|
|
$13.71 |
|
|
|
$15.38 |
|
|
|
$15.78 |
|
|
|
$14.71 |
|
|
|
|
|
|
|
|
| Market price, end of period |
|
|
$8.62 |
|
|
|
$9.11 |
|
|
|
$12.80 |
|
|
|
$13.90 |
|
|
|
$14.27 |
|
|
|
$12.29 |
|
| Total return, based on NAV5,6 |
|
|
3.11 |
% |
|
|
(17.86) |
% |
|
|
(4.06) |
% |
|
|
5.86 |
% |
|
|
15.76 |
% |
|
|
(9.78) |
% |
| Total return, based on Market Price7 |
|
|
(0.61) |
% |
|
|
(20.96) |
% |
|
|
(0.34) |
% |
|
|
6.80 |
% |
|
|
26.49 |
% |
|
|
(13.68) |
% |
|
|
|
|
|
|
|
| Net assets, end of period (millions) |
|
|
$609 |
|
|
|
$617 |
|
|
|
$833 |
|
|
|
$934 |
|
|
|
$958 |
|
|
|
$893 |
|
|
|
|
|
|
|
|
| Ratios to average net assets: |
|
|
|
|
|
|
|
|
|
|
|
|
|
|
|
|
|
|
|
|
|
|
|
|
| Gross expenses |
|
|
3.59 |
%8 |
|
|
2.32 |
% |
|
|
1.59 |
% |
|
|
1.85 |
% |
|
|
2.49 |
% |
|
|
2.39 |
% |
| Net expenses9 |
|
|
3.59 |
8,10 |
|
|
2.32 |
10 |
|
|
1.59 |
10 |
|
|
1.84 |
10 |
|
|
2.49 |
|
|
|
2.35 |
10 |
| Net investment income |
|
|
7.08 |
8 |
|
|
6.94 |
|
|
|
6.43 |
|
|
|
6.59 |
|
|
|
7.41 |
|
|
|
6.66 |
|
|
|
|
|
|
|
|
| Portfolio turnover rate |
|
|
42 |
% |
|
|
40 |
% |
|
|
34 |
% |
|
|
57 |
% |
|
|
29 |
% |
|
|
42 |
% |
|
|
|
|
|
|
|
| Supplemental data: |
|
|
|
|
|
|
|
|
|
|
|
|
|
|
|
|
|
|
|
|
|
|
|
|
| Loan Outstanding, End of Period (000s) |
|
|
$250,000 |
|
|
|
$235,000 |
|
|
|
$295,000 |
|
|
|
$295,000 |
|
|
|
$295,000 |
|
|
|
$295,000 |
|
| Asset Coverage Ratio for Loan Outstanding11
|
|
|
344 |
% |
|
|
362 |
% |
|
|
382 |
% |
|
|
417 |
% |
|
|
425 |
% |
|
|
403 |
% |
| Asset Coverage, per $1,000 Principal Amount of Loan Outstanding11 |
|
|
$3,437 |
|
|
|
$3,625 |
|
|
|
$3,822 |
|
|
|
$4,167 |
|
|
|
$4,248 |
|
|
|
$4,028 |
|
| Weighted Average Loan (000s) |
|
|
$245,110 |
|
|
|
$266,562 |
|
|
|
$295,000 |
|
|
|
$295,000 |
|
|
|
$295,000 |
|
|
|
$295,000 |
|
| Weighted Average Interest Rate on Loan |
|
|
5.45 |
% |
|
|
2.28 |
% |
|
|
0.79 |
% |
|
|
1.19 |
% |
|
|
2.96 |
% |
|
|
2.82 |
% |
See Notes to Financial
Statements.
|
|
|
|
|
|
28 |
|
|
|
Western Asset Emerging Markets Debt Fund Inc. 2023 Semi-Annual Report |
| 1 |
Per share amounts have been calculated using the average shares method. |
| 2 |
For the six months ended June 30, 2023 (unaudited). |
| 3 |
The actual source of the Fund’s current fiscal year distributions may be from net investment income, return of
capital or a combination of both. Shareholders will be informed of the tax characteristics of the distributions after the close of the fiscal year. |
| 4 |
The repurchase plan was completed at an average repurchase price of $10.35 for 500,000 shares and $5,175,727 for the year
ended December 31, 2022. |
| 5 |
Performance figures may reflect compensating balance arrangements, fee waivers and/or expense reimbursements. In the
absence of compensating balance arrangements, fee waivers and/or expense reimbursements, the total return would have been lower. Past performance is no guarantee of future results. Total returns for periods of less than one year are not annualized.
|
| 6 |
The total return calculation assumes that distributions are reinvested at NAV. Past performance is no guarantee of future
results. Total returns for periods of less than one year are not annualized. |
| 7 |
The total return calculation assumes that distributions are reinvested in accordance with the Fund’s dividend
reinvestment plan. Past performance is no guarantee of future results. Total returns for periods of less than one year are not annualized. |
| 9 |
The manager has agreed to waive the Fund’s management fee to an extent sufficient to offset the net management fee
payable in connection with any investment in an affiliated money market fund. |
| 10 |
Reflects fee waivers and/or expense reimbursements. |
| 11 |
Represents value of net assets plus the loan outstanding at the end of the period divided by the loan outstanding at the
end of the period. |
See Notes to
Financial Statements.
|
|
|
|
|
| Western Asset Emerging Markets Debt Fund Inc. 2023 Semi-Annual Report |
|
|
|
29 |
Notes to financial statements (unaudited)
1. Organization and significant accounting policies
Western Asset Emerging Markets Debt Fund Inc. (the “Fund”) was incorporated in Maryland on April 16, 2003 and is registered as a non-diversified, closed-end management investment company under the Investment Company Act of 1940, as amended (the “1940 Act”). The Board of Directors authorized
100 million shares of $0.001 par value common stock. The Fund’s primary investment objective is to seek high current income and the Fund’s secondary objective is to seek capital appreciation.
The Fund follows the accounting and reporting guidance in Financial Accounting Standards Board (“FASB”) Accounting Standards Codification Topic 946,
Financial Services – Investment Companies (“ASC 946”). The following are significant accounting policies consistently followed by the Fund and are in conformity with U.S. generally accepted accounting principles
(“GAAP”), including, but not limited to, ASC 946. Estimates and assumptions are required to be made regarding assets, liabilities and changes in net assets resulting from operations when financial statements are prepared. Changes in the
economic environment, financial markets and any other parameters used in determining these estimates could cause actual results to differ. Subsequent events have been evaluated through the date the financial statements were issued.
(a) Investment valuation. The valuations for fixed income securities (which
may include, but are not limited to, corporate, government, municipal, mortgage-backed, collateralized mortgage obligations and asset-backed securities) and certain derivative instruments are typically the prices supplied by independent third party
pricing services, which may use market prices or broker/dealer quotations or a variety of valuation techniques and methodologies. The independent third party pricing services typically use inputs that are observable such as issuer details, interest
rates, yield curves, prepayment speeds, credit risks/spreads, default rates and quoted prices for similar securities. Investments in open-end funds are valued at the closing net asset value per share of each
fund on the day of valuation. Futures contracts are valued daily at the settlement price established by the board of trade or exchange on which they are traded. Equity securities for which market quotations are available are valued at the last
reported sales price or official closing price on the primary market or exchange on which they trade. When the Fund holds securities or other assets that are denominated in a foreign currency, the Fund will normally use the currency exchange rates
as of 4:00 p.m. (Eastern Time). If independent third party pricing services are unable to supply prices for a portfolio investment, or if the prices supplied are deemed by the manager to be unreliable, the market price may be determined by the
manager using quotations from one or more broker/dealers or at the transaction price if the security has recently been purchased and no value has yet been obtained from a pricing service or pricing broker. When reliable prices are not readily
available, such as when the value of a security has been significantly affected by events after the close of the exchange or market on which the security is principally traded, but before the Fund calculates its net asset value, the Fund values
these securities as determined in accordance with procedures approved by the Fund’s Board of Directors.
|
|
|
|
|
|
30 |
|
|
|
Western Asset Emerging Markets Debt Fund Inc. 2023 Semi-Annual Report |
Pursuant to policies adopted by the Board of Directors, the Fund’s manager has been designated as the valuation designee and is responsible for the oversight of the
daily valuation process. The Fund’s manager is assisted by the Global Fund Valuation Committee (the “Valuation Committee”). The Valuation Committee is responsible for making fair value determinations, evaluating the effectiveness of
the Fund’s pricing policies, and reporting to the Fund’s manager and the Board of Directors. When determining the reliability of third party pricing information for investments owned by the Fund, the Valuation Committee, among other
things, conducts due diligence reviews of pricing vendors, monitors the daily change in prices and reviews transactions among market participants.
The Valuation
Committee will consider pricing methodologies it deems relevant and appropriate when making fair value determinations. Examples of possible methodologies include, but are not limited to, multiple of earnings; discount from market of a similar freely
traded security; discounted cash-flow analysis; book value or a multiple thereof; risk premium/yield analysis; yield to maturity; and/or fundamental investment analysis. The Valuation Committee will also consider factors it deems relevant and
appropriate in light of the facts and circumstances. Examples of possible factors include, but are not limited to, the type of security; the issuer’s financial statements; the purchase price of the security; the discount from market value of
unrestricted securities of the same class at the time of purchase; analysts’ research and observations from financial institutions; information regarding any transactions or offers with respect to the security; the existence of merger proposals
or tender offers affecting the security; the price and extent of public trading in similar securities of the issuer or comparable companies; and the existence of a shelf registration for restricted securities.
For each portfolio security that has been fair valued pursuant to the policies adopted by the Board of Directors, the fair value price is compared against the last
available and next available market quotations. The Valuation Committee reviews the results of such back testing monthly and fair valuation occurrences are reported to the Board of Directors quarterly.
The Fund uses valuation techniques to measure fair value that are consistent with the market approach and/or income approach, depending on the type of security and the
particular circumstance. The market approach uses prices and other relevant information generated by market transactions involving identical or comparable securities. The income approach uses valuation techniques to discount estimated future cash
flows to present value.
|
|
|
|
|
| Western Asset Emerging Markets Debt Fund Inc. 2023 Semi-Annual Report |
|
|
|
31 |
Notes to financial statements
(unaudited) (cont’d)
GAAP establishes a disclosure hierarchy that categorizes the inputs to valuation techniques used
to value assets and liabilities at measurement date. These inputs are summarized in the three broad levels listed below:
| • |
|
Level 1 — unadjusted quoted prices in active markets for identical investments |
| • |
|
Level 2 — other significant observable inputs (including quoted prices for similar investments, interest rates,
prepayment speeds, credit risk, etc.) |
| • |
|
Level 3 — significant unobservable inputs (including the Fund’s own assumptions in determining the fair
value of investments) The inputs or methodologies used to value securities are not necessarily an indication of the risk associated with investing in those securities. |
The following is a summary of the inputs used in valuing the Fund’s assets and liabilities carried at fair value:
|
|
|
|
|
|
|
|
|
|
|
|
|
|
|
|
|
| ASSETS |
|
| Description |
|
Quoted Prices
(Level 1) |
|
|
Other Significant
Observable Inputs
(Level 2) |
|
|
Significant
Unobservable
Inputs
(Level 3) |
|
|
Total |
|
| Long-Term Investments†: |
|
|
|
|
|
|
|
|
|
|
|
|
|
|
|
|
| Sovereign Bonds |
|
|
— |
|
|
$ |
503,475,509 |
|
|
$ |
1,497,207 |
|
|
$ |
504,972,716 |
|
| Corporate Bonds & Notes |
|
|
— |
|
|
|
339,484,224 |
|
|
|
— |
|
|
|
339,484,224 |
|
| Purchased Options |
|
|
— |
|
|
|
824,372 |
|
|
|
— |
|
|
|
824,372 |
|
| Total Long-Term Investments |
|
|
— |
|
|
|
843,784,105 |
|
|
|
1,497,207 |
|
|
|
845,281,312 |
|
| Short-Term Investments† |
|
$ |
5,207,760 |
|
|
|
— |
|
|
|
— |
|
|
|
5,207,760 |
|
| Total Investments |
|
$ |
5,207,760 |
|
|
$ |
843,784,105 |
|
|
$ |
1,497,207 |
|
|
$ |
850,489,072 |
|
| Other Financial Instruments: |
|
|
|
|
|
|
|
|
|
|
|
|
|
|
|
|
| Futures Contracts†† |
|
$ |
951,579 |
|
|
|
— |
|
|
|
— |
|
|
$ |
951,579 |
|
| Forward Foreign Currency Contracts†† |
|
|
— |
|
|
$ |
610,637 |
|
|
|
— |
|
|
|
610,637 |
|
| Total Other Financial Instruments |
|
$ |
951,579 |
|
|
$ |
610,637 |
|
|
|
— |
|
|
$ |
1,562,216 |
|
| Total |
|
$ |
6,159,339 |
|
|
$ |
844,394,742 |
|
|
$ |
1,497,207 |
|
|
$ |
852,051,288 |
|
|
| LIABILITIES |
|
| Description |
|
Quoted Prices
(Level 1) |
|
|
Other Significant
Observable Inputs
(Level 2) |
|
|
Significant
Unobservable
Inputs
(Level 3) |
|
|
Total |
|
| Other Financial Instruments: |
|
|
|
|
|
|
|
|
|
|
|
|
|
|
|
|
| Written Options |
|
|
— |
|
|
$ |
419,594 |
|
|
|
— |
|
|
$ |
419,594 |
|
| Futures Contracts†† |
|
$ |
25,988 |
|
|
|
— |
|
|
|
— |
|
|
|
25,988 |
|
| Forward Foreign Currency Contracts†† |
|
|
— |
|
|
|
1,841,482 |
|
|
|
— |
|
|
|
1,841,482 |
|
| Total |
|
$ |
25,988 |
|
|
$ |
2,261,076 |
|
|
|
— |
|
|
$ |
2,287,064 |
|
|
|
|
|
|
|
32 |
|
|
|
Western Asset Emerging Markets Debt Fund Inc. 2023 Semi-Annual Report |
| † |
See Schedule of Investments for additional detailed categorizations. |
| †† |
Reflects the unrealized appreciation (depreciation) of the instruments. |
(b) Purchased options. When the Fund purchases an option, an amount equal
to the premium paid by the Fund is recorded as an investment on the Statement of Assets and Liabilities, the value of which is marked-to-market to reflect the current
market value of the option purchased. If the purchased option expires, the Fund realizes a loss equal to the amount of premium paid. When an instrument is purchased or sold through the exercise of an option, the related premium paid is added to the
basis of the instrument acquired or deducted from the proceeds of the instrument sold. The risk associated with purchasing put and call options is limited to the premium paid.
(c) Written options. When the Fund writes an option, an amount equal to the
premium received by the Fund is recorded as a liability, the value of which is marked-to-market daily to reflect the current market value of the option written. If the
option expires, the premium received is recorded as a realized gain. When a written call option is exercised, the difference between the premium received plus the option exercise price and the Fund’s basis in the underlying security (in the
case of a covered written call option), or the cost to purchase the underlying security (in the case of an uncovered written call option), including brokerage commission, is recognized as a realized gain or loss. When a written put option is
exercised, the amount of the premium received is subtracted from the cost of the security purchased by the Fund from the exercise of the written put option to form the Fund’s basis in the underlying security purchased. The writer or buyer of an
option traded on an exchange can liquidate the position before the exercise of the option by entering into a closing transaction. The cost of a closing transaction is deducted from the original premium received resulting in a realized gain or loss
to the Fund.
The risk in writing a covered call option is that the Fund may forego the opportunity of profit if the market price of the underlying security
increases and the option is exercised. The risk in writing a put option is that the Fund may incur a loss if the market price of the underlying security decreases and the option is exercised. The risk in writing an uncovered call option is that the
Fund is exposed to the risk of loss if the market price of the underlying security increases. In addition, there is the risk that the Fund may not be able to enter into a closing transaction because of an illiquid secondary market.
(d) Futures contracts. The Fund uses futures contracts generally to gain
exposure to, or hedge against, changes in interest rates or gain exposure to, or hedge against, changes in certain asset classes. A futures contract represents a commitment for the future purchase or sale of an asset at a specified price on a
specified date.
Upon entering into a futures contract, the Fund is required to deposit cash or securities with a broker in an amount equal to a certain
percentage of the contract amount. This is known as the ‘‘initial margin’’ and subsequent payments (‘‘variation margin’’) are made or received by the Fund each day, depending on the daily fluctuation in the
value of the contract. For certain futures, including foreign denominated futures, variation margin is not settled daily,
|
|
|
|
|
| Western Asset Emerging Markets Debt Fund Inc. 2023 Semi-Annual Report |
|
|
|
33 |
Notes to financial statements
(unaudited) (cont’d)
but is recorded as a net variation margin payable or receivable. The daily changes in contract
value are recorded as unrealized appreciation or depreciation in the Statement of Operations and the Fund recognizes a realized gain or loss when the contract is closed.
Futures contracts involve, to varying degrees, risk of loss in excess of the amounts reflected in the financial statements. In addition, there is the risk that the Fund
may not be able to enter into a closing transaction because of an illiquid secondary market.
(e) Forward foreign
currency contracts. The Fund enters into a forward foreign currency contract to hedge against foreign currency exchange rate risk on its non-U.S. dollar denominated
securities or to facilitate settlement of a foreign currency denominated portfolio transaction. A forward foreign currency contract is an agreement between two parties to buy and sell a currency at a set price with delivery and settlement at a
future date. The contract is marked-to-market daily and the change in value is recorded by the Fund as an unrealized gain or loss. When a forward foreign currency
contract is closed, through either delivery or offset by entering into another forward foreign currency contract, the Fund recognizes a realized gain or loss equal to the difference between the value of the contract at the time it was opened and the
value of the contract at the time it is closed.
Non-deliverable forward foreign currency exchange contracts are
settled with the counterparty in cash without the delivery of foreign currency.
Forward foreign currency contracts involve elements of market risk in excess of the
amounts reflected on the Statement of Assets and Liabilities. The Fund bears the risk of an unfavorable change in the foreign exchange rate underlying the forward foreign currency contract. Risks may also arise upon entering into these contracts
from the potential inability of the counterparties to meet the terms of their contracts.
(f) Cash flow
information. The Fund invests in securities and distributes dividends from net investment income and net realized gains, which are paid in cash and may be reinvested at the discretion of shareholders. These
activities are reported in the Statements of Changes in Net Assets and additional information on cash receipts and cash payments is presented in the Statement of Cash Flows.
(g) Foreign currency translation. Investment securities and other assets
and liabilities denominated in foreign currencies are translated into U.S. dollar amounts based upon prevailing exchange rates on the date of valuation. Purchases and sales of investment securities and income and expense items denominated in foreign
currencies are translated into U.S. dollar amounts based upon prevailing exchange rates on the respective dates of such transactions.
The Fund does not
isolate that portion of the results of operations resulting from fluctuations in foreign exchange rates on investments from the fluctuations arising from changes in market prices of securities held. Such fluctuations are included with the net
realized and unrealized gain or loss on investments.
|
|
|
|
|
|
34 |
|
|
|
Western Asset Emerging Markets Debt Fund Inc. 2023 Semi-Annual Report |
Net realized foreign exchange gains or losses arise from sales of foreign currencies, including gains and losses on forward foreign currency contracts, currency gains or
losses realized between the trade and settlement dates on securities transactions, and the difference between the amounts of dividends, interest, and foreign withholding taxes recorded on the Fund’s books and the U.S. dollar equivalent of the
amounts actually received or paid. Net unrealized foreign exchange gains and losses arise from changes in the values of assets and liabilities, other than investments in securities, on the date of valuation, resulting from changes in exchange rates.
Foreign security and currency transactions may involve certain considerations and risks not typically associated with those of U.S. dollar denominated transactions
as a result of, among other factors, the possibility of lower levels of governmental supervision and regulation of foreign securities markets and the possibility of political or economic instability.
(h) Credit and market risk. The Fund invests in high-yield and emerging
market instruments that are subject to certain credit and market risks. The yields of high-yield and emerging market debt obligations reflect, among other things, perceived credit and market risks. The Fund’s investments in securities rated
below investment grade typically involve risks not associated with higher rated securities including, among others, greater risk related to timely and ultimate payment of interest and principal, greater market price volatility and less liquid
secondary market trading. The consequences of political, social, economic or diplomatic changes may have disruptive effects on the market prices of investments held by the Fund. The Fund’s investments in
non-U.S. dollar denominated securities may also result in foreign currency losses caused by devaluations and exchange rate fluctuations.
(i) Foreign investment risks. The Fund’s investments in foreign
securities may involve risks not present in domestic investments. Since securities may be denominated in foreign currencies, may require settlement in foreign currencies or may pay interest or dividends in foreign currencies, changes in the
relationship of these foreign currencies to the U.S. dollar can significantly affect the value of the investments and earnings of the Fund. Foreign investments may also subject the Fund to foreign government exchange restrictions, expropriation,
taxation or other political, social or economic developments, all of which affect the market and/or credit risk of the investments.
(j) Other risks. Consistent with its objective to seek high current income, the Fund may invest in instruments whose values and interest rates are linked to
foreign currencies, interest rates, indices or some other financial indicator. The value at maturity or interest rates for these instruments will increase or decrease according to the change in the indicator to which they are indexed, amongst other
factors. These securities are generally more volatile in nature, and the risk of loss of principal may be greater.
(k) Counterparty risk and credit-risk-related contingent features of derivative instruments. The Fund may invest in certain securities or engage in other
transactions
|
|
|
|
|
| Western Asset Emerging Markets Debt Fund Inc. 2023 Semi-Annual Report |
|
|
|
35 |
Notes to financial statements
(unaudited) (cont’d)
where the Fund is exposed to counterparty credit risk in addition to broader market risks. The
Fund may invest in securities of issuers, which may also be considered counterparties as trading partners in other transactions. This may increase the risk of loss in the event of default or bankruptcy by the counterparty or if the counterparty
otherwise fails to meet its contractual obligations. The Fund’s subadviser attempts to mitigate counterparty risk by (i) periodically assessing the creditworthiness of its trading partners, (ii) monitoring and/or limiting the amount
of its net exposure to each individual counterparty based on its assessment and (iii) requiring collateral from the counterparty for certain transactions. Market events and changes in overall economic conditions may impact the assessment of
such counterparty risk by the subadviser. In addition, declines in the values of underlying collateral received may expose the Fund to increased risk of loss.
With
exchange traded and centrally cleared derivatives, there is less counterparty risk to the Fund since the exchange or clearinghouse, as counterparty to such instruments, guarantees against a possible default. The clearinghouse stands between the
buyer and the seller of the contract; therefore, the credit risk is limited to failure of the clearinghouse. While offset rights may exist under applicable law, the Fund does not have a contractual right of offset against a clearing broker or
clearinghouse in the event of a default of the clearing broker or clearinghouse.
The Fund has entered into master agreements, such as an International Swaps and
Derivatives Association, Inc. Master Agreement (“ISDA Master Agreement”) or similar agreement, with certain of its derivative counterparties that govern
over-the-counter (“OTC”) derivatives and provide for general obligations, representations, agreements, collateral posting terms, netting provisions in the
event of default or termination and credit related contingent features. The credit related contingent features include, but are not limited to, a percentage decrease in the Fund net assets or net asset value per share over a specified period of
time. If these credit related contingent features were triggered, the derivatives counterparty could terminate the positions and demand payment or require additional collateral.
Under an ISDA Master Agreement, the Fund may, under certain circumstances, offset with the counterparty certain derivative financial instruments’ payables and/or
receivables with collateral held and/or posted and create one single net payment. However, absent an event of default by the counterparty or a termination of the agreement, the terms of the ISDA Master Agreements do not result in an offset of
reported amounts of financial assets and financial liabilities in the Statement of Assets and Liabilities across transactions between the Fund and the applicable counterparty. The enforceability of the right to offset may vary by jurisdiction.
Collateral requirements differ by type of derivative. Collateral or margin requirements are set by the broker or exchange clearinghouse for exchange traded derivatives
while collateral terms are contract specific for OTC traded derivatives. Cash collateral that has been pledged to cover obligations of the Fund under derivative contracts, if any, will be
|
|
|
|
|
|
36 |
|
|
|
Western Asset Emerging Markets Debt Fund Inc. 2023 Semi-Annual Report |
reported separately in the Statement of Assets and Liabilities. Securities pledged as collateral, if any, for the same purpose are noted in the Schedule of Investments.
As of June 30, 2023, the Fund held forward foreign currency contracts and OTC written options with credit related contingent features which had a liability
position of $2,261,076. If a contingent feature in the master agreements would have been triggered, the Fund would have been required to pay this amount to its derivative counterparties.
At June 30, 2023, the Fund held cash collateral from Citibank N.A. in the amount of $120,000. This amount could be used to reduce the Fund’s exposure to the
counterparty in the event of default.
(l) Security transactions and investment income. Security transactions are accounted for on a trade date basis. Interest income (including interest income from payment-in-kind securities),
adjusted for amortization of premium and accretion of discount, is recorded on the accrual basis. Dividend income is recorded on the ex-dividend date for dividends received in cash and/or securities. Foreign
dividend income is recorded on the ex-dividend date or as soon as practicable after the Fund determines the existence of a dividend declaration after exercising reasonable due diligence. The cost of
investments sold is determined by use of the specific identification method. To the extent any issuer defaults or a credit event occurs that impacts the issuer, the Fund may halt any additional interest income accruals and consider the realizability
of interest accrued up to the date of default or credit event.
(m) Distributions to shareholders.
Distributions from net investment income of the Fund, if any, are declared quarterly and paid on a monthly basis. Distributions of net realized gains, if any, are declared at least annually. Pursuant to its
Managed Distribution Policy, the Fund intends to make regular monthly distributions to shareholders at a fixed rate per common share, which rate may be adjusted from time to time by the Fund’s Board of Directors. Under the Fund’s Managed
Distribution Policy, if, for any monthly distribution, the value of the Fund’s net investment income and net realized capital gain is less than the amount of the distribution, the difference will be distributed from the Fund’s net assets
(and may constitute a “return of capital”). The actual source of the Fund’s monthly distributions may be from net investment income, return of capital or a combination of both. Shareholders will be informed of the tax characteristics
of the distributions after the close of the 2023 fiscal year. The Board of Directors may modify, terminate or suspend the Managed Distribution Policy at any time, including when certain events would make part of the return of capital taxable to
shareholders. Any such modification, termination or suspension could have an adverse effect on the market price of the Fund’s shares. Distributions to shareholders of the Fund are recorded on the
ex-dividend date and are determined in accordance with income tax regulations, which may differ from GAAP.
(n) Compensating balance arrangements. The Fund has an arrangement with its custodian bank whereby a portion of the custodian’s fees is paid indirectly by
credits earned on the Fund’s cash on deposit with the bank.
|
|
|
|
|
| Western Asset Emerging Markets Debt Fund Inc. 2023 Semi-Annual Report |
|
|
|
37 |
Notes to financial statements
(unaudited) (cont’d)
(o) Federal and other taxes. It is the Fund’s policy to comply with the federal income and excise tax requirements of the Internal Revenue Code of 1986 (the “Code”), as amended, applicable to regulated investment companies. Accordingly,
the Fund intends to distribute its taxable income and net realized gains, if any, to shareholders in accordance with timing requirements imposed by the Code. Therefore, no federal or state income tax provision is required in the Fund’s
financial statements.
Management has analyzed the Fund’s tax positions taken on income tax returns for all open tax years and has concluded that as of
December 31, 2022, no provision for income tax is required in the Fund’s financial statements. The Fund’s federal and state income and federal excise tax returns for tax years for which the applicable statutes of limitations have not
expired are subject to examination by the Internal Revenue Service and state departments of revenue.
Under the applicable foreign tax laws, a withholding tax may be
imposed on interest, dividends and capital gains at various rates. As of June 30, 2023, there were $41,847 of capital gains tax liabilities accrued on unrealized gains.
(p) Reclassification. GAAP requires that certain components of net assets
be reclassified to reflect permanent differences between financial and tax reporting. These reclassifications have no effect on net assets or net asset value per share.
2. Investment management agreement and other transactions with affiliates
Legg Mason Partners Fund Advisor, LLC (“LMPFA”) is the Fund’s investment manager. Western Asset Management Company, LLC (“Western Asset”),
Western Asset Management Company Limited (“Western Asset London”) and Western Asset Management Company Pte. Ltd. (“Western Asset Singapore”) are the Fund’s subadvisers. LMPFA, Western Asset, Western Asset London and Western
Asset Singapore are indirect, wholly-owned subsidiaries of Franklin Resources, Inc. (“Franklin Resources”).
Under the investment management agreement, the
Fund pays an investment management fee, calculated daily and paid monthly, at an annual rate of 0.85% of the Fund’s average daily net assets plus the proceeds of any outstanding borrowings used for leverage and any proceeds from the issuance of
preferred stock.
LMPFA provides administrative and certain oversight services to the Fund. LMPFA delegates to Western Asset the day-to-day portfolio management of the Fund. Western Asset London and Western Asset Singapore provide certain subadvisory services to the Fund relating to currency transactions and investments in non-U.S. dollar denominated debt securities. Western Asset London and Western Asset Singapore do not receive any compensation from the Fund and are compensated by Western Asset for their services to the Fund. For
its services, LMPFA pays Western Asset a fee monthly, at an annual rate equal to 70% of the net management fee it receives from the Fund. In turn, Western Asset pays Western Asset London and Western Asset Singapore a monthly subadvisory fee in an
amount equal to
|
|
|
|
|
|
38 |
|
|
|
Western Asset Emerging Markets Debt Fund Inc. 2023 Semi-Annual Report |
100% of the management fee paid to Western Asset on the assets that Western Asset allocates to
each such non-U.S. subadviser to manage.
During periods in which the Fund utilizes financial leverage, the fees paid to
LMPFA will be higher than if the Fund did not utilize leverage because the fees are calculated as a percentage of the Fund’s assets, including those investments purchased with leverage.
The manager has agreed to waive the Fund’s management fee to an extent sufficient to offset the net management fee payable in connection with any investment in an
affiliated money market fund (the “affiliated money market fund waiver”).
During the six months ended June 30, 2023, fees waived and/or expenses
reimbursed amounted to $2,180, all of which was an affiliated money market fund waiver.
All officers and one Director of the Fund are employees of Franklin
Resources or its affiliates and do not receive compensation from the Fund.
3. Investments
During the six months ended June 30, 2023, the aggregate cost of purchases and proceeds from sales of investments (excluding short-term investments) were as
follows:
|
|
|
|
|
| Purchases |
|
$ |
349,157,661 |
|
| Sales |
|
|
344,344,770 |
|
At June 30, 2023, the aggregate cost of investments and the aggregate gross unrealized appreciation and depreciation of investments
for federal income tax purposes were substantially as follows:
|
|
|
|
|
|
|
|
|
|
|
|
|
|
|
|
|
| |
|
Cost/Premiums
Paid (Received) |
|
|
Gross
Unrealized
Appreciation |
|
|
Gross
Unrealized
Depreciation |
|
|
Net
Unrealized
Appreciation
(Depreciation) |
|
| Securities |
|
$ |
948,647,326 |
|
|
$ |
22,042,991 |
|
|
$ |
(120,201,245) |
|
|
$ |
(98,158,254) |
|
| Written options |
|
|
(675,300) |
|
|
|
342,657 |
|
|
|
(86,951) |
|
|
|
255,706 |
|
| Futures contracts |
|
|
— |
|
|
|
951,579 |
|
|
|
(25,988) |
|
|
|
925,591 |
|
| Forward foreign currency contracts |
|
|
— |
|
|
|
610,637 |
|
|
|
(1,841,482) |
|
|
|
(1,230,845) |
|
|
|
|
|
|
| Western Asset Emerging Markets Debt Fund Inc. 2023 Semi-Annual Report |
|
|
|
39 |
Notes to financial statements
(unaudited) (cont’d)
4. Derivative instruments and hedging activities
Below is a table, grouped by derivative type, that provides information about the fair value and the location of derivatives within the Statement of Assets and
Liabilities at June 30, 2023.
|
|
|
|
|
|
|
|
|
|
|
|
|
| ASSET DERIVATIVES1 |
|
| |
|
Interest
Rate Risk |
|
|
Foreign
Exchange Risk |
|
|
Total |
|
| Purchased options2 |
|
|
— |
|
|
$ |
824,372 |
|
|
$ |
824,372 |
|
| Futures contracts3 |
|
$ |
951,579 |
|
|
|
— |
|
|
|
951,579 |
|
| Forward foreign currency contracts |
|
|
— |
|
|
|
610,637 |
|
|
|
610,637 |
|
| Total |
|
$ |
951,579 |
|
|
$ |
1,435,009 |
|
|
$ |
2,386,588 |
|
|
|
|
|
|
|
|
|
|
|
|
|
|
| LIABILITY DERIVATIVES1 |
|
| |
|
Interest
Rate Risk |
|
|
Foreign
Exchange Risk |
|
|
Total |
|
| Written options |
|
|
— |
|
|
$ |
419,594 |
|
|
$ |
419,594 |
|
| Futures contracts3 |
|
$ |
25,988 |
|
|
|
— |
|
|
|
25,988 |
|
| Forward foreign currency contracts |
|
|
— |
|
|
|
1,841,482 |
|
|
|
1,841,482 |
|
| Total |
|
$ |
25,988 |
|
|
$ |
2,261,076 |
|
|
$ |
2,287,064 |
|
| 1 |
Generally, the balance sheet location for asset derivatives is receivables/net unrealized appreciation and for liability
derivatives is payables/net unrealized depreciation. |
| 2 |
Market value of purchased options is reported in Investments in unaffiliated securities at value in the Statement of
Assets and Liabilities. |
| 3 |
Includes cumulative unrealized appreciation (depreciation) of futures contracts as reported in the Schedule of
Investments. Only net variation margin is reported within the receivables and/or payables on the Statement of Assets and Liabilities. |
The
following tables provide information about the effect of derivatives and hedging activities on the Fund’s Statement of Operations for the six months ended June 30, 2023. The first table provides additional detail about the amounts and
sources of gains (losses) realized on derivatives during the period. The second table provides additional information about the change in net unrealized appreciation (depreciation) resulting from the Fund’s derivatives and hedging activities
during the period.
|
|
|
|
|
|
|
|
|
|
|
|
|
| AMOUNT OF NET REALIZED GAIN (LOSS) ON DERIVATIVES RECOGNIZED |
|
| |
|
Interest
Rate Risk |
|
|
Foreign
Exchange Risk |
|
|
Total |
|
| Purchased options1 |
|
|
— |
|
|
$ |
(413,438) |
|
|
$ |
(413,438) |
|
| Futures contracts |
|
$ |
(573,869) |
|
|
|
— |
|
|
|
(573,869) |
|
| Written options |
|
|
— |
|
|
|
446,084 |
|
|
|
446,084 |
|
| Forward foreign currency contracts |
|
|
— |
|
|
|
(493,144) |
|
|
|
(493,144) |
|
| Total |
|
$ |
(573,869) |
|
|
$ |
(460,498) |
|
|
$ |
(1,034,367) |
|
| 1 |
Net realized gain (loss) from purchased options is reported in Net Realized Gain (Loss) From Investment transactions in
unaffiliated securities in the Statement of Operations. |
|
|
|
|
|
|
40 |
|
|
|
Western Asset Emerging Markets Debt Fund Inc. 2023 Semi-Annual Report |
|
|
|
|
|
|
|
|
|
|
|
|
|
| CHANGE IN NET UNREALIZED APPRECIATION (DEPRECIATION) ON DERIVATIVES RECOGNIZED |
|
| |
|
Interest
Rate Risk |
|
|
Foreign
Exchange Risk |
|
|
Total |
|
| Purchased options1 |
|
|
— |
|
|
$ |
92,719 |
|
|
$ |
92,719 |
|
| Futures contracts |
|
$ |
169,470 |
|
|
|
— |
|
|
|
169,470 |
|
| Written options |
|
|
— |
|
|
|
190,613 |
|
|
|
190,613 |
|
| Forward foreign currency contracts |
|
|
— |
|
|
|
(1,379,263) |
|
|
|
(1,379,263) |
|
| Total |
|
$ |
169,470 |
|
|
$ |
(1,095,931) |
|
|
$ |
(926,461) |
|
| 1 |
The change in net unrealized appreciation (depreciation) from purchased options is reported in the Change in Net
Unrealized Appreciation (Depreciation) From Investments in unaffiliated securities in the Statement of Operations. |
During the six months ended
June 30, 2023, the volume of derivative activity for the Fund was as follows:
|
|
|
|
|
| |
|
Average Market
Value |
|
| Purchased options |
|
$ |
631,166 |
|
| Written options |
|
|
297,674 |
|
| Futures contracts (to sell) |
|
|
66,765,555 |
|
| Forward foreign currency contracts (to buy) |
|
|
13,477,917 |
|
| Forward foreign currency contracts (to sell) |
|
|
61,605,589 |
|
The following table presents the Fund’s OTC derivative assets and liabilities by counterparty net of amounts available for offset
under an ISDA Master Agreement and net of the related collateral pledged (received) by the Fund as of June 30, 2023.
|
|
|
|
|
|
|
|
|
|
|
|
|
|
|
|
|
|
|
| Counterparty |
|
Gross Assets
Subject to
Master
Agreements1 |
|
|
Gross
Liabilities
Subject to
Master
Agreements1 |
|
|
Net Assets
(Liabilities)
Subject to
Master
Agreements |
|
Collateral
Pledged
(Received)2,3 |
|
|
Net
Amount4,5 |
|
| Bank of America N.A. |
|
$ |
122,364 |
|
|
$ |
(31,613) |
|
|
$90,751 |
|
|
— |
|
|
$ |
90,751 |
|
| BNP Paribas SA |
|
|
267,514 |
|
|
|
(266,910) |
|
|
604 |
|
|
— |
|
|
|
604 |
|
| Citibank N.A. |
|
|
376,895 |
|
|
|
(1,346,305) |
|
|
(969,410) |
|
$ |
(120,000) |
|
|
|
(1,089,410) |
|
| Deutsche Bank AG |
|
|
139,997 |
|
|
|
(26,405) |
|
|
113,592 |
|
|
— |
|
|
|
113,592 |
|
| Goldman Sachs Group Inc. |
|
|
64,547 |
|
|
|
(57,958) |
|
|
6,589 |
|
|
— |
|
|
|
6,589 |
|
| JPMorgan Chase & Co. |
|
|
463,692 |
|
|
|
(531,885) |
|
|
(68,193) |
|
|
— |
|
|
|
(68,193) |
|
| Total |
|
$ |
1,435,009 |
|
|
$ |
(2,261,076) |
|
|
$(826,067) |
|
$ |
(120,000) |
|
|
$ |
(946,067) |
|
|
|
|
|
|
| Western Asset Emerging Markets Debt Fund Inc. 2023 Semi-Annual Report |
|
|
|
41 |
Notes to financial statements
(unaudited) (cont’d)
| 1 |
Absent an event of default or early termination, derivative assets and liabilities are presented gross and not offset in
the Statement of Assets and Liabilities. |
| 2 |
Gross amounts are not offset in the Statement of Assets and Liabilities. |
| 3 |
In some instances, the actual collateral received and/or pledged may be more than the amount shown here due to
overcollateralization. |
| 4 |
Net amount may also include forward foreign currency exchange contracts that are not required to be collateralized.
|
| 5 |
Represents the net amount receivable (payable) from (to) the counterparty in the event of default. |
5. Loan
The Fund has a Master Margin Loan
Agreement (the “BNYM Credit Agreement”) with The Bank of New York Mellon (“BNYM”) as lender. The BNYM Credit Agreement provides for borrowings in an aggregate principal amount of up to $325,000,000, subject to the terms and
conditions therein. Each loan under the BNYM Credit Agreement constitutes an open commitment by BNYM terminable upon 180 days’ notice by the Fund or BNYM. The Fund pays interest on borrowings calculated based on the Overnight Bank Funding Rate
plus applicable margin. The Overnight Bank Funding Rate is a volume weighted median measure of U.S. dollar funding costs for U.S. based banks calculated using both federal funds transactions and overnight eurodollar time deposits. The Fund pays a
commitment fee on the unutilized portion of the loan commitment amount at an annual rate of 0.25% except that no commitment fee is accrued when the aggregate outstanding balance of the loan is equal to or greater than 75% of the margin loan
commitment amount. To the extent of the borrowing outstanding, the Fund is required to maintain collateral in a special custody account at the Fund’s custodian on behalf of BNYM. The BNYM Credit Agreement contains certain covenants that, among
other things, may limit the Fund’s ability to pay distributions in certain circumstances, incur additional debt, change its fundamental investment policies and engage in certain transactions, including mergers and consolidations, and require
asset coverage ratios in addition to those required by the 1940 Act. In addition, the BNYM Credit Agreement may be subject to early termination under certain conditions and may contain other provisions that could limit the Fund’s ability to
utilize borrowing under the agreement. Interest expense related to the BNYM Credit Agreement for the six months ended June 30, 2023 was $6,714,048. For the six months ended June 30, 2023, the Fund incurred commitment fees of $36,875. For
the six months ended June 30, 2023, the average daily loan balance was $245,110,497 and the weighted average interest rate was 5.45%. At June 30, 2023, the Fund had $250,000,000 of borrowings outstanding.
6. Distributions subsequent to June 30, 2023
The following distributions have been declared by the Fund’s Board of Directors and are payable subsequent to the period end of this report:
|
|
|
|
|
|
|
|
|
| Record Date |
|
Payable Date |
|
|
Amount |
|
| 6/23/2023 |
|
|
7/3/2023 |
|
|
$ |
0.0700 |
|
| 7/24/2023 |
|
|
8/1/2023 |
|
|
$ |
0.0700 |
|
| 8/24/2023 |
|
|
9/1/2023 |
|
|
$ |
0.0700 |
|
|
|
|
|
|
|
42 |
|
|
|
Western Asset Emerging Markets Debt Fund Inc. 2023 Semi-Annual Report |
|
|
|
|
|
|
|
|
|
| Record Date |
|
Payable Date |
|
|
Amount |
|
| 9/22/2023 |
|
|
10/2/2023 |
|
|
$ |
0.0845 |
|
| 10/24/2023 |
|
|
11/1/2023 |
|
|
$ |
0.0845 |
|
| 11/22/2023 |
|
|
12/1/2023 |
|
|
$ |
0.0845 |
|
7. Stock repurchase program
On November 16, 2015, the Fund announced that the Fund’s Board of Directors (the “Board”) had authorized the Fund to repurchase in the open market up
to approximately 10% of the Fund’s outstanding common stock when the Fund’s shares are trading at a discount to net asset value. The Board has directed management of the Fund to repurchase shares of common stock at such times and in such
amounts as management reasonably believes may enhance stockholder value. The Fund is under no obligation to purchase shares at any specific discount levels or in any specific amounts.
During the six months ended June 30, 2023, the Fund did not repurchase any shares. During the year ended December 31, 2022, the Fund repurchased and retired
0.82% of its common shares outstanding under the repurchase plan. The weighted average discount per share on these repurchases was 11.99% for the year ended December 31, 2022. Shares repurchased and the corresponding dollar amount are included
in the Statements of Changes in Net Assets. The anti-dilutive impact of these share repurchases is included in the Financial Highlights.
Since the commencement of
the stock repurchase program through June 30, 2023, the Fund repurchased 500,000 shares or 0.82% of its common shares outstanding for a total amount of $5,175,727.
8. Transactions with affiliated company
As
defined by the 1940 Act, an affiliated company is one in which the Fund owns 5% or more of the outstanding voting securities, or a company which is under common ownership or control with the Fund. The following company was considered an affiliated
company for all or some portion of the six months ended June 30, 2023. The following transactions were effected in such company for the six months ended June 30, 2023.
|
|
|
|
|
|
|
|
|
|
|
|
|
|
|
|
|
|
|
|
|
| |
|
Affiliate
Value at
December 31,
2022 |
|
|
Purchased |
|
|
Sold |
|
| |
|
Cost |
|
|
Shares |
|
|
Proceeds |
|
|
Shares |
|
| Western Asset Premier Institutional Government Reserves, Premium Shares |
|
$ |
6,840,780 |
|
|
$ |
105,515,449 |
|
|
|
105,515,449 |
|
|
$ |
107,148,469 |
|
|
|
107,148,469 |
|
|
|
|
|
|
| Western Asset Emerging Markets Debt Fund Inc. 2023 Semi-Annual Report |
|
|
|
43 |
Notes to financial statements
(unaudited) (cont’d)
|
|
|
|
|
|
|
|
|
|
|
|
|
|
|
|
|
| (cont’d) |
|
Realized
Gain (Loss) |
|
|
Dividend
Income |
|
|
Net Increase
(Decrease) in
Unrealized
Appreciation
(Depreciation) |
|
|
Affiliate
Value at
June 30,
2023 |
|
| Western Asset Premier Institutional Government Reserves, Premium Shares |
|
|
— |
|
|
$ |
112,716 |
|
|
|
— |
|
|
$ |
5,207,760 |
|
9. Deferred capital losses
As of December 31, 2022, the Fund had deferred capital losses of $268,613,130, which have no expiration date, that will be available to offset future taxable
capital gains.
10. Recent accounting pronouncement
In March 2020, the Financial Accounting Standards Board (FASB) issued Accounting Standards Update (ASU) No. 2020-04,
Reference Rate Reform (Topic 848) – Facilitation of the Effects of Reference Rate Reform on Financial Reporting. In January 2021 and December 2022, the FASB issued ASU No. 2021-01 and ASU No. 2022-06, with further amendments to Topic 848. The amendments in the ASUs provide optional temporary accounting recognition and financial reporting relief from the effect of certain types of contract
modifications due to the planned discontinuation of the London Interbank Offered Rate (LIBOR) and other interbank-offered based reference rates as of the end of 2021 for certain LIBOR settings and 2023 for the remainder. The ASUs are effective for
certain reference rate-related contract modifications that occur during the period March 12, 2020 through December 31, 2024. Management has reviewed the requirements and believes the adoption of these ASUs will not have a material impact
on the financial statements.
11. Other matters
The Fund’s investments, payment obligations, and financing terms may be based on floating rates, such as the London Interbank Offered Rate, or “LIBOR,”
which was the offered rate for short-term Eurodollar deposits between major international banks. In 2017, the U.K. Financial Conduct Authority (“FCA”) announced its intention to cease compelling banks to provide the quotations needed to
sustain LIBOR after 2021. In addition, global regulators have announced that, with limited exceptions, no new LIBOR-based contracts should be entered into after 2021. In connection with the global transition away from LIBOR led by regulators and
market participants, LIBOR is no longer published on a representative basis. Alternative references rates have been established in most major currencies. In March 2022, the U.S. federal government enacted legislation to establish a process for
replacing LIBOR in certain existing contracts that do not already provide for the use of a clearly defined or practicable replacement benchmark rate as described in the legislation. Generally speaking, for contracts that do not contain a fallback
provision as described in the legislation, a benchmark replacement recommended by the Federal Reserve Board effectively automatically replaced the USD LIBOR benchmark in the contract upon LIBOR’s cessation at the end of June 2023. The
recommended benchmark replacement is based on
|
|
|
|
|
|
44 |
|
|
|
Western Asset Emerging Markets Debt Fund Inc. 2023 Semi-Annual Report |
the Secured Overnight Financing Rate (SOFR) published by the Federal Reserve Bank of New York,
including certain spread adjustments and benchmark replacement conforming changes. Various industry groups are in the process of facilitating the transition away from LIBOR, but there remains uncertainty regarding the impact of the transition from
LIBOR on the Fund’s transactions and the financial markets generally.
* * *
Russia’s military invasion of Ukraine in February 2022, the resulting responses by the United States and other countries, and the potential for wider conflict could
increase volatility and uncertainty in the financial markets and adversely affect regional and global economies. The United States and other countries have imposed broad-ranging economic sanctions on Russia and certain Russian individuals, banking
entities and corporations as a response to its invasion of Ukraine. The United States and other countries have also imposed economic sanctions on Belarus and may impose sanctions on other countries that support Russia’s military invasion. These
sanctions, as well as any other economic consequences related to the invasion, such as additional sanctions, boycotts or changes in consumer or purchaser preferences or cyberattacks on governments, companies or individuals, may further decrease the
value and liquidity of certain Russian securities and securities of issuers in other countries that are subject to economic sanctions related to the invasion. To the extent that the Fund has exposure to Russian investments or investments in
countries affected by the invasion, the Fund’s ability to price, buy, sell, receive or deliver such investments was impaired. The Fund could determine at any time that certain of the most affected securities have little or no value. In
addition, any exposure that the Fund may have to counterparties in Russia or in countries affected by the invasion could negatively impact the Fund’s portfolio. The extent and duration of Russia’s military actions and the repercussions of
such actions (including any retaliatory actions or countermeasures that may be taken by those subject to sanctions) are impossible to predict, but could result in significant market disruptions, including in the oil and natural gas markets, and may
negatively affect global supply chains, inflation and global growth. These and any related events could significantly impact the Fund’s performance and the value of an investment in the Fund, even beyond any direct exposure the Fund may have to
Russian issuers or issuers in other countries affected by the invasion. At June 30, 2023, the Fund had 0.25% of its net assets invested in securities with significant economic risk or exposure to Russia.
|
|
|
|
|
| Western Asset Emerging Markets Debt Fund Inc. 2023 Semi-Annual Report |
|
|
|
45 |
Board approval of management and subadvisory agreements (unaudited)
Background
The Investment Company Act of 1940,
as amended (the “1940 Act”), requires that the Board of Directors (the “Board”) of Western Asset Emerging Markets Debt Fund Inc. (the “Fund”), including a majority of its members who are not considered to be
“interested persons” under the 1940 Act (the “Independent Directors”) voting separately, approve on an annual basis the continuation of the investment management agreement (the “Management Agreement”) between the Fund
and the Fund’s manager, Legg Mason Partners Fund Advisor, LLC (the “Manager”), and the sub-advisory agreements (individually, a “Sub-Advisory
Agreement,” and collectively, the “Sub-Advisory Agreements”) with the Manager’s affiliates, Western Asset Management Company, LLC (“Western Asset”), Western Asset Management
Company Limited (“Western Asset London”) and Western Asset Management Company Pte. Ltd. (“Western Asset Singapore,” and together with Western Asset and Western Asset London, collectively, the
“Sub-Advisers”), with respect to the Fund.
At an in-person meeting (the
“Contract Renewal Meeting”) held on May 9-10, 2023, the Board, including the Independent Directors, considered and approved the continuation of each of the Management Agreement and the Sub-Advisory Agreements for an additional one-year period. To assist in its consideration of the renewal of each of the Management Agreement and the Sub-Advisory Agreements, the Board received and considered extensive information (together with the information provided at the Contract Renewal Meeting, the “Contract Renewal Information”) about the
Manager and the Sub-Advisers, as well as the management and sub-advisory arrangements for the Fund and the other closed-end funds
in the same complex under the Board’s purview (the “Franklin Templeton/Legg Mason Closed-end Funds”), certain portions of which are discussed below.
A presentation made by the Manager and the Sub-Advisers to the Board at the Contract Renewal Meeting in connection with the
Board’s evaluation of each of the Management Agreement and the Sub-Advisory Agreements encompassed the Fund and other Franklin Templeton/Legg Mason Closed-end
Funds. In addition to the Contract Renewal Information, the Board received performance and other information throughout the year related to the respective services rendered by the Manager and the Sub-Advisers
to the Fund. The Board’s evaluation took into account the information received throughout the year and also reflected the knowledge and experience gained as members of the Boards of the Fund and other Franklin Templeton/Legg Mason Closed-end Funds with respect to the services provided to the Fund by the Manager and the Sub-Advisers. The information received and considered by the Board (including its
various committees) in conjunction with both the Contract Renewal Meeting and throughout the year was both written and oral. The contractual arrangements discussed below are the product of multiple years of review and negotiation and information
received and considered by the Board during each of those years.
|
|
|
|
|
|
46 |
|
|
|
Western Asset Emerging Markets Debt Fund Inc. |
At a meeting held on April 18, 2023, the
Independent Directors, in preparation for the Contract Renewal Meeting, met in a private session with their independent legal counsel to review the Contract Renewal Information regarding the Franklin Templeton/Legg Mason Closed-end Funds, including the Fund, received to date. No representatives of the Manager or the Sub-Advisers participated in this meeting. Following the April 18, 2023
meeting, the Independent Directors submitted certain questions and requests for additional information to Fund management. The Independent Directors also met in private sessions with their independent legal counsel to consider the Contract Renewal
Information and Fund management’s responses to the Independent Directors’ questions and requests for additional information in advance of and during the Contract Renewal Meeting. The discussion below reflects all of these reviews.
The Manager provides the Fund with investment advisory and administrative services pursuant to the Management Agreement and the
Sub-Advisers together provide the Fund with investment sub-advisory services pursuant to the Sub-Advisory Agreements. The
discussion below covers both the advisory and administrative functions being rendered by the Manager, each such function being encompassed by the Management Agreement, and the investment sub-advisory functions
being rendered by the Sub-Advisers pursuant to the Sub-Advisory Agreements.
Board Approval of Management Agreement and Sub-Advisory Agreements
The Independent Directors
were advised by separate independent legal counsel throughout the process. Prior to voting, the Independent Directors received a memorandum discussing the legal standards for their consideration of the proposed continuation of the Management
Agreement and the Sub-Advisory Agreements. The Independent Directors considered the Management Agreement and each Sub-Advisory Agreement separately during the course of
their review. In doing so, they noted the respective roles of the Manager and the Sub-Advisers in providing services to the Fund.
In approving the continuation of the Management Agreement and Sub-Advisory Agreements, the Board, including the Independent
Directors, considered a variety of factors, including those factors discussed below. No single factor reviewed by the Board was identified by the Board as the principal factor in determining whether to approve the continuation of the Management
Agreement and the Sub-Advisory Agreements. Each Director may have attributed different weight to the various factors in evaluating the Management Agreement and the
Sub-Advisory Agreements.
After considering all relevant factors and information, the Board, exercising its reasonable
business judgment, determined that the continuation of the Management Agreement and Sub-Advisory Agreements were in the best interests of the Fund’s shareholders and approved the continuation of each such
agreement for an additional one-year period.
|
|
|
|
|
| Western Asset Emerging Markets Debt Fund Inc. |
|
|
|
47 |
Board approval of management and subadvisory agreements (unaudited) (cont’d)
Nature, Extent and Quality of the Services under the Management Agreement and Sub-Advisory Agreements
The Board received and considered Contract Renewal Information regarding the nature, extent, and quality of services provided to the Fund by the Manager
and the Sub-Advisers under the Management Agreement and the Sub-Advisory Agreements, respectively, during the past year. The Board noted information received at regular
meetings throughout the year related to the services provided by the Manager in its management of the Fund’s affairs and the Manager’s role in coordinating the activities of the Sub-Advisers and the
Fund’s other service providers. The Board observed that the scope of services provided by the Manager and the Sub-Advisers, and of the undertakings required of the Manager and Sub-Advisers in connection with those services, including maintaining and monitoring their respective compliance programs as well as the Fund’s compliance programs, had expanded over time as a result of
regulatory, market and other developments. The Board also noted that on a regular basis it received and reviewed information from the Manager and the Sub-Advisers regarding the Fund’s compliance policies
and procedures established pursuant to Rule 38a-1 under the 1940 Act. The Board also considered the risks borne by the Manager, the Sub-Advisers and their respective
affiliates on behalf of the Fund, including entrepreneurial, operational, reputational, litigation and regulatory risks, as well as the Manager’s and the Sub-Advisers’ risk management processes.
The Board reviewed the qualifications, backgrounds, and responsibilities of the Manager’s senior personnel and the
Sub-Advisers’ portfolio management teams primarily responsible for the day-to-day portfolio management of the Fund. The
Board also considered, based on its knowledge of the Manager and its affiliates, the financial resources of Franklin Resources, Inc., the parent organization of the Manager and the Sub-Advisers. The Board
recognized the importance of having a fund manager with significant resources.
The Board considered the division of responsibilities between the Manager and the Sub-Advisers under the Management Agreement and the Sub-Advisory Agreements, respectively, including the Manager’s coordination and oversight of the services provided to
the Fund by the Sub-Advisers and other fund service providers and Western Asset’s coordination and oversight of the services provided to the Fund by Western Asset London and Western Asset Singapore. The
Management Agreement permits the Manager to delegate certain of its responsibilities, including its investment advisory duties thereunder, provided that the Manager, in each case, will supervise the activities of the delegee.
In reaching its determinations regarding continuation of the Management Agreement and the Sub-Advisory Agreements, the Board took
into account that Fund stockholders, in pursuing their investment goals and objectives, may have purchased their shares of the
|
|
|
|
|
|
48 |
|
|
|
Western Asset Emerging Markets Debt Fund Inc. |
Fund based upon the reputation and the investment
style, philosophy and strategy of the Manager and the Sub-Advisers, as well as the resources available to the Manager and the Sub-Advisers.
The Board concluded that, overall, the nature, extent, and quality of the management and other services provided (and expected to be provided) to the Fund, under the
Management Agreement and the Sub-Advisory Agreements were satisfactory.
Fund Performance
The Board received and considered information regarding Fund performance, including information and analyses (the “Broadridge Performance
Information”) for the Fund, as well as for a group of comparable funds (the “Performance Universe”) selected by Broadridge Financial Solutions, Inc. (“Broadridge”), an independent third-party provider of investment company
data. The Board was provided with a description of the methodology Broadridge used to determine the similarity of the Fund with the funds included in the Performance Universe. It was noted that while the Board found the Broadridge Performance
Information generally useful, they recognized its limitations, including that the data may vary depending on the end date selected, and that the results of the performance comparisons may vary depending on the selection of the peer group and its
composition over time. The Board also noted that Board members had received and discussed with the Manager and the Sub-Advisers information throughout the year at periodic intervals comparing the Fund’s
performance against its benchmark and against the Fund’s peers. In addition, the Board considered the Fund’s performance in view of overall financial market conditions.
The Broadridge Performance Information comparing the Fund’s performance to that of its Performance Universe, consisting of the Fund and all leveraged closed-end emerging markets hard currency debt funds, regardless of asset size, showed, among other data, that based on net asset value per share, the Fund’s performance was above the median for the 1-, 3-, 5- and 10-year periods ended December 31, 2022. The Board noted the explanations
from the Manager and the Sub-Advisers regarding the Fund’s relative performance versus the Performance Universe for the various periods. The Board also noted the limited size of the Performance Universe.
Based on the reviews and discussions of Fund performance and considering other relevant factors, including those noted above, the Board concluded, under the
circumstances, that continuation of the Management Agreement and the Sub-Advisory Agreements for an additional one-year period would be consistent with the interests of
the Fund and its stockholders.
Management and Sub-Advisory Fees and Expense Ratios
The Board reviewed and considered the contractual management fee (the “Contractual Management Fee”) and the actual management fee (the “Actual Management
Fee”)
|
|
|
|
|
| Western Asset Emerging Markets Debt Fund Inc. |
|
|
|
49 |
Board approval of management and subadvisory agreements (unaudited) (cont’d)
payable by the Fund to the Manager under the Management Agreement and the sub-advisory fees (the
“Sub-Advisory Fees”) payable by the Manager to the Sub-Advisers under the Sub-Advisory Agreements in view of the
nature, extent and overall quality of the management, investment advisory and other services provided by the Manager and the Sub-Advisers, respectively. The Board noted that the
Sub-Advisory Fee payable to Western Asset under its Sub-Advisory Agreement with the Manager is paid by the Manager, not the Fund, and, accordingly, that the retention of
Western Asset does not increase the fees or expenses otherwise incurred by the Fund’s stockholders. Similarly, the Board noted that the Sub-Advisory Fees payable to Western Asset London and Western Asset
Singapore under their respective Sub-Advisory Agreements with Western Asset are paid by Western Asset, not the Fund, and, accordingly, that the retention of Western Asset London and Western Asset Singapore
does not increase the fees or expenses otherwise incurred by the Fund’s stockholders.
In addition, the Board received and considered information and analyses
prepared by Broadridge (the “Broadridge Expense Information”) comparing the Contractual Management Fee and the Actual Management Fee and the Fund’s total actual expenses with those of funds in an expense universe (the “Expense
Universe”) selected and provided by Broadridge. The comparison was based upon the constituent funds’ latest fiscal years. It was noted that while the Board found the Broadridge Expense Information generally useful, they recognized its
limitations, including that the data may vary depending on the selection of the peer group.
The Broadridge Expense Information showed that the Fund’s
Contractual Management Fee was below the median. The Broadridge Expense Information also showed that the Fund’s Actual Management Fee was below the median compared on the basis of both common share assets and leveraged assets. The Broadridge
Expense Information also showed that the Fund’s actual total expenses were below the median on the basis of both common share assets and leveraged assets. The Board took into account management’s discussion of the Fund’s expenses and
noted the limited size of the Expense Universe.
The Board also reviewed Contract Renewal Information regarding fees charged by the Manager and/or the Sub-Advisers to other U.S. clients investing primarily in an asset class similar to that of the Fund, including, where applicable, institutional and separate accounts. The Manager reviewed with the Board the
differences in services provided to these different types of accounts, noting that the Fund is provided with certain administrative services, office facilities, and Fund officers, and that the Fund is subject not only to heightened regulatory
requirements relative to institutional clients but also to requirements for listing on the New York Stock Exchange, and that the Manager coordinates and oversees the provision of services to the Fund by other fund service providers. The Board
|
|
|
|
|
|
50 |
|
|
|
Western Asset Emerging Markets Debt Fund Inc. |
considered the fee comparisons in view of the
different services provided in managing these other types of clients and funds.
The Board considered the overall management fee, the fees of the Sub-Advisers and the amount of the management fee retained by the Manager after payment of the subadvisory fees in each case in view of the services rendered for those amounts. The Board also received an analysis of
complex-wide management fees provided by the Manager, which, among other things, set out a framework of fees based on asset classes.
Taking all of the above into
consideration, as well as the factors identified below, the Board determined that the management fee and the Sub-Advisory Fees were reasonable in view of the nature, extent and overall quality of the
management, investment advisory and other services provided by the Manager and the Sub-Advisers to the Fund under the Management Agreement and the Sub-Advisory
Agreements, respectively.
Manager Profitability
The Board, as part of the Contract Renewal Information, received an analysis of the profitability to the Manager and its affiliates in providing services to the Fund for
the Manager’s fiscal years ended September 30, 2022 and September 30, 2021. The Board also received profitability information with respect to the Franklin Templeton/Legg Mason fund complex as a whole. In addition, the Board received
Contract Renewal Information with respect to the Manager’s revenue and cost allocation methodologies used in preparing such profitability data. It was noted that the allocation methodologies had been reviewed by an outside consultant. The
profitability to each of the Sub-Advisers was not considered to be a material factor in the Board’s considerations since the Sub-Advisory Fee is paid by the Manager
in the case of Western Asset and by Western Asset in the case of Western Asset London and Western Asset Singapore, not the Fund, although the Board noted the affiliation of the Manager with the Sub-Advisers.
The profitability of the Manager and its affiliates was considered by the Board to be reasonable in view of the nature, extent and quality of services provided to the Fund.
Economies of Scale
The Board received and
discussed Contract Renewal Information concerning whether the Manager realizes economies of scale if the Fund’s assets grow. The Board noted that because the Fund is a closed-end fund it has limited
ability to increase its assets. The Board determined that the management fee structure was appropriate under the circumstances. For similar reasons as stated above with respect to the Sub-Advisers’
profitability and the costs of the Sub-Advisers’ provision of services, the Board did not consider the potential for economies of scale in the Sub-Advisers’
management of the Fund to be a material factor in the Board’s consideration of the Sub-Advisory Agreements.
|
|
|
|
|
| Western Asset Emerging Markets Debt Fund Inc. |
|
|
|
51 |
Board approval of management and subadvisory agreements (unaudited) (cont’d)
Other Benefits to the Manager and the Sub-Advisers
The Board considered other benefits received by the Manager, the Sub-Advisers and their affiliates as a result of their
relationship with the Fund, including the opportunity to offer additional products and services to the Fund’s shareholders. In view of the costs of providing investment management and other services to the Fund and the ongoing commitment of the
Manager and the Sub-Advisers to the Fund, the Board considered that the ancillary benefits that the Manager and its affiliates, including the Sub-Advisers, were
reasonable.
|
|
|
|
|
|
52 |
|
|
|
Western Asset Emerging Markets Debt Fund Inc. |
Dividend reinvestment plan (unaudited)
Unless you elect to receive distributions in cash (i.e., opt-out), all dividends, including any capital gain dividends and return
of capital distributions, on your Common Stock will be automatically reinvested by Computershare Trust Company, N.A., as agent for the stockholders (the “Plan Agent”), in additional shares of Common Stock under the Fund’s Dividend
Reinvestment Plan (the “Plan”). You may elect not to participate in the Plan by contacting the Plan Agent. If you do not participate, you will receive all cash distributions paid by check mailed directly to you by Computershare Trust
Company, N.A., as dividend paying agent.
If you participate in the Plan, the number of shares of Common Stock you will receive will be determined as follows:
(1) If the market price of the Common Stock (plus $0.03 per share commission) on the payment date (or, if the payment date is not a NYSE trading
day, the immediately preceding trading day) is equal to or exceeds the net asset value per share of the Common Stock at the close of trading on the NYSE on the payment date, the Fund will issue new Common Stock at a price equal to the greater of
(a) the net asset value per share at the close of trading on the NYSE on the payment date or (b) 95% of the market price per share of the Common Stock on the payment date.
(2) If the net asset value per share of the Common Stock exceeds the market price of the Common Stock (plus $0.03 per share commission) at the close of
trading on the NYSE on the payment date, the Plan Agent will receive the dividend or distribution in cash and will buy Common Stock in the open market, on the NYSE or elsewhere, for your account as soon as practicable commencing on the trading day
following the payment date and terminating no later than the earlier of (a) 30 days after the dividend or distribution payment date, or (b) the payment date for the next succeeding dividend or distribution to be made to the stockholders; except
when necessary to comply with applicable provisions of the federal securities laws. If during this period: (i) the market price (plus $0.03 per share commission) rises so that it equals or exceeds the net asset value per share of the Common
Stock at the close of trading on the NYSE on the payment date before the Plan Agent has completed the open market purchases or (ii) if the Plan Agent is unable to invest the full amount eligible to be reinvested in open market purchases, the
Plan Agent will cease purchasing Common Stock in the open market and the Fund shall issue the remaining Common Stock at a price per share equal to the greater of (a) the net asset value per share at the close of trading on the NYSE on the day
prior to the issuance of shares for reinvestment or (b) 95% of the then current market price per share.
Common Stock in your account will be held by the Plan Agent
in non-certificated form. Any proxy you receive will include all shares of Common Stock you have received under the Plan. You may withdraw from the Plan (i.e., opt-out)
by notifying the Plan Agent in writing at P.O. Box 43006, Providence, RI 02940-3078 or by calling the Plan Agent at
1-888-888-0151. Such withdrawal will be effective immediately if notice is received by the Plan Agent not less than ten business
days prior to any dividend or distribution record date; otherwise such
|
|
|
|
|
| Western Asset Emerging Markets Debt Fund Inc. |
|
|
|
53 |
Dividend reinvestment plan
(unaudited) (cont’d)
withdrawal will be effective as soon as practicable after the Plan Agent’s investment of the
most recently declared dividend or distribution on the Common Stock.
Plan participants who sell their shares will be charged a service charge (currently $5.00 per
transaction) and the Plan Agent is authorized to deduct brokerage charges actually incurred from the proceeds (currently $0.05 per share commission). There is no service charge for reinvestment of your dividends or distributions in Common Stock.
However, all participants will pay a pro rata share of brokerage commissions incurred by the Plan Agent when it makes open market purchases. Because all dividends and distributions will be automatically reinvested in additional shares of Common
Stock, this allows you to add to your investment through dollar cost averaging, which may lower the average cost of your Common Stock over time. Dollar cost averaging is a technique for lowering the average cost per share over time if the
Fund’s net asset value declines. While dollar cost averaging has definite advantages, it cannot assure profit or protect against loss in declining markets.
Automatically reinvesting dividends and distributions does not mean that you do not have to pay income taxes due upon receiving dividends and distributions. Investors
will be subject to income tax on amounts reinvested under the Plan.
The Fund reserves the right to amend or terminate the Plan if, in the judgment of the Board of
Directors, the change is warranted. The Plan may be terminated, amended or supplemented by the Fund upon notice in writing mailed to stockholders at least 30 days prior to the record date for the payment of any dividend or distribution by the Fund
for which the termination or amendment is to be effective. Upon any termination, you will be sent cash for any fractional share of Common Stock in your account. You may elect to notify the Plan Agent in advance of such termination to have the Plan
Agent sell part or all of your Common Stock on your behalf. Additional information about the Plan and your account may be obtained from the Plan Agent at P.O. Box 43006, Providence, RI 02940-3078 or by calling the Plan Agent at 1-888-888-0151.
|
|
|
|
|
|
54 |
|
|
|
Western Asset Emerging Markets Debt Fund Inc. |
Western Asset
Emerging Markets Debt Fund Inc.
Directors
Robert D. Agdern
Carol L. Colman
Daniel P. Cronin
Paolo M. Cucchi
Eileen A. Kamerick
Nisha Kumar
Jane Trust
Chairman
Officers
Jane Trust
President and Chief Executive Officer
Christopher Berarducci
Treasurer and Principal Financial Officer
Fred Jensen
Chief Compliance Officer
George P. Hoyt
Secretary and Chief Legal Officer
Thomas C. Mandia
Senior Vice President
Jeanne M. Kelly
Senior Vice President
Western Asset Emerging Markets Debt Fund Inc.
620
Eighth Avenue
47th Floor
New York, NY 10018
Investment manager
Legg Mason Partners Fund
Advisor, LLC
Subadvisers
Western Asset
Management Company, LLC
Western Asset Management Company Limited
Western Asset
Management Company Pte. Ltd.
Custodian
The
Bank of New York Mellon
Transfer agent
Computershare Inc.
P.O. Box 43006
Providence, RI 02940-3078
Independent registered public
accounting firm
PricewaterhouseCoopers LLP
Baltimore, MD
Legal counsel
Simpson Thacher & Bartlett
LLP
900 G Street NW
Washington, DC 20001
New York Stock Exchange Symbol
EMD
Legg Mason Funds Privacy and Security Notice
Your Privacy and the Security of Your Personal Information is Very
Important to the Legg Mason Funds
This Privacy and Security Notice (the “Privacy Notice”) addresses the Legg Mason Funds’ privacy and
data protection practices with respect to nonpublic personal information the Funds receive. The Legg Mason Funds include the Western Asset Money Market Funds sold by the Funds’ distributor, Franklin Distributors, LLC, as well as Legg
Mason-sponsored closed-end funds. The provisions of this Privacy Notice apply to your information both while you are a shareholder and after you are no longer invested with the Funds.
The Type of Nonpublic Personal Information the Funds Collect About You
The Funds collect and maintain nonpublic personal information about you in connection with your shareholder account. Such information may include, but is not limited
to:
| • |
|
Personal information included on applications or other forms; |
| • |
|
Account balances, transactions, and mutual fund holdings and positions; |
| • |
|
Bank account information, legal documents, and identity verification documentation; and |
| • |
|
Online account access user IDs, passwords, security challenge question responses. |
How the Funds Use Nonpublic Personal Information About You
The Funds do not sell or share your nonpublic personal information with third parties or with affiliates for their marketing purposes, unless you have authorized the
Funds to do so. The Funds do not disclose any nonpublic personal information about you except as may be required to perform transactions or services you have authorized or as permitted or required by law.
The Funds may disclose information about you to:
| • |
|
Employees, agents, and affiliates on a “need to know” basis to enable the Funds to conduct ordinary business or
to comply with obligations to government regulators; |
| • |
|
Service providers, including the Funds’ affiliates, who assist the Funds as part of the ordinary course of business
(such as printing, mailing services, or processing or servicing your account with us) or otherwise perform services on the Funds’ behalf, including companies that may perform statistical analysis, market research and marketing services solely
for the Funds; |
| • |
|
Permit access to transfer, whether in the United States or countries outside of the United States to such Funds’
employees, agents and affiliates and service providers as required to enable the Funds to conduct ordinary business, or to comply with obligations to government regulators; |
| • |
|
The Funds’ representatives such as legal counsel, accountants and auditors to enable the Funds to conduct ordinary
business, or to comply with obligations to government regulators; |
| • |
|
Fiduciaries or representatives acting on your behalf, such as an IRA custodian or trustee of a grantor trust.
|
|
| NOT PART OF THE SEMI-ANNUAL
REPORT |
Legg Mason Funds Privacy and Security Notice (cont’d)
Except as otherwise permitted by applicable law, companies acting on the Funds’ behalf,
including those outside the United States, are contractually obligated to keep nonpublic personal information the Funds provide to them confidential and to use the information the Funds share only to provide the services the Funds ask them to
perform.
The Funds may disclose nonpublic personal information about you when necessary to enforce their rights or protect against fraud, or as permitted or
required by applicable law, such as in connection with a law enforcement or regulatory request, subpoena, or similar legal process. In the event of a corporate action or in the event a Fund service provider changes, the Funds may be required to
disclose your nonpublic personal information to third parties. While it is the Funds’ practice to obtain protections for disclosed information in these types of transactions, the Funds cannot guarantee their privacy policy will remain
unchanged.
Keeping You Informed of the Funds’ Privacy and Security Practices
The Funds will notify you annually of their privacy policy as required by federal law. While the Funds reserve the right to modify this policy at any time, they will
notify you promptly if this privacy policy changes.
The Funds’ Security Practices
The Funds maintain appropriate physical, electronic and procedural safeguards designed to guard your nonpublic personal information. The Funds’ internal data
security policies restrict access to your nonpublic personal information to authorized employees, who may use your nonpublic personal information for Fund business purposes only.
Although the Funds strive to protect your nonpublic personal information, they cannot ensure or warrant the security of any information you provide or transmit to them,
and you do so at your own risk. In the event of a breach of the confidentiality or security of your nonpublic personal information, the Funds will attempt to notify you as necessary so you can take appropriate protective steps. If you have consented
to the Funds using electronic communications or electronic delivery of statements, they may notify you under such circumstances using the most current email address you have on record with them.
In order for the Funds to provide effective service to you, keeping your account information accurate is very important. If you believe that your account information is
incomplete, not accurate or not current, if you have questions about the Funds’ privacy practices, or our use of your nonpublic personal information, write the Funds using the contact information on your account statements, email the Funds by
clicking on the Contact Us section of the Funds’ website at www.franklintempleton.com, or contact the Funds at
1-877-721-1926 for the Western Asset Money Market Funds or 1-888-777-0102 for the Legg Mason-sponsored closed-end funds.
Revised
October 2022
|
| NOT PART OF THE SEMI-ANNUAL
REPORT |
Legg Mason Funds Privacy and Security Notice (cont’d)
Legg Mason California Consumer Privacy Act Policy
Although much of the personal information we collect is “nonpublic personal information” subject to federal law, residents of California may, in certain
circumstances, have additional rights under the California Consumer Privacy Act (“CCPA”). For example, if you are a broker, dealer, agent, fiduciary, or representative acting by or on behalf of, or for, the account of any other person(s)
or household, or a financial advisor, or if you have otherwise provided personal information to us separate from the relationship we have with personal investors, the provisions of this Privacy Policy apply to your personal information (as defined
by the CCPA).
In addition to the provisions of the Legg Mason Funds Security and Privacy Notice, you may have the right to know the categories and specific pieces
of personal information we have collected about you.
You also have the right to request the deletion of the personal information collected or maintained by the
Funds.
If you wish to exercise any of the rights you have in respect of your personal information, you should advise the Funds by contacting them as set forth
below. The rights noted above are subject to our other legal and regulatory obligations and any exemptions under the CCPA. You may designate an authorized agent to make a rights request on your behalf, subject to the identification process described
below. We do not discriminate based on requests for information related to our use of your personal information, and you have the right not to receive discriminatory treatment related to the exercise of your privacy rights.
We may request information from you in order to verify your identity or authority in making such a request. If you have appointed an authorized agent to make a request
on your behalf, or you are an authorized agent making such a request (such as a power of attorney or other written permission), this process may include providing a password/passcode, a copy of government issued identification, affidavit or other
applicable documentation, i.e. written permission. We may require you to verify your identity directly even when using an authorized agent, unless a power of attorney has been provided. We reserve the right to deny a request submitted by an agent if
suitable and appropriate proof is not provided.
For the 12-month period prior to the date of this Privacy Policy, the Legg
Mason Funds have not sold any of your personal information; nor do we have any plans to do so in the future.
Contact Information
Address: Data Privacy Officer, 100 International Dr., Baltimore, MD 21202
Email: DataProtectionOfficer@franklintempleton.com
Phone: 1-800-396-4748
Revised October 2022
|
| NOT PART OF THE SEMI-ANNUAL
REPORT |
Western Asset Emerging Markets Debt Fund Inc.
Western Asset Emerging Markets Debt Fund Inc.
620 Eighth Avenue
47th Floor
New York, NY 10018
Notice is hereby given in accordance with Section 23(c) of the Investment Company Act of 1940, as amended, that from time to time the Fund may purchase, at market
prices, shares of its stock.
The Fund files its complete schedule of portfolio holdings with the Securities and Exchange Commission (“SEC”) for the first
and third quarters of each fiscal year as an exhibit to its reports on Form N-PORT. The Fund’s Forms N-PORT are available on the SEC’s website at www.sec.gov.
To obtain information on Form N-PORT, shareholders can call the Fund at 1-888-777-0102.
Information on how the Fund voted proxies relating to portfolio securities during the prior 12-month period ended June 30th
of each year and a description of the policies and procedures that the Fund uses to determine how to vote proxies related to portfolio transactions are available (1) without charge, upon request, by calling 1-888-777-0102, (2) at www.franklintempleton.com and (3) on the SEC’s website at www.sec.gov.
Quarterly performance, semi-annual and annual reports, current net asset value and other information regarding the Fund may be found on Franklin Templeton’s website,
which can be accessed at www.franklintempleton.com. Any reference to Franklin Templeton’s website in this report is intended to allow investors public access to information regarding the Fund and does not, and is not intended to, incorporate
Franklin Templeton’s website in this report.
This report is transmitted to the shareholders of Western Asset Emerging Markets Debt Fund Inc. for their
information. This is not a prospectus, circular or representation intended for use in the purchase of shares of the Fund or any securities mentioned in this report.
Computershare Inc.
P.O. Box 43006
Providence, RI 02940-3078
WAS04052 08/23 SR23-4709
Not applicable.
| ITEM 3. |
AUDIT COMMITTEE FINANCIAL EXPERT. |
Not applicable.
| ITEM 4. |
PRINCIPAL ACCOUNTANT FEES AND SERVICES. |
Not applicable.
| ITEM 5. |
AUDIT COMMITTEE OF LISTED REGISTRANTS. |
Not applicable.
| ITEM 6. |
SCHEDULE OF INVESTMENTS. |
Included herein under Item 1.
| ITEM 7. |
DISCLOSURE OF PROXY VOTING POLICIES AND PROCEDURES FOR CLOSED-END
MANAGEMENT INVESTMENT COMPANIES. |
Not applicable.
| ITEM 8. |
INVESTMENT PROFESSIONALS OF CLOSED-END MANAGEMENT INVESTMENT COMPANIES.
|
Not applicable.
| ITEM 9. |
PURCHASES OF EQUITY SECURITIES BY CLOSED-END MANAGEMENT INVESTMENT
COMPANY AND AFFILIATED PURCHASERS. |
Not applicable.
| ITEM 10. |
SUBMISSION OF MATTERS TO A VOTE OF SECURITY HOLDERS. |
Not applicable.
| ITEM 11. |
CONTROLS AND PROCEDURES. |
| |
(a) |
The registrant’s principal executive officer and principal financial officer have concluded that the
registrant’s disclosure controls and procedures (as defined in Rule 30a- 3(c) under the Investment Company Act of 1940, as amended (the “1940 Act”)) are effective as of a date within 90 days of
the filing date of this report that includes the disclosure required by this paragraph, based on their evaluation of the disclosure controls and procedures required by Rule 30a-3(b) under the 1940 Act and 15d-15(b) under the Securities Exchange Act of 1934. |
| |
(b) |
There were no changes in the registrant’s internal control over financial reporting (as defined in Rule 30a-3(d) under the 1940 Act) that occurred during the period covered by this report that have materially affected, or are likely to materially affect the registrant’s internal control over financial reporting.
|
| ITEM 12. |
DISCLOSURE OF SECURITIES LENDING ACTIVITIES FOR CLOSED-END MANAGEMENT
INVESTMENT COMPANIES. |
Not applicable
(a) (1) Not applicable.
Exhibit
99.CODE ETH
(a) (2)
Certifications pursuant to section 302 of the Sarbanes-Oxley Act of 2002 attached hereto.
Exhibit 99.CERT
(b) Certifications pursuant to Section 906 of the Sarbanes-Oxley Act of 2002 attached hereto.
Exhibit 99.906CERT
SIGNATURES
Pursuant to the requirements of the Securities Exchange Act of 1934 and the Investment Company Act of 1940, the registrant has duly caused this
Report to be signed on its behalf by the undersigned, there unto duly authorized.
Western Asset Emerging Markets Debt Fund Inc.
|
|
|
| By: |
|
/s/ Jane Trust |
|
|
Jane Trust |
|
|
Chief Executive Officer |
|
|
| Date: |
|
August 23, 2023 |
Pursuant to the requirements of the Securities Exchange Act of 1934 and the Investment Company Act of 1940,
this report has been signed below by the following persons on behalf of the registrant and in the capacities and on the dates indicated.
|
|
|
| By: |
|
/s/ Jane Trust |
|
|
Jane Trust |
|
|
Chief Executive Officer |
|
|
| Date: |
|
August 23, 2023 |
|
|
| By: |
|
/s/ Christopher Berarducci |
|
|
Christopher Berarducci |
|
|
Principal Financial Officer |
|
|
| Date: |
|
August 23, 2023 |
CERTIFICATIONS PURSUANT TO SECTION 302
EX-99.CERT
CERTIFICATIONS
I, Jane Trust, certify that:
| 1. |
I have reviewed this report on Form N-CSR of Western Asset Emerging
Markets Debt Fund Inc.; |
| 2. |
Based on my knowledge, this report does not contain any untrue statement of a material fact or omit to state a
material fact necessary to make the statements made, in light of the circumstances under which such statements were made, not misleading with respect to the period covered by this report; |
| 3. |
Based on my knowledge, the financial statements, and other financial information included in this report,
fairly present in all material respects the financial condition, results of operations, changes in net assets, and cash flows (if the financial statements are required to include a statement of cash flows) of the registrant as of, and for, the
periods presented in this report; |
| 4. |
The registrant’s other certifying officers and I are responsible for establishing and maintaining
disclosure controls and procedures (as defined in Rule 30a-3(c) under the Investment Company Act of 1940) and internal control over financial reporting (as defined in Rule
30a-3(d) under the Investment Company Act of 1940) for the registrant and have: |
| |
a) |
Designed such disclosure controls and procedures, or caused such disclosure controls and procedures to be
designed under our supervision, to ensure that material information relating to the registrant, including its consolidated subsidiaries, is made known to us by others within those entities, particularly during the period in which this report is
being prepared; |
| |
b) |
Designed such internal control over financial reporting, or caused such internal control over financial
reporting to be designed under our supervision, to provide reasonable assurance regarding the reliability of financial reporting and the preparation of financial statements for external purposes in accordance with generally accepted accounting
principles; |
| |
c) |
Evaluated the effectiveness of the registrant’s disclosure controls and procedures and presented in this
report our conclusions about the effectiveness of the disclosure controls and procedures, as of a date within 90 days prior to the filing date of this report based on such evaluation; and |
| |
d) |
Disclosed in this report any change in the registrant’s internal control over financial reporting that
occurred during the period covered by this report that has materially affected, or is reasonably likely to materially affect, the registrant’s internal control over financial reporting; and |
| 5. |
The registrant’s other certifying officers and I have disclosed to the registrant’s auditors and the
audit committee of the registrant’s board of directors (or persons performing the equivalent functions): |
| |
a) |
All significant deficiencies and material weaknesses in the design or operation of internal control over
financial reporting which are reasonably likely to adversely affect the registrant’s ability to record, process, summarize, and report financial information; and |
| |
b) |
Any fraud, whether or not material, that involves management or other employees who have a significant role in
the registrant’s internal control over financial reporting. |
|
|
|
|
|
|
|
| Date: August 23, 2023 |
|
|
|
|
|
/s/ Jane Trust |
|
|
|
|
|
|
Jane Trust |
|
|
|
|
|
|
Chief Executive Officer |
CERTIFICATIONS
I, Christopher Berarducci, certify that:
| 1. |
I have reviewed this report on Form N-CSR of Western Asset Emerging
Markets Debt Fund Inc.; |
| 2. |
Based on my knowledge, this report does not contain any untrue statement of a material fact or omit to state a
material fact necessary to make the statements made, in light of the circumstances under which such statements were made, not misleading with respect to the period covered by this report; |
| 3. |
Based on my knowledge, the financial information included in this report, and the financial statements on which
the financial information is based, fairly present in all material respects the financial condition, results of operations, changes in net assets, and cash flows (if the financial statements are required to include a statement of cash flows) of the
registrant as of, and for, the periods presented in this report; |
| 4. |
The registrant’s other certifying officers and I are responsible for establishing and maintaining
disclosure controls and procedures (as defined in Rule 30a-3(c) under the Investment Company Act of 1940) and internal control over financial reporting (as defined in Rule
30a-3(d) under the Investment Company Act of 1940) for the registrant and have: |
| |
a) |
Designed such disclosure controls and procedures, or caused such disclosure controls and procedures to be
designed under our supervision, to ensure that material information relating to the registrant, including its consolidated subsidiaries, is made known to us by others within those entities, particularly during the period in which this report is
being prepared; |
| |
b) |
Designed such internal control over financial reporting, or caused such internal control over financial
reporting to be designed under our supervision, to provide reasonable assurance regarding the reliability of financial reporting and the preparation of financial statements for external purposes in accordance with generally accepted accounting
principles; |
| |
c) |
Evaluated the effectiveness of the registrant’s disclosure controls and procedures and presented in this
report our conclusions about the effectiveness of the disclosure controls and procedures, as of a date within 90 days prior to the filing date of this report based on such evaluation; and |
| |
d) |
Disclosed in this report any change in the registrant’s internal control over financial reporting that
occurred during the period covered by this report that has materially affected, or is reasonably likely to materially affect, the registrant’s internal control over financial reporting; and |
| 5. |
The registrant’s other certifying officers and I have disclosed to the registrant’s auditors and the
audit committee of the registrant’s board of directors (or persons performing the equivalent functions): |
| |
a) |
All significant deficiencies and material weaknesses in the design or operation of internal control over
financial reporting which are reasonably likely to adversely affect the registrant’s ability to record, process, summarize, and report financial information; and |
| |
b) |
Any fraud, whether or not material, that involves management or other employees who have a significant role in
the registrant’s internal control over financial reporting. |
|
|
|
|
|
|
|
| Date: August 23, 2023 |
|
|
|
|
|
/s/ Christopher Berarducci |
|
|
|
|
|
|
Christopher Berarducci |
|
|
|
|
|
|
Principal Financial Officer |
CERTIFICATIONS PURSUANT TO SECTION 906
EX-99.906CERT
CERTIFICATION
Jane Trust, Chief
Executive Officer, and Christopher Berarducci, Principal Financial Officer of Western Asset Emerging Markets Debt Fund Inc. (the “Registrant”), each certify to the best of their knowledge that:
1. The Registrant’s periodic report on Form N-CSR for the period ended June 30, 2023 (the
“Form N-CSR”) fully complies with the requirements of section 15(d) of the Securities Exchange Act of 1934, as amended; and
2. The information contained in the Form N-CSR fairly presents, in all material respects, the financial
condition and results of operations of the Registrant.
|
|
|
|
|
| Chief Executive Officer |
|
|
|
Principal Financial Officer |
| Western Asset Emerging Markets Debt Fund Inc. |
|
|
|
Western Asset Emerging Markets Debt Fund Inc. |
|
|
|
| /s/ Jane Trust |
|
|
|
/s/ Christopher Berarducci |
| Jane Trust |
|
|
|
Christopher Berarducci |
| Date: August 23, 2023 |
|
|
|
Date: August 23, 2023 |
This certification is being furnished to the Securities and Exchange Commission solely pursuant to 18 U.S.C. § 1350 and
is not being filed as part of the Form N-CSR with the Commission.
Western Asset Emerging M... (NYSE:EMD)
과거 데이터 주식 차트
부터 1월(1) 2025 으로 2월(2) 2025

Western Asset Emerging M... (NYSE:EMD)
과거 데이터 주식 차트
부터 2월(2) 2024 으로 2월(2) 2025

