AMERICAN FINANCIAL GROUP INC false 0001042046 0001042046 2024-08-06 2024-08-06 0001042046 us-gaap:CommonStockMember 2024-08-06 2024-08-06 0001042046 afg:Five875SubordinatedDebenturesDueMarch302059Member 2024-08-06 2024-08-06 0001042046 afg:Five125SubordinatedDebenturesDueDecember152059Member 2024-08-06 2024-08-06 0001042046 afg:Five625SubordinatedDebenturesDueJune12060Member 2024-08-06 2024-08-06 0001042046 afg:Four5SubordinatedDebenturesDueSeptember152060Member 2024-08-06 2024-08-06
UNITED STATES
SECURITIES AND EXCHANGE COMMISSION
Washington, D.C. 20549
FORM 8-K
CURRENT REPORT
Pursuant to Section 13 OR 15(d) of
The Securities Exchange Act of 1934
Date of Report (Date of earliest event reported): August 6, 2024
AMERICAN FINANCIAL GROUP, INC.
(Exact name of registrant as specified in its charter)
|
|
|
|
|
| Ohio |
|
1-13653 |
|
31-1544320 |
| (State or other jurisdiction of incorporation) |
|
(Commission File Number) |
|
(IRS Employer Identification No.) |
|
|
|
| 301 East Fourth Street, Cincinnati, OH |
|
45202 |
| (Address of principal executive offices) |
|
(Zip Code) |
Registrant’s telephone number, including area code: 513-579-2121
Check the appropriate box below if the Form 8-K filing is intended to simultaneously satisfy the filing obligation of the registrant under any of the following provisions (see General Instruction A.2. below):
| ☐ |
Written communications pursuant to Rule 425 under the Securities Act (17 CFR 230.425) |
| ☐ |
Soliciting material pursuant to Rule 14a-12 under the Exchange Act (17 CFR 240.14a-12) |
| ☐ |
Pre-commencement communications pursuant to Rule 14d-2(b) under the Exchange Act (17 CFR 240.14d-2(b)) |
| ☐ |
Pre-commencement communications pursuant to Rule 13e-4(c) under the Exchange Act (17 CFR 240.13e-4(c)) Securities registered pursuant to Section 12(b) of the Act: |
|
|
|
|
|
| Title of each class |
|
Trading
Symbol(s) |
|
Name of each exchange on which registered |
| Common Stock |
|
AFG |
|
New York Stock Exchange |
| 5.875% Subordinated Debentures due March 30, 2059 |
|
AFGB |
|
New York Stock Exchange |
| 5.125% Subordinated Debentures due December 15, 2059 |
|
AFGC |
|
New York Stock Exchange |
| 5.625% Subordinated Debentures due June 1, 2060 |
|
AFGD |
|
New York Stock Exchange |
| 4.5% Subordinated Debentures due September 15, 2060 |
|
AFGE |
|
New York Stock Exchange |
Indicate by check mark whether the registrant is an emerging growth company as defined in Rule 405 of the Securities Act of 1933 (§230.405 of this chapter) or Rule 12b-2 of the Securities Exchange Act of 1934 (§240.12b-2 of this chapter).
Emerging growth company ☐
If an emerging growth company, indicate by check mark if the registrant has elected not to use the extended transition period for complying with any new or revised financial accounting standards provided pursuant to Section 13(a) of the Exchange Act. ☐
Section 2 - Financial Information
| Item 2.02 |
Results Of Operations And Financial Condition. |
Reference is made to the press release of American Financial Group, Inc. (the “Company”) relating to the announcement of the Company’s results of operations for the second quarter of 2024 and the availability of the Investor Supplement on the Company’s website. The press release was issued on August 6, 2024. A copy of the press release is furnished as Exhibit 99.1 and a copy of the Investor Supplement is furnished as Exhibit 99.2 and are incorporated herein by reference.
The information under Item 2.02 and in Exhibits 99.1 and 99.2 is being furnished and shall not be deemed “filed” for purposes of Section 18 of the Securities Exchange Act of 1934, as amended (the “Exchange Act), or otherwise subject to the liabilities of that section, nor shall it be deemed incorporated by reference in any filing under the Securities Act of 1933, as amended, or the Exchange Act.
Section 9 - Financial Statements and Exhibits
| Item 9.01 |
Financial Statements and Exhibits. |
| |
(a) |
Financial statements of business acquired. Not applicable. |
| |
(b) |
Pro forma financial information. Not applicable. |
| |
(c) |
Shell company transactions. Not applicable |
2
SIGNATURES
Pursuant to the requirements of the Securities Exchange Act of 1934, the registrant has duly caused this report to be signed on its behalf by the undersigned hereunto duly authorized.
|
|
|
|
|
|
|
|
|
|
|
AMERICAN FINANCIAL GROUP, INC. |
|
|
|
|
| Date: August 7, 2024 |
|
|
|
By: |
|
/s/ Joseph C. Alter |
|
|
|
|
|
|
Joseph C. Alter |
|
|
|
|
|
|
Vice President |
3
Exhibit 99.1

American Financial Group, Inc. Announces Second Quarter Results
| |
• |
|
Net earnings per share of $2.49; includes $0.07 per share loss from
non-core items |
| |
• |
|
Second quarter core net operating earnings per share of $2.56, 8% higher than the comparable period
|
| |
• |
|
Second quarter annualized ROE of 18.0%; core operating ROE of 18.5% |
| |
• |
|
Second quarter Specialty calendar year combined ratio improved 1.4 points YOY to 90.5%
|
| |
• |
|
Overall average renewal rate increases excluding workers’ compensation of 8% |
CINCINNATI – August 6, 2024 – American Financial Group, Inc. (NYSE: AFG) today reported 2024 second quarter net earnings of $209 million
($2.49 per share) compared to $200 million ($2.34 per share) for the 2023 second quarter. Net earnings for the 2024 second quarter included after-tax non-core
losses of $6 million ($0.07 per share loss). By comparison, net earnings in the 2023 second quarter included net after-tax non-core items that reduced net income by
$2 million ($0.04 per share loss). Annualized return on equity was 18.0% and 17.9% for the second quarters of 2024 and 2023, respectively, and is calculated excluding accumulated other comprehensive income (AOCI). Other details may be found in
the table on the following page.
Core net operating earnings were $215 million ($2.56 per share) for the 2024 second quarter, compared to
$202 million ($2.38 per share) in the 2023 second quarter, reflecting meaningfully higher P&C underwriting profit. Additional details for the 2024 and 2023 second quarters may be found in the table below. Core net operating earnings for the
second quarters of 2024 and 2023 generated annualized returns on equity of 18.5% and 18.2%, respectively, which is calculated excluding AOCI.
|
|
|
|
|
|
|
|
|
|
|
|
|
|
|
|
|
|
|
|
|
|
|
|
|
| |
|
Three Months Ended June 30, |
|
| Components of Pretax Core Operating Earnings |
|
2024 |
|
|
2023 |
|
|
2024 |
|
|
2023 |
|
|
2024 |
|
|
2023 |
|
| In millions, except per share amounts |
|
Before Impact of
Alternative Investments |
|
|
Alternative
Investments |
|
|
Core Net Operating
Earnings, as reported |
|
| P&C Pretax Core Operating Earnings |
|
$ |
286 |
|
|
$ |
244 |
|
|
$ |
33 |
|
|
$ |
55 |
|
|
$ |
319 |
|
|
$ |
299 |
|
| Other expenses |
|
|
(27 |
) |
|
|
(22 |
) |
|
|
— |
|
|
|
— |
|
|
|
(27 |
) |
|
|
(22 |
) |
| Holding company interest expense |
|
|
(19 |
) |
|
|
(19 |
) |
|
|
— |
|
|
|
— |
|
|
|
(19 |
) |
|
|
(19 |
) |
|
|
|
|
|
|
|
|
|
|
|
|
|
|
|
|
|
|
|
|
|
|
|
|
|
| Pretax Core Operating Earnings |
|
|
240 |
|
|
|
203 |
|
|
|
33 |
|
|
|
55 |
|
|
|
273 |
|
|
|
258 |
|
| Related provision for income taxes |
|
|
51 |
|
|
|
44 |
|
|
|
7 |
|
|
|
12 |
|
|
|
58 |
|
|
|
56 |
|
|
|
|
|
|
|
|
|
|
|
|
|
|
|
|
|
|
|
|
|
|
|
|
|
|
| Core Net Operating Earnings |
|
$ |
189 |
|
|
$ |
159 |
|
|
$ |
26 |
|
|
$ |
43 |
|
|
$ |
215 |
|
|
$ |
202 |
|
|
|
|
|
|
|
|
|
|
|
|
|
|
|
|
|
|
|
|
|
|
|
|
|
|
| Core Operating Earnings Per Share |
|
$ |
2.25 |
|
|
$ |
1.87 |
|
|
$ |
0.31 |
|
|
$ |
0.51 |
|
|
$ |
2.56 |
|
|
$ |
2.38 |
|
| Weighted Avg Diluted Shares Outstanding |
|
|
83.9 |
|
|
|
85.2 |
|
|
|
83.9 |
|
|
|
85.2 |
|
|
|
83.9 |
|
|
|
85.2 |
|
AFG’s book value per share was $52.25 at June 30, 2024. AFG paid cash dividends of $0.71 per share during the second
quarter. For the three months ended June 30, 2024, AFG’s growth in book value per share plus dividends was 4.7% and year to date, growth in book value per share plus dividends was 10.3%.
Book value per share excluding AOCI was $56.19 at June 30, 2024. For the three months ended June 30, 2024, AFG’s growth in book value per share
excluding AOCI plus dividends was 4.7%. Year to date, growth in book value per share excluding AOCI plus dividends was 9.9%.
AFG’s net earnings,
determined in accordance with U.S. generally accepted accounting principles (GAAP), include certain items that may not be indicative of its ongoing core operations. The table below identifies such items and reconciles net earnings to core net
operating earnings, a non-GAAP financial measure.
Page 1
AFG believes that its core net operating earnings provides management, financial analysts, ratings agencies, and investors with an understanding of the results from the ongoing operations of the
Company by excluding the impact of net realized gains and losses and other items that are not necessarily indicative of operating trends. AFG’s management uses core net operating earnings to evaluate financial performance against historical
results because it believes this provides a more comparable measure of its continuing business. Core net operating earnings is also used by AFG’s management as a basis for strategic planning and forecasting.
|
|
|
|
|
|
|
|
|
|
|
|
|
|
|
|
|
| |
|
Three months ended June 30, |
|
|
Six months ended June 30, |
|
| In millions, except per share amounts |
|
2024 |
|
|
2023 |
|
|
2024 |
|
|
2023 |
|
| Components of net earnings: |
|
|
|
|
|
|
|
|
|
|
|
|
|
|
|
|
| Core operating earnings before income taxes |
|
$ |
273 |
|
|
$ |
258 |
|
|
$ |
563 |
|
|
$ |
566 |
|
| Pretax non-core items: |
|
|
|
|
|
|
|
|
|
|
|
|
|
|
|
|
| Realized gains (losses) on securities |
|
|
(2 |
) |
|
|
(2 |
) |
|
|
12 |
|
|
|
(48 |
) |
| Gain (loss) on retirement of debt |
|
|
— |
|
|
|
(1 |
) |
|
|
— |
|
|
|
1 |
|
|
|
|
|
|
|
|
|
|
|
|
|
|
|
|
|
|
| Earnings before income taxes |
|
|
271 |
|
|
|
255 |
|
|
|
575 |
|
|
|
519 |
|
| Provision (credit) for income taxes: |
|
|
|
|
|
|
|
|
|
|
|
|
|
|
|
|
| Core operating earnings |
|
|
58 |
|
|
|
56 |
|
|
|
117 |
|
|
|
117 |
|
| Non-core items |
|
|
4 |
|
|
|
(1 |
) |
|
|
7 |
|
|
|
(10 |
) |
|
|
|
|
|
|
|
|
|
|
|
|
|
|
|
|
|
| Total provision for income taxes |
|
|
62 |
|
|
|
55 |
|
|
|
124 |
|
|
|
107 |
|
|
|
|
|
|
|
|
|
|
|
|
|
|
|
|
|
|
| Net earnings |
|
$ |
209 |
|
|
$ |
200 |
|
|
$ |
451 |
|
|
$ |
412 |
|
|
|
|
|
|
|
|
|
|
|
|
|
|
|
|
|
|
| Net earnings: |
|
|
|
|
|
|
|
|
|
|
|
|
|
|
|
|
| Core net operating earnings(a) |
|
$ |
215 |
|
|
$ |
202 |
|
|
$ |
446 |
|
|
$ |
449 |
|
| Non-core items: |
|
|
|
|
|
|
|
|
|
|
|
|
|
|
|
|
| Realized gains (losses) on securities |
|
|
(2 |
) |
|
|
(1 |
) |
|
|
9 |
|
|
|
(38 |
) |
| Other |
|
|
(4 |
) |
|
|
(1 |
) |
|
|
(4 |
) |
|
|
1 |
|
|
|
|
|
|
|
|
|
|
|
|
|
|
|
|
|
|
| Net earnings |
|
$ |
209 |
|
|
$ |
200 |
|
|
$ |
451 |
|
|
$ |
412 |
|
|
|
|
|
|
|
|
|
|
|
|
|
|
|
|
|
|
| Components of earnings per share: |
|
|
|
|
|
|
|
|
|
|
|
|
|
|
|
|
| Core net operating earnings(a) |
|
$ |
2.56 |
|
|
$ |
2.38 |
|
|
$ |
5.32 |
|
|
$ |
5.27 |
|
| Non-core Items: |
|
|
|
|
|
|
|
|
|
|
|
|
|
|
|
|
| Realized gains (losses) on securities |
|
|
(0.02 |
) |
|
|
(0.02 |
) |
|
|
0.11 |
|
|
|
(0.45 |
) |
| Other |
|
|
(0.05 |
) |
|
|
(0.02 |
) |
|
|
(0.05 |
) |
|
|
0.01 |
|
|
|
|
|
|
|
|
|
|
|
|
|
|
|
|
|
|
| Diluted net earnings per share |
|
$ |
2.49 |
|
|
$ |
2.34 |
|
|
$ |
5.38 |
|
|
$ |
4.83 |
|
|
|
|
|
|
|
|
|
|
|
|
|
|
|
|
|
|
Footnote (a) is contained in the accompanying Notes to Financial Schedules at the end of this release.
Carl H. Lindner III and S. Craig Lindner, AFG’s Co-Chief Executive Officers, issued this statement: “We are
pleased to report a second quarter annualized core operating return on equity of 18.5%. Underwriting margins in our specialty P&C insurance businesses were strong, and higher interest rates increased net investment income, excluding
alternatives, by 15% year over year. These results, coupled with effective capital management and our entrepreneurial, opportunistic culture and disciplined operating philosophy enable us to continue to create value for our shareholders.
Messrs. Lindner continued: “AFG continued to have significant excess capital at June 30, 2024. Returning capital to shareholders in the form of
regular and special cash dividends and through opportunistic share repurchases is an important and effective component of our capital management strategy. In addition, our capital will be deployed into AFG’s core businesses as we identify the
potential for healthy, profitable organic growth, and opportunities to expand our specialty niche businesses through acquisitions and start-ups that meet our target return thresholds.”
Specialty Property and Casualty Insurance Operations
The Specialty P&C insurance operations generated a strong 90.5% combined ratio in the second quarter of 2024, an improvement of 1.4 points from the 91.9%
reported in the second quarter of 2023. Second quarter 2024 results include 2.3 points related to catastrophe losses, compared to 3.5 points in the 2023 second quarter. Second quarter 2024 results benefited from 2.3 points of favorable prior year
reserve development, compared to 4.0 points in the second quarter of 2023. Underwriting profit was $151 million for the 2024 second quarter compared to $123 million in the second quarter of the prior period.
Page 2
Second quarter 2024 gross and net written premiums were up 2% and 1%, respectively, when compared to the
second quarter of 2023. We continue to achieve year-over-year premium growth as a result of a combination of new business opportunities, increased exposures, and a good renewal rate environment, which was partially offset by later reporting of crop
premiums. Tempered growth in the quarter also reflects the Company’s proactive and intentional approach to managing exposure in several of our social inflation-exposed businesses.
Average renewal pricing across our P&C Group, excluding workers’ compensation, was up approximately 8% for the quarter, and up approximately 6%
overall, consistent with pricing increases achieved in the first quarter. We believe we are achieving overall renewal rate increases in excess of prospective loss ratio trends to meet or exceed targeted returns.
The Property and Transportation Group reported an underwriting profit of $39 million in the second quarter of 2024, compared to $32 million
in the second quarter of 2023. Higher year-over-year underwriting profits in our property & inland marine and crop insurance businesses were partially offset by lower underwriting profitability in our transportation businesses. Catastrophe
losses in this group were $13 million in the second quarter of 2024, compared to $15 million in the second quarter of 2023. Overall, the businesses in the Property and Transportation Group achieved a 92.9% calendar year combined ratio in
the second quarter, improving 1.3 points from the comparable period in 2023.
Second quarter 2024 gross and net written premiums in this group were both
2% higher than the comparable prior year. Year-over-year premium growth was primarily attributed to new business opportunities, a favorable rate environment and increased exposures in our commercial auto businesses. Later reporting of crop acreage,
which impacts the timing of crop premiums, more than offset additional crop premium associated with the CRS acquisition. Excluding crop, gross and net written premiums in this group grew by 7% and 5%, respectively. Overall renewal rates in this
group increased 8% on average in the second quarter of 2024, about a point lower than the pricing achieved in this group for the first quarter of 2024.
The Specialty Casualty Group achieved an excellent 85.4% calendar year combined ratio overall in the second quarter of 2024, an improvement of 1.2
points over the very strong 86.6% reported in the second quarter of 2023. Underwriting profit was $108 million in the second quarter of 2024, compared to $95 million in the second quarter of 2023. Higher year-over-year profitability in our
targeted markets and workers’ compensation businesses and improved results in several other Specialty Casualty businesses were partially offset by lower levels of favorable prior year reserve development in our executive liability business and
adverse development in our excess liability business. Catastrophe losses for this group were $5 million in the second quarter of 2024 compared to $8 million in the prior year quarter.
Second quarter 2024 gross and net written premiums increased 1% and 2%, respectively, when compared to the same prior year period. Approximately two-thirds of the businesses in this group reported year-over-year growth as a result of new business opportunities, higher rates and strong policy retention. This growth was partially offset by non-renewal of several large accounts and other underwriting actions taken in several of our targeted markets businesses. Excluding our workers’ compensation businesses, renewal rates for this group were up
approximately 7% in the second quarter, about a point lower than the first quarter. Overall renewal rates in this group including workers’ compensation were up about 5% and consistent with the first quarter of 2024.
The Specialty Financial Group reported an underwriting profit of $25 million in the second quarter of 2024, compared to $10 million in the
second quarter of 2023. The increase was primarily the result of higher underwriting profit in our financial institutions business. Catastrophe losses for this group were $17 million in the second quarter of 2024 compared to $19 million in
the prior year quarter. This group continued to achieve excellent underwriting margins and reported a combined ratio of 89.7% for the second quarter of 2024, 5.3 points better than the 95.0% reported in the comparable period in 2023.
Page 3
Second quarter 2024 gross written premiums were flat and net written premiums were up 3% in this group,
respectively, when compared to the prior year period. Growth in our financial institutions business was partially offset by a decision to pause writing of new intellectual property-related coverage in our Innovative Markets business. Renewal pricing
in this group was up approximately 6% for the quarter, about 1 point lower than the previous quarter.
Carl Lindner III stated, “Underwriting
profitability was very strong in our Specialty P&C businesses in the second quarter of 2024, and we continue to feel confident about the strength of our reserves. A continued favorable pricing environment and new business opportunities enabled
us to selectively grow our Specialty P&C businesses. Growth in net written premium was about 4% for the first six months of the year, as timing of acreage reporting by farmers and underwriting actions in a few of our businesses tempered growth
in the second quarter. We expect growth in net written premiums to be approximately 7% for the full year in 2024.”
Further details about AFG’s
Specialty P&C operations may be found in the accompanying schedules and in our Quarterly Investor Supplement, which is posted on our website.
Investments
Net Investment Income –
For the quarter ended June 30, 2024, property and casualty net investment income was approximately 1% lower than the comparable 2023 period. Excluding the impact of alternative investments, net investment income in our property and casualty
insurance operations for the three months ended June 30, 2024, increased 15% year-over-year as a result of the impact of higher interest rates and higher balances of invested assets. The annualized return on alternative investments was
approximately 5.1% for the 2024 second quarter compared to 9.6% for the prior year quarter. Earnings from alternative investments may vary from quarter to quarter based on the reported results of the underlying investments, and generally are
reported on a quarter lag. The average annual return on alternative investments over the five calendar years ended December 31, 2023, was approximately 13%.
Non-Core Net Realized Gains (Losses) – AFG recorded second quarter 2024 net realized losses on securities
of $2 million ($0.02 per share loss) after tax, which included $2 million ($0.02 per share loss) in after-tax net losses to adjust equity securities that the Company continued to own at June 30,
2024, to fair value. By comparison, AFG recorded net realized losses on securities of $1 million ($0.02 per share loss) in the comparable 2023 period.
After-tax unrealized losses related to fixed maturities were $310 million at June 30, 2024. Our portfolio
continues to be high quality, with 94% of our fixed maturity portfolio rated investment grade and 96% of our P&C fixed maturity portfolio with a National Association of Insurance Commissioners’ designation of NAIC 1 or 2, its highest two
categories.
More information about the components of our investment portfolio may be found in our Quarterly Investor Supplement, which is posted on our
website.
About American Financial Group, Inc.
American Financial Group is an insurance holding company, based in Cincinnati, Ohio. Through the operations of Great American Insurance Group, AFG is engaged
primarily in property and casualty insurance, focusing on specialized commercial products for businesses. Great American Insurance Group’s roots go back to 1872 with the founding of its flagship company, Great American Insurance Company.
Forward Looking Statements
This press release,
and any related oral statements, contains certain statements that may be deemed to be “forward-looking statements” within the meaning of Section 27A of the Securities Act of 1933 and Section 21E of the Securities Exchange Act of
1934. All statements in this press release not dealing with
Page 4
historical results are forward-looking and are based on estimates, assumptions, and projections. Examples of such forward-looking statements include statements relating to: the Company’s
expectations concerning market and other conditions and their effect on future premiums, revenues, earnings, investment activities and the amount and timing of share repurchases or special dividends; recoverability of asset values; expected losses
and the adequacy of reserves for asbestos, environmental pollution and mass tort claims; rate changes; and improved loss experience.
Actual results
and/or financial condition could differ materially from those contained in or implied by such forward-looking statements for a variety of reasons including, but not limited to: the risks and uncertainties AFG describes in the “Risk
Factors” section of its most recent Annual Report on Form 10-K, as updated by its other reports filed with the Securities and Exchange Commission; changes in financial, political and economic conditions,
including changes in interest and inflation rates, currency fluctuations and extended economic recessions or expansions in the U.S. and/or abroad; performance of securities markets; new legislation or declines in credit quality or credit ratings
that could have a material impact on the valuation of securities in AFG’s investment portfolio; the availability of capital; changes in insurance law or regulation, including changes in statutory accounting rules, including modifications to
capital requirements; changes in the legal environment affecting AFG or its customers; tax law and accounting changes; levels of natural catastrophes and severe weather, terrorist activities (including any nuclear, biological, chemical or
radiological events), incidents of war or losses resulting from pandemics, civil unrest and other major losses; disruption caused by cyber-attacks or other technology breaches or failures by AFG or its business partners and service providers, which
could negatively impact AFG’s business and/or expose AFG to litigation; development of insurance loss reserves and establishment of other reserves, particularly with respect to amounts associated with asbestos and environmental claims;
availability of reinsurance and ability of reinsurers to pay their obligations; competitive pressures; the ability to obtain adequate rates and policy terms; changes in AFG’s credit ratings or the financial strength ratings assigned by major
ratings agencies to AFG’s operating subsidiaries; the impact of the conditions in the international financial markets and the global economy relating to AFG’s international operations; and effects on AFG’s reputation, including as a
result of environmental, social and governance matters.
The forward-looking statements herein are made only as of the date of this press release. The
Company assumes no obligation to publicly update any forward-looking statements.
Conference Call
The Company will hold a conference call to discuss 2024 second quarter results at 11:30 a.m. (ET) tomorrow, Wednesday, August 7, 2024. New, simplified
event registration and access provides two ways to access the call.
Participants should register for the call here now or any time up to and
during the time of the call, and will immediately receive the dial-in number and a unique PIN to access the call. While you may register at any time up to and during the time of the call, you are encouraged to
join the call 10 minutes prior to the start of the event.
The conference call and accompanying webcast slides will also be broadcast live over the
internet. To access the event, click the following link: https://www.afginc.com/news-and-events/event-calendar. Alternatively, you can choose Events from
the Investor Relations page at www.AFGinc.com.
A replay of the webcast will be available via the same link on our website approximately two hours
after the completion of the call.
Page 5
Contact:
Diane P. Weidner, IRC, CPA (inactive)
Vice President –
Investor & Media Relations
513-369-5713
Websites:
www.AFGinc.com
www.GreatAmericanInsuranceGroup.com
# # #
(Financial summaries follow)
This earnings release and
AFG’s Quarterly Investor Supplement are available in the Investor Relations section of AFG’s website: www.AFGinc.com.
AFG2024-15
Page 6
AMERICAN FINANCIAL GROUP, INC. AND SUBSIDIARIES
SUMMARY OF EARNINGS AND SELECTED BALANCE SHEET DATA
(In Millions, Except Per Share Data)
|
|
|
|
|
|
|
|
|
|
|
|
|
|
|
|
|
| |
|
Three months ended June 30, |
|
|
Six months ended June 30, |
|
| |
|
2024 |
|
|
2023 |
|
|
2024 |
|
|
2023 |
|
| Revenues |
|
|
|
|
|
|
|
|
|
|
|
|
|
|
|
|
| P&C insurance net earned premiums |
|
$ |
1,585 |
|
|
$ |
1,507 |
|
|
$ |
3,131 |
|
|
$ |
2,944 |
|
| Net investment income |
|
|
188 |
|
|
|
198 |
|
|
|
386 |
|
|
|
415 |
|
| Realized gains (losses) on securities |
|
|
(2 |
) |
|
|
(2 |
) |
|
|
12 |
|
|
|
(48 |
) |
| Income of managed investment entities: |
|
|
|
|
|
|
|
|
|
|
|
|
|
|
|
|
| Investment income |
|
|
98 |
|
|
|
112 |
|
|
|
197 |
|
|
|
216 |
|
| Gain (loss) on change in fair value of assets/liabilities |
|
|
4 |
|
|
|
— |
|
|
|
14 |
|
|
|
(4 |
) |
| Other income |
|
|
27 |
|
|
|
25 |
|
|
|
66 |
|
|
|
57 |
|
|
|
|
|
|
|
|
|
|
|
|
|
|
|
|
|
|
| Total revenues |
|
|
1,900 |
|
|
|
1,840 |
|
|
|
3,806 |
|
|
|
3,580 |
|
| Costs and expenses |
|
|
|
|
|
|
|
|
|
|
|
|
|
|
|
|
| P&C insurance losses & expenses |
|
|
1,443 |
|
|
|
1,390 |
|
|
|
2,858 |
|
|
|
2,683 |
|
| Interest charges on borrowed money |
|
|
19 |
|
|
|
19 |
|
|
|
38 |
|
|
|
38 |
|
| Expenses of managed investment entities |
|
|
90 |
|
|
|
103 |
|
|
|
182 |
|
|
|
198 |
|
| Other expenses |
|
|
77 |
|
|
|
73 |
|
|
|
153 |
|
|
|
142 |
|
|
|
|
|
|
|
|
|
|
|
|
|
|
|
|
|
|
| Total costs and expenses |
|
|
1,629 |
|
|
|
1,585 |
|
|
|
3,231 |
|
|
|
3,061 |
|
|
|
|
|
|
|
|
|
|
|
|
|
|
|
|
|
|
| Earnings before income taxes |
|
|
271 |
|
|
|
255 |
|
|
|
575 |
|
|
|
519 |
|
| Provision for income taxes |
|
|
62 |
|
|
|
55 |
|
|
|
124 |
|
|
|
107 |
|
|
|
|
|
|
|
|
|
|
|
|
|
|
|
|
|
|
| Net earnings |
|
$ |
209 |
|
|
$ |
200 |
|
|
$ |
451 |
|
|
$ |
412 |
|
|
|
|
|
|
|
|
|
|
|
|
|
|
|
|
|
|
| Diluted earnings per common share |
|
$ |
2.49 |
|
|
$ |
2.34 |
|
|
$ |
5.38 |
|
|
$ |
4.83 |
|
|
|
|
|
|
|
|
|
|
|
|
|
|
|
|
|
|
| Average number of diluted shares |
|
|
83.9 |
|
|
|
85.2 |
|
|
|
83.9 |
|
|
|
85.3 |
|
|
|
|
|
|
|
|
|
|
| Selected Balance Sheet Data: |
|
June 30, 2024 |
|
|
December 31, 2023 |
|
| Total cash and investments |
|
$ |
15,261 |
|
|
$ |
15,263 |
|
| Long-term debt |
|
$ |
1,475 |
|
|
$ |
1,475 |
|
| Shareholders’ equity(b) |
|
$ |
4,384 |
|
|
$ |
4,258 |
|
| Shareholders’ equity (excluding AOCI) |
|
$ |
4,715 |
|
|
$ |
4,577 |
|
| Book value per share(b) |
|
$ |
52.25 |
|
|
$ |
50.91 |
|
| Book value per share (excluding AOCI) |
|
$ |
56.19 |
|
|
$ |
54.72 |
|
| Common Shares Outstanding |
|
|
83.9 |
|
|
|
83.6 |
|
Footnote (b) is contained in the accompanying Notes to Financial Schedules at the end of this release.
Page 7
AMERICAN FINANCIAL GROUP, INC.
SPECIALTY P&C OPERATIONS
(Dollars in Millions)
|
|
|
|
|
|
|
|
|
|
|
|
|
|
|
|
|
|
|
|
|
|
|
|
|
| |
|
Three months ended
June 30, |
|
|
Pct.
Change |
|
|
Six months ended
June 30, |
|
|
Pct.
Change |
|
| |
|
2024 |
|
|
2023 |
|
|
|
|
|
2024 |
|
|
2023 |
|
|
|
|
| Gross written premiums |
|
$ |
2,406 |
|
|
$ |
2,369 |
|
|
|
2 |
% |
|
$ |
4,742 |
|
|
$ |
4,524 |
|
|
|
5 |
% |
|
|
|
|
|
|
|
|
|
|
|
|
|
|
|
|
|
|
|
|
|
|
|
|
|
| Net written premiums |
|
$ |
1,692 |
|
|
$ |
1,667 |
|
|
|
1 |
% |
|
$ |
3,326 |
|
|
$ |
3,186 |
|
|
|
4 |
% |
|
|
|
|
|
|
|
|
|
|
|
|
|
|
|
|
|
|
|
|
|
|
|
|
|
| Ratios (GAAP): |
|
|
|
|
|
|
|
|
|
|
|
|
|
|
|
|
|
|
|
|
|
|
|
|
| Loss & LAE ratio |
|
|
59.1 |
% |
|
|
60.2 |
% |
|
|
|
|
|
|
58.8 |
% |
|
|
58.6 |
% |
|
|
|
|
| Underwriting expense ratio |
|
|
31.4 |
% |
|
|
31.7 |
% |
|
|
|
|
|
|
31.4 |
% |
|
|
32.0 |
% |
|
|
|
|
|
|
|
|
|
|
|
|
|
|
|
|
|
|
|
|
|
|
|
|
|
|
|
|
|
| Specialty Combined Ratio |
|
|
90.5 |
% |
|
|
91.9 |
% |
|
|
|
|
|
|
90.2 |
% |
|
|
90.6 |
% |
|
|
|
|
|
|
|
|
|
|
|
|
|
|
|
|
|
|
|
|
|
|
|
|
|
|
|
|
|
| Combined Ratio – P&C Segment |
|
|
90.5 |
% |
|
|
91.7 |
% |
|
|
|
|
|
|
90.3 |
% |
|
|
90.5 |
% |
|
|
|
|
|
|
|
|
|
|
|
|
|
|
|
|
|
|
|
|
|
|
|
|
|
|
|
|
|
| Supplemental
Information:(c) |
|
|
|
|
|
|
|
|
|
|
|
|
|
|
|
|
|
|
|
|
|
|
|
|
| Gross Written Premiums: |
|
|
|
|
|
|
|
|
|
|
|
|
|
|
|
|
|
|
|
|
|
|
|
|
| Property & Transportation |
|
$ |
1,084 |
|
|
$ |
1,059 |
|
|
|
2 |
% |
|
$ |
2,043 |
|
|
$ |
1,931 |
|
|
|
6 |
% |
| Specialty Casualty |
|
|
1,023 |
|
|
|
1,012 |
|
|
|
1 |
% |
|
|
2,120 |
|
|
|
2,073 |
|
|
|
2 |
% |
| Specialty Financial |
|
|
299 |
|
|
|
298 |
|
|
|
— |
% |
|
|
579 |
|
|
|
520 |
|
|
|
11 |
% |
|
|
|
|
|
|
|
|
|
|
|
|
|
|
|
|
|
|
|
|
|
|
|
|
|
|
|
$ |
2,406 |
|
|
$ |
2,369 |
|
|
|
2 |
% |
|
$ |
4,742 |
|
|
$ |
4,524 |
|
|
|
5 |
% |
|
|
|
|
|
|
|
|
|
|
|
|
|
|
|
|
|
|
|
|
|
|
|
|
|
| Net Written Premiums: |
|
|
|
|
|
|
|
|
|
|
|
|
|
|
|
|
|
|
|
|
|
|
|
|
| Property & Transportation |
|
$ |
681 |
|
|
$ |
668 |
|
|
|
2 |
% |
|
$ |
1,272 |
|
|
$ |
1,220 |
|
|
|
4 |
% |
| Specialty Casualty |
|
|
704 |
|
|
|
693 |
|
|
|
2 |
% |
|
|
1,455 |
|
|
|
1,415 |
|
|
|
3 |
% |
| Specialty Financial |
|
|
248 |
|
|
|
240 |
|
|
|
3 |
% |
|
|
482 |
|
|
|
424 |
|
|
|
14 |
% |
| Other |
|
|
59 |
|
|
|
66 |
|
|
|
(11 |
%) |
|
|
117 |
|
|
|
127 |
|
|
|
(8 |
%) |
|
|
|
|
|
|
|
|
|
|
|
|
|
|
|
|
|
|
|
|
|
|
|
|
|
|
|
$ |
1,692 |
|
|
$ |
1,667 |
|
|
|
1 |
% |
|
$ |
3,326 |
|
|
$ |
3,186 |
|
|
|
4 |
% |
|
|
|
|
|
|
|
|
|
|
|
|
|
|
|
|
|
|
|
|
|
|
|
|
|
| Combined Ratio (GAAP): |
|
|
|
|
|
|
|
|
|
|
|
|
|
|
|
|
|
|
|
|
|
|
|
|
| Property & Transportation |
|
|
92.9 |
% |
|
|
94.2 |
% |
|
|
|
|
|
|
91.0 |
% |
|
|
92.6 |
% |
|
|
|
|
| Specialty Casualty |
|
|
85.4 |
% |
|
|
86.6 |
% |
|
|
|
|
|
|
87.7 |
% |
|
|
87.1 |
% |
|
|
|
|
| Specialty Financial |
|
|
89.7 |
% |
|
|
95.0 |
% |
|
|
|
|
|
|
88.1 |
% |
|
|
90.8 |
% |
|
|
|
|
| Aggregate Specialty Group |
|
|
90.5 |
% |
|
|
91.9 |
% |
|
|
|
|
|
|
90.2 |
% |
|
|
90.6 |
% |
|
|
|
|
|
|
|
|
|
|
|
|
|
|
|
|
|
|
|
|
|
| |
|
Three months ended
June 30, |
|
|
Six months ended
June 30, |
|
| |
|
2024 |
|
|
2023 |
|
|
2024 |
|
|
2023 |
|
| Reserve Development (Favorable)/Adverse: |
|
|
|
|
|
|
|
|
|
|
|
|
|
|
|
|
| Property & Transportation |
|
$ |
(33 |
) |
|
$ |
(21 |
) |
|
$ |
(76 |
) |
|
$ |
(58 |
) |
| Specialty Casualty |
|
|
(25 |
) |
|
|
(24 |
) |
|
|
(42 |
) |
|
|
(51 |
) |
| Specialty Financial |
|
|
— |
|
|
|
(11 |
) |
|
|
6 |
|
|
|
(14 |
) |
| Other Specialty |
|
|
22 |
|
|
|
(5 |
) |
|
|
25 |
|
|
|
(2 |
) |
|
|
|
|
|
|
|
|
|
|
|
|
|
|
|
|
|
| Specialty Group |
|
|
(36 |
) |
|
|
(61 |
) |
|
|
(87 |
) |
|
|
(125 |
) |
| Other |
|
|
1 |
|
|
|
(1 |
) |
|
|
2 |
|
|
|
— |
|
|
|
|
|
|
|
|
|
|
|
|
|
|
|
|
|
|
| Total Reserve Development |
|
$ |
(35 |
) |
|
$ |
(62 |
) |
|
$ |
(85 |
) |
|
$ |
(125 |
) |
|
|
|
|
|
|
|
|
|
|
|
|
|
|
|
|
|
| Points on Combined Ratio: |
|
|
|
|
|
|
|
|
|
|
|
|
|
|
|
|
| Property & Transportation |
|
|
(6.2 |
) |
|
|
(3.8 |
) |
|
|
(7.2 |
) |
|
|
(5.7 |
) |
| Specialty Casualty |
|
|
(3.5 |
) |
|
|
(3.4 |
) |
|
|
(2.9 |
) |
|
|
(3.6 |
) |
| Specialty Financial |
|
|
0.1 |
|
|
|
(5.7 |
) |
|
|
1.2 |
|
|
|
(3.5 |
) |
| Aggregate Specialty Group |
|
|
(2.3 |
) |
|
|
(4.0 |
) |
|
|
(2.8 |
) |
|
|
(4.2 |
) |
| Total P&C Segment |
|
|
(2.2 |
) |
|
|
(4.2 |
) |
|
|
(2.7 |
) |
|
|
(4.3 |
) |
Footnote (c) is contained in the accompanying Notes to Financial Schedules at the end of this release.
Page 8
AMERICAN FINANCIAL GROUP, INC.
Notes to Financial Schedules
| a) |
Components of core net operating earnings (in millions): |
|
|
|
|
|
|
|
|
|
|
|
|
|
|
|
|
|
| |
|
Three months ended
June 30, |
|
|
Six months ended
June 30, |
|
| |
|
2024 |
|
|
2023 |
|
|
2024 |
|
|
2023 |
|
| Core Operating Earnings before Income Taxes: |
|
|
|
|
|
|
|
|
|
|
|
|
|
|
|
|
| P&C insurance segment |
|
$ |
319 |
|
|
$ |
299 |
|
|
$ |
659 |
|
|
$ |
649 |
|
| Interest and other corporate expenses |
|
|
(46 |
) |
|
|
(41 |
) |
|
|
(96 |
) |
|
|
(83 |
) |
|
|
|
|
|
|
|
|
|
|
|
|
|
|
|
|
|
| Core operating earnings before income taxes |
|
|
273 |
|
|
|
258 |
|
|
|
563 |
|
|
|
566 |
|
| Related income taxes |
|
|
58 |
|
|
|
56 |
|
|
|
117 |
|
|
|
117 |
|
|
|
|
|
|
|
|
|
|
|
|
|
|
|
|
|
|
| Core net operating earnings |
|
$ |
215 |
|
|
$ |
202 |
|
|
$ |
446 |
|
|
$ |
449 |
|
|
|
|
|
|
|
|
|
|
|
|
|
|
|
|
|
|
| b) |
Shareholders’ Equity at June 30, 2024, includes ($331 million) ($3.94 per share loss) in Accumulated
Other Comprehensive Income (Loss) compared to ($319 million) ($3.81 per share loss) at December 31, 2023. |
| |
• |
|
Property & Transportation includes primarily physical damage and liability
coverage for buses and trucks and other specialty transportation niches, inland and ocean marine, agricultural-related products and other commercial property coverages. |
| |
• |
|
Specialty Casualty includes primarily excess and surplus, general liability, executive liability,
professional liability, umbrella and excess liability, specialty coverages in targeted markets, customized programs for small to mid-sized businesses and workers’ compensation insurance.
|
| |
• |
|
Specialty Financial includes risk management insurance programs for lending and leasing
institutions (including equipment leasing and collateral and lender-placed mortgage property insurance), surety and fidelity products and trade credit insurance. |
| |
• |
|
Other includes an internal reinsurance facility. |
Page 9

Exhibit 99.2 American Financial Group, Inc. Investor Supplement - Second
Quarter 2024 August 6, 2024 American Financial Group, Inc. Corporate Headquarters Great American Insurance Group Tower 301 E Fourth Street Cincinnati, OH 45202 513 579 6739
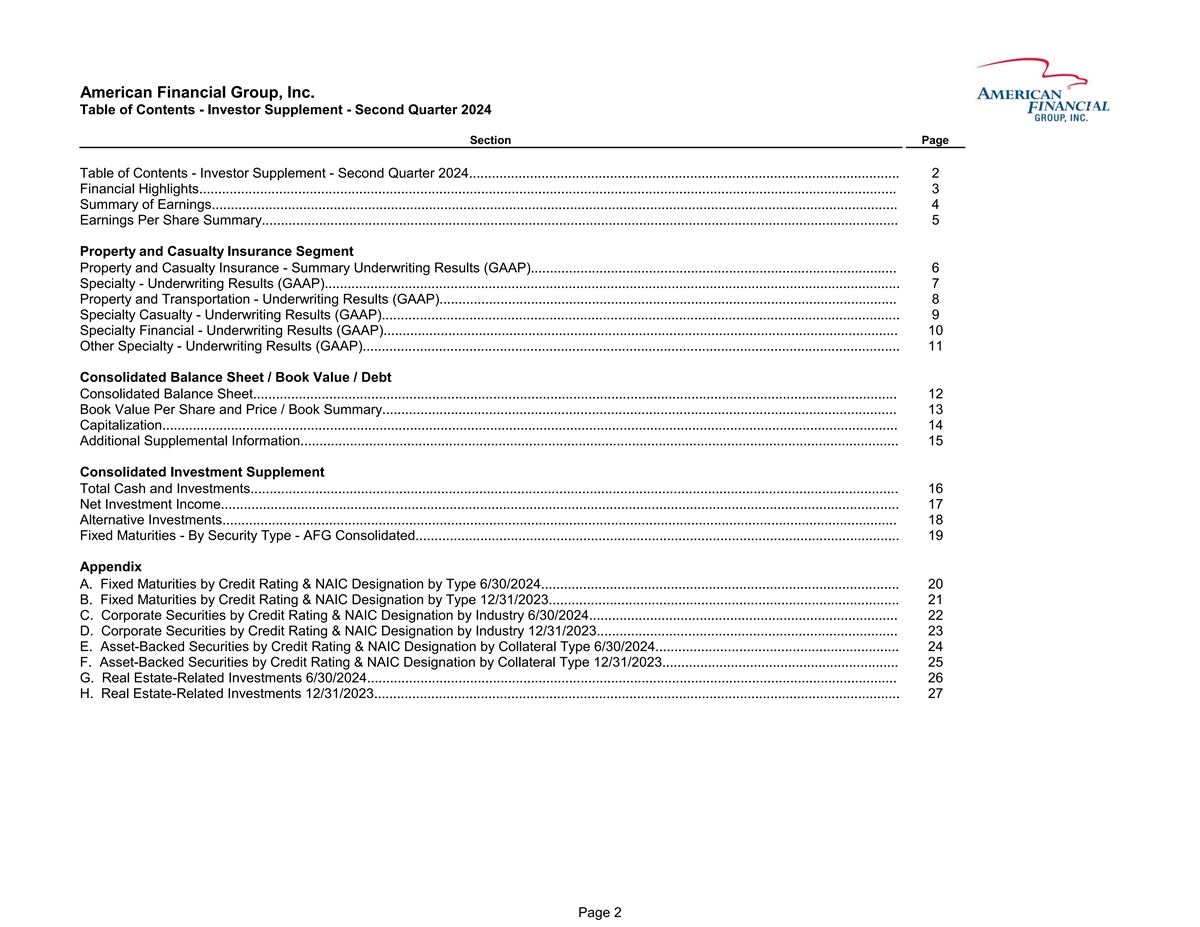
American Financial Group, Inc. Table of Contents - Investor Supplement -
Second Quarter 2024 2 Section Page Table of Contents - Investor Supplement - Second Quarter 2024................................................................................................................. 2 Financial
Highlights....................................................................................................................................................................................... 3 Summary of
Earnings.................................................................................................................................................................................... 4 Earnings Per Share
Summary....................................................................................................................................................................... 5 Property and Casualty Insurance Segment Property and Casualty Insurance
- Summary Underwriting Results (GAAP)................................................................................................ 6 Specialty - Underwriting Results
(GAAP)....................................................................................................................................................... 7 Property and Transportation - Underwriting Results
(GAAP)........................................................................................................................ 8 Specialty Casualty - Underwriting Results
(GAAP)........................................................................................................................................ 9 Specialty Financial - Underwriting Results
(GAAP)....................................................................................................................................... 10 Other Specialty - Underwriting Results
(GAAP)............................................................................................................................................. 11 Consolidated Balance Sheet / Book Value / Debt Consolidated Balance
Sheet......................................................................................................................................................................... 12 Book Value Per Share and Price / Book
Summary....................................................................................................................................... 13
Capitalization................................................................................................................................................................................................. 14 Additional Supplemental
Information............................................................................................................................................................. 15 Consolidated Investment Supplement Total Cash and
Investments.......................................................................................................................................................................... 16 Net Investment
Income.................................................................................................................................................................................. 17 Alternative
Investments................................................................................................................................................................................. 18 Fixed Maturities - By Security Type - AFG
Consolidated............................................................................................................................... 19 Appendix A. Fixed Maturities by Credit Rating & NAIC Designation by Type
6/30/2024.............................................................................................. 20 B. Fixed Maturities by Credit Rating & NAIC Designation by Type
12/31/2023............................................................................................ 21 C. Corporate Securities by Credit Rating & NAIC Designation by Industry
6/30/2024................................................................................. 22 D. Corporate Securities by Credit Rating & NAIC Designation by Industry
12/31/2023............................................................................... 23 E. Asset-Backed Securities by Credit Rating & NAIC Designation by Collateral Type
6/30/2024................................................................ 24 F. Asset-Backed Securities by Credit Rating & NAIC Designation by Collateral Type 12/31/2023.............................................................. 25 G. Real
Estate-Related Investments 6/30/2024........................................................................................................................................... 26 H. Real Estate-Related Investments
12/31/2023.......................................................................................................................................... 27 Page 2
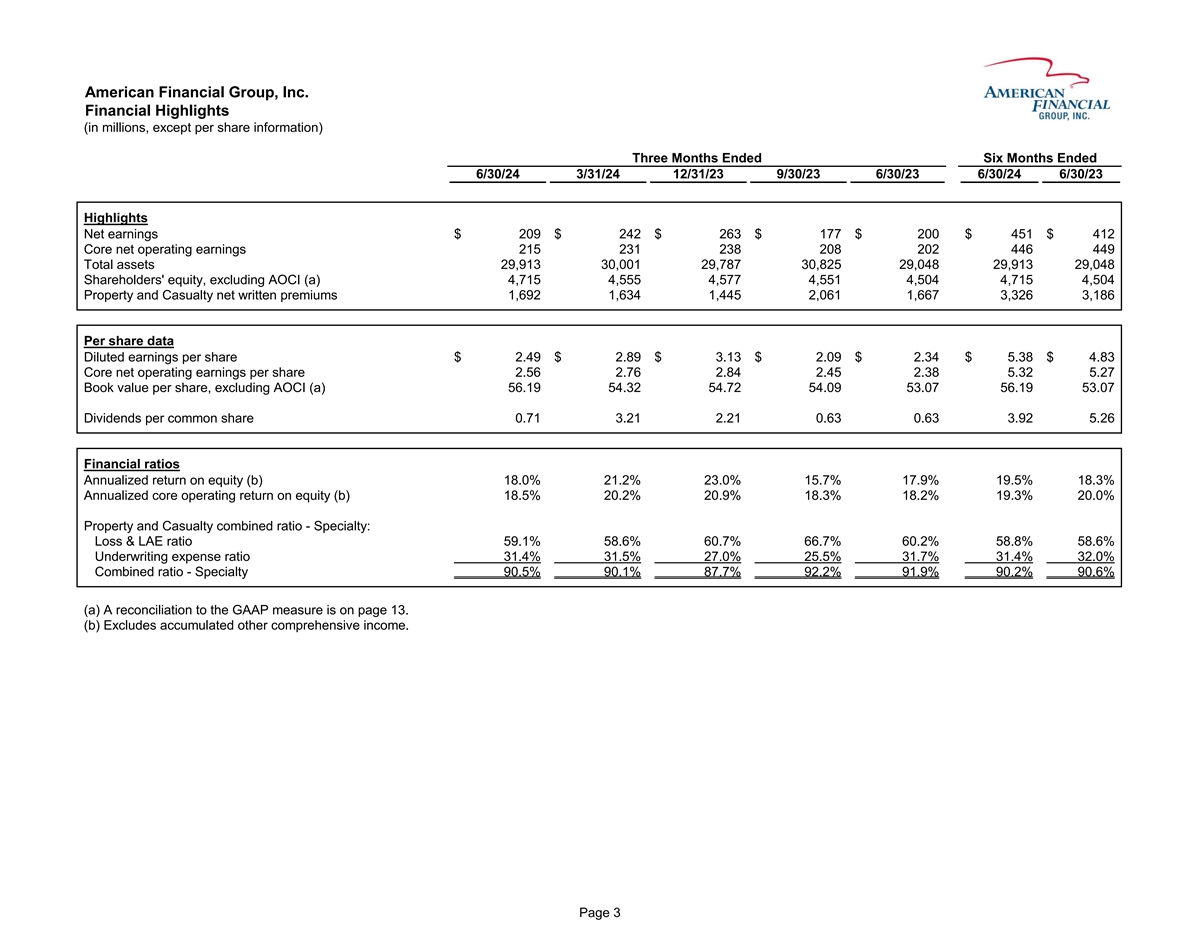
American Financial Group, Inc. Financial Highlights (in millions, except
per share information) Three Months Ended Six Months Ended 6/30/24 3/31/24 12/31/23 9/30/23 6/30/23 6/30/24 6/30/23 Highlights Net earnings $ 209 $ 242 $ 263 $ 177 $ 200 $ 451 $ 412 Core net operating earnings 215 231 238 208 202 446 449 Total
assets 29,913 30,001 29,787 30,825 29,048 29,913 29,048 Shareholders' equity, excluding AOCI (a) 4,715 4,555 4,577 4,551 4,504 4,715 4,504 Property and Casualty net written premiums 1,692 1,634 1,445 2,061 1,667 3,326 3,186 Per share data Diluted
earnings per share $ 2.49 $ 2.89 $ 3.13 $ 2.09 $ 2.34 $ 5.38 $ 4.83 Core net operating earnings per share 2.56 2.76 2.84 2.45 2.38 5.32 5.27 Book value per share, excluding AOCI (a) 56.19 54.32 54.72 54.09 53.07 56.19 53.07 Dividends per common
share 0.71 3.21 2.21 0.63 0.63 3.92 5.26 Financial ratios Annualized return on equity (b) 18.0% 21.2% 23.0% 15.7% 17.9% 19.5% 18.3% Annualized core operating return on equity (b) 18.5% 20.2% 20.9% 18.3% 18.2% 19.3% 20.0% Property and Casualty
combined ratio - Specialty: Loss & LAE ratio 59.1% 58.6% 60.7% 66.7% 60.2% 58.8% 58.6% Underwriting expense ratio 31.4% 31.5% 27.0% 25.5% 31.7% 31.4% 32.0% Combined ratio - Specialty 90.5% 90.1% 87.7% 92.2% 91.9% 90.2% 90.6% (a) A reconciliation
to the GAAP measure is on page 13. (b) Excludes accumulated other comprehensive income. Page 3
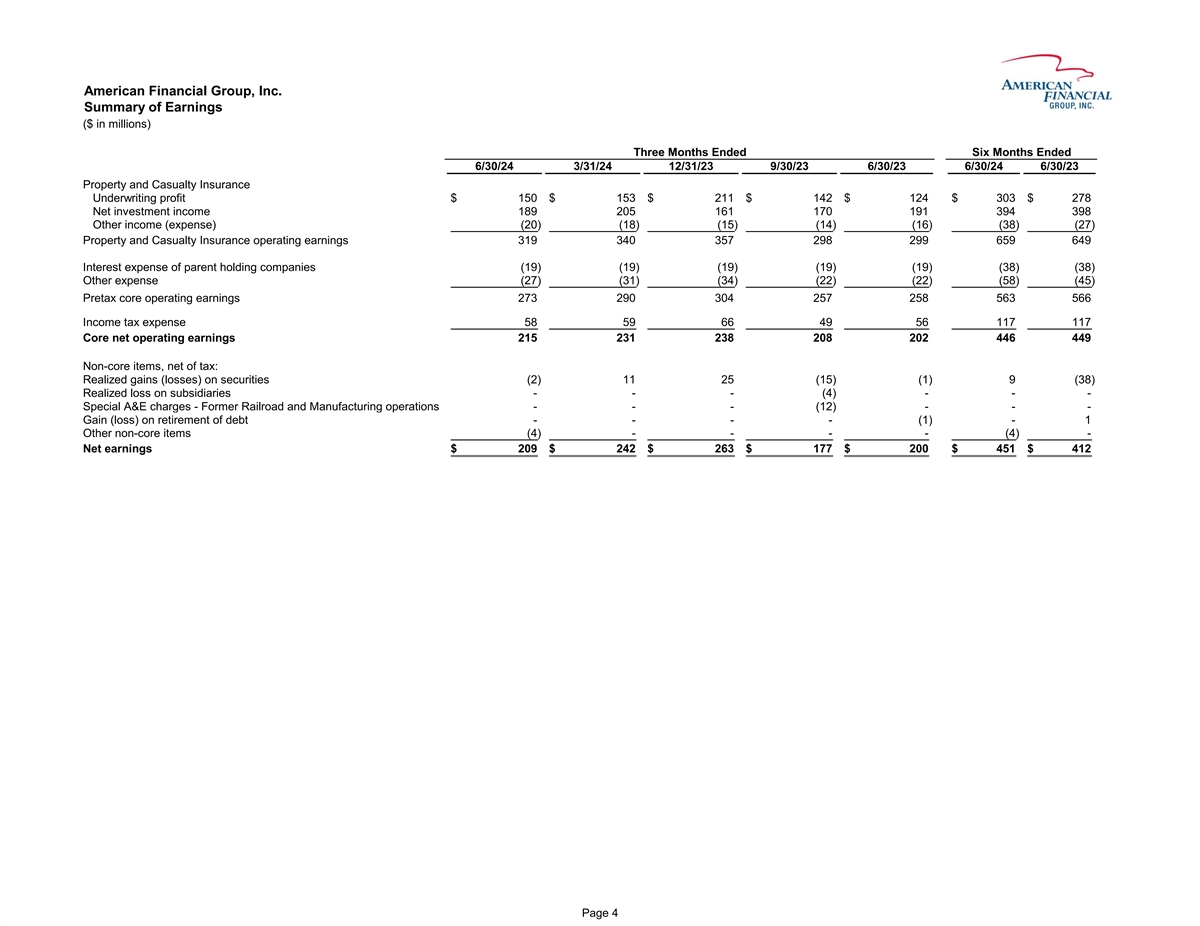
American Financial Group, Inc. Summary of Earnings ($ in millions) Three
Months Ended Six Months Ended 6/30/24 3/31/24 12/31/23 9/30/23 6/30/23 6/30/24 6/30/23 Property and Casualty Insurance Underwriting profit $ 150 $ 153 $ 211 $ 142 $ 124 $ 303 $ 278 Net investment income 189 205 161 170 191 394 398 Other income
(expense) (20) (18) (15) (14) (16) (38) (27) Property and Casualty Insurance operating earnings 319 340 357 298 299 659 649 Interest expense of parent holding companies (19) (19) (19) (19) (19) (38) (38) Other expense (27) (31) (34) (22) (22) (58)
(45) Pretax core operating earnings 273 290 304 257 258 563 566 Income tax expense 58 59 66 49 56 117 117 Core net operating earnings 215 231 238 208 202 446 449 Non-core items, net of tax: Realized gains (losses) on securities (2) 11 25 (15) (1) 9
(38) Realized loss on subsidiaries - - - (4) - - - Special A&E charges - Former Railroad and Manufacturing operations - - - (12) - - - Gain (loss) on retirement of debt - - - - (1) - 1 Other non-core items (4) - - - - (4) - Net earnings $ 209 $
242 $ 263 $ 177 $ 200 $ 451 $ 412 Page 4
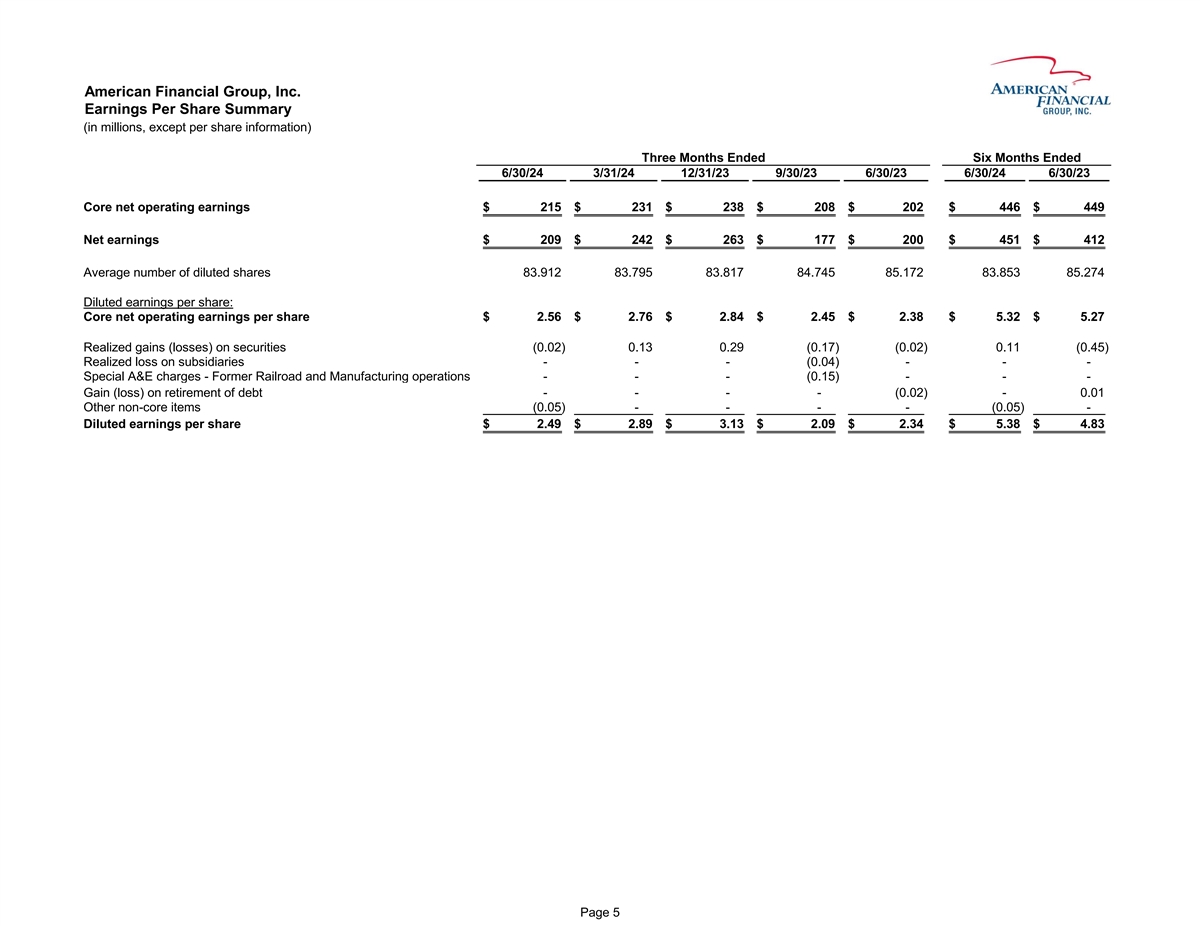
American Financial Group, Inc. Earnings Per Share Summary (in millions,
except per share information) Three Months Ended Six Months Ended 6/30/24 3/31/24 12/31/23 9/30/23 6/30/23 6/30/24 6/30/23 Core net operating earnings $ 215 $ 231 $ 238 $ 208 $ 202 $ 446 $ 449 Net earnings $ 209 $ 242 $ 263 $ 177 $ 200 $ 451 $ 412
Average number of diluted shares 83.912 83.795 83.817 84.745 85.172 83.853 85.274 Diluted earnings per share: Core net operating earnings per share $ 2.56 $ 2.76 $ 2.84 $ 2.45 $ 2.38 $ 5.32 $ 5.27 Realized gains (losses) on securities (0.02) 0.13
0.29 (0.17) (0.02) 0.11 (0.45) Realized loss on subsidiaries - - - (0.04) - - - Special A&E charges - Former Railroad and Manufacturing operations - - - (0.15) - - - Gain (loss) on retirement of debt - - - - (0.02) - 0.01 Other non-core items
(0.05) - - - - (0.05) - Diluted earnings per share $ 2.49 $ 2.89 $ 3.13 $ 2.09 $ 2.34 $ 5.38 $ 4.83 Page 5
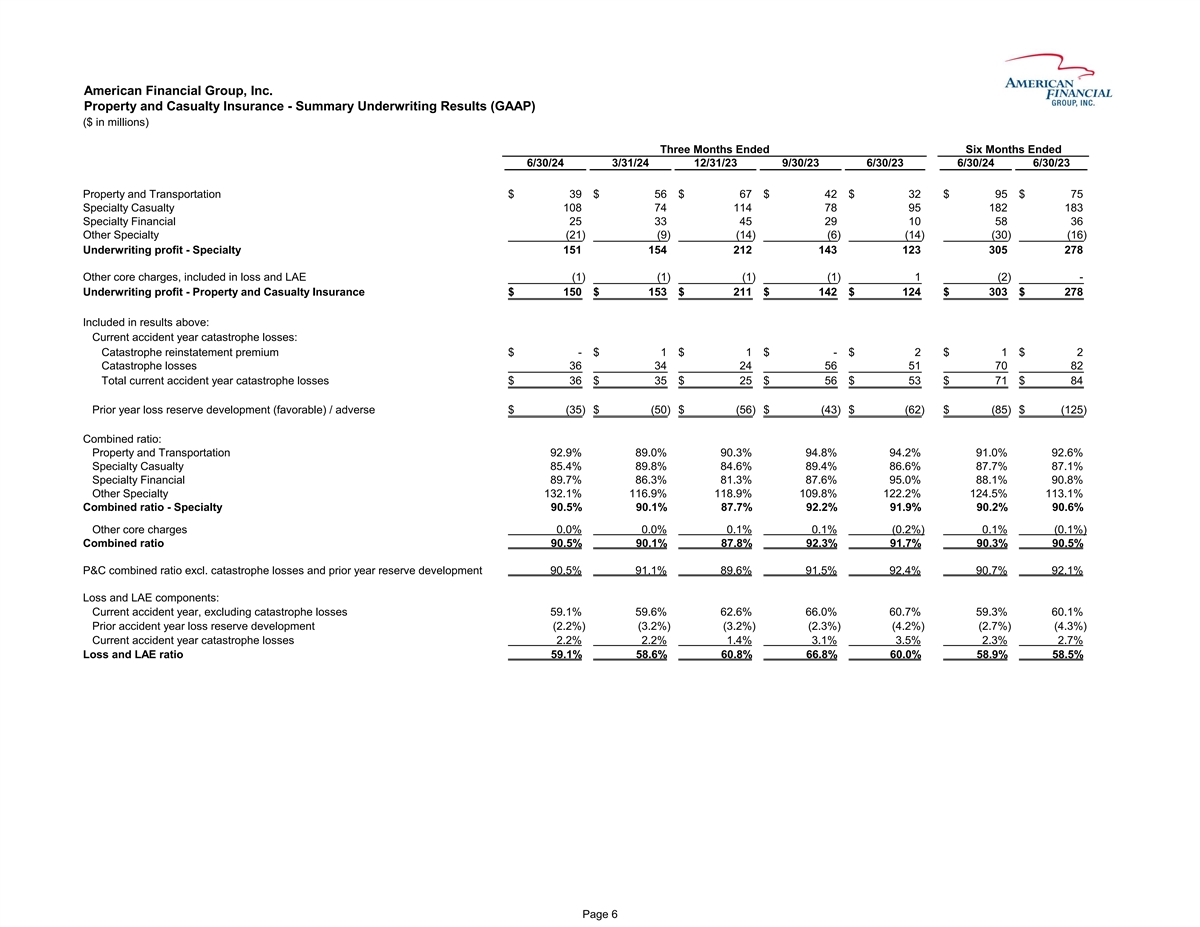
American Financial Group, Inc. Property and Casualty Insurance - Summary
Underwriting Results (GAAP) ($ in millions) Three Months Ended Six Months Ended 6/30/24 3/31/24 12/31/23 9/30/23 6/30/23 6/30/24 6/30/23 Property and Transportation $ 39 $ 56 $ 67 $ 42 $ 32 $ 95 $ 75 Specialty Casualty 108 74 114 78 95 182 183
Specialty Financial 25 33 45 29 10 58 36 Other Specialty (21) (9) (14) (6) (14) (30) (16) Underwriting profit - Specialty 151 154 212 143 123 305 278 Other core charges, included in loss and LAE (1) (1) (1) (1) 1 (2) - Underwriting profit - Property
and Casualty Insurance $ 150 $ 153 $ 211 $ 142 $ 124 $ 303 $ 278 Included in results above: Current accident year catastrophe losses: Catastrophe reinstatement premium $ - $ 1 $ 1 $ - $ 2 $ 1 $ 2 Catastrophe losses 36 34 24 56 51 70 82 Total current
accident year catastrophe losses $ 36 $ 35 $ 25 $ 56 $ 53 $ 71 $ 84 Prior year loss reserve development (favorable) / adverse $ (35) $ (50) $ (56) $ (43) $ (62) $ (85) $ (125) Combined ratio: Property and Transportation 92.9% 89.0% 90.3% 94.8% 94.2%
91.0% 92.6% Specialty Casualty 85.4% 89.8% 84.6% 89.4% 86.6% 87.7% 87.1% Specialty Financial 89.7% 86.3% 81.3% 87.6% 95.0% 88.1% 90.8% Other Specialty 132.1% 116.9% 118.9% 109.8% 122.2% 124.5% 113.1% Combined ratio - Specialty 90.5% 90.1% 87.7%
92.2% 91.9% 90.2% 90.6% Other core charges 0.0% 0.0% 0.1% 0.1% (0.2%) 0.1% (0.1%) Combined ratio 90.5% 90.1% 87.8% 92.3% 91.7% 90.3% 90.5% P&C combined ratio excl. catastrophe losses and prior year reserve development 90.5% 91.1% 89.6% 91.5%
92.4% 90.7% 92.1% Loss and LAE components: Current accident year, excluding catastrophe losses 59.1% 59.6% 62.6% 66.0% 60.7% 59.3% 60.1% Prior accident year loss reserve development (2.2%) (3.2%) (3.2%) (2.3%) (4.2%) (2.7%) (4.3%) Current accident
year catastrophe losses 2.2% 2.2% 1.4% 3.1% 3.5% 2.3% 2.7% Loss and LAE ratio 59.1% 58.6% 60.8% 66.8% 60.0% 58.9% 58.5% Page 6
American Financial Group, Inc. Specialty - Underwriting Results (GAAP)
($ in millions) Three Months Ended Six Months Ended 6/30/24 3/31/24 12/31/23 9/30/23 6/30/23 6/30/24 6/30/23 Gross written premiums $ 2,406 $ 2,336 $ 1,992 $ 3,140 $ 2,369 $ 4,742 $ 4,524 Ceded reinsurance premiums (714) (702) (547) (1,079) (702)
(1,416) (1,338) Net written premiums 1,692 1,634 1,445 2,061 1,667 3,326 3,186 Change in unearned premiums (107) (88) 287 (206) (160) (195) (242) Net earned premiums 1,585 1,546 1,732 1,855 1,507 3,131 2,944 Loss and LAE 936 906 1,052 1,238 906
1,842 1,725 Underwriting expense 498 486 468 474 478 984 941 Underwriting profit $ 151 $ 154 $ 212 $ 143 $ 123 $ 305 $ 278 Included in results above: Current accident year catastrophe losses: Catastrophe reinstatement premium $ - $ 1 $ 1 $ - $ 2 $ 1
$ 2 Catastrophe losses 36 34 24 56 51 70 82 Total current accident year catastrophe losses $ 36 $ 35 $ 25 $ 56 $ 53 $ 71 $ 84 Prior year loss reserve development (favorable) / adverse $ (36) $ (51) $ (57) $ (44) $ (61) $ (87) $ (125) Combined ratio:
Loss and LAE ratio 59.1% 58.6% 60.7% 66.7% 60.2% 58.8% 58.6% Underwriting expense ratio 31.4% 31.5% 27.0% 25.5% 31.7% 31.4% 32.0% Combined ratio 90.5% 90.1% 87.7% 92.2% 91.9% 90.2% 90.6% Specialty combined ratio excl. catastrophe losses and prior
year reserve development 90.5% 91.1% 89.6% 91.5% 92.4% 90.7% 92.1% Loss and LAE components: Current accident year, excluding catastrophe losses 59.1% 59.6% 62.6% 66.0% 60.7% 59.3% 60.1% Prior accident year loss reserve development (2.3%) (3.3%)
(3.3%) (2.3%) (4.0%) (2.8%) (4.2%) Current accident year catastrophe losses 2.3% 2.3% 1.4% 3.0% 3.5% 2.3% 2.7% Loss and LAE ratio 59.1% 58.6% 60.7% 66.7% 60.2% 58.8% 58.6% Page 7
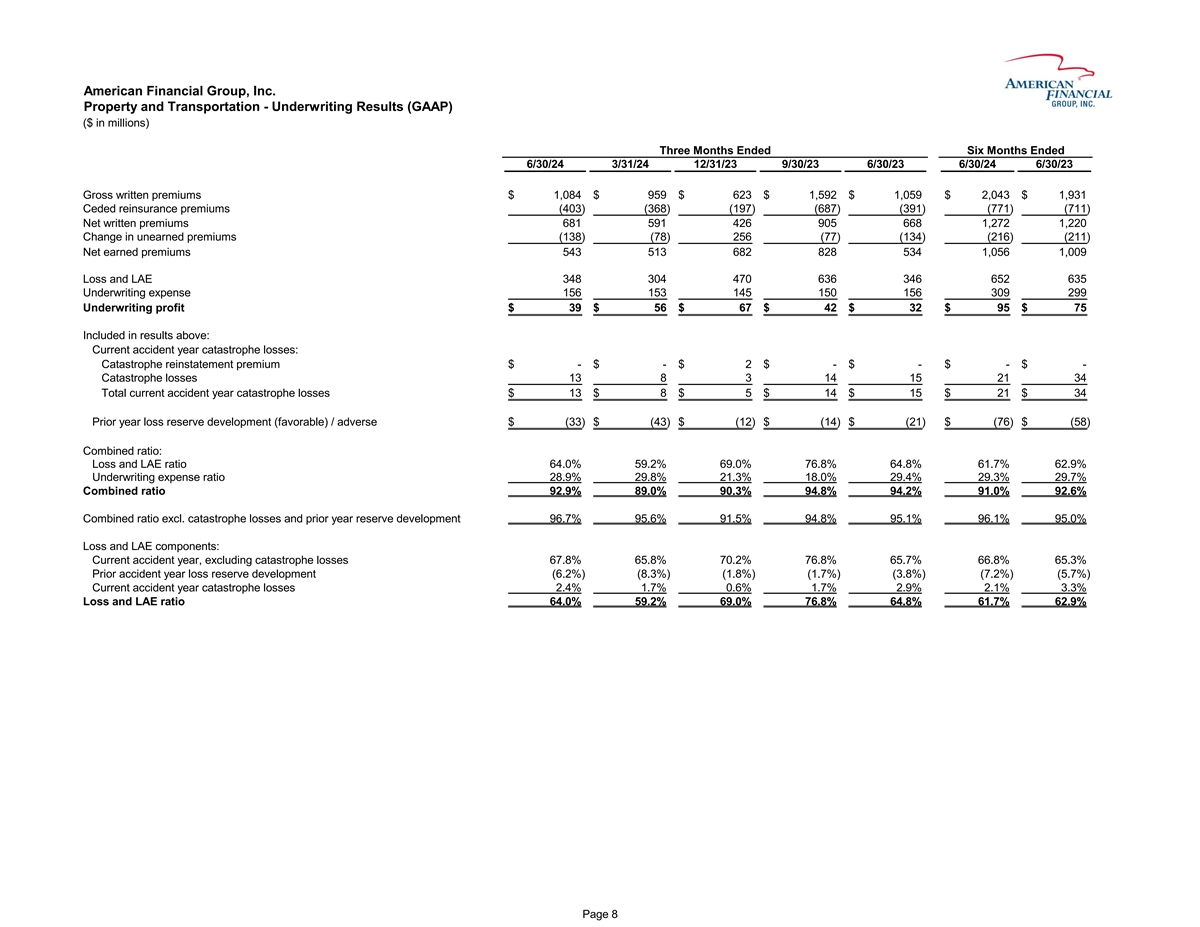
American Financial Group, Inc. Property and Transportation -
Underwriting Results (GAAP) ($ in millions) Three Months Ended Six Months Ended 6/30/24 3/31/24 12/31/23 9/30/23 6/30/23 6/30/24 6/30/23 Gross written premiums $ 1,084 $ 959 $ 623 $ 1,592 $ 1,059 $ 2,043 $ 1,931 Ceded reinsurance premiums (403)
(368) (197) (687) (391) (771) (711) Net written premiums 681 591 426 905 668 1,272 1,220 Change in unearned premiums (138) (78) 256 (77) (134) (216) (211) Net earned premiums 543 513 682 828 534 1,056 1,009 Loss and LAE 348 304 470 636 346 652 635
Underwriting expense 156 153 145 150 156 309 299 Underwriting profit $ 39 $ 56 $ 67 $ 42 $ 32 $ 95 $ 75 Included in results above: Current accident year catastrophe losses: Catastrophe reinstatement premium $ - $ - $ 2 $ - $ - $ - $ - Catastrophe
losses 13 8 3 14 15 21 34 Total current accident year catastrophe losses $ 13 $ 8 $ 5 $ 14 $ 15 $ 21 $ 34 Prior year loss reserve development (favorable) / adverse $ (33) $ (43) $ (12) $ (14) $ (21) $ (76) $ (58) Combined ratio: Loss and LAE ratio
64.0% 59.2% 69.0% 76.8% 64.8% 61.7% 62.9% Underwriting expense ratio 28.9% 29.8% 21.3% 18.0% 29.4% 29.3% 29.7% Combined ratio 92.9% 89.0% 90.3% 94.8% 94.2% 91.0% 92.6% Combined ratio excl. catastrophe losses and prior year reserve development 96.7%
95.6% 91.5% 94.8% 95.1% 96.1% 95.0% Loss and LAE components: Current accident year, excluding catastrophe losses 67.8% 65.8% 70.2% 76.8% 65.7% 66.8% 65.3% Prior accident year loss reserve development (6.2%) (8.3%) (1.8%) (1.7%) (3.8%) (7.2%) (5.7%)
Current accident year catastrophe losses 2.4% 1.7% 0.6% 1.7% 2.9% 2.1% 3.3% Loss and LAE ratio 64.0% 59.2% 69.0% 76.8% 64.8% 61.7% 62.9% Page 8
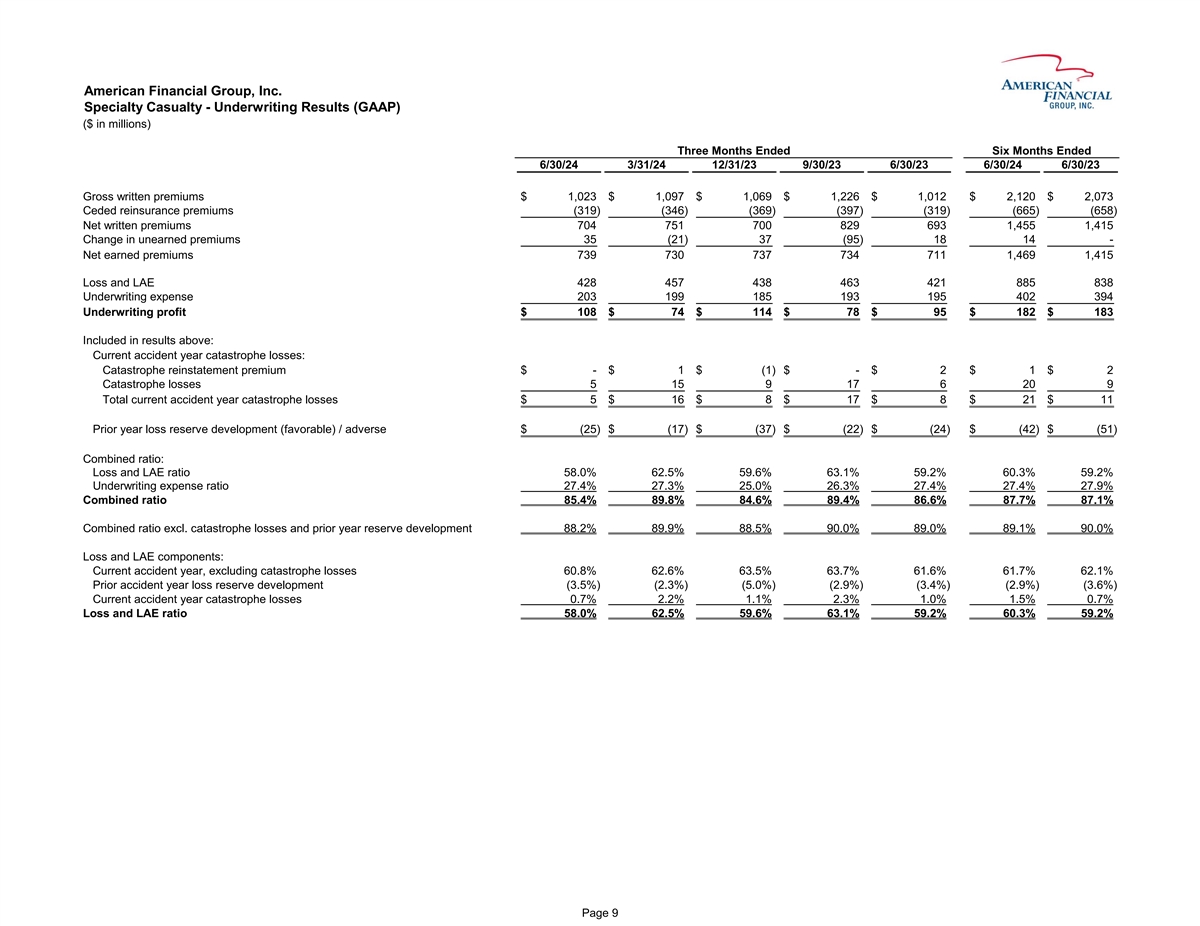
American Financial Group, Inc. Specialty Casualty - Underwriting Results
(GAAP) ($ in millions) Three Months Ended Six Months Ended 6/30/24 3/31/24 12/31/23 9/30/23 6/30/23 6/30/24 6/30/23 Gross written premiums $ 1,023 $ 1,097 $ 1,069 $ 1,226 $ 1,012 $ 2,120 $ 2,073 Ceded reinsurance premiums (319) (346) (369) (397)
(319) (665) (658) Net written premiums 704 751 700 829 693 1,455 1,415 Change in unearned premiums 35 (21) 37 (95) 18 14 - Net earned premiums 739 730 737 734 711 1,469 1,415 Loss and LAE 428 457 438 463 421 885 838 Underwriting expense 203 199 185
193 195 402 394 Underwriting profit $ 108 $ 74 $ 114 $ 78 $ 95 $ 182 $ 183 Included in results above: Current accident year catastrophe losses: Catastrophe reinstatement premium $ - $ 1 $ (1) $ - $ 2 $ 1 $ 2 Catastrophe losses 5 15 9 17 6 20 9 Total
current accident year catastrophe losses $ 5 $ 16 $ 8 $ 17 $ 8 $ 21 $ 11 Prior year loss reserve development (favorable) / adverse $ (25) $ (17) $ (37) $ (22) $ (24) $ (42) $ (51) Combined ratio: Loss and LAE ratio 58.0% 62.5% 59.6% 63.1% 59.2%
60.3% 59.2% Underwriting expense ratio 27.4% 27.3% 25.0% 26.3% 27.4% 27.4% 27.9% Combined ratio 85.4% 89.8% 84.6% 89.4% 86.6% 87.7% 87.1% Combined ratio excl. catastrophe losses and prior year reserve development 88.2% 89.9% 88.5% 90.0% 89. 0% 89.1%
90.0% Loss and LAE components: Current accident year, excluding catastrophe losses 60.8% 62.6% 63.5% 63.7% 61.6% 61.7% 62.1% Prior accident year loss reserve development (3.5%) (2.3%) (5. 0%) (2. 9%) (3.4%) (2. 9%) (3. 6%) Current accident year
catastrophe losses 0.7% 2.2% 1.1% 2.3% 1. 0% 1.5% 0.7% Loss and LAE ratio 58.0% 62.5% 59.6% 63.1% 59.2% 60.3% 59.2% Page 9
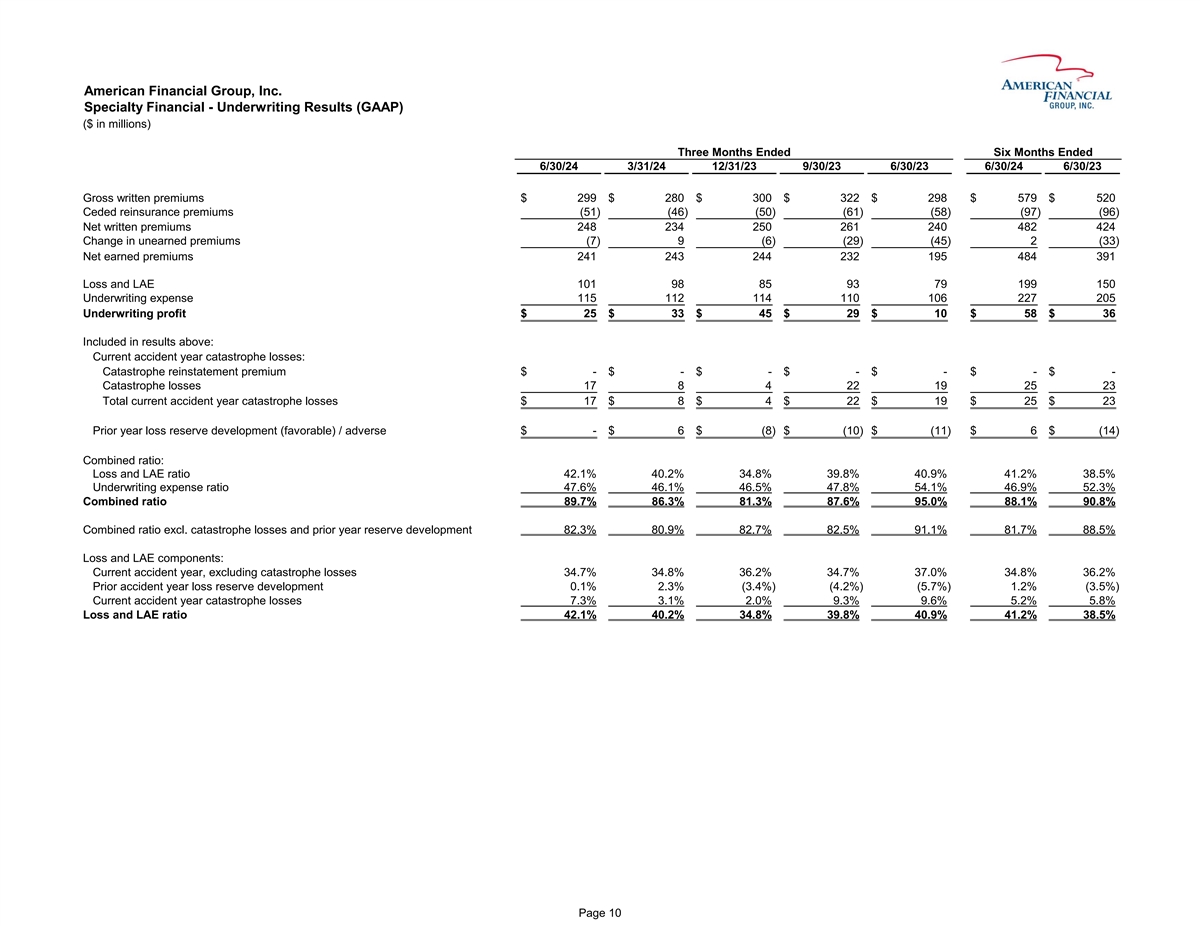
American Financial Group, Inc. Specialty Financial - Underwriting
Results (GAAP) ($ in millions) Three Months Ended Six Months Ended 6/30/24 3/31/24 12/31/23 9/30/23 6/30/23 6/30/24 6/30/23 Gross written premiums $ 299 $ 280 $ 300 $ 322 $ 298 $ 579 $ 520 Ceded reinsurance premiums (51) (46) (50) (61) (58) (97)
(96) Net written premiums 248 234 250 261 240 482 424 Change in unearned premiums (7) 9 (6) (29) (45) 2 (33) Net earned premiums 241 243 244 232 195 484 391 Loss and LAE 101 98 85 93 79 199 150 Underwriting expense 115 112 114 110 106 227 205
Underwriting profit $ 25 $ 33 $ 45 $ 29 $ 10 $ 58 $ 36 Included in results above: Current accident year catastrophe losses: Catastrophe reinstatement premium $ - $ - $ - $ - $ - $ - $ - Catastrophe losses 17 8 4 22 19 25 23 Total current accident
year catastrophe losses $ 17 $ 8 $ 4 $ 22 $ 19 $ 25 $ 23 Prior year loss reserve development (favorable) / adverse $ - $ 6 $ (8) $ (10) $ (11) $ 6 $ (14) Combined ratio: Loss and LAE ratio 42.1% 40.2% 34.8% 39.8% 40.9% 41.2% 38.5% Underwriting
expense ratio 47.6% 46.1% 46.5% 47.8% 54.1% 46.9% 52.3% Combined ratio 89.7% 86.3% 81.3% 87.6% 95.0% 88.1% 90.8% Combined ratio excl. catastrophe losses and prior year reserve development 82.3% 80.9% 82.7% 82.5% 91.1% 81.7% 88.5% Loss and LAE
components: Current accident year, excluding catastrophe losses 34.7% 34.8% 36.2% 34.7% 37.0% 34.8% 36.2% Prior accident year loss reserve development 0.1% 2.3% (3.4%) (4. 2%) (5. 7%) 1.2% (3.5%) Current accident year catastrophe losses 7.3% 3.1%
2.0% 9.3% 9.6% 5.2% 5.8% Loss and LAE ratio 42.1% 40.2% 34.8% 39.8% 40.9% 41.2% 38.5% Page 10
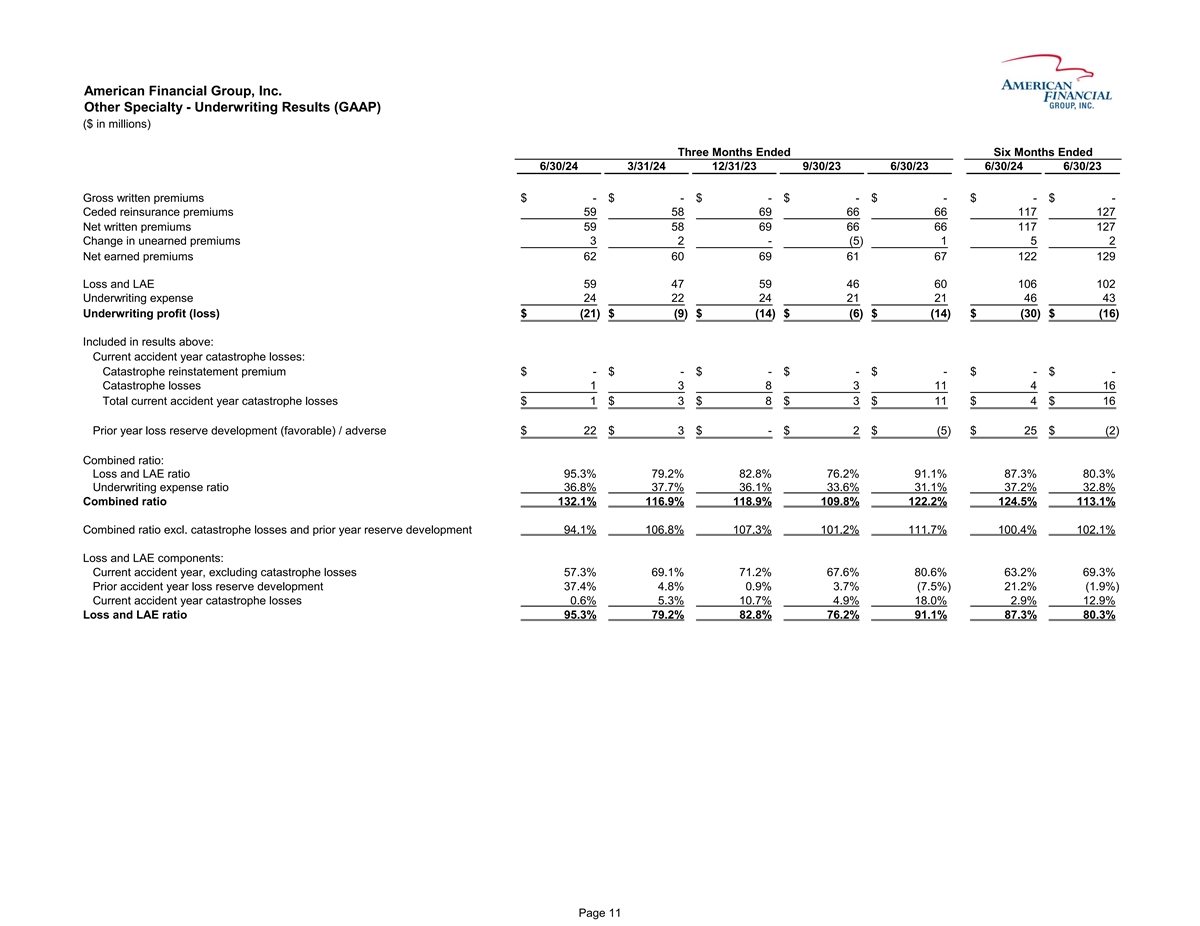
American Financial Group, Inc. Other Specialty - Underwriting Results
(GAAP) ($ in millions) Three Months Ended Six Months Ended 6/30/24 3/31/24 12/31/23 9/30/23 6/30/23 6/30/24 6/30/23 Gross written premiums $ - $ - $ - $ - $ - $ - $ - Ceded reinsurance premiums 59 58 69 66 66 117 127 Net written premiums 59 58 69 66
66 117 127 Change in unearned premiums 3 2 - (5) 1 5 2 Net earned premiums 62 60 69 61 67 122 129 Loss and LAE 59 47 59 46 60 106 102 Underwriting expense 24 22 24 21 21 46 43 Underwriting profit (loss) $ (21) $ (9) $ (14) $ (6) $ (14) $ (30) $ (16)
Included in results above: Current accident year catastrophe losses: Catastrophe reinstatement premium $ - $ - $ - $ - $ - $ - $ - Catastrophe losses 1 3 8 3 11 4 16 Total current accident year catastrophe losses $ 1 $ 3 $ 8 $ 3 $ 11 $ 4 $ 16 Prior
year loss reserve development (favorable) / adverse $ 22 $ 3 $ - $ 2 $ (5) $ 25 $ (2) Combined ratio: Loss and LAE ratio 95.3% 79.2% 82.8% 76.2% 91.1% 87.3% 80.3% Underwriting expense ratio 36.8% 37.7% 36.1% 33.6% 31.1% 37.2% 32.8% Combined ratio
132.1% 116.9% 118.9% 109.8% 122.2% 124.5% 113.1% Combined ratio excl. catastrophe losses and prior year reserve development 94.1% 106.8% 107.3% 101.2% 111.7% 100.4% 102.1% Loss and LAE components: Current accident year, excluding catastrophe losses
57.3% 69.1% 71.2% 67.6% 80.6% 63.2% 69.3% Prior accident year loss reserve development 37.4% 4.8% 0.9% 3.7% (7. 5%) 21.2% (1.9%) Current accident year catastrophe losses 0.6% 5.3% 10.7% 4.9% 18.0% 2.9% 12.9% Loss and LAE ratio 95.3% 79.2% 82.8%
76.2% 91.1% 87.3% 80.3% Page 11
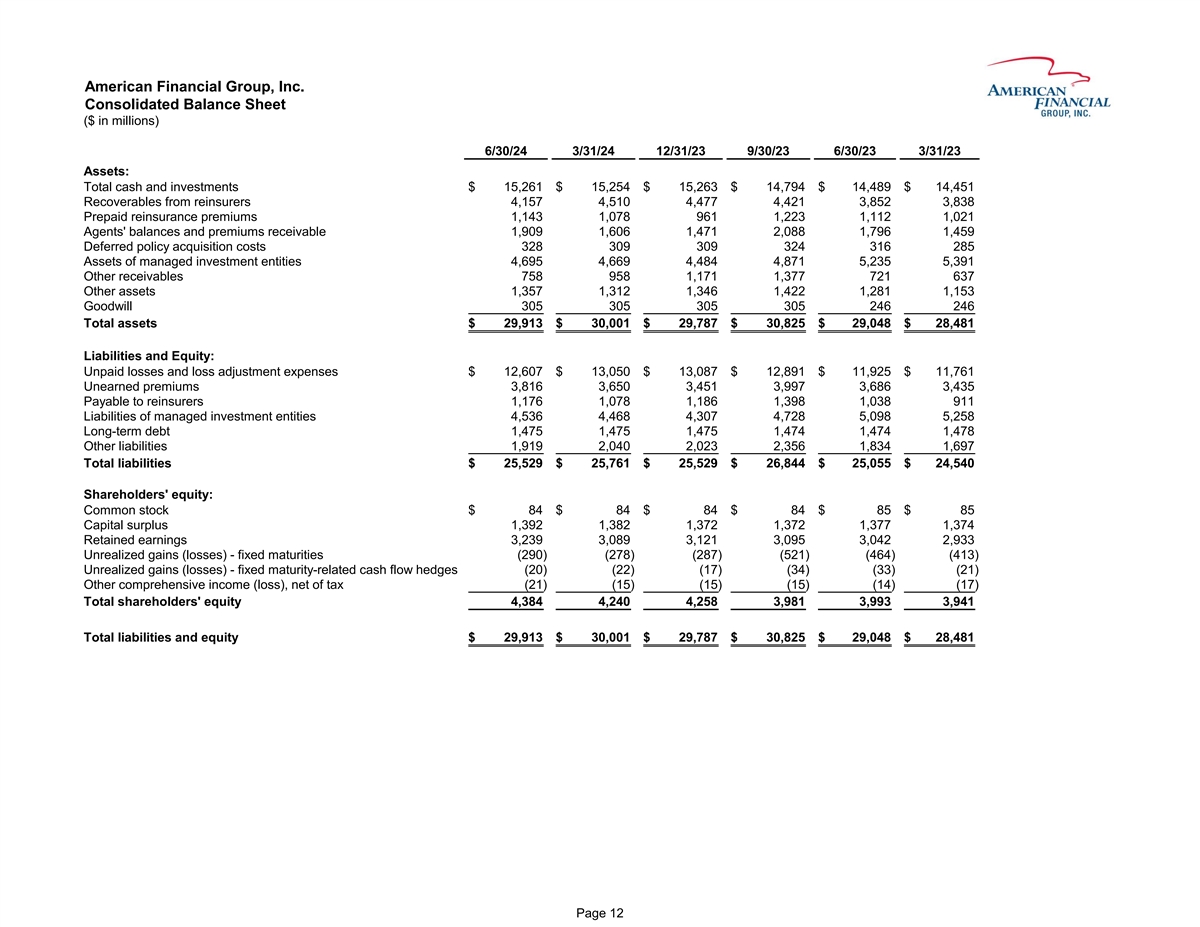
American Financial Group, Inc. Consolidated Balance Sheet ($ in
millions) 6/30/24 3/31/24 12/31/23 9/30/23 6/30/23 3/31/23 Assets: Total cash and investments $ 15,261 $ 15,254 $ 15,263 $ 14,794 $ 14,489 $ 14,451 Recoverables from reinsurers 4,157 4,510 4,477 4,421 3,852 3,838 Prepaid reinsurance premiums 1,143
1,078 961 1,223 1,112 1,021 Agents' balances and premiums receivable 1,909 1,606 1,471 2,088 1,796 1,459 Deferred policy acquisition costs 328 309 309 324 316 285 Assets of managed investment entities 4,695 4,669 4,484 4,871 5,235 5,391 Other
receivables 758 958 1,171 1,377 721 637 Other assets 1,357 1,312 1,346 1,422 1,281 1,153 Goodwill 305 305 305 305 246 246 Total assets $ 29,913 $ 30,001 $ 29,787 $ 30,825 $ 29,048 $ 28,481 Liabilities and Equity: Unpaid losses and loss adjustment
expenses $ 12,607 $ 13,050 $ 13,087 $ 12,891 $ 11,925 $ 11,761 Unearned premiums 3,816 3,650 3,451 3,997 3,686 3,435 Payable to reinsurers 1,176 1,078 1,186 1,398 1,038 911 Liabilities of managed investment entities 4,536 4,468 4,307 4,728 5,098
5,258 Long-term debt 1,475 1,475 1,475 1,474 1,474 1,478 Other liabilities 1,919 2,040 2,023 2,356 1,834 1,697 Total liabilities $ 25,529 $ 25,761 $ 25,529 $ 26,844 $ 25,055 $ 24,540 Shareholders' equity: Common stock $ 84 $ 84 $ 84 $ 84 $ 85 $ 85
Capital surplus 1,392 1,382 1,372 1,372 1,377 1,374 Retained earnings 3,239 3,089 3,121 3,095 3,042 2,933 Unrealized gains (losses) - fixed maturities (290) (278) (287) (521) (464) (413) Unrealized gains (losses) - fixed maturity-related cash flow
hedges (20) (22) (17) (34) (33) (21) Other comprehensive income (loss), net of tax (21) (15) (15) (15) (14) (17) Total shareholders' equity 4,384 4,240 4,258 3,981 3,993 3,941 Total liabilities and equity $ 29,913 $ 30,001 $ 29,787 $ 30,825 $ 29,048
$ 28,481 Page 12
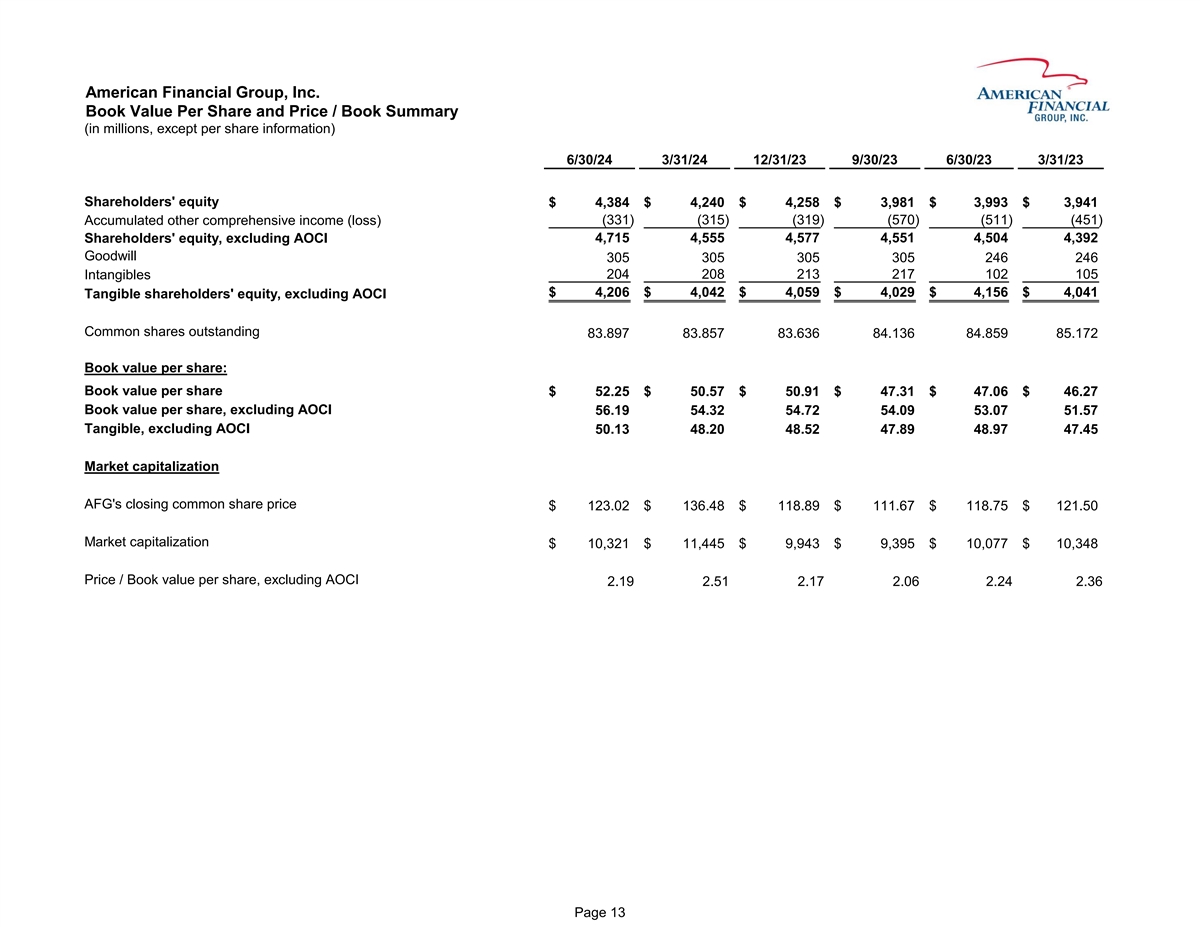
American Financial Group, Inc. Book Value Per Share and Price / Book
Summary (in millions, except per share information) 6/30/24 3/31/24 12/31/23 9/30/23 6/30/23 3/31/23 Shareholders' equity $ 4,384 $ 4,240 $ 4,258 $ 3,981 $ 3,993 $ 3,941 Accumulated other comprehensive income (loss) (331) (315) (319) (570) (511)
(451) Shareholders' equity, excluding AOCI 4,715 4,555 4,577 4,551 4,504 4,392 Goodwill 305 305 305 305 246 246 Intangibles 204 208 213 217 102 105 $ 4,206 $ 4,042 $ 4,059 $ 4,029 $ 4,156 $ 4,041 Tangible shareholders' equity, excluding AOCI Common
shares outstanding 83.897 83.857 83.636 84.136 84.859 85.172 Book value per share: Book value per share $ 52.25 $ 50.57 $ 50.91 $ 47.31 $ 47.06 $ 46.27 Book value per share, excluding AOCI 56.19 54.32 54.72 54.09 53.07 51.57 Tangible, excluding AOCI
50.13 48.20 48.52 47.89 48.97 47.45 Market capitalization AFG's closing common share price $ 123.02 $ 136.48 $ 118.89 $ 111.67 $ 118.75 $ 121.50 Market capitalization $ 10,321 $ 11,445 $ 9,943 $ 9,395 $ 10,077 $ 10,348 Price / Book value per share,
excluding AOCI 2.19 2.51 2.17 2.06 2.24 2.36 Page 13
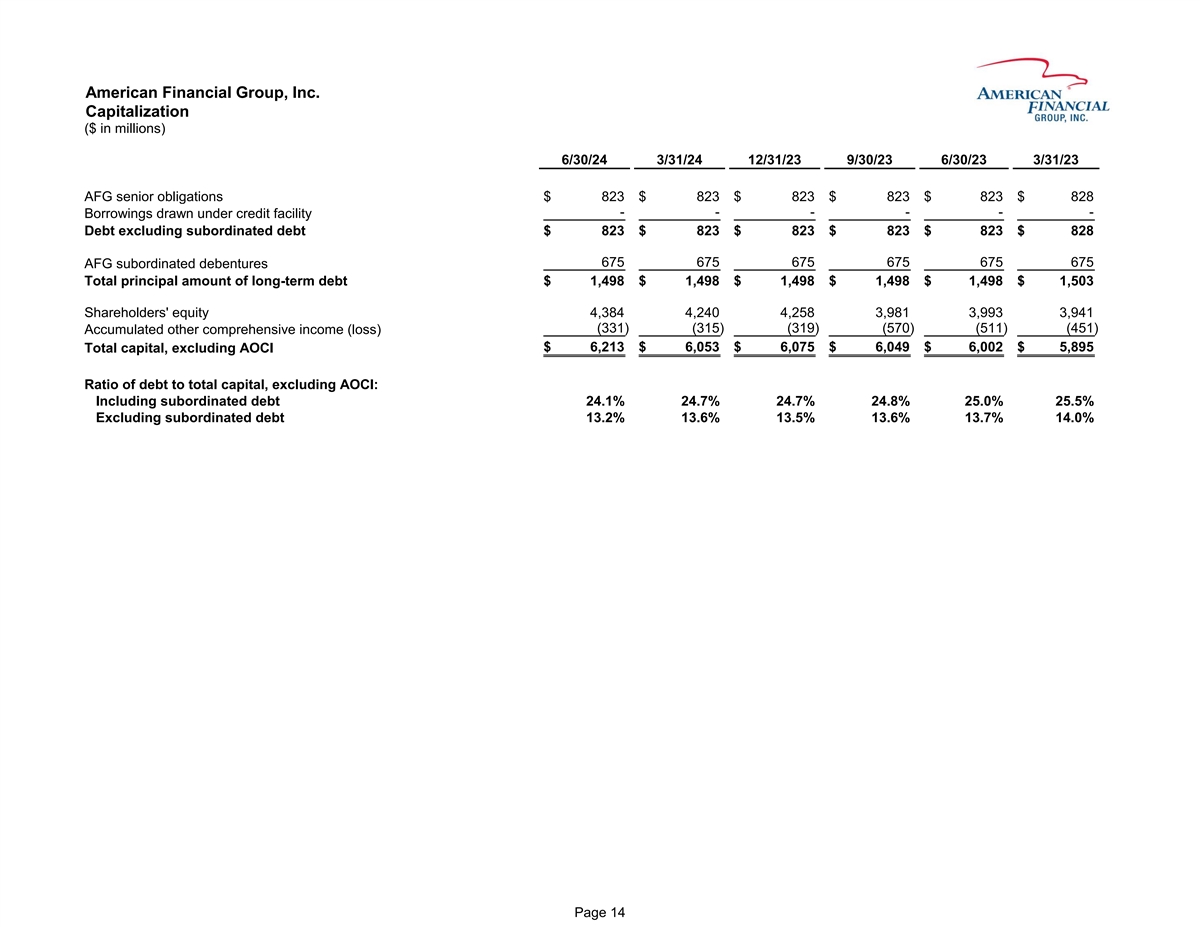
American Financial Group, Inc. Capitalization ($ in millions) 6/30/24
3/31/24 12/31/23 9/30/23 6/30/23 3/31/23 AFG senior obligations $ 823 $ 823 $ 823 $ 823 $ 823 $ 828 - - - - - - Borrowings drawn under credit facility Debt excluding subordinated debt $ 823 $ 823 $ 823 $ 823 $ 823 $ 828 675 675 675 675 675 675 AFG
subordinated debentures Total principal amount of long-term debt $ 1,498 $ 1,498 $ 1,498 $ 1,498 $ 1,498 $ 1,503 Shareholders' equity 4,384 4,240 4,258 3,981 3,993 3,941 (331) (3 15) (319) (570) (511) (451) Accumulated other comprehensive income
(loss) Total capital, excluding AOCI $ 6,213 $ 6,053 $ 6,075 $ 6,049 $ 6,002 $ 5,895 Ratio of debt to total capital, excluding AOCI: Including subordinated debt 24.1% 24.7% 24.7% 24.8% 25.0% 2 5.5% Excluding subordinated debt 13.2% 13.6% 13.5% 13.6%
13.7% 14.0% Page 14
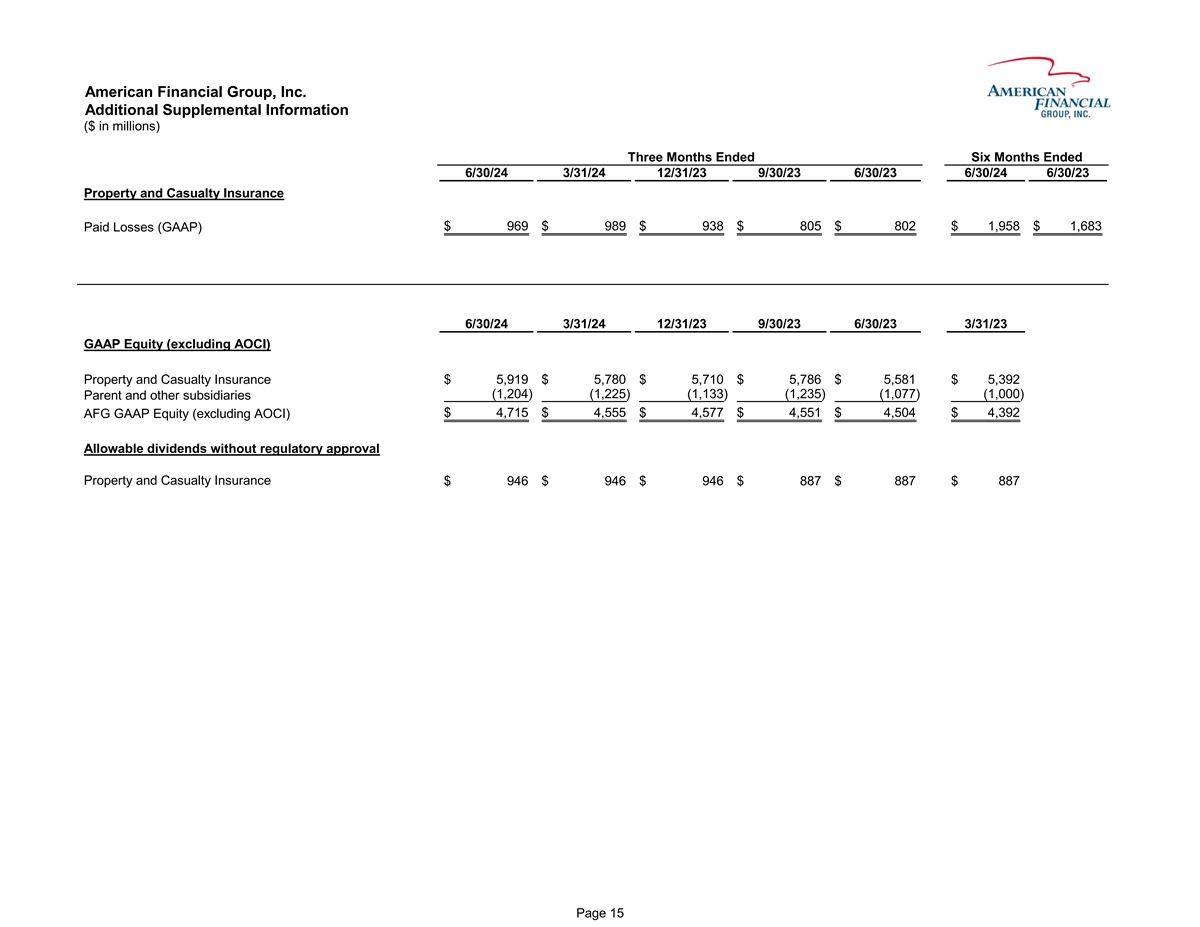
American Financial Group, Inc. Additional Supplemental Information ($
in millions) Three Months Ended Six Months Ended 6/30/24 3/31/24 12/31/23 9/30/23 6/30/23 6/30/24 6/30/23 Property and Casualty Insurance $ 969 $ 989 $ 938 $ 805 $ 802 $ 1,958 $ 1,683 Paid Losses (GAAP) 6/30/24 3/31/24 12/31/23 9/30/23 6/30/23
3/31/23 GAAP Equity (excluding AOCI) Property and Casualty Insurance $ 5,919 $ 5,780 $ 5,710 $ 5,786 $ 5,581 $ 5,392 (1,204) ( 1,225) ( 1,133) ( 1,235) ( 1,077) (1,000) Parent and other subsidiaries $ 4,715 $ 4,555 $ 4,577 $ 4,551 $ 4,504 $ 4,392
AFG GAAP Equity (excluding AOCI) Allowable dividends without regulatory approval Property and Casualty Insurance $ 946 $ 946 $ 946 $ 887 $ 887 $ 887 Page 15
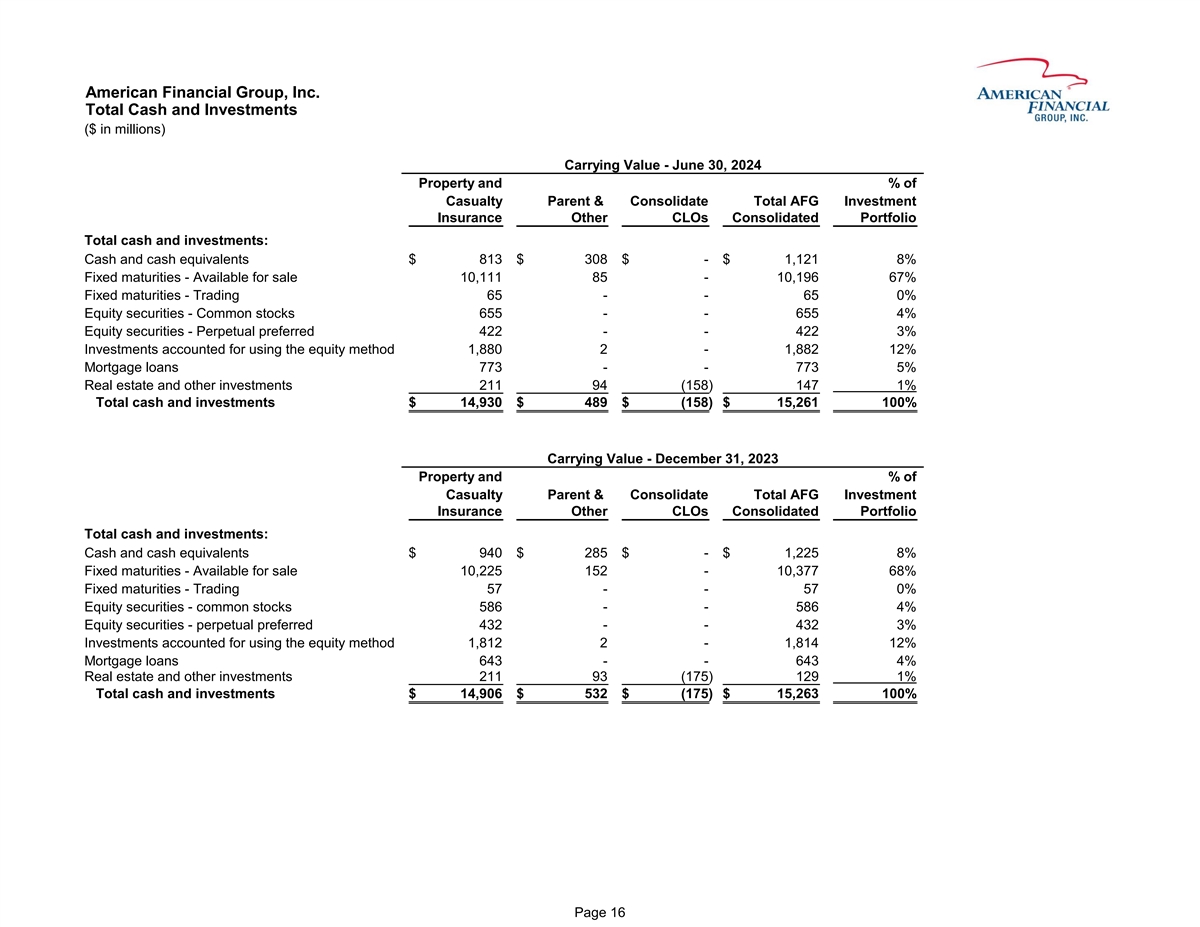
American Financial Group, Inc. Total Cash and Investments ($ in
millions) Carrying Value - June 30, 2024 Property and % of Casualty Parent & Consolidate Total AFG Investment Insurance Other CLOs Consolidated Portfolio Total cash and investments: Cash and cash equivalents $ 813 $ 308 $ - $ 1,121 8% Fixed
maturities - Available for sale 10,111 85 - 10,196 67% Fixed maturities - Trading 65 - - 65 0% Equity securities - Common stocks 655 - - 655 4% Equity securities - Perpetual preferred 422 - - 422 3% Investments accounted for using the equity method
1,880 2 - 1,882 12% Mortgage loans 773 - - 773 5% Real estate and other investments 211 94 (158) 147 1% Total cash and investments $ 14,930 $ 489 $ (158) $ 15,261 100% Carrying Value - December 31, 2023 Property and % of Casualty Parent &
Consolidate Total AFG Investment Insurance Other CLOs Consolidated Portfolio Total cash and investments: Cash and cash equivalents $ 940 $ 285 $ - $ 1,225 8% Fixed maturities - Available for sale 10,225 152 - 10,377 68% Fixed maturities - Trading 57
- - 57 0% Equity securities - common stocks 586 - - 586 4% Equity securities - perpetual preferred 432 - - 432 3% Investments accounted for using the equity method 1,812 2 - 1,814 12% Mortgage loans 643 - - 643 4% Real estate and other investments
211 93 (175) 129 1% Total cash and investments $ 14,906 $ 532 $ (175) $ 15,263 100% Page 16
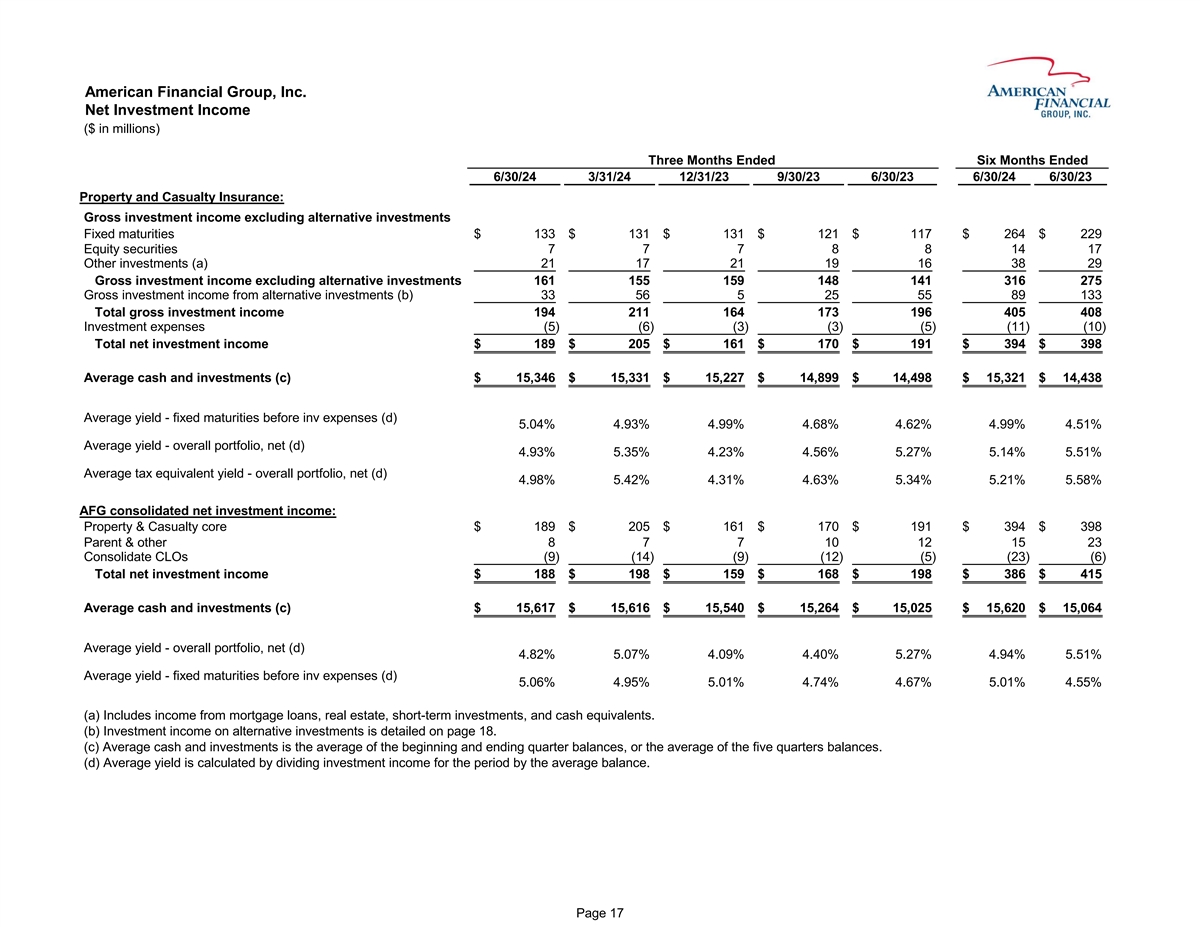
American Financial Group, Inc. Net Investment Income ($ in millions)
Three Months Ended Six Months Ended 6/30/24 3/31/24 12/31/23 9/30/23 6/30/23 6/30/24 6/30/23 Property and Casualty Insurance: Gross investment income excluding alternative investments Fixed maturities $ 133 $ 131 $ 131 $ 121 $ 117 $ 264 $ 229 Equity
securities 7 7 7 8 8 14 17 Other investments (a) 21 17 21 19 16 38 29 Gross investment income excluding alternative investments 161 155 159 148 141 316 275 Gross investment income from alternative investments (b) 33 56 5 25 55 89 133 Total gross
investment income 194 211 164 173 196 405 408 Investment expenses (5) (6) (3) (3) (5) (11) (10) Total net investment income $ 189 $ 205 $ 161 $ 170 $ 191 $ 394 $ 398 Average cash and investments (c) $ 15,346 $ 15,331 $ 15,227 $ 14,899 $ 14,498 $
15,321 $ 14,438 Average yield - fixed maturities before inv expenses (d) 5.04% 4.93% 4.99% 4.68% 4.62% 4.99% 4.51% Average yield - overall portfolio, net (d) 4.93% 5.35% 4.23% 4.56% 5.27% 5.14% 5.51% Average tax equivalent yield - overall portfolio,
net (d) 4.98% 5.42% 4.31% 4.63% 5.34% 5.21% 5.58% AFG consolidated net investment income: Property & Casualty core $ 189 $ 205 $ 161 $ 170 $ 191 $ 394 $ 398 Parent & other 8 7 7 10 12 15 23 Consolidate CLOs (9) (14) (9) (12) (5) (23) (6)
Total net investment income $ 188 $ 198 $ 159 $ 168 $ 198 $ 386 $ 415 Average cash and investments (c) $ 15,617 $ 15,616 $ 15,540 $ 15,264 $ 15,025 $ 15,620 $ 15,064 Average yield - overall portfolio, net (d) 4.82% 5.07% 4.09% 4.40% 5.27% 4.94%
5.51% Average yield - fixed maturities before inv expenses (d) 5.06% 4.95% 5.01% 4.74% 4.67% 5.01% 4.55% (a) Includes income from mortgage loans, real estate, short-term investments, and cash equivalents. (b) Investment income on alternative
investments is detailed on page 18. (c) Average cash and investments is the average of the beginning and ending quarter balances, or the average of the five quarters balances. (d) Average yield is calculated by dividing investment income for the
period by the average balance. Page 17
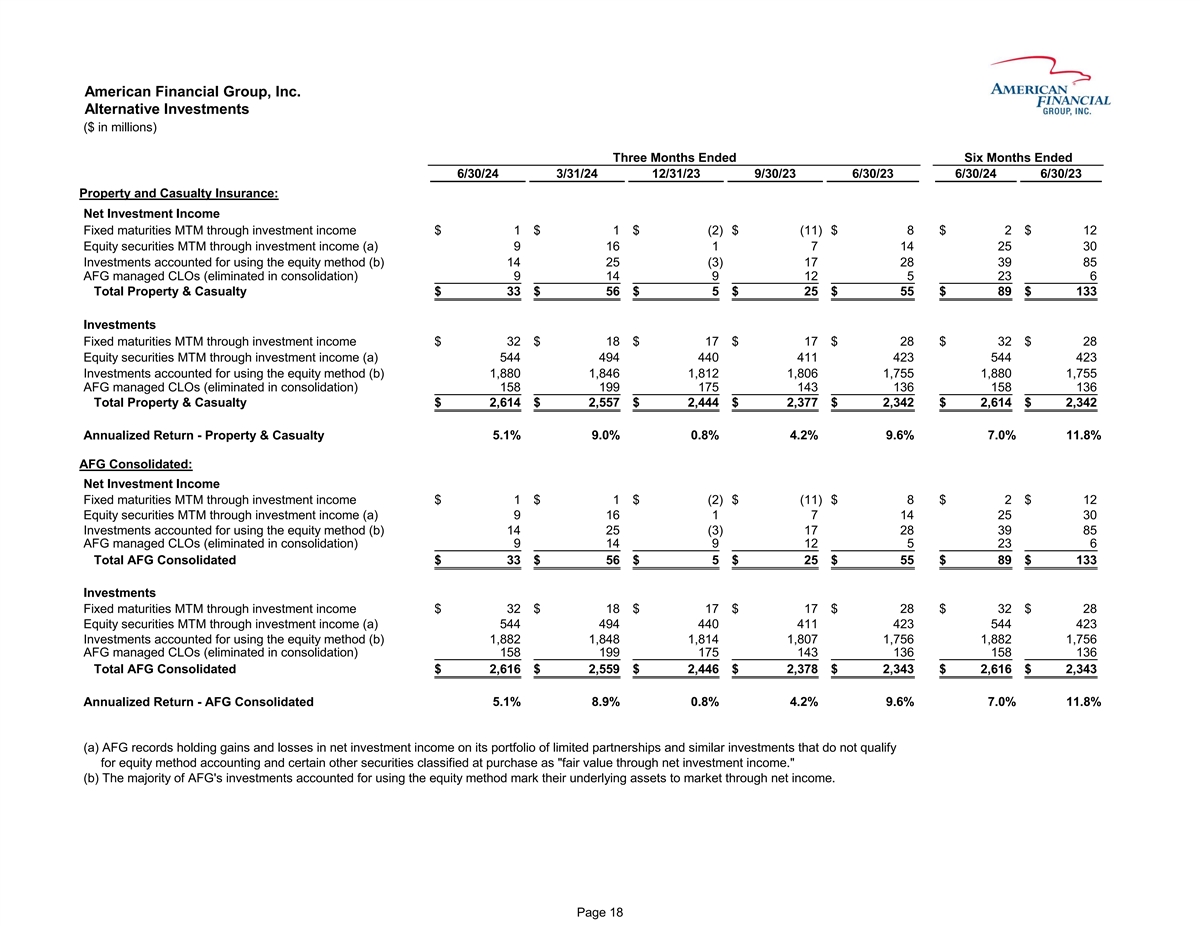
American Financial Group, Inc. Alternative Investments ($ in millions)
Three Months Ended Six Months Ended 6/30/24 3/31/24 12/31/23 9/30/23 6/30/23 6/30/24 6/30/23 Property and Casualty Insurance: Net Investment Income Fixed maturities MTM through investment income $ 1 $ 1 $ (2) $ (11) $ 8 $ 2 $ 12 Equity securities
MTM through investment income (a) 9 16 1 7 14 25 30 Investments accounted for using the equity method (b) 14 25 (3) 17 28 39 85 AFG managed CLOs (eliminated in consolidation) 9 14 9 12 5 23 6 Total Property & Casualty $ 33 $ 56 $ 5 $ 25 $ 55 $
89 $ 133 Investments Fixed maturities MTM through investment income $ 32 $ 18 $ 17 $ 17 $ 28 $ 32 $ 28 Equity securities MTM through investment income (a) 544 494 440 411 423 544 423 Investments accounted for using the equity method (b) 1 ,880 1
,846 1 ,812 1 ,806 1,755 1 ,880 1 ,755 AFG managed CLOs (eliminated in consolidation) 158 199 175 143 136 158 136 Total Property & Casualty $ 2 ,614 $ 2 ,557 $ 2 ,444 $ 2 ,377 $ 2,342 $ 2 ,614 $ 2 ,342 Annualized Return - Property & Casualty
5.1% 9.0% 0.8% 4.2% 9 .6% 7.0% 11.8% AFG Consolidated: Net Investment Income Fixed maturities MTM through investment income $ 1 $ 1 $ (2) $ (11) $ 8 $ 2 $ 12 Equity securities MTM through investment income (a) 9 16 1 7 14 25 30 Investments accounted
for using the equity method (b) 14 25 (3) 17 28 39 85 AFG managed CLOs (eliminated in consolidation) 9 14 9 12 5 23 6 Total AFG Consolidated $ 33 $ 56 $ 5 $ 25 $ 55 $ 89 $ 133 Investments Fixed maturities MTM through investment income $ 32 $ 18 $ 17
$ 17 $ 28 $ 32 $ 28 Equity securities MTM through investment income (a) 544 494 440 411 423 544 423 Investments accounted for using the equity method (b) 1 ,882 1 ,848 1 ,814 1 ,807 1,756 1 ,882 1 ,756 AFG managed CLOs (eliminated in consolidation)
158 199 175 143 136 158 136 Total AFG Consolidated $ 2 ,616 $ 2 ,559 $ 2 ,446 $ 2 ,378 $ 2,343 $ 2 ,616 $ 2 ,343 Annualized Return - AFG Consolidated 5.1% 8.9% 0.8% 4.2% 9 .6% 7.0% 11.8% (a) AFG records holding gains and losses in net investment
income on its portfolio of limited partnerships and similar investments that do not qualify for equity method accounting and certain other securities classified at purchase as fair value through net investment income. (b) The majority of AFG's
investments accounted for using the equity method mark their underlying assets to market through net income. Page 18
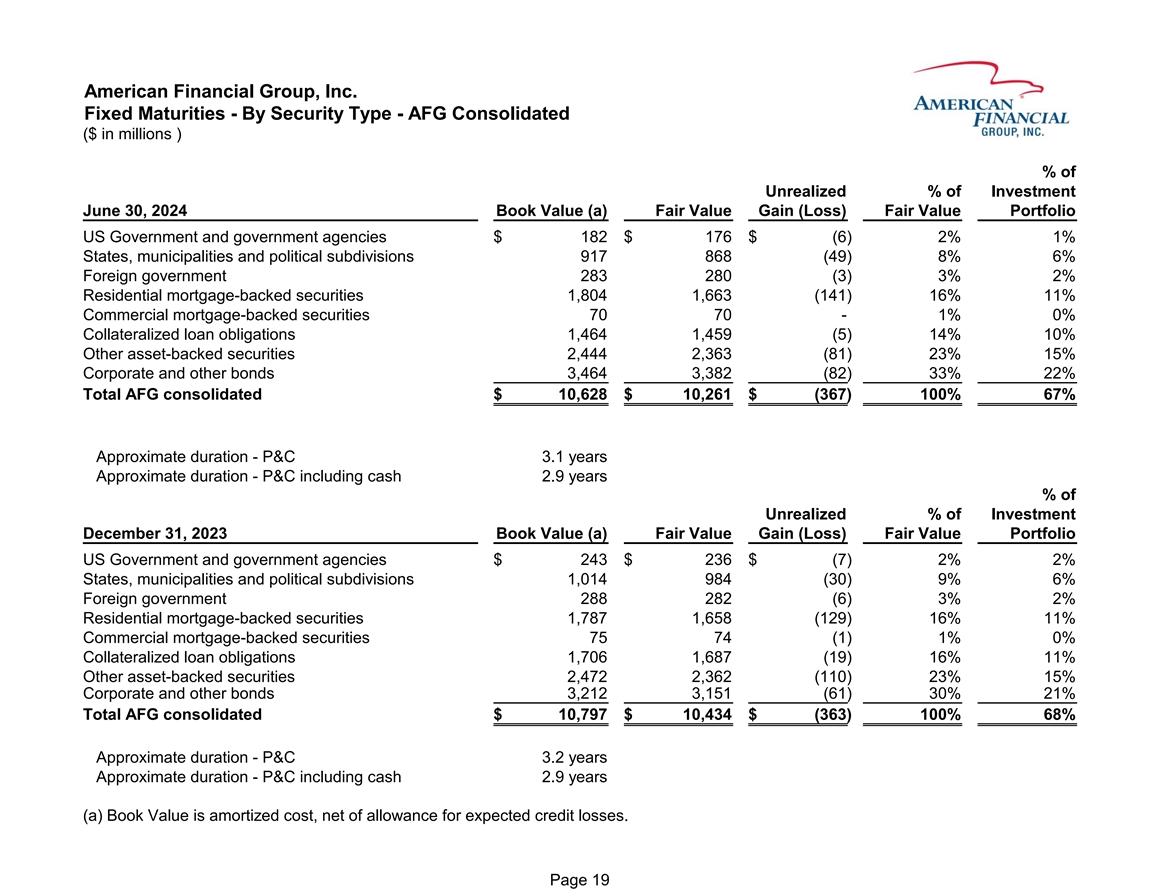
American Financial Group, Inc. Fixed Maturities - By Security Type -
AFG Consolidated ($ in millions ) % of Unrealized % of Investment June 30, 2024 Book Value (a) Fair Value Gain (Loss) Fair Value Portfolio US Government and government agencies $ 182 $ 176 $ (6) 2% 1% States, municipalities and political
subdivisions 917 868 (49) 8% 6% Foreign government 283 280 (3) 3% 2% Residential mortgage-backed securities 1,804 1,663 (141) 16% 11% Commercial mortgage-backed securities 70 70 - 1% 0% Collateralized loan obligations 1,464 1,459 (5) 14% 10% Other
asset-backed securities 2,444 2,363 (81) 23% 15% Corporate and other bonds 3,464 3,382 (82) 33% 22% Total AFG consolidated $ 10,628 $ 10,261 $ (367) 100% 67% Approximate duration - P&C 3.1 years Approximate duration - P&C including cash 2.9
years % of Unrealized % of Investment December 31, 2023 Book Value (a) Fair Value Gain (Loss) Fair Value Portfolio US Government and government agencies $ 243 $ 236 $ (7) 2% 2% States, municipalities and political subdivisions 1,014 984 (30) 9% 6%
Foreign government 288 282 (6) 3% 2% Residential mortgage-backed securities 1,787 1,658 (129) 16% 11% Commercial mortgage-backed securities 75 74 (1) 1% 0% Collateralized loan obligations 1,706 1,687 (19) 16% 11% Other asset-backed securities 2,472
2,362 (110) 23% 15% Corporate and other bonds 3,212 3,151 (61) 30% 21% Total AFG consolidated $ 10,797 $ 10,434 $ ( 363) 100% 68% Approximate duration - P&C 3.2 years Approximate duration - P&C including cash 2.9 years (a) Book Value is
amortized cost, net of allowance for expected credit losses. Page 19
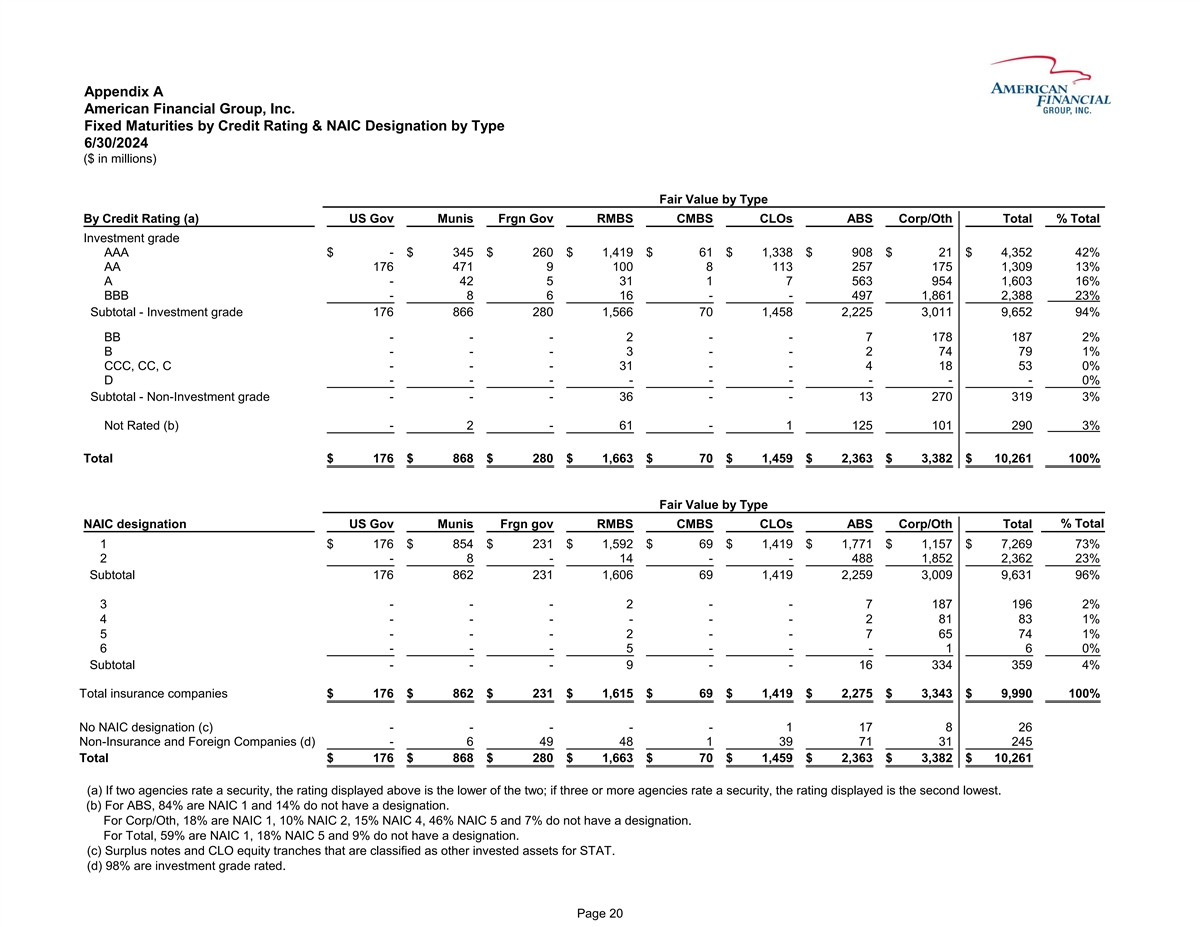
Appendix A American Financial Group, Inc. Fixed Maturities by Credit
Rating & NAIC Designation by Type 6/30/2024 ($ in millions) Fair Value by Type By Credit Rating (a) US Gov Munis Frgn Gov RMBS CMBS CLOs ABS Corp/Oth Total % Total Investment grade AAA $ - $ 345 $ 260 $ 1,419 $ 61 $ 1,338 $ 908 $ 21 $ 4,352 42%
AA 176 471 9 100 8 113 257 175 1,309 13% A - 42 5 31 1 7 563 954 1,603 16% BBB - 8 6 16 - - 497 1,861 2,388 23% Subtotal - Investment grade 176 866 280 1,566 70 1,458 2,225 3,011 9,652 94% BB - - - 2 - - 7 178 187 2% B - - - 3 - - 2 74 79 1% CCC,
CC, C - - - 31 - - 4 18 53 0% D - - - - - - - - - 0% Subtotal - Non-Investment grade - - - 36 - - 13 270 319 3% Not Rated (b) - 2 - 61 - 1 125 101 290 3% Total $ 176 $ 868 $ 280 $ 1,663 $ 70 $ 1,459 $ 2,363 $ 3,382 $ 10,261 100% Fair Value by Type %
Total NAIC designation US Gov Munis Frgn gov RMBS CMBS CLOs ABS Corp/Oth Total 1 $ 176 $ 854 $ 231 $ 1,592 $ 69 $ 1,419 $ 1,771 $ 1,157 $ 7,269 73% 2 - 8 - 14 - - 488 1,852 2,362 23% Subtotal 176 862 231 1,606 69 1,419 2,259 3,009 9,631 96% 3 - - -
2 - - 7 187 196 2% 4 - - - - - - 2 81 83 1% 5 - - - 2 - - 7 65 74 1% 6 - - - 5 - - - 1 6 0% Subtotal - - - 9 - - 16 334 359 4% Total insurance companies $ 176 $ 862 $ 231 $ 1,615 $ 69 $ 1,419 $ 2,275 $ 3,343 $ 9,990 100% No NAIC designation (c) - -
- - - 1 17 8 26 Non-Insurance and Foreign Companies (d) - 6 49 48 1 39 71 31 245 Total $ 176 $ 868 $ 280 $ 1,663 $ 70 $ 1,459 $ 2,363 $ 3,382 $ 10,261 (a) If two agencies rate a security, the rating displayed above is the lower of the two; if three
or more agencies rate a security, the rating displayed is the second lowest. (b) For ABS, 84% are NAIC 1 and 14% do not have a designation. For Corp/Oth, 18% are NAIC 1, 10% NAIC 2, 15% NAIC 4, 46% NAIC 5 and 7% do not have a designation. For Total,
59% are NAIC 1, 18% NAIC 5 and 9% do not have a designation. (c) Surplus notes and CLO equity tranches that are classified as other invested assets for STAT. (d) 98% are investment grade rated. Page 20
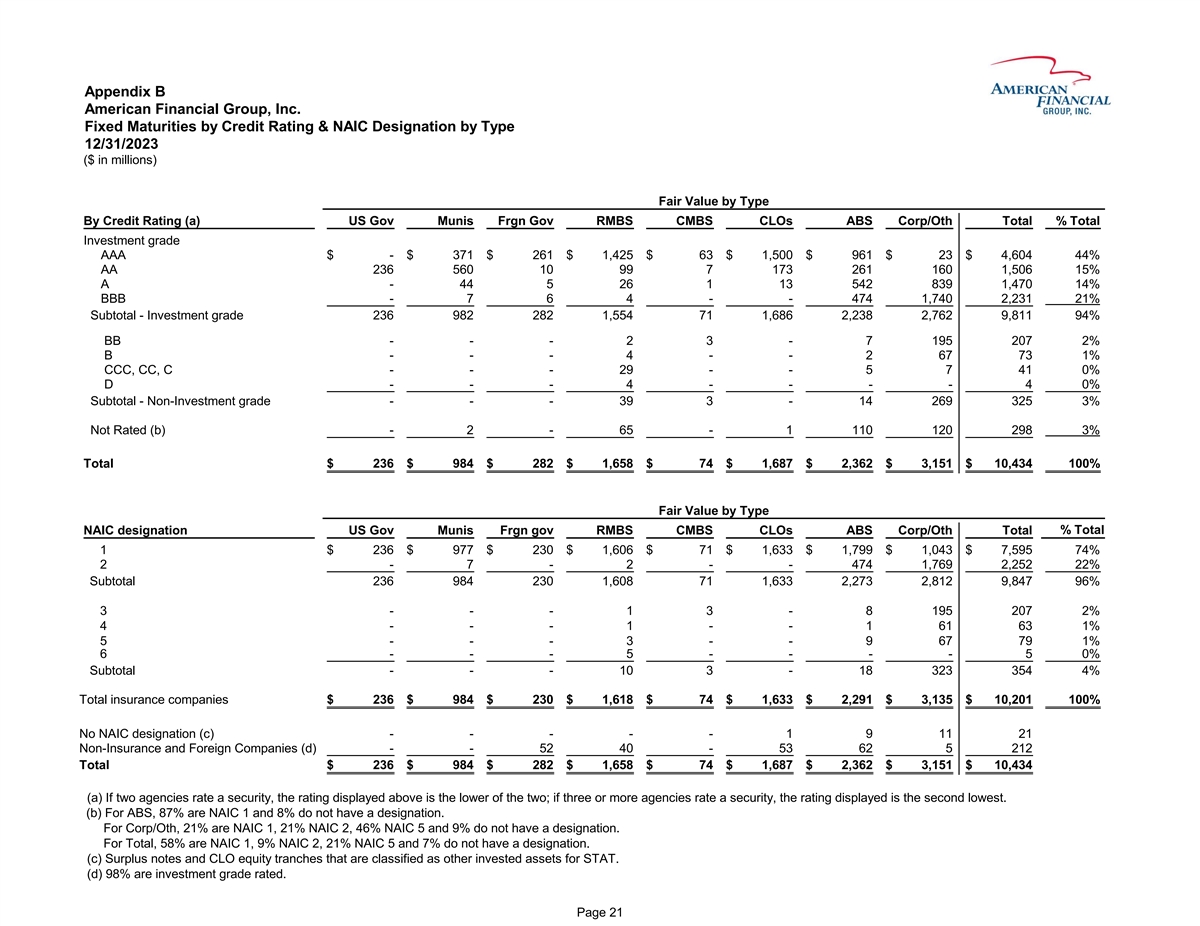
Appendix B American Financial Group, Inc. Fixed Maturities by Credit
Rating & NAIC Designation by Type 12/31/2023 ($ in millions) Fair Value by Type By Credit Rating (a) US Gov Munis Frgn Gov RMBS CMBS CLOs ABS Corp/Oth Total % Total Investment grade AAA $ - $ 371 $ 261 $ 1,425 $ 63 $ 1,500 $ 961 $ 23 $ 4,604 44%
AA 236 560 10 99 7 173 261 160 1,506 15% A - 44 5 26 1 13 542 839 1,470 14% BBB - 7 6 4 - - 474 1,740 2,231 21% Subtotal - Investment grade 236 982 282 1,554 71 1,686 2,238 2,762 9,811 94% BB - - - 2 3 - 7 195 207 2% B - - - 4 - - 2 67 73 1% CCC,
CC, C - - - 29 - - 5 7 41 0% D - - - 4 - - - - 4 0% Subtotal - Non-Investment grade - - - 39 3 - 14 269 325 3% Not Rated (b) - 2 - 65 - 1 110 120 298 3% Total $ 236 $ 984 $ 282 $ 1,658 $ 74 $ 1,687 $ 2,362 $ 3,151 $ 10,434 100% Fair Value by Type
NAIC designation US Gov Munis Frgn gov RMBS CMBS CLOs ABS Corp/Oth Total % Total 1 $ 236 $ 977 $ 230 $ 1,606 $ 71 $ 1,633 $ 1,799 $ 1,043 $ 7,595 74% 2 - 7 - 2 - - 474 1,769 2,252 22% Subtotal 236 984 230 1,608 71 1,633 2,273 2,812 9,847 96% 3 - - -
1 3 - 8 195 207 2% 4 - - - 1 - - 1 61 63 1% 5 - - - 3 - - 9 67 79 1% 6 - - - 5 - - - - 5 0% Subtotal - - - 10 3 - 18 323 354 4% Total insurance companies $ 236 $ 984 $ 230 $ 1,618 $ 74 $ 1,633 $ 2,291 $ 3,135 $ 10,201 100% No NAIC designation (c) -
- - - - 1 9 11 21 Non-Insurance and Foreign Companies (d) - - 52 40 - 53 62 5 212 Total $ 236 $ 984 $ 282 $ 1,658 $ 74 $ 1,687 $ 2,362 $ 3,151 $ 10,434 (a) If two agencies rate a security, the rating displayed above is the lower of the two; if three
or more agencies rate a security, the rating displayed is the second lowest. (b) For ABS, 87% are NAIC 1 and 8% do not have a designation. For Corp/Oth, 21% are NAIC 1, 21% NAIC 2, 46% NAIC 5 and 9% do not have a designation. For Total, 58% are NAIC
1, 9% NAIC 2, 21% NAIC 5 and 7% do not have a designation. (c) Surplus notes and CLO equity tranches that are classified as other invested assets for STAT. (d) 98% are investment grade rated. Page 21
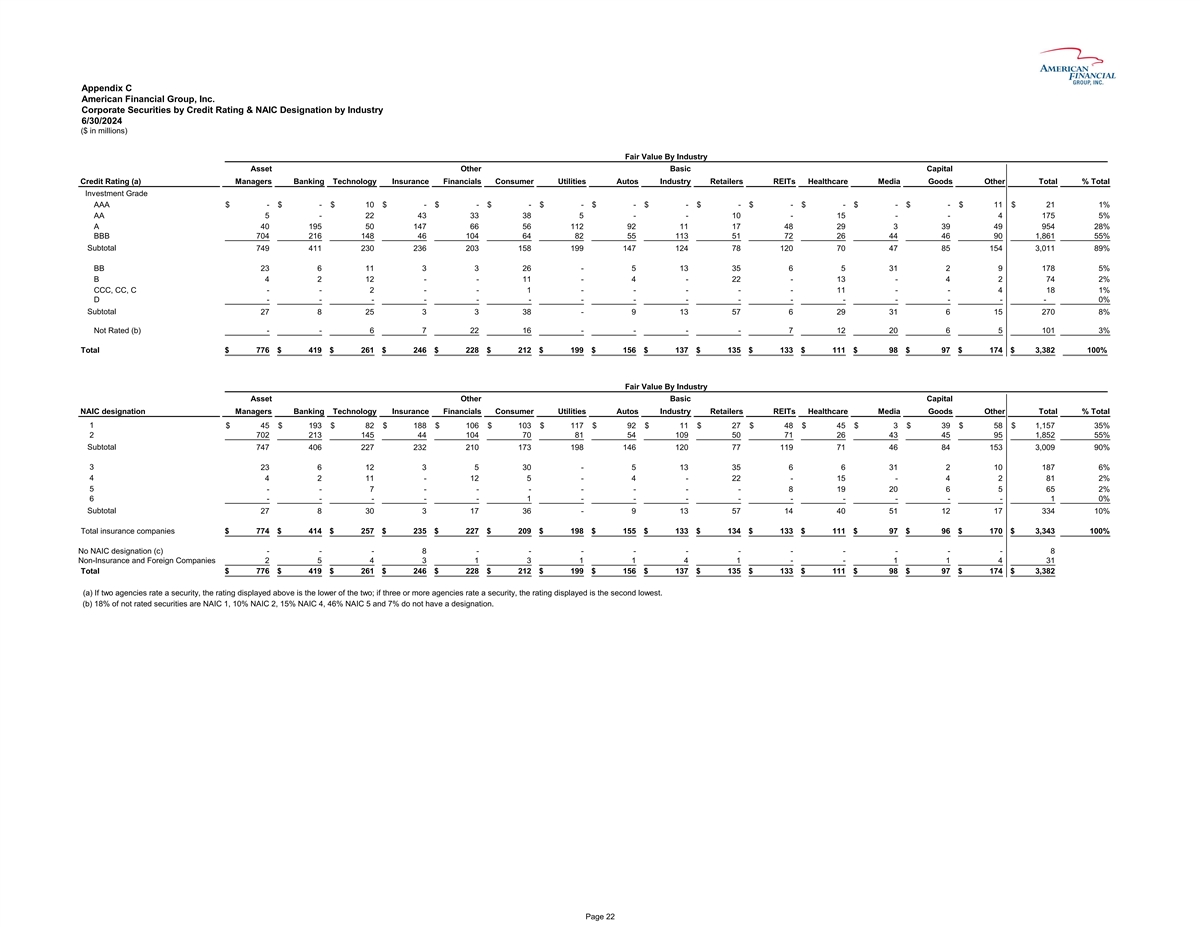
Appendix C American Financial Group, Inc. Corporate Securities by
Credit Rating & NAIC Designation by Industry 6/30/2024 ($ in millions) Fair Value By Industry Asset Other Basic Capital Credit Rating (a) Managers Banking Technology Insurance Financials Consumer Utilities Autos Industry Retailers REITs
Healthcare Media Goods Other Total % Total Investment Grade AAA $ - $ - $ 10 $ - $ - $ - $ - $ - $ - $ - $ - $ - $ - $ - $ 11 $ 21 1% AA 5 - 22 43 33 38 5 - - 10 - 15 - - 4 175 5% A 40 195 50 147 66 56 112 92 11 17 48 29 3 39 49 954 28% BBB 704 216
148 46 104 64 82 55 113 51 72 26 44 46 90 1,861 55% Subtotal 749 411 230 236 203 158 199 147 124 78 120 70 47 85 154 3,011 89% BB 23 6 11 3 3 26 - 5 13 35 6 5 31 2 9 178 5% B 4 2 12 - - 11 - 4 - 22 - 13 - 4 2 74 2% CCC, CC, C - - 2 - - 1 - - - - -
11 - - 4 18 1% D - - - - - - - - - - - - - - - - 0% Subtotal 27 8 25 3 3 38 - 9 13 57 6 29 31 6 15 270 8% Not Rated (b) - - 6 7 22 16 - - - - 7 12 20 6 5 101 3% Total $ 776 $ 419 $ 261 $ 246 $ 228 $ 212 $ 199 $ 156 $ 137 $ 135 $ 133 $ 111 $ 98 $ 97
$ 174 $ 3,382 100% Fair Value By Industry Asset Other Basic Capital NAIC designation Managers Banking Technology Insurance Financials Consumer Utilities Autos Industry Retailers REITs Healthcare Media Goods Other Total % Total 1 $ 45 $ 193 $ 82 $
188 $ 106 $ 103 $ 117 $ 92 $ 11 $ 27 $ 48 $ 45 $ 3 $ 39 $ 58 $ 1, 157 35% 2 702 213 145 44 104 70 81 54 109 50 71 26 43 45 95 1, 852 55% Subtotal 747 406 227 232 210 173 198 146 120 77 119 71 46 84 153 3, 009 90% 3 23 6 12 3 5 30 - 5 13 35 6 6 31 2
10 187 6% 4 4 2 11 - 12 5 - 4 - 22 - 15 - 4 2 81 2% 5 - - 7 - - - - - - - 8 19 20 6 5 65 2% 6 - - - - - 1 - - - - - - - - - 1 0% Subtotal 27 8 30 3 17 36 - 9 13 57 14 40 51 12 17 334 10% Total insurance companies $ 774 $ 414 $ 257 $ 235 $ 227 $ 209
$ 198 $ 155 $ 133 $ 134 $ 133 $ 111 $ 97 $ 96 $ 170 $ 3,343 100% No NAIC designation (c) - - - 8 - - - - - - - - - - - 8 Non-Insurance and Foreign Companies 2 5 4 3 1 3 1 1 4 1 - - 1 1 4 31 Total $ 776 $ 419 $ 261 $ 246 $ 228 $ 212 $ 199 $ 156 $ 137
$ 135 $ 133 $ 111 $ 98 $ 97 $ 174 $ 3,382 (a) If two agencies rate a security, the rating displayed above is the lower of the two; if three or more agencies rate a security, the rating displayed is the second lowest. (b) 18% of not rated securities
are NAIC 1, 10% NAIC 2, 15% NAIC 4, 46% NAIC 5 and 7% do not have a designation. Page 22
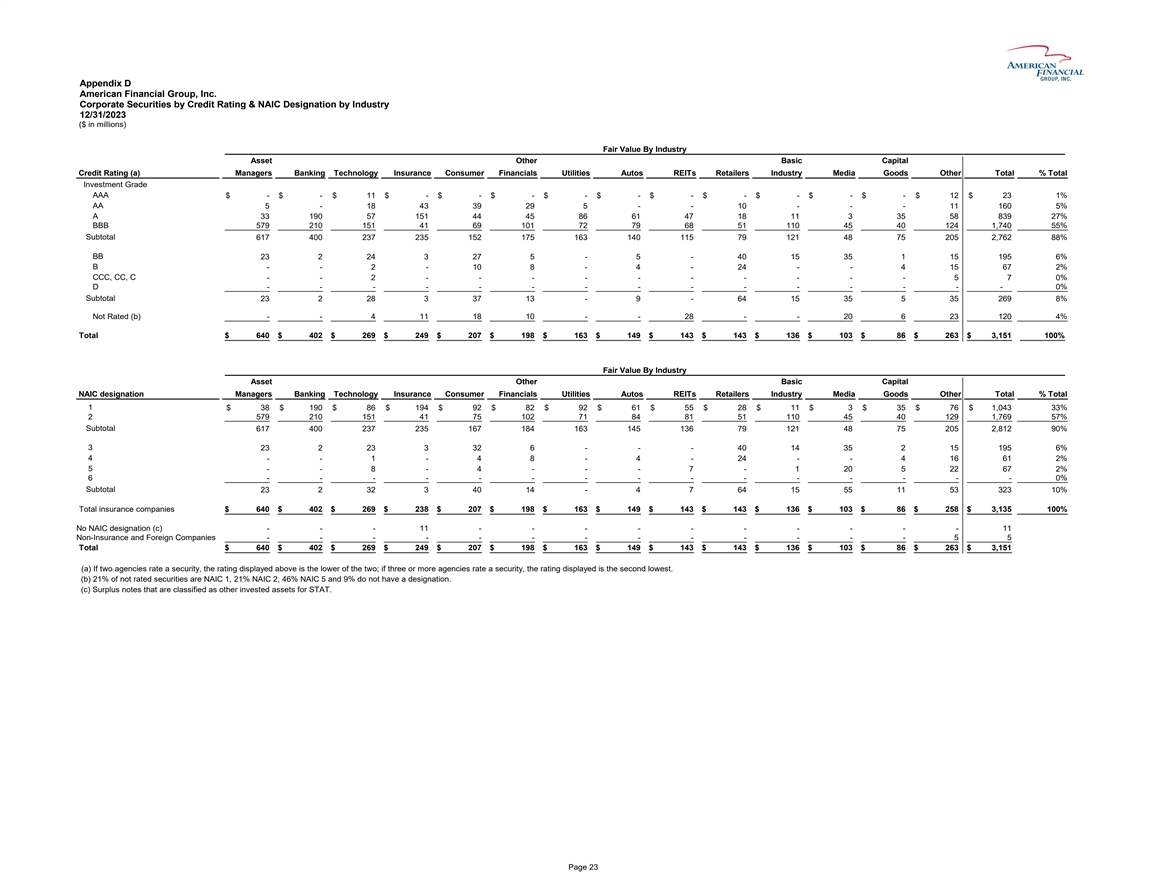
Appendix D American Financial Group, Inc. Corporate Securities by
Credit Rating & NAIC Designation by Industry 12/31/2023 ($ in millions) Fair Value By Industry Asset Other Basic Capital Credit Rating (a) Managers Banking Technology Insurance Consumer Financials Utilities Autos REITs Retailers Industry Media
Goods Other Total % Total Investment Grade AAA $ - $ - $ 11 $ - $ - $ - $ - $ - $ - $ - $ - $ - $ - $ 12 $ 23 1% AA 5 - 18 43 39 29 5 - - 10 - - - 11 160 5% A 33 190 57 151 44 45 86 61 47 18 11 3 35 58 839 27% BBB 579 210 151 41 69 101 72 79 68 51
110 45 40 124 1, 740 55% Subtotal 617 400 237 235 152 175 163 140 115 79 121 48 75 205 2,762 88% BB 23 2 24 3 27 5 - 5 - 40 15 35 1 15 195 6% B - - 2 - 10 8 - 4 - 24 - - 4 15 67 2% CCC, CC, C - - 2 - - - - - - - - - - 5 7 0% D - - - - - - - - - - -
- - - - 0% Subtotal 23 2 28 3 37 13 - 9 - 64 15 35 5 35 269 8% Not Rated (b) - - 4 11 18 10 - - 28 - - 20 6 23 120 4% Total $ 640 $ 402 $ 269 $ 249 $ 207 $ 198 $ 163 $ 149 $ 143 $ 143 $ 136 $ 103 $ 86 $ 263 $ 3,151 100% Fair Value By Industry Asset
Other Basic Capital NAIC designation Managers Banking Technology Insurance Consumer Financials Utilities Autos REITs Retailers Industry Media Goods Other Total % Total 1 $ 38 $ 190 $ 86 $ 194 $ 92 $ 82 $ 92 $ 61 $ 55 $ 28 $ 11 $ 3 $ 35 $ 76 $ 1,043
33% 2 579 210 151 41 75 102 71 84 81 51 110 45 40 129 1, 769 57% Subtotal 617 400 237 235 167 184 163 145 136 79 121 48 75 205 2, 812 90% 3 23 2 23 3 32 6 - - - 40 14 35 2 15 195 6% 4 - - 1 - 4 8 - 4 - 24 - - 4 16 61 2% 5 - - 8 - 4 - - - 7 - 1 20 5
22 67 2% 6 - - - - - - - - - - - - - - - 0% Subtotal 23 2 32 3 40 14 - 4 7 64 15 55 11 53 323 10% Total insurance companies $ 640 $ 402 $ 269 $ 238 $ 207 $ 198 $ 163 $ 149 $ 143 $ 143 $ 136 $ 103 $ 86 $ 258 $ 3,135 100% No NAIC designation (c) - - -
11 - - - - - - - - - - 11 Non-Insurance and Foreign Companies - - - - - - - - - - - - - 5 5 Total $ 640 $ 402 $ 269 $ 249 $ 207 $ 198 $ 163 $ 149 $ 143 $ 143 $ 136 $ 103 $ 86 $ 263 $ 3,151 (a) If two agencies rate a security, the rating displayed
above is the lower of the two; if three or more agencies rate a security, the rating displayed is the second lowest. (b) 21% of not rated securities are NAIC 1, 21% NAIC 2, 46% NAIC 5 and 9% do not have a designation. (c) Surplus notes that are
classified as other invested assets for STAT. Page 23
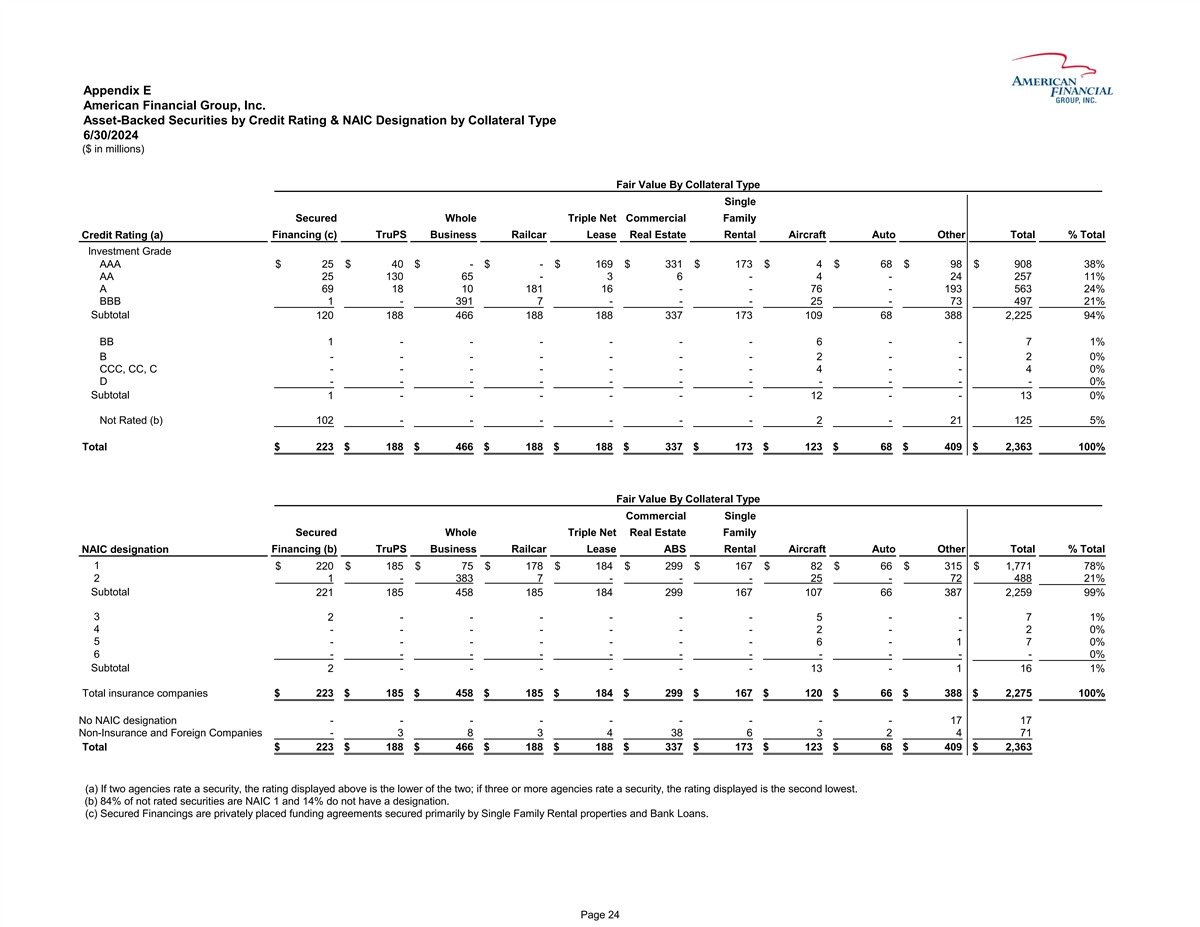
Appendix E American Financial Group, Inc. Asset-Backed Securities by
Credit Rating & NAIC Designation by Collateral Type 6/30/2024 ($ in millions) Fair Value By Collateral Type Single Secured Whole Triple Net Commercial Family Credit Rating (a) Financing (c) TruPS Business Railcar Lease Real Estate Rental
Aircraft Auto Other Total % Total Investment Grade AAA $ 25 $ 40 $ - $ - $ 169 $ 331 $ 173 $ 4 $ 68 $ 98 $ 908 38% AA 25 130 65 - 3 6 - 4 - 24 257 11% A 69 18 10 181 16 - - 76 - 193 563 24% BBB 1 - 391 7 - - - 25 - 73 497 21% Subtotal 120 188 466
188 188 337 173 109 68 388 2,225 94% BB 1 - - - - - - 6 - - 7 1% B - - - - - - - 2 - - 2 0% CCC, CC, C - - - - - - - 4 - - 4 0% D - - - - - - - - - - - 0% Subtotal 1 - - - - - - 12 - - 13 0% Not Rated (b) 102 - - - - - - 2 - 21 125 5% Total $ 223 $
188 $ 466 $ 188 $ 188 $ 337 $ 173 $ 123 $ 68 $ 409 $ 2,363 100% Fair Value By Collateral Type Commercial Single Secured Whole Triple Net Real Estate Family NAIC designation Financing (b) TruPS Business Railcar Lease ABS Rental Aircraft Auto Other
Total % Total 1 $ 220 $ 185 $ 75 $ 178 $ 184 $ 299 $ 167 $ 82 $ 66 $ 315 $ 1,771 78% 2 1 - 383 7 - - - 25 - 72 488 21% Subtotal 221 185 458 185 184 299 167 107 66 387 2 ,259 99% 3 2 - - - - - - 5 - - 7 1% 4 - - - - - - - 2 - - 2 0% 5 - - - - - - - 6
- 1 7 0% 6 - - - - - - - - - - - 0% Subtotal 2 - - - - - - 13 - 1 16 1% Total insurance companies $ 223 $ 185 $ 458 $ 185 $ 184 $ 299 $ 167 $ 120 $ 66 $ 388 $ 2,275 100% No NAIC designation - - - - - - - - - 17 17 Non-Insurance and Foreign Companies
- 3 8 3 4 38 6 3 2 4 71 Total $ 223 $ 188 $ 466 $ 188 $ 188 $ 337 $ 173 $ 123 $ 68 $ 409 $ 2,363 (a) If two agencies rate a security, the rating displayed above is the lower of the two; if three or more agencies rate a security, the rating displayed
is the second lowest. (b) 84% of not rated securities are NAIC 1 and 14% do not have a designation. (c) Secured Financings are privately placed funding agreements secured primarily by Single Family Rental properties and Bank Loans. Page
24
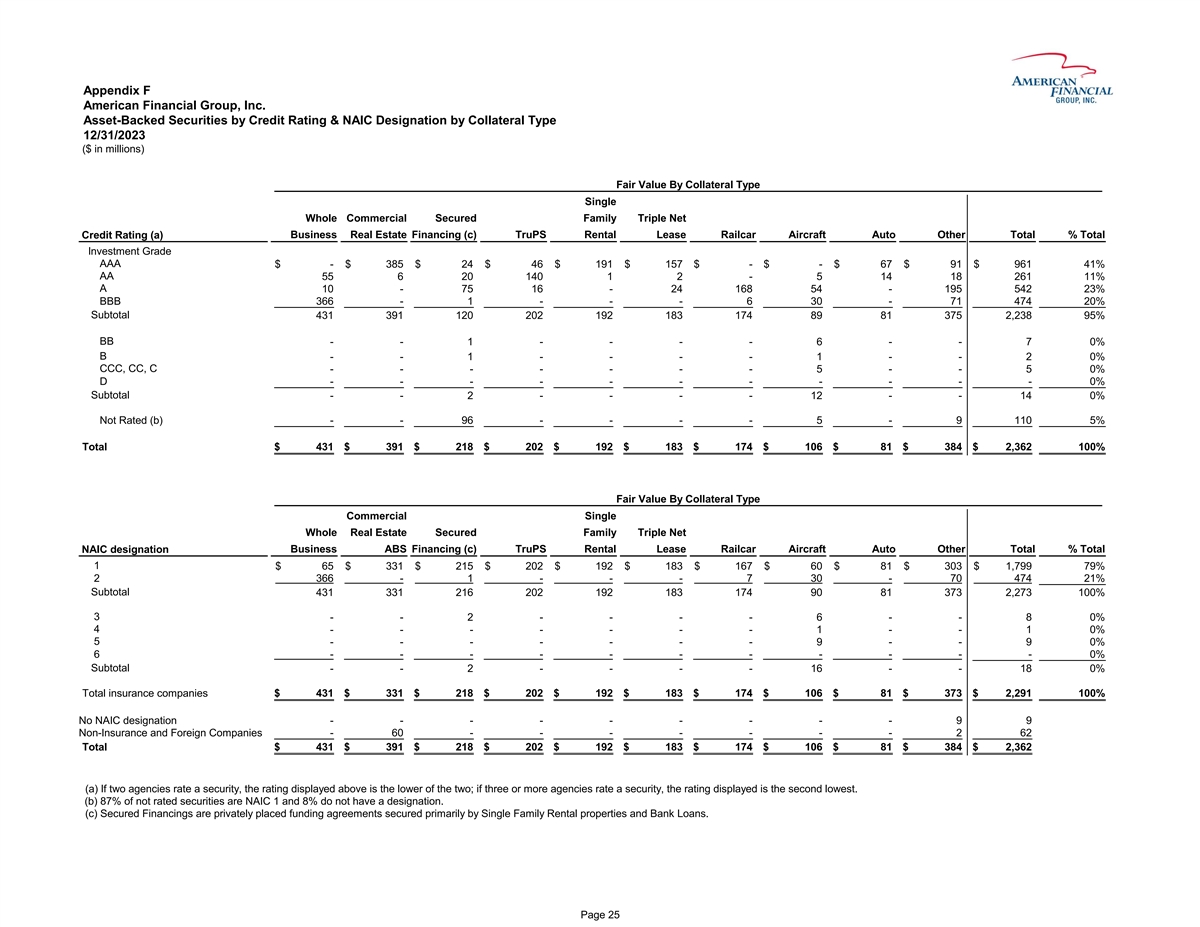
Appendix F American Financial Group, Inc. Asset-Backed Securities by
Credit Rating & NAIC Designation by Collateral Type 12/31/2023 ($ in millions) Fair Value By Collateral Type Single Whole Commercial Secured Family Triple Net Credit Rating (a) Business Real Estate Financing (c) TruPS Rental Lease Railcar
Aircraft Auto Other Total % Total Investment Grade AAA $ - $ 385 $ 24 $ 46 $ 191 $ 157 $ - $ - $ 67 $ 91 $ 961 41% AA 55 6 20 140 1 2 - 5 14 18 261 11% A 10 - 75 16 - 24 168 54 - 195 542 23% BBB 366 - 1 - - - 6 30 - 71 474 20% Subtotal 431 391 120
202 192 183 174 89 81 375 2,238 95% BB - - 1 - - - - 6 - - 7 0% B - - 1 - - - - 1 - - 2 0% CCC, CC, C - - - - - - - 5 - - 5 0% D - - - - - - - - - - - 0% Subtotal - - 2 - - - - 12 - - 14 0% Not Rated (b) - - 96 - - - - 5 - 9 110 5% Total $ 431 $ 391
$ 218 $ 202 $ 192 $ 183 $ 174 $ 106 $ 81 $ 384 $ 2,362 100% Fair Value By Collateral Type Commercial Single Whole Real Estate Secured Family Triple Net NAIC designation Business ABS Financing (c) TruPS Rental Lease Railcar Aircraft Auto Other Total
% Total 1 $ 65 $ 331 $ 215 $ 202 $ 192 $ 183 $ 167 $ 60 $ 81 $ 303 $ 1 ,799 79% 2 366 - 1 - - - 7 30 - 70 474 21% Subtotal 431 331 216 202 192 183 174 90 81 373 2,273 100% 3 - - 2 - - - - 6 - - 8 0% 4 - - - - - - - 1 - - 1 0% 5 - - - - - - - 9 - - 9
0% 6 - - - - - - - - - - - 0% Subtotal - - 2 - - - - 16 - - 18 0% Total insurance companies $ 431 $ 331 $ 218 $ 202 $ 192 $ 183 $ 174 $ 106 $ 81 $ 373 $ 2,291 100% No NAIC designation - - - - - - - - - 9 9 Non-Insurance and Foreign Companies - 60 -
- - - - - - 2 62 Total $ 431 $ 391 $ 218 $ 202 $ 192 $ 183 $ 174 $ 106 $ 81 $ 384 $ 2,362 (a) If two agencies rate a security, the rating displayed above is the lower of the two; if three or more agencies rate a security, the rating displayed is the
second lowest. (b) 87% of not rated securities are NAIC 1 and 8% do not have a designation. (c) Secured Financings are privately placed funding agreements secured primarily by Single Family Rental properties and Bank Loans. Page 25
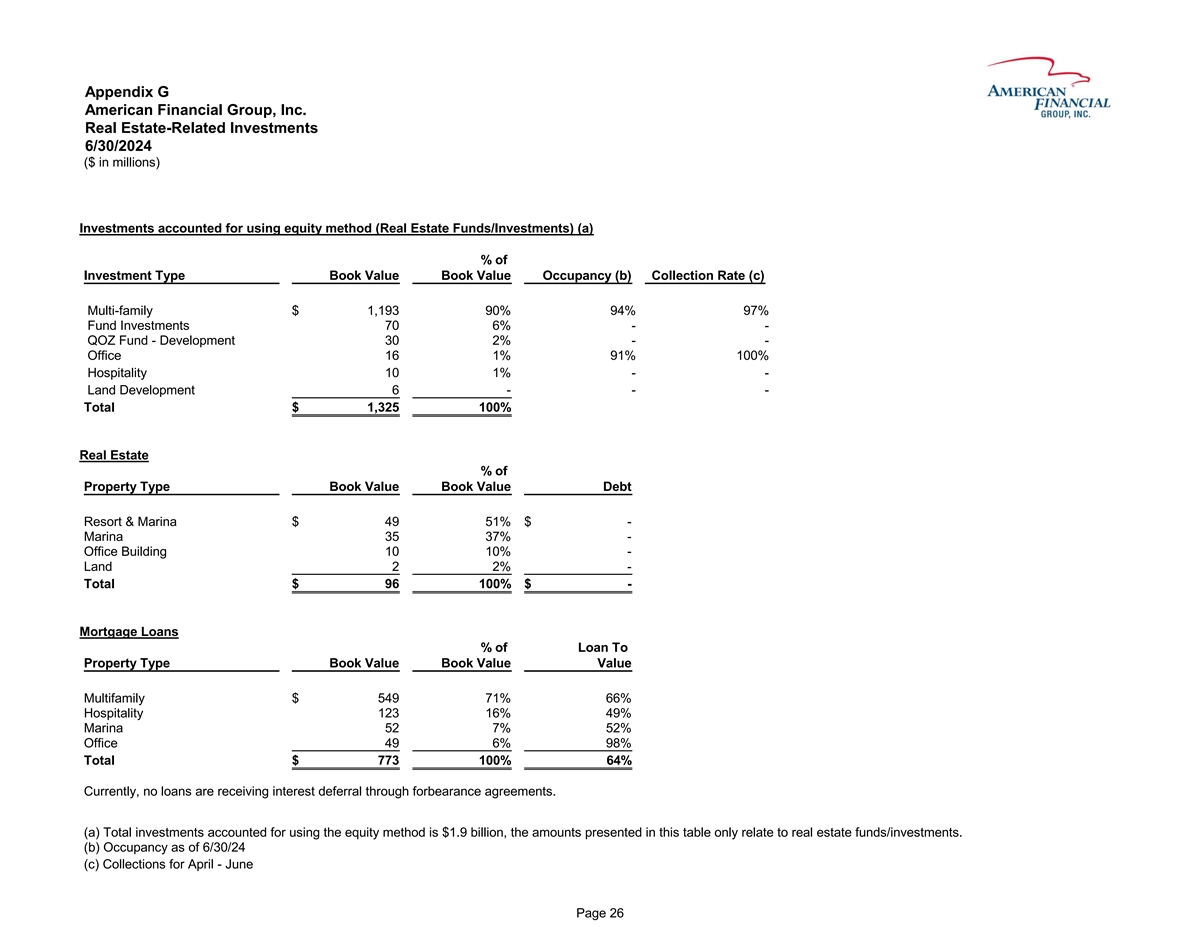
Appendix G American Financial Group, Inc. Real Estate-Related
Investments 6/30/2024 ($ in millions) Investments accounted for using equity method (Real Estate Funds/Investments) (a) % of Investment Type Book Value Book Value Occupancy (b) Collection Rate (c) Multi-family $ 1,193 90% 94% 97% Fund Investments 70
6% - - QOZ Fund - Development 30 2% - - Office 16 1% 91% 100% Hospitality 10 1% - - Land Development 6 - - - Total $ 1,325 100% Real Estate % of Property Type Book Value Book Value Debt Resort & Marina $ 49 51% $ - Marina 35 37% - Office
Building 10 10% - Land 2 2% - Total $ 96 100% $ - Mortgage Loans % of Loan To Property Type Book Value Book Value Value Multifamily $ 549 71% 66% Hospitality 123 16% 49% Marina 52 7% 52% Office 49 6% 98% Total $ 773 100% 64% Currently, no loans are
receiving interest deferral through forbearance agreements. (a) Total investments accounted for using the equity method is $1.9 billion, the amounts presented in this table only relate to real estate funds/investments. (b) Occupancy as of 6/30/24
(c) Collections for April - June Page 26
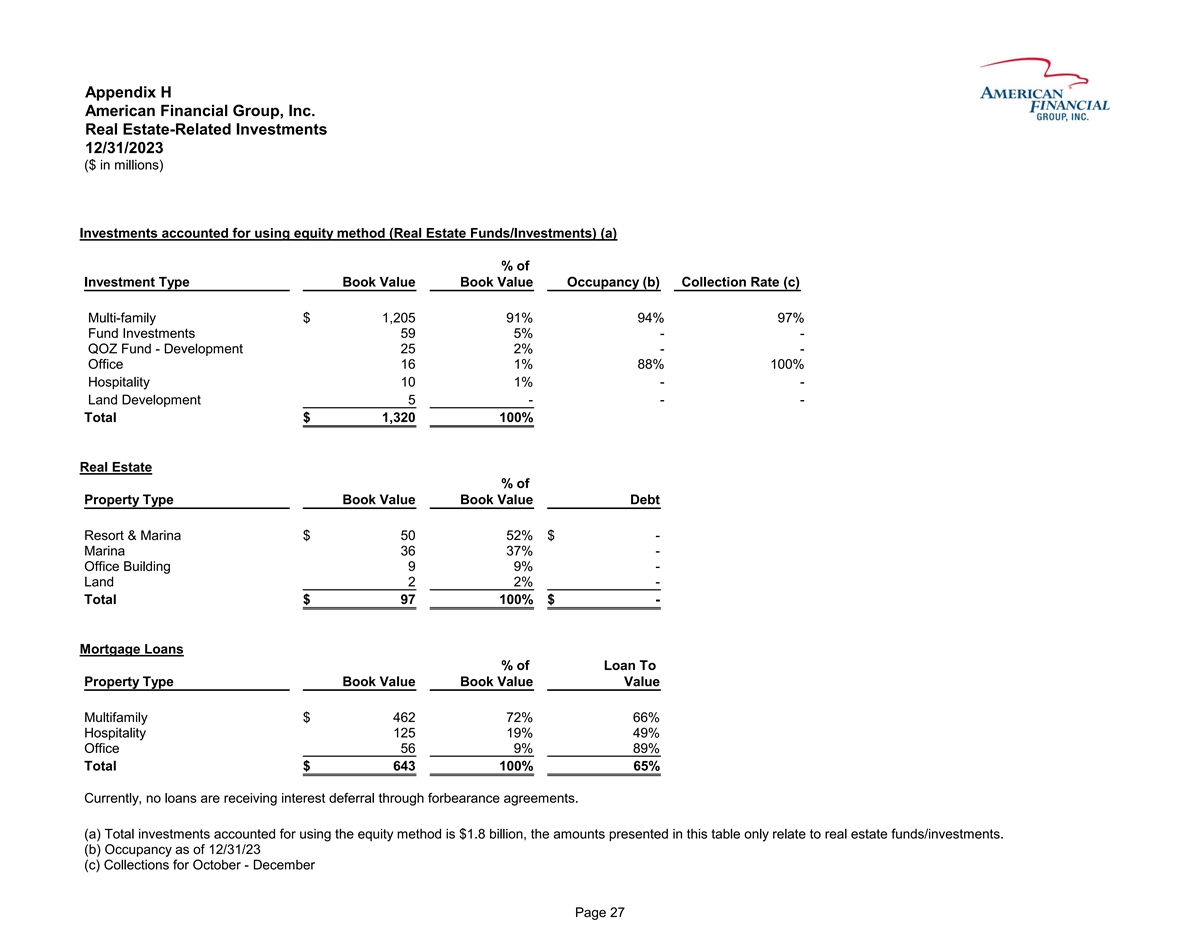
Appendix H American Financial Group, Inc. Real Estate-Related
Investments 12/31/2023 ($ in millions) Investments accounted for using equity method (Real Estate Funds/Investments) (a) % of Investment Type Book Value Book Value Occupancy (b) Collection Rate (c) Multi-family $ 1,205 91% 94% 97% Fund Investments
59 5% - - QOZ Fund - Development 25 2% - - Office 16 1% 88% 100% Hospitality 10 1% - - Land Development 5 - - - Total $ 1,320 100% Real Estate % of Property Type Book Value Book Value Debt Resort & Marina $ 50 52% $ - Marina 36 37% - Office
Building 9 9% - Land 2 2% - Total $ 97 100% $ - Mortgage Loans % of Loan To Property Type Book Value Book Value Value Multifamily $ 462 72% 66% Hospitality 125 19% 49% Office 56 9% 89% Total $ 643 100% 65% Currently, no loans are receiving interest
deferral through forbearance agreements. (a) Total investments accounted for using the equity method is $1.8 billion, the amounts presented in this table only relate to real estate funds/investments. (b) Occupancy as of 12/31/23 (c) Collections for
October - December Page 27
v3.24.2.u1
Document and Entity Information
|
Aug. 06, 2024 |
| Document And Entity Information [Line Items] |
|
| Entity Registrant Name |
AMERICAN FINANCIAL GROUP INC
|
| Amendment Flag |
false
|
| Entity Central Index Key |
0001042046
|
| Document Type |
8-K
|
| Document Period End Date |
Aug. 06, 2024
|
| Entity Incorporation State Country Code |
OH
|
| Entity File Number |
1-13653
|
| Entity Tax Identification Number |
31-1544320
|
| Entity Address, Address Line One |
301 East Fourth Street
|
| Entity Address, City or Town |
Cincinnati
|
| Entity Address, State or Province |
OH
|
| Entity Address, Postal Zip Code |
45202
|
| City Area Code |
513
|
| Local Phone Number |
579-2121
|
| Written Communications |
false
|
| Soliciting Material |
false
|
| Pre Commencement Tender Offer |
false
|
| Pre Commencement Issuer Tender Offer |
false
|
| Entity Emerging Growth Company |
false
|
| Common Stock [Member] |
|
| Document And Entity Information [Line Items] |
|
| Security 12b Title |
Common Stock
|
| Trading Symbol |
AFG
|
| Security Exchange Name |
NYSE
|
| Five 875 Subordinated Debentures Due March 302059 [Member] |
|
| Document And Entity Information [Line Items] |
|
| Security 12b Title |
5.875% Subordinated Debentures due March 30, 2059
|
| Trading Symbol |
AFGB
|
| Security Exchange Name |
NYSE
|
| Five 125 Subordinated Debentures Due December 152059 [Member] |
|
| Document And Entity Information [Line Items] |
|
| Security 12b Title |
5.125% Subordinated Debentures due December 15, 2059
|
| Trading Symbol |
AFGC
|
| Security Exchange Name |
NYSE
|
| Five 625 Subordinated Debentures Due June 12060 [Member] |
|
| Document And Entity Information [Line Items] |
|
| Security 12b Title |
5.625% Subordinated Debentures due June 1, 2060
|
| Trading Symbol |
AFGD
|
| Security Exchange Name |
NYSE
|
| Four 5 Subordinated Debentures Due September 152060 [Member] |
|
| Document And Entity Information [Line Items] |
|
| Security 12b Title |
4.5% Subordinated Debentures due September 15, 2060
|
| Trading Symbol |
AFGE
|
| Security Exchange Name |
NYSE
|
| X |
- DefinitionBoolean flag that is true when the XBRL content amends previously-filed or accepted submission.
| Name: |
dei_AmendmentFlag |
| Namespace Prefix: |
dei_ |
| Data Type: |
xbrli:booleanItemType |
| Balance Type: |
na |
| Period Type: |
duration |
|
| X |
- DefinitionFor the EDGAR submission types of Form 8-K: the date of the report, the date of the earliest event reported; for the EDGAR submission types of Form N-1A: the filing date; for all other submission types: the end of the reporting or transition period. The format of the date is YYYY-MM-DD.
| Name: |
dei_DocumentPeriodEndDate |
| Namespace Prefix: |
dei_ |
| Data Type: |
xbrli:dateItemType |
| Balance Type: |
na |
| Period Type: |
duration |
|
| X |
- DefinitionThe type of document being provided (such as 10-K, 10-Q, 485BPOS, etc). The document type is limited to the same value as the supporting SEC submission type, or the word 'Other'.
| Name: |
dei_DocumentType |
| Namespace Prefix: |
dei_ |
| Data Type: |
dei:submissionTypeItemType |
| Balance Type: |
na |
| Period Type: |
duration |
|
| X |
- DefinitionAddress Line 1 such as Attn, Building Name, Street Name
| Name: |
dei_EntityAddressAddressLine1 |
| Namespace Prefix: |
dei_ |
| Data Type: |
xbrli:normalizedStringItemType |
| Balance Type: |
na |
| Period Type: |
duration |
|
| X |
- Definition
+ References
+ Details
| Name: |
dei_EntityAddressCityOrTown |
| Namespace Prefix: |
dei_ |
| Data Type: |
xbrli:normalizedStringItemType |
| Balance Type: |
na |
| Period Type: |
duration |
|
| X |
- DefinitionCode for the postal or zip code
| Name: |
dei_EntityAddressPostalZipCode |
| Namespace Prefix: |
dei_ |
| Data Type: |
xbrli:normalizedStringItemType |
| Balance Type: |
na |
| Period Type: |
duration |
|
| X |
- DefinitionName of the state or province.
| Name: |
dei_EntityAddressStateOrProvince |
| Namespace Prefix: |
dei_ |
| Data Type: |
dei:stateOrProvinceItemType |
| Balance Type: |
na |
| Period Type: |
duration |
|
| X |
- DefinitionA unique 10-digit SEC-issued value to identify entities that have filed disclosures with the SEC. It is commonly abbreviated as CIK. Reference 1: http://www.xbrl.org/2003/role/presentationRef
-Publisher SEC
-Name Exchange Act
-Number 240
-Section 12
-Subsection b-2
| Name: |
dei_EntityCentralIndexKey |
| Namespace Prefix: |
dei_ |
| Data Type: |
dei:centralIndexKeyItemType |
| Balance Type: |
na |
| Period Type: |
duration |
|
| X |
- DefinitionIndicate if registrant meets the emerging growth company criteria. Reference 1: http://www.xbrl.org/2003/role/presentationRef
-Publisher SEC
-Name Exchange Act
-Number 240
-Section 12
-Subsection b-2
| Name: |
dei_EntityEmergingGrowthCompany |
| Namespace Prefix: |
dei_ |
| Data Type: |
xbrli:booleanItemType |
| Balance Type: |
na |
| Period Type: |
duration |
|
| X |
- DefinitionCommission file number. The field allows up to 17 characters. The prefix may contain 1-3 digits, the sequence number may contain 1-8 digits, the optional suffix may contain 1-4 characters, and the fields are separated with a hyphen.
| Name: |
dei_EntityFileNumber |
| Namespace Prefix: |
dei_ |
| Data Type: |
dei:fileNumberItemType |
| Balance Type: |
na |
| Period Type: |
duration |
|
| X |
- DefinitionTwo-character EDGAR code representing the state or country of incorporation.
| Name: |
dei_EntityIncorporationStateCountryCode |
| Namespace Prefix: |
dei_ |
| Data Type: |
dei:edgarStateCountryItemType |
| Balance Type: |
na |
| Period Type: |
duration |
|
| X |
- DefinitionThe exact name of the entity filing the report as specified in its charter, which is required by forms filed with the SEC. Reference 1: http://www.xbrl.org/2003/role/presentationRef
-Publisher SEC
-Name Exchange Act
-Number 240
-Section 12
-Subsection b-2
| Name: |
dei_EntityRegistrantName |
| Namespace Prefix: |
dei_ |
| Data Type: |
xbrli:normalizedStringItemType |
| Balance Type: |
na |
| Period Type: |
duration |
|
| X |
- DefinitionThe Tax Identification Number (TIN), also known as an Employer Identification Number (EIN), is a unique 9-digit value assigned by the IRS. Reference 1: http://www.xbrl.org/2003/role/presentationRef
-Publisher SEC
-Name Exchange Act
-Number 240
-Section 12
-Subsection b-2
| Name: |
dei_EntityTaxIdentificationNumber |
| Namespace Prefix: |
dei_ |
| Data Type: |
dei:employerIdItemType |
| Balance Type: |
na |
| Period Type: |
duration |
|
| X |
- DefinitionLocal phone number for entity.
| Name: |
dei_LocalPhoneNumber |
| Namespace Prefix: |
dei_ |
| Data Type: |
xbrli:normalizedStringItemType |
| Balance Type: |
na |
| Period Type: |
duration |
|
| X |
- DefinitionBoolean flag that is true when the Form 8-K filing is intended to satisfy the filing obligation of the registrant as pre-commencement communications pursuant to Rule 13e-4(c) under the Exchange Act. Reference 1: http://www.xbrl.org/2003/role/presentationRef
-Publisher SEC
-Name Exchange Act
-Number 240
-Section 13e
-Subsection 4c
| Name: |
dei_PreCommencementIssuerTenderOffer |
| Namespace Prefix: |
dei_ |
| Data Type: |
xbrli:booleanItemType |
| Balance Type: |
na |
| Period Type: |
duration |
|
| X |
- DefinitionBoolean flag that is true when the Form 8-K filing is intended to satisfy the filing obligation of the registrant as pre-commencement communications pursuant to Rule 14d-2(b) under the Exchange Act. Reference 1: http://www.xbrl.org/2003/role/presentationRef
-Publisher SEC
-Name Exchange Act
-Number 240
-Section 14d
-Subsection 2b
| Name: |
dei_PreCommencementTenderOffer |
| Namespace Prefix: |
dei_ |
| Data Type: |
xbrli:booleanItemType |
| Balance Type: |
na |
| Period Type: |
duration |
|
| X |
- DefinitionTitle of a 12(b) registered security. Reference 1: http://www.xbrl.org/2003/role/presentationRef
-Publisher SEC
-Name Exchange Act
-Number 240
-Section 12
-Subsection b
| Name: |
dei_Security12bTitle |
| Namespace Prefix: |
dei_ |
| Data Type: |
dei:securityTitleItemType |
| Balance Type: |
na |
| Period Type: |
duration |
|
| X |
- DefinitionName of the Exchange on which a security is registered. Reference 1: http://www.xbrl.org/2003/role/presentationRef
-Publisher SEC
-Name Exchange Act
-Number 240
-Section 12
-Subsection d1-1
| Name: |
dei_SecurityExchangeName |
| Namespace Prefix: |
dei_ |
| Data Type: |
dei:edgarExchangeCodeItemType |
| Balance Type: |
na |
| Period Type: |
duration |
|
| X |
- DefinitionBoolean flag that is true when the Form 8-K filing is intended to satisfy the filing obligation of the registrant as soliciting material pursuant to Rule 14a-12 under the Exchange Act. Reference 1: http://www.xbrl.org/2003/role/presentationRef
-Publisher SEC
-Name Exchange Act
-Section 14a
-Number 240
-Subsection 12
| Name: |
dei_SolicitingMaterial |
| Namespace Prefix: |
dei_ |
| Data Type: |
xbrli:booleanItemType |
| Balance Type: |
na |
| Period Type: |
duration |
|
| X |
- DefinitionTrading symbol of an instrument as listed on an exchange.
| Name: |
dei_TradingSymbol |
| Namespace Prefix: |
dei_ |
| Data Type: |
dei:tradingSymbolItemType |
| Balance Type: |
na |
| Period Type: |
duration |
|
| X |
- DefinitionBoolean flag that is true when the Form 8-K filing is intended to satisfy the filing obligation of the registrant as written communications pursuant to Rule 425 under the Securities Act. Reference 1: http://www.xbrl.org/2003/role/presentationRef
-Publisher SEC
-Name Securities Act
-Number 230
-Section 425
| Name: |
dei_WrittenCommunications |
| Namespace Prefix: |
dei_ |
| Data Type: |
xbrli:booleanItemType |
| Balance Type: |
na |
| Period Type: |
duration |
|
| X |
- Details
| Name: |
us-gaap_StatementClassOfStockAxis=us-gaap_CommonStockMember |
| Namespace Prefix: |
|
| Data Type: |
na |
| Balance Type: |
|
| Period Type: |
|
|
| X |
- Details
| Name: |
us-gaap_StatementClassOfStockAxis=afg_Five875SubordinatedDebenturesDueMarch302059Member |
| Namespace Prefix: |
|
| Data Type: |
na |
| Balance Type: |
|
| Period Type: |
|
|
| X |
- Details
| Name: |
us-gaap_StatementClassOfStockAxis=afg_Five125SubordinatedDebenturesDueDecember152059Member |
| Namespace Prefix: |
|
| Data Type: |
na |
| Balance Type: |
|
| Period Type: |
|
|
| X |
- Details
| Name: |
us-gaap_StatementClassOfStockAxis=afg_Five625SubordinatedDebenturesDueJune12060Member |
| Namespace Prefix: |
|
| Data Type: |
na |
| Balance Type: |
|
| Period Type: |
|
|
| X |
- Details
| Name: |
us-gaap_StatementClassOfStockAxis=afg_Four5SubordinatedDebenturesDueSeptember152060Member |
| Namespace Prefix: |
|
| Data Type: |
na |
| Balance Type: |
|
| Period Type: |
|
|
American Financial (NYSE:AFG)
과거 데이터 주식 차트
부터 8월(8) 2024 으로 9월(9) 2024

American Financial (NYSE:AFG)
과거 데이터 주식 차트
부터 9월(9) 2023 으로 9월(9) 2024
