false
N-2
0001754836
Eagle Point Income Co Inc.
0001754836
2023-01-01
2023-12-31
0001754836
2023-12-31
0001754836
2023-12-31
2023-12-31
0001754836
2024-01-31
0001754836
2024-01-31
2024-01-31
0001754836
eic:RisksOfInvestingInClosAndOtherStructuredDebtSecuritiesMember
2023-01-01
2023-12-31
0001754836
eic:SubordinatedSecuritiesRiskMember
2023-01-01
2023-12-31
0001754836
eic:HighYieldInvestmentRiskMember
2023-01-01
2023-12-31
0001754836
eic:LeverageRiskMember
2023-01-01
2023-12-31
0001754836
eic:CreditRisksMember
2023-01-01
2023-12-31
0001754836
eic:KeyPersonnelRiskMember
2023-01-01
2023-12-31
0001754836
eic:ConflictsOfInterestRiskMember
2023-01-01
2023-12-31
0001754836
eic:PrepaymentRisksMember
2023-01-01
2023-12-31
0001754836
eic:LiquidityRiskMember
2023-01-01
2023-12-31
0001754836
eic:ManagementFeeRiskMember
2023-01-01
2023-12-31
0001754836
eic:FairValuationOfTheCompanysPortfolioInvestmentsMember
2023-01-01
2023-12-31
0001754836
eic:LimitedInvestmentOpportunitiesRiskMember
2023-01-01
2023-12-31
0001754836
eic:MarketRiskMember
2023-01-01
2023-12-31
0001754836
eic:LoanAccumulationFacilitiesRiskMember
2023-01-01
2023-12-31
0001754836
eic:SyntheticInvestmentsRiskMember
2023-01-01
2023-12-31
0001754836
eic:CurrencyRiskMember
2023-01-01
2023-12-31
0001754836
eic:HedgingRiskMember
2023-01-01
2023-12-31
0001754836
eic:ReinvestmentRiskMember
2023-01-01
2023-12-31
0001754836
us-gaap:InterestRateRiskMember
2023-01-01
2023-12-31
0001754836
eic:RefinancingRiskMember
2023-01-01
2023-12-31
0001754836
eic:TaxRiskMember
2023-01-01
2023-12-31
0001754836
eic:CounterpartyRiskMember
2023-01-01
2023-12-31
0001754836
eic:PriceRiskMember
2023-01-01
2023-12-31
0001754836
eic:GlobalRisksMember
2023-01-01
2023-12-31
0001754836
eic:BankingRiskMember
2023-01-01
2023-12-31
0001754836
eic:CommonSharesMember
2023-01-01
2023-12-31
0001754836
eic:PreferredSharesMember
2023-01-01
2023-12-31
0001754836
eic:PreferredSharesMember
2023-12-31
0001754836
eic:RevolvingCreditFacilityBNPParibasMember
2023-12-31
0001754836
eic:PreferredSharesMember
2022-12-31
0001754836
eic:PreferredSharesMember
2022-01-01
2022-12-31
0001754836
eic:RevolvingCreditFacilityBNPParibasMember
2022-12-31
0001754836
eic:PreferredSharesMember
2021-12-31
0001754836
eic:PreferredSharesMember
2021-01-01
2021-12-31
0001754836
eic:RevolvingCreditFacilityBNPParibasMember
2021-12-31
0001754836
eic:RevolvingCreditFacilitySocieteGeneraleMember
2020-12-31
0001754836
eic:RevolvingCreditFacilitySocieteGeneraleMember
2019-12-31
0001754836
2022-03-31
0001754836
2022-01-01
2022-03-31
0001754836
2022-06-30
0001754836
2022-04-01
2022-06-30
0001754836
2022-09-30
0001754836
2022-07-01
2022-09-30
0001754836
2022-12-31
0001754836
2022-10-01
2022-12-31
0001754836
2023-03-31
0001754836
2023-01-01
2023-03-31
0001754836
2023-06-30
0001754836
2023-04-01
2023-06-30
0001754836
2023-09-30
0001754836
2023-07-01
2023-09-30
0001754836
2023-10-01
2023-12-31
0001754836
eic:SeriesATermPreferredStockMember
2023-01-01
2023-12-31
0001754836
eic:SeriesBTermPreferredStockMember
2023-01-01
2023-12-31
0001754836
eic:CommonSharesMember
2023-12-31
2023-12-31
0001754836
eic:PreferredSharesMember
2023-12-31
2023-12-31
0001754836
eic:SeriesATermPreferredStockMember
2023-12-31
2023-12-31
0001754836
eic:SeriesBTermPreferredStockMember
2023-12-31
2023-12-31
0001754836
2024-02-15
iso4217:USD
xbrli:shares
iso4217:USD
xbrli:shares
xbrli:pure
UNITED
STATES
SECURITIES
AND EXCHANGE COMMISSION
Washington,
D.C. 20549
FORM
N-CSR
CERTIFIED
SHAREHOLDER REPORT OF REGISTERED
MANAGEMENT
INVESTMENT COMPANIES
Investment
Company Act File Number: 811-23384
Eagle
Point Income Company Inc.
(Exact
name of registrant as specified in charter)
600
Steamboat Road, Suite 202
Greenwich,
CT 06830
(Address
of principal executive offices) (Zip code)
Thomas
P. Majewski
c/o
Eagle Point Income Company Inc.
600
Steamboat Road, Suite 202
Greenwich,
CT 06830
(Name
and address of agent for service)
Copies
to
Thomas
J. Friedmann
Philip
Hinkle
Dechert LLP
One International Place, 40th Floor
100
Oliver Street
Boston,
MA 02110
(617) 728-7120
Registrant’s
telephone number, including area code: (203) 340-8500
Date
of fiscal year end: December 31
Date
of reporting period: December 31, 2023
Form
N-CSR is to be used by management investment companies to file reports with the Commission not later than 10 days after the transmission
to stockholders of any report that is required to be transmitted to stockholders under Rule 30e-1 under the Investment Company Act of
1940 (17 CFR 270.30e-1). The Commission may use the information provided on Form N-CSR in its regulatory, disclosure review, inspection,
and policymaking roles.
A
registrant is required to disclose the information specified by Form N-CSR, and the Commission will make this information public. A registrant
is not required to respond to the collection of information contained in Form N-CSR unless the Form displays a currently valid Office
of Management and Budget (“OMB”) control number. Please direct comments concerning the accuracy of the information collection
burden estimate and any suggestions for reducing the burden to Secretary, Securities and Exchange Commission, 100 F Street, NE, Washington,
DC 20549. The OMB has reviewed this collection of information under the clearance requirements of 44 U.S.C. § 3507.
| Item 1. |
Report to Stockholders |
The
Annual Report to stockholders of Eagle Point Income Company Inc. (the “Company”) for the year ended December 31, 2023 is
filed herewith.


Eagle
Point Income Company Inc.
Annual
Report – December 31, 2023
Table of Contents
LETTER TO STOCKHOLDERS
AND MANAGEMENT DISCUSSION OF COMPANY PERFORMANCE
February 22,
2024
Dear Fellow
Stockholders:
We are pleased
to provide you with the enclosed report of Eagle Point Income Company Inc. (“we,” “us,” “our”
or the “Company”) for the fiscal year ended December 31, 2023.
The primary
investment objective of the Company is to generate high current income, with a secondary objective to generate capital appreciation.
We seek to achieve these objectives by investing primarily in junior debt tranches of collateralized loan obligations (“CLOs”)
rated BB – including those rated BB+, BB or BB- – or their equivalent. In addition, the Company may invest up to 35%
of its total assets in CLO equity securities and other securities and instruments that are consistent with our investment objectives.
The Company
benefits from the specialized investment experience of Eagle Point Income Management LLC (“Eagle Point” or the “Adviser”),
which applies its proprietary, private markets-style investment process to CLO investing. This process seeks to maximize returns
while mitigating risks. We believe the scale and experience of our Adviser and its affiliates in CLO investing provides the Company
with meaningful advantages.
The Company
had an excellent 2023. The rising interest rate environment during the year was materially positive for our portfolio of mostly
floating-rate CLO junior debt securities. For the year ended December 31, 2023, the Company had an increase in net assets resulting
from operations (inclusive of unrealized mark-to-market gains) of $29.3 million, or $3.21 per weighted average common share.1
This represents a GAAP ROE of 25.93% during the year.2 From December 31, 2022 through December 31, 2023, the Company’s
net asset value (“NAV”) per common share increased by 11% to $14.39 from $12.91.
As a result
of our strong 2023 performance, the Company increased its monthly common distribution from $0.14 per share at the end of 2022 to
$0.18 per share at the end of 2023. Additionally, the Company was pleased to increase its monthly common distribution again to
$0.20 per share beginning in January 2024.
During 2023,
we:
| ● | Generated strong GAAP net
investment income (“NII”) less realized capital losses of $1.90 per weighted average common share in 2023. Excluding
non-recurring items related to securities offerings and incurring Federal excise tax on our spillover income, our income of $2.08
per weighted average common share would have been above the $1.98 per share in regular monthly common distributions paid during the
year. |
| ● | Increased our common
distribution twice during the year to $0.18 per share. In addition, the Company declared an additional increase in our monthly
common |
Past
performance is not indicative of, or a guarantee of, future performance.
Please
see page 11 for endnotes.
| | | distribution
to $0.20 per share beginning in January 2024. Our current monthly distribution rate is
equal to 250% of what was paid during the first quarter of 2021. |
| ● | Significantly increased
recurring cash flows for the year to $29.0 million, or $3.17 per weighted average common share. This compares to recurring cash
flows of $21.0 million, or $2.97 per weighted average common share, collected during 2022. Recurring cash flows received in 2023
exceeded our total expenses and regular common distributions by $0.17 per weighted average common share. |
| ● | Strengthened our balance
sheet by issuing $34.3 million of 7.75% Series B Term Preferred Stock due in 2028 (the “Series B Term Preferred Stock”),
with proceeds deployed opportunistically into new CLO debt and equity investments, as well as raising $42.5 million of additional
common equity through our at-the-market (“ATM”) program and committed equity finance arrangement at a premium to NAV. |
While CLO junior
debt remains a significant majority of the Company’s portfolio, the CLO equity exposure continued to help enhance the Company’s
earnings ability. We believe CLOs, with their strong structural protections and self-correcting mechanisms, are well-positioned
to weather periods of market volatility. In our view, the performance of our portfolio through volatility has demonstrated the
resilience of the Company’s investment strategy.
Our portfolio’s
strong performance in 2023 allowed the Company to pay cash distributions to shareholders of $1.98 per share, or 14.01% of our average
stock price.
As of January
31, 2024, management’s unaudited estimate of the range of the Company’s NAV per common share was between $14.94 and
$15.04. The midpoint of this range represents an increase of 4.2% compared to the NAV per common share as of December 31, 2023.
As of February 15, 2024, we have $26.6 million in cash and available borrowing capacity on our balance sheet.
Company
Overview
Common Stock
The Company’s
common stock trades on the New York Stock Exchange (“NYSE”) under the symbol “EIC.” As of December 31,
2023, the NAV per share of the Company’s common stock was $14.39. The trading price of our common stock may, and often does,
differ from NAV per share. The closing price per share of our common stock was $14.57 on December 29, 2023, representing a 1.25%
premium to NAV per share as of year end.3
In connection
with our at-the-market offering program and committed equity financing arrangement, the Company sold 3.1 million shares of common
stock during the year for total net proceeds to the Company of approximately $42.5 million. The common stock issuance resulted in
NAV accretion of $0.13 per share.
Past
performance is not indicative of, or a guarantee of, future performance.
Please
see page 11 for endnotes.
During 2023,
through our usage of the ATM and committed equity financing programs, as well as the growth of our portfolio, we saw a significant
enhancement in the liquidity of the Company’s common stock as the year progressed. This was evidenced by the increased average
daily trading volume during the fourth quarter of 2023, which was nearly double the fourth quarter of 2022. With approximately
11 million outstanding common shares as of the end of 2023, the Company’s market cap as of December 31, 2023 of approximately
$160 million was more than 40% greater than where it stood at the end of 2022.
The Company
declared and paid nine monthly distributions of $0.16 per share of common stock from January 2023 through September 2023, and three
monthly distributions of $0.18 per share of common stock from October 2023 through December 2023. The Company paid a total of $1.98
per common share of monthly distributions during 2023. Please note that the actual frequency, components and amount of such distributions
are subject to variation over time.
At year-end,
a shareholder who purchased common stock as part of our initial public offering (“IPO”) in July 2019 has received total
cash distributions of $7.02 per share, over 35% of the IPO price. A portion of these distributions was comprised of a return of
capital.4
As of January
31, 2024, the closing price per share of common stock was $15.42, reflecting a premium of 2.87% compared to the midpoint of management’s
unaudited and estimated NAV range of $14.94 to $15.04 as of January month-end.
We also highlight
the Company’s dividend reinvestment plan (“DRIP”) for common stockholders. This plan allows common stockholders
to have their distributions automatically reinvested into new shares of common stock. If the prevailing market price of our common
stock exceeds our NAV per share, such reinvestment is at a discount (up to 5%) to the prevailing market price. If the prevailing
market price of our common stock is less than our NAV per share, such reinvestment is at the prevailing market price, subject to
the terms in the DRIP. We encourage all common stockholders to carefully review the terms of the plan. See “Dividend
Reinvestment Plan” in the enclosed report.
Past
performance is not indicative of, or a guarantee of, future performance.
Please
see page 11 for endnotes.
Financing Solutions
In addition
to our common stock, the Company has two preferred equity securities which trade on the NYSE, summarized below:
| Security |
NYSE
Symbol |
Par
Amount
Outstanding |
Rate |
Payment
Frequency |
Callable |
Maturity |
| 5.00%
Series A Term Preferred Stock due 2026 |
EICA |
$38.0
million |
5.00% |
Monthly |
Callable |
October
2026 |
| 7.75%
Series B Term Preferred Stock due 2028 |
EICB |
$34.3
million |
7.75% |
Monthly |
July
2025 |
July
2028 |
The weighted
average maturity on our preferred stock as of December 31, 2023 was approximately 3.7 years. In addition, all of our preferred
stock financing is fixed rate, providing us with certainty in a dynamic rate environment.
As of December
31, 2023, we had $14.5 million in outstanding borrowings from the Company’s $25 million revolving credit facility. This,
coupled with our preferred stock, represented leverage of 36% of total assets (less current liabilities). Over the long term, management
expects the Company to operate under normal market conditions generally with leverage of between 25% and 35% of total assets (less
current liabilities). Based on applicable market conditions at any given time, or should significant opportunities present themselves,
the Company may incur leverage in excess of this amount, subject to applicable regulatory and contractual limits.
Past
performance is not indicative of, or a guarantee of, future performance.
Please
see page 11 for endnotes.
Portfolio
Overview
2023 Portfolio
Update
The secondary
market was a key focus for our Adviser throughout 2023, as CLO secondary levels offered material discounts compared to most CLO
primary opportunities. The Company benefited from an elevated rate environment as the base rates for floating rate CLO debt investments
reached the highest levels observed in well over 15 years. As CLO prices appreciated throughout the year, the convexity in our
CLO debt portfolio contributed significantly to the appreciation of the Company’s investments.
For the year
ended December 31, 2023, the Company deployed $83.5 million in gross capital into CLO debt, CLO equity and other investments. The
CLO debt had a weighted average expected yield (to maturity) of 12.47% at the time of purchase, while the CLO equity had a weighted
average expected yield of 23.83% at the time of purchase.5 With essentially all of our CLO debt purchased at discounts,
and due to the callable nature of most CLO debt tranches, there is potential for higher returns than the yield to maturity for
most of those investments.
As of December
31, 2023, we had 91 CLO investments in our portfolio, the large majority of which are BB-rated (or the equivalent) CLO junior debt.
At year-end, the weighted average effective yield on the aggregate portfolio of CLO debt and equity investments was 13.29%, based
on amortized cost. This compares to 12.82% as of December 31, 2022.
During 2023,
the Company received recurring cash flows of $29.0 million, or $3.17 per weighted average common share. This was a significant
increase compared to our 2022 recurring cash flows, which totaled $21.0 million, or $2.97 per weighted average common share. Recurring
cash flows received in 2023 exceeded total expenses and our regular common distribution by $0.17 per weighted average common share.
Included within
the enclosed report, you will find detailed portfolio information, including certain look-through information related to the underlying
collateral characteristics of the CLO investments that we held as of December 31, 2023.
Past
performance is not indicative of, or a guarantee of, future performance.
Please
see page 11 for endnotes.
Market
Overview6
Loan Market
Despite a few
periods of considerable volatility in 2023, the broadly syndicated loans (“BSL”) market capped off its strongest year
since 2009. The Credit Suisse Leverage Loan Index7 (“CSLLI”) recorded a total return of 13.04% in 2023.
Firming BSL prices, higher floating rate coupons, and below average loan default levels drove performance through most of the year,
as demand from investors seeking yields amidst the higher-for-longer environment overshadowed intermittent risk-off periods during
the year. From November into year-end, economic data pointed investors towards a “soft landing” – or even “no
landing” – scenario, igniting a broad rally across debt markets, including broadly syndicated loans and CLOs.
Average BSL
prices finished 2023 at 95.32. This is an increase from 91.89 at the beginning of the year, but still below pre-Ukraine war levels.
As such, with a significant share of high-quality issuers still trading at discounted prices, we believe this represents a path
to further upside. Additionally, markets like these allow CLO collateral managers to improve underlying loan portfolios through
relative value swaps.
The trailing 12-month average default rate ended 2023 at 1.53%. This compares to 0.72% for 2022 but remains comfortably below the long-term
average of 2.70%.8 The Fund’s underlying portfolio has a materially lower default exposure
at only 0.55%. According to JP Morgan, default activity for December 2023 was the lowest since October 2022, highlighting that
while higher costs are impacting many BSL issuers, their fundamentals are holding up well. Indeed, third quarter earnings show
continued growth in issuers’ revenue and EBITDA, helping to offset the effects of rising rates.
Refinancing
activity by BSL issuers increased on a year-over-year basis, accounting for over 58% of 2023’s new supply volume, compared
to 26% in 2022. The 12-month trailing loan repayment rate increased to nearly 17.6% in December, its highest monthly level for
the year. With only 7% of the outstanding loan market at year-end set to mature prior to 2026, the often-feared maturity wall has
been pushed out: debt coming due in 2025 was cut down by 58% in 2023 to $83.1 billion, and 2026 maturities were reduced by 26%
to $175 billion. Only 7.7% of the loan portfolios underlying our CLO equity positions mature prior to 2026.
For 2023, mutual
funds and ETFs investing in U.S. leveraged loans experienced net outflows of $17 billion, compared to net outflows of $13 billion
in 2022.9 The high-yield mutual fund/ETF market, by comparison, recorded $7 billion of net outflows in 2023 after recording
$49 billion of net outflows in 2022. While these are significant sums of money, they represent a small fraction of the overall
$1.4 trillion BSL market.
A notable dynamic
that picked up steam during the second half of the year was the trend of stressed BSLs being prepaid and refinanced into new facilities
from private credit funds and business development companies (“BDCs”). Due to the sheer amount of capital raised for
private credit, we even saw CCC-rated loans getting paid off at par as companies refinanced their BSL debt in the private credit
market. The prepayment of CCC-rated loans allows reinvesting CLOs
Past
performance is not indicative of, or a guarantee of, future performance.
Please
see page 11 for endnotes.
to redeploy capital into higher quality discounted loan issues.
This has been a good trend for CLOs and if it continues into 2024, as we expect, the potential reduction of tail risk is net positive
for CLOs. Overall, private credit managers refinanced around $16 billion of BSLs in 2023, according to LCD Pitchbook.
CLO Market
The CLO market
saw $116 billion of new CLO issuance in 2023, according to LCD Pitchbook. Wide liability spreads and a generally unattractive CLO
equity arbitrage did little to deter the less economically sensitive captive CLO funds from issuing CLOs. We believe due to the
misalignment of incentive, many CLO issuers with captive CLO funds are willing to accept suboptimal CLO equity returns in order
to generate new fee streams for themselves. Of the 208 new BSL CLOs issued during the year, we estimate over 80% were supported
by captive CLO funds, while economically sensitive investors like our Adviser focused on the attractive opportunities in the secondary
market.
CLO refinancing
and reset volumes declined in 2023. Of the $24.6 billion in refinancings and resets across 57 transactions in 2023, $14.7 billion
occurred in the last three months of the year, per LCD Pitchbook data, as CLO debt spreads tightened with the year-end rally.
By the end of
2023, CLO BB discount margins averaged approximately 783 basis points over the secured overnight financing rate (“SOFR”),
a tightening of 148 basis points since the end of 2022. With average CLO BB prices at 92.5 points, we believe there continues to
be further upside to the Company’s portfolio.
Additional
Information
In addition
to the Company’s regulatory requirement to file certain quarterly and annual portfolio information as described further in
the enclosed report, the Company makes certain unaudited portfolio information available each month on its website in addition
to making certain other unaudited financial information available on its website (www.eaglepointincome.com). This information includes
(1) an estimated range of the Company’s NII and realized capital gains or losses per share of common stock for each calendar
quarter end, generally made available within the first fifteen days after the applicable calendar month end, (2) an estimated range
of the Company’s NAV per share of common stock for the prior month end and certain additional portfolio-level information,
generally made available within the first fifteen days after the applicable calendar month end, and (3) during the latter part
of each month, an updated estimate of the Company’s NAV per share of common stock, if applicable, and, with respect to each
calendar quarter end, an updated estimate of the Company’s NII and realized capital gains or losses per share for the applicable
quarter, if available.
Subsequent
Developments
Management’s
unaudited estimate of the range of the Company’s NAV per share of common stock was between $14.94 and $15.04 as of January
31, 2024. The midpoint of this range
Past
performance is not indicative of, or a guarantee of, future performance.
Please
see page 11 for endnotes.
represents an increase of 4.2% compared to the NAV per common share as of December 31, 2023.
On January 31,
2024, the Company paid a monthly distribution of $0.20 per common share to stockholders of record on January 11, 2024. Additionally,
and as previously announced, the Company declared distributions of $0.20 per share of common stock payable on each of February
29, 2024 and March 28, 2024 to holders of record on February 9, 2024 and March 8, 2024, respectively. Additionally, on February
13, 2024, the Company declared three separate distributions of $0.20 per share on its common stock. The distributions are payable
on each of April 30, 2024, May 31, 2024 and June 28, 2024 to holders of record as of April 10, 2024, May 13, 2024 and June 10,
2024, respectively.
On January 31,
2024, the Company paid a monthly distribution of $0.104167 per share of the Company’s 5.00% Series A Term Preferred Stock
due 2026 (the “Series A Term Preferred Stock”) to holders of record on January 11, 2024. Additionally, and as previously
announced, the Company declared distributions of $0.104167 per share on Series A Term Preferred Stock, payable on each of February
29, 2024 and March 28, 2024 to holders of record on February 9, 2024 and March 8, 2024, respectively. Additionally, on February
13, 2024, the Company declared three separate distributions of $0.104167 per share on its Series A Preferred Stock. The distributions
are payable on each of April 30, 2024, May 31, 2024 and June 28, 2024 to holders of record as of April 10, 2024, May 13, 2024 and
June 10, 2024, respectively.
On January 31,
2024, the Company paid a monthly distribution of $0.161459 per share of the Company’s Series B Term Preferred Stock to holders
of record on January 11, 2024. Additionally, and as previously announced, the Company declared distributions of $0.161459 per share
on Series B Term Preferred Stock, payable on each of February 29, 2024 and March 28, 2024 to holders of record on February 9, 2024
and March 8, 2024, respectively. Additionally, on February 13, 2024, the Company declared three separate distributions of $0.161459
per share on its Series B Preferred Stock. The distributions are payable on each of April 30, 2024, May 31, 2024 and June 28, 2024
to holders of record as of April 10, 2024, May 13, 2024 and June 10, 2024, respectively.
In the period
from January 1, 2024 through February 15, 2024, the Company received cash distributions on its investment portfolio of $10.3 million.
During that same period, the Company made net new investments totaling $8.9 million. As of February 15, 2024, the Company had $26.6
million of cash available for investment, inclusive of undrawn amounts on our revolving credit facility.
*
* * * *
Management remains
keenly focused on continuing to create value for our stockholders. We appreciate the trust and confidence our fellow stockholders
have placed in the Company.
Past
performance is not indicative of, or a guarantee of, future performance.
Please
see page 11 for endnotes.
Thomas Majewski
Chairman and
Chief Executive Officer
This
letter is intended to assist stockholders in understanding the Company’s performance during the twelve months ended December
31, 2023. The views and opinions in this letter were current as of February 15, 2024. Statements other than those of historical
facts included herein may constitute forward-looking statements and are not guarantees of future performance or results and involve
a number of risks and uncertainties. Actual results may differ materially from those in the forward-looking statements as a result
of a number of factors. The Company undertakes no duty to update any forward-looking statement made herein. Information contained
on our website is not incorporated by reference into this stockholder letter and you should not consider information contained
on our website to be part of this stockholder letter or any other report we file with the Securities and Exchange Commission.
Past
performance is not indicative of, or a guarantee of, future performance.
Please
see page 11 for endnotes.
ABOUT
OUR ADVISER
Eagle Point
Income Management LLC is a specialist asset manager focused exclusively on investing in CLO securities and related investments.
As of December 31, 2023, our Adviser has approximately $9.1 billion of assets under management (inclusive of undrawn capital commitments).10
Notes
| 1 | “Weighted average common share”
is calculated based on the average daily number of shares of common stock outstanding during the period and “per common share”
refers to per share of the Company’s common stock. |
| 2 | Return on our common equity reflects the Company’s
cumulative monthly performance net of applicable expenses and fees measured against beginning capital adjusted for any common equity
issued during the period. |
| 3 | An investment company trades at a premium when the market price at
which its common shares trade is more than its net asset value per common share. Alternatively, an investment company trades at
a discount when the market price at which its common shares trade is less than its net asset value per common share. |
| 4 | To date, a portion of common stock distributions has been estimated to be a return of capital as
noted under the Tax Information section on the Company’s website. The actual components of the Company's distributions for
U.S. tax reporting purposes can only be finally determined as of the end of each fiscal year of the Company and are thereafter
reported on Form 1099-DIV. A distribution comprised in whole or in part by a return of capital does not necessarily reflect the
Company’s investment performance and should not be confused with “yield” or “income”. Future distributions
may consist of a return of capital. Not a guarantee of future distributions or yield. |
| 5 | Weighted average effective yield is based on an investment’s amortized cost and expected
future cash flows whereas weighted average expected yield is based on an investment’s fair market value and expected future
cash flows as of the applicable period end as disclosed in the Company’s financial statements, which is subject to change
from period to period. |
| 6 | JPMorgan Chase & Co.; S&P Capital IQ; Pitchbook LCD; Credit Suisse |
| 7 | The CSLLI tracks the investable universe of the US
dollar-denominated leveraged loan market. The performance of an index is not an exact representation of any particular investment,
as you cannot invest directly in an index. |
| 8 | “Par-weighted default rate” represents the rate of obligors who fail to remain current on their loans based on
the par amount. |
| 9 | JPMorgan Chase & Co. North American Credit Research – JPM High Yield and Leveraged Loan
Research (cumulative 2023 reports). |
| 10 | Calculated in the aggregate with its affiliate Eagle Point Credit Management LLC and certain other
affiliated advisers. |
Past
performance is not indicative of, or a guarantee of, future performance.
Page Intentionally Left
Blank
Important Information about this Report and
Eagle Point Income Company Inc.
This report is transmitted
to the stockholders of Eagle Point Income Company Inc. (“we”, “us”, “our” or the “Company”)
and is furnished pursuant to certain regulatory requirements. This report and the information and views herein do not constitute
investment advice, or a recommendation or an offer to enter into any transaction with the Company or any of its affiliates. This
report is provided for informational purposes only, does not constitute an offer to sell securities of the Company and is not a
prospectus. From time to time, the Company may have a registration statement relating to one or more of its securities on file
with the US Securities and Exchange Commission (“SEC”). Any registration statement that has not yet been declared effective
by the SEC, and any prospectus relating thereto, is not complete and may be changed. Any securities that are the subject of such
a registration statement may not be sold until the registration statement filed with the SEC is effective.
The information and its
contents are the property of Eagle Point Income Management LLC (the “Adviser”) and/or the Company. Any unauthorized
dissemination, copying or use of this presentation is strictly prohibited and may be in violation of law. This presentation is
being provided for informational purposes only.
Investors
should read the Company’s prospectus and SEC filings (which are publicly available on the EDGAR Database on the SEC website
at http://www.sec.gov) carefully and consider their investment
goals, time horizons and risk tolerance before investing in the Company. Investors should consider the Company’s investment
objectives, risks, charges and expenses carefully before investing in securities of the Company. There is no guarantee that any
of the goals, targets or objectives described in this report will be achieved.
An investment in the Company
is not appropriate for all investors. The investment program of the Company is speculative, entails substantial risk and includes
investment techniques not employed by traditional mutual funds. An investment in the Company is not intended to be a complete investment
program. Shares of closed-end investment companies, such as the Company, frequently trade at a discount from their net asset value
(“NAV”), which may increase investors’ risk of loss. Past performance is not indicative of, or a guarantee of,
future performance. The performance and certain other portfolio information quoted herein represents information as of December
31, 2023. Nothing herein should be relied upon as a representation as to the future performance or portfolio holdings of the Company.
Investment return and principal value of an investment will fluctuate, and shares, when sold, may be worth more or less than their
original cost. The Company’s performance is subject to change since the end of the period noted in this report and may be
lower or higher than the performance data shown herein.
Neither the Adviser nor
the Company provide legal, accounting or tax advice. Any statement regarding such matters is explanatory and may not be relied
upon as definitive advice. Investors should consult with their legal, accounting and tax advisors regarding any potential investment.
The information presented herein is as of the dates noted herein and is derived from financial and other information of the Company,
and, in certain cases, from third party sources and reports (including reports of third party custodians, CLO managers and trustees)
that have not been independently verified by the Company. As noted herein, certain of this information is estimated and unaudited,
and therefore subject to change. We do not represent that such information is accurate or complete, and it should not be relied
upon as such.
Eagle Point Income Company
Inc.
The following information
in this annual report is a summary of certain changes during the fiscal year ended December 31, 2023. This information may not
reflect all of the changes that have occurred since you purchased shares of our common stock.
During the applicable period,
there have been: (i) no material changes to the Company’s investment objectives and policies that have not been approved
by shareholders, (ii) no material changes to the Company’s principal risks, (iii) no changes to the persons primarily responsible
for day-to-day management of the Company; and (iv) no changes to the Company’s charter or bylaws that would delay or prevent
a change of control of the Company.
Investment Objectives
and Strategies
We are an externally managed,
diversified closed-end management investment company that has registered as an investment company under the Investment Company
Act of 1940, as amended (the “1940 Act”). We have elected to be treated, and intend to qualify annually, as a regulated
investment company, or “RIC,” under Subchapter M of the Internal Revenue Code of 1986, as amended, or the “Code,”
beginning with our tax year ended December 31, 2018. We were formed on September 28, 2018
as EP Income Company LLC, a Delaware
limited liability company, and converted into a Delaware corporation on October 16, 2018.
Our primary investment
objective is to generate high current income, with a secondary objective to generate capital appreciation. We seek to achieve our
investment objectives by investing primarily in junior debt tranches of CLOs, that are collateralized by a portfolio consisting
primarily of below investment grade U.S. senior secured loans with a large number of distinct underlying borrowers across various
industry sectors. We focus on CLO debt tranches rated “BB” (e.g., BB+, BB or BB-, or their equivalent) by Moody’s
Investors Service, Inc., or “Moody’s,” Standard & Poor’s, or “S&P,” or Fitch Ratings,
Inc., or “Fitch,” and/or other applicable nationally recognized statistical rating organizations. We may also invest
in other junior debt tranches of CLOs, loan accumulation facilities, senior debt tranches of CLOs and other related securities
and instruments, including synthetic investments, such as significant risk transfer securities and credit risk transfer securities
issued by banks or other financial institutions. In addition, we may invest up to 35% of our total assets (at the time of investment)
in CLO equity securities. We expect our investments in CLO equity securities to primarily reflect minority ownership positions.
We may also invest in other securities and instruments that the Adviser believes are consistent with our investment objectives
such as securities issued by other securitization vehicles, such as collateralized bond obligations or “CBOs”. The
amount that we will invest in other securities and instruments, which may include investments in debt and other securities issued
by CLOs collateralized by non-U.S. loans or securities of other collective investment vehicles, will vary from time to time and,
as such, may constitute a material part of our portfolio on any given date, all as based on the Adviser’s assessment of prevailing
market conditions. The CLO securities in which we primarily seek to invest are rated below investment grade or, in the case of
CLO equity securities, are unrated and are considered speculative with respect to timely payment of interest and repayment of principal.
Below investment grade and unrated securities are also sometimes referred to as “junk” securities.
These investment objectives
are not fundamental policies of ours and may be changed by our board of directors without prior approval of our stockholders.
Investment Restrictions
Our investment objectives
and our investment policies and strategies, except for the eight investment restrictions designated as fundamental policies under
this caption, are not fundamental and may be changed by the board of directors without stockholder approval.
The following eight investment
restrictions are designated as fundamental policies and, as such, cannot be changed without the approval of the holders of a majority
of our outstanding voting securities:
| 1. | We may not borrow money, except as permitted by (i) the 1940 Act,
or interpretations or modifications by the SEC, SEC staff or other authority with appropriate jurisdiction, or (ii) exemptive or
other relief or permission from the SEC, SEC staff or other authority with appropriate jurisdiction; |
| 2. | We may not engage in the business of underwriting securities issued
by others, except to the extent that we may be deemed to be an underwriter in connection with the disposition of portfolio securities; |
| 3. | We may not purchase or sell physical commodities or contracts
for the purchase or sale of physical commodities. Physical commodities do not include futures contracts with respect to securities,
securities indices, currency or other financial instruments; |
| 4. | We may not purchase or sell real estate, which term does not
include securities of companies which deal in real estate or mortgages or investments secured by real estate or interests therein,
except that we reserve freedom of action to hold and to sell real estate acquired as a result of our ownership of securities; |
| 5. | We may not make loans, except to the extent permitted by (i)
the 1940 Act, or interpretations or modifications by the SEC, SEC staff or other authority with appropriate jurisdiction, or (ii)
exemptive or other relief or permission from the SEC, SEC staff or other authority with appropriate jurisdiction. For purposes
of this investment restriction, the purchase of debt obligations (including acquisitions of loans, loan participations or other
forms of debt instruments) shall not constitute loans by us; |
| 6. | We may not issue senior securities, except to the extent permitted
by (i) the 1940 Act, or interpretations or modifications by the SEC, the SEC staff or other authority with appropriate jurisdiction,
or (ii) exemptive or other relief or permission from the SEC, SEC staff or other authority with appropriate jurisdiction; |
| 7. | We may not invest in any security if as a result of such investment,
25% or more of the value of our total assets, taken at market value at the time of each investment, are in the securities of issuers
in any particular industry or group of |
| | | industries
except (a) securities issued or guaranteed by the U.S. government and its agencies and
instrumentalities or tax-exempt securities of state and municipal governments or their
political subdivisions (however, not including private purpose industrial development
bonds issued on behalf of non-government issuers), or (b) as otherwise provided by the
1940 Act, as amended from time to time, and as modified or supplemented from time to
time by (i) the rules and regulations promulgated by the SEC under the 1940 Act, as amended
from time to time, and (ii) any exemption or other relief applicable to us from the provisions
of the 1940 Act, as amended from time to time. For purposes of this restriction, in the
case of investments in loan participations between us and a bank or other lending institution
participating out the loan, we will treat both the lending bank or other lending institution
and the borrower as “issuers.” For purposes of this restriction, an investment
in a CLO, collateralized bond obligation, collateralized debt obligation or a swap or
other derivative will be considered to be an investment in the industry or group of industries
(if any) of the underlying or reference security, instrument or asset; and |
| 8. | We may not engage in short sales, purchases on margin, or
the writing of put or call options, except as permitted by (i) the 1940 Act, or interpretations or modifications by the SEC, SEC
staff or other authority with appropriate jurisdiction or (ii) exemptive or other relief or permission from the SEC, SEC staff
or other authority with appropriate jurisdiction. |
The latter part of certain
of our fundamental investment restrictions (i.e., the references to “except to the extent permitted by (i) the 1940
Act, or interpretations or modifications by the SEC, the SEC staff or other authority with appropriate jurisdiction, or (ii) exemptive
or other relief or permission from the SEC, SEC staff or other authority with appropriate jurisdiction”) provides us with
flexibility to change our limitations in connection with changes in applicable law, rules, regulations or exemptive relief. The
language used in these restrictions provides the necessary flexibility to allow our board of directors to respond efficiently to
these kinds of developments without the delay and expense of a stockholder meeting.
Whenever an investment
policy or investment restriction set forth in this report or in our prospectus states a maximum percentage of assets that may be
invested in any security or other asset, or describes a policy regarding quality standards, such percentage limitation or standard
shall be determined immediately after and as a result of our acquisition of such security or asset. Accordingly, any later increase
or decrease resulting from a change in values, assets or other circumstances or any subsequent rating change made by a rating agency
(or as determined by the Adviser if the security is not rated by a rating agency) will not compel us to dispose of such security
or other asset. Notwithstanding the foregoing, we must always be in compliance with the borrowing policies set forth above.
Use of Leverage and
Leverage Risks
The use of leverage, whether
directly through borrowing under a revolving credit facility with BNP Paribas (the “Credit Facility”) or the issuance
of the Series A Term Preferred Stock and Series B Term Preferred Stock, or indirectly through investments such as CLO junior debt
and equity securities that inherently involve leverage, may magnify our risk of loss. CLO junior debt and equity securities are
very highly leveraged (with CLO equity securities typically being leveraged ten times), and therefore the CLO securities in which
we invest are subject to a higher degree of loss since the use of leverage magnifies losses.
We have incurred leverage
by issuing preferred stock and incurring indebtedness for borrowed money. We may incur additional leverage, directly or indirectly,
through one or more special purpose vehicles, indebtedness for borrowed money, as well as leverage in the form of derivative transactions,
additional shares of preferred stock, debt securities and other structures and instruments, in significant amounts and on terms
that the Adviser and our board of directors deem appropriate, subject to applicable limitations under the 1940 Act. Such leverage
may be used for the acquisition and financing of our investments, to pay fees and expenses and for other purposes. Such leverage
may be secured and/or unsecured. The more leverage we employ, the more likely a substantial change will occur in our NAV. Accordingly,
any event that adversely affects the value of an investment would be magnified to the extent leverage is utilized. The cumulative
effect of the use of leverage with respect to any investments in a market that moves adversely to such investments could result
in a substantial loss that would be greater than if our investments were not leveraged.
The following table is
intended to illustrate the effect of the use of direct leverage on returns from an investment in our common stock assuming various
annual returns, net of expenses. The calculations in the table below are hypothetical and actual returns may be higher or lower
than those appearing in the table below.
| Assumed Return on Our Portfolio (Net of Expenses) |
-10% |
-5% |
0% |
5% |
10% |
| Corresponding return to common stockholder(1) |
-19.24% |
-11.49% |
-3.74% |
4.01% |
11.76% |
Based on our assumed leverage
described above, our investment portfolio would have been required to experience an annual return of at least 2.41% to cover annual
interest payments on our outstanding indebtedness and preferred equity.
Principal Risk Factors
For a description of the
principal risk factors associated with an investment in the Company, please refer to Note 3 to the Financial Statements, “Investments
– Investment Risk Factors”).
Additional
Information
The Company makes certain
unaudited portfolio information available each month on its website in addition to making certain other unaudited financial information
available on its website (www.eaglepointincome.com). This information includes (1) an estimated range of the Company’s net
investment income (“NII”) and realized capital gains or losses per weighted average share of common stock for each
calendar quarter end, generally made available within the first fifteen days after the applicable calendar month end, (2) an estimated
range of the Company’s NAV per share of common stock for the prior month end and certain additional portfolio-level information,
generally made available within the first fifteen days after the applicable calendar month end, and (3) during the latter part
of each month, an updated estimate of NAV, if applicable, and, with respect to each calendar quarter end, an updated estimate of
the Company’s NII and realized capital gains or losses for the applicable quarter, if available.
Information contained on
our website is not incorporated by reference into this Annual Report and you should not consider information contained on our website
to be part of this Annual Report or any other report we file with the SEC.
Forward-Looking Statements
This report may contain
“forward-looking statements” within the meaning of the Private Securities Litigation Reform Act of 1995. Statements
other than statements of historical facts included in this report may constitute forward-looking statements and are not guarantees
of future performance or results and involve a number of risks and uncertainties. Actual results may differ materially from those
in the forward-looking statements as a result of a number of factors, including those described in the Company’s filings
with the SEC. The Company undertakes no duty to update any forward-looking statement made herein. All forward-looking statements
speak only as of the date of this report.
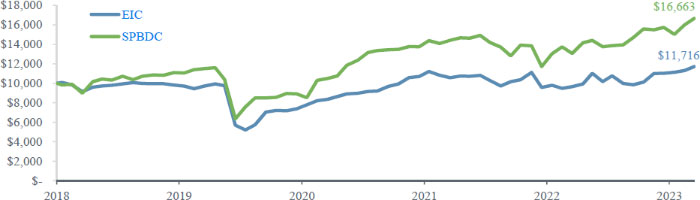
Performance
Data1,2
The
following graph shows the market price performance of a $10,000 investment in the Company’s common shares for the period
from October 16, 2018 (inception) through December 31, 2023. The performance calculation assumes the purchase of Company shares
at net asset value for the beginning of the period (prior to the Company’s public listing) and the sale of Company shares
at the market price at the end of the period. Ending value for each year are as of December 31 of the applicable year. As the
Company’s IPO occurred in July 2019, the value used for the Company’s performance as of December 31, 2018 reflects
the Company’s then-current net asset value per share. For comparative purposes, the performance of a relevant third-party
securities market index, the S&P BDC Index, is shown. Distributions are assumed, for purposes of this calculation, to be reinvested
at prices obtained under the Company’s dividend reinvestment plan. The performance does not reflect brokerage commissions
in connection with the purchase or sale of Company shares, which if included would lower the performance shown. Returns do not
reflect the deduction of taxes that a shareholder would pay on Company distributions or the sale of Company shares.
Past
performance is not indicative of, or a guarantee of, future performance. Future results may vary and may be higher or lower than
the data shown.
| Value
of $10,000 Invested |
| |
Average
Annualized Total Return |
Cumulative
Returns |
| |
1
year |
5
year |
Since
Inception |
Since
Inception |
| EIC |
21.37% |
5.09% |
3.09% |
17.16% |
| S&P
BDC Index |
27.58% |
13.16% |
10.31% |
66.63% |
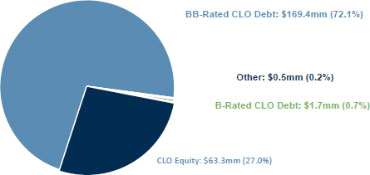
Summary
of Certain Unaudited Portfolio Characteristics
The
information presented below is on a look–through basis to the collateralized loan obligation, or “CLO”, investments held by the Company as of December 31, 2023 (except as otherwise noted) and reflects the aggregate underlying
exposure of the Company based on the portfolios of those investments. The data is estimated and unaudited and is derived from
CLO trustee reports received by the Company relating to December 2023 and from custody statements and/or other information received
from CLO collateral managers, or other third party sources.
| Summary
of Portfolio Investments (as of 12/31/2023)3 |
| |
 |
Cash
and Borrowing Capacity: $11.4 million3 |
| |
| Summary
of Underlying Portfolio Characteristics (as of 12/31/2023)4 |
| Number
of Unique Underlying Loan Obligors |
1,419 |
| Largest
Exposure to an Individual Obligor |
0.73% |
| Average
Individual Loan Obligor Exposure |
0.07% |
| Top
10 Loan Obligors Exposure |
5.57% |
| Currency:
USD Exposure |
100.00% |
| Indirect
Exposure to Senior Secured Loans5 |
97.59% |
| Weighted
Average OC Cushion Senior to the Security6 |
4.34% |
| Weighted
Average Market Value of Loan Collateral |
96.25% |
| Weighted
Average Stated Loan Spread |
3.76% |
| Weighted
Average Loan Rating7 |
B+/B |
| Weighted
Average Loan Maturity |
4.2
years |
| Weighted
Average Remaining CLO Reinvestment Period |
1.2
years |
| Top
10 Underlying Obligors4 |
| Obligor |
%
of Total |
| Asurion |
0.7% |
| Numericable |
0.6% |
| Cablevision |
0.6% |
| Ineos |
0.6% |
| Medline
Industries |
0.6% |
| Virgin
Media |
0.5% |
| Athenahealth |
0.5% |
| Centurylink |
0.5% |
| Transdigm |
0.5% |
| Ultimate
Software Group |
0.5% |
| Total |
5.6% |
| Top
10 Industries of Underlying Obligors4,8,9 |
| Industry |
%
of Total |
| Technology:
Software & Services |
11.1% |
| Media |
6.5% |
| Health
Care Providers & Services |
5.6% |
| Hotels,
Restaurants & Leisure |
4.3% |
| Diversified
Telecommunications Services |
4.0% |
| Commercial
Services & Supplies |
3.9% |
| Diversified
Financial Services |
3.8% |
| Insurance |
3.4% |
| Chemicals |
3.2% |
| Technology:
Hardware & Equipment |
3.0% |
| Total |
48.8% |
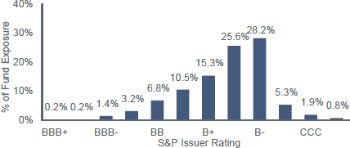
| Rating
Distribution of Underlying Obligors4,7 |
 |
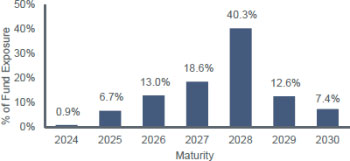
| Maturity
Distribution of Underlying Obligors4 |
 |
Notes
| 1 | Based
on the market price. Prices for October 16, 2018 (inception date) and December 31, 2018
represent the Net Asset Value (“NAV”) per share. |
| 2 | The
performance of an index is not an exact representation of any particular investment,
as you cannot invest directly in an index. The indices shown herein have not been selected
to represent a benchmark for a strategy’s performance, but are instead disclosed
to allow for comparison of the Company’s returns to that of known, recognized and/or
similar indices. The S&P
BDC Index is intended to measure the performance of all Business Development Companies
(BDCs) that are listed on the NYSE or NASDAQ and satisfy market capitalization and other
eligibility requirements. Although EIC is not a BDC, BDCs generally invest in high yielding
credit investments, as does EIC. In addition, similar to EIC, BDCs generally elect to
be classified as a regulated investment company under the U.S. Internal Revenue Code
of 1986, as amended, which generally requires an investment company to distribute its
taxable income to shareholders. |
| 3 | The
summary of portfolio investments shown is based on the estimated fair value of the underlying
positions as of December 31, 2023. Cash and borrowing capacity represents cash net of
pending trade settlements and includes available capacity on the Company’s credit
facility as of December 31, 2023. Borrowings under the credit facility are subject to
applicable regulatory and contractual limits. |
| 4 | The
information presented herein is on a look-through basis to the collateralized loan obligation,
or “CLO,” and other related investments held by the Company as of December
31, 2023 (except as otherwise noted) and reflects the aggregate underlying exposure of
the Company based on the portfolios of those investments. The data is estimated and unaudited
and is derived from CLO trustee reports received by the Company relating to December
2023 and from custody statements and/or other information received from CLO collateral
managers and other third-party sources. Information relating to the market price of underlying
collateral is as of month end; however, with respect to other information shown, depending
on when such information was received, the data may reflect a lag in the information
reported. As such, while this information was obtained from third party data sources,
December 2023 trustee reports and similar reports, other than market price, it does not
reflect actual underlying portfolio characteristics as of December 31, 2023 and this
data may not be representative of current or future holdings. The Weighted Average Remaining
Reinvestment Period information is based on the fair value of CLO equity and debt investments
held by the Company at the end of the reporting period. |
| 5 | Data
represents aggregate indirect exposure. We obtain exposure in underlying senior secured
loans indirectly through our CLO and related investments. |
| 6 | The
weighted average OC cushion senior to the security is calculated using the BBB OC cushion
for all BB-rated CLO debt securities in the portfolio and the BB OC cushion for all other
securities in the portfolio, in each case as held on December 31, 2023. |
| 7 | Credit
ratings shown are based on those assigned by Standard & Poor’s Rating Group,
or “S&P,” or, for comparison and informational purposes, if S&P does
not assign a rating to a particular obligor, the weighted average rating shown reflects
the S&P equivalent rating of a rating agency that rated the obligor provided that
such other rating is available with respect to a CLO or related investment held by us.
In the event multiple ratings are available, the lowest S&P rating, or if there is
no S&P rating, the lowest equivalent rating, is used. The ratings of specific borrowings
by an obligor may differ from the rating assigned to the obligor and may differ among
rating agencies. For certain obligors, no rating is available in the reports received
by the Company. Such obligors are not shown in the graphs and, accordingly, the sum of
the percentages in the graphs may not equal 100%. Ratings below BBB- are below investment
grade. Further information regarding S&P’s rating methodology and definitions
may be found on its website (www.standardandpoors.com). |
| 8 | Industry
categories are based on the S&P industry categorization of each obligor as reported
in CLO trustee reports to the extent so reported. Certain CLO trustee reports do not
report the industry category of all of the underlying obligors and where such information
is not reported, it is not included in the summary look-through industry information
shown. As such, the Company’s exposure to a particular industry may be higher than
that shown if industry categories were available for all underlying obligors. In addition,
certain underlying obligors may be re-classified from time to time based on developments
in their respective businesses and/or market practices. Accordingly, certain underlying
borrowers that are currently, or were previously, summarized as a single borrower in
a particular industry may in current or future periods be reflected as multiple borrowers
or in a different industry, as applicable. |
| 9 | Certain
CLO trustee reports do not provide the industry classification for certain underlying
obligors. These obligors are not summarized in the look-through industry data shown;
if they were reflected, they would represent 7.2%. |
Fees
and Expenses (unaudited)
The
following table is intended to assist you in understanding the costs and expenses that an investor in shares of the Company’s
common stock will bear directly or indirectly. The expenses shown in the table under “Annual Expenses” are estimated
based on historical fees and expenses incurred by the Company, as appropriate. In addition, such amounts are based on the
Company’s pro forma assets as of December 31, 2023, which have been adjusted to reflect (i) the issuance in the
Company’s “at-the-market” offering of 1.1 million shares of our common stock and 45,322 shares of our Series B
Preferred Stock from January 1, 2024 through February 15, 2024, yielding net proceeds to the Company of approximately $16.9 million;
(ii) the hypothetical borrowings of the full $25,000,000 available under the BNP Credit Facility, which would mean that the
Company’s adjusted total assets are assumed to equal approximately $269.6 million. As of December 31, 2023, and pro forma for
the issuances and assumed borrowings described above (excluding any regular monthly distributions paid after December 31, 2023), the
Company’s leverage represented approximately 36.7% of the Company’s total assets (less current liabilities). Such
expenses, and actual leverage incurred by the Company, may vary in the future. Whenever this report (or other Company disclosures,
including the Company’s prospectus) contain a reference to fees or expenses paid by the Company, the Company’s common
stockholders will indirectly bear such fees or expenses.
| Stockholder
Transaction Expenses (as a percentage of the offering price): |
|
|
| Sales
load |
|
—%(1) |
| Offering
expenses borne by the Company |
|
—%(2) |
| Dividend
reinvestment plan expenses |
|
Up
to $15(3) |
| Total
stockholder transaction expenses |
|
—% |
| Annual
Expenses (as a percentage of net assets attributable to common stock): |
|
|
| Management
fee |
|
1.94%(4) |
| Interest
payments on borrowed funds |
|
3.74%(5) |
| Other
expenses |
|
1.49%(6) |
| Total
annual expenses |
|
7.17% |
| (5) | “Interest
payments on borrowed funds” represents the Company’s annualized interest
expense and includes dividends payable on the Series A Term Preferred Stock and Series
B Term Preferred Stock, outstanding on December 31, 2023, and includes the pro forma
effect of the Series B Preferred Stock issuance and assumed borrowings under the BNP Credit Facility described above, which,
in the aggregate, have a weighted average interest rate of 6.60% per annum. The Company
may issue additional shares of preferred stock. In the event that the Company were to
issue additional shares of preferred stock, the Company’s borrowing costs, and
correspondingly its total annual expenses, including, |
| in the case of such preferred stock,
the base management fee as a percentage of the Company’s managed assets attributable
to common stock, would increase. |
| (6) | “Other
expenses” includes the Company’s overhead expenses, including payments under
the Administration Agreement based on the Company’s allocable portion of overhead
and other expenses incurred by Eagle Point Administration LLC (“Eagle Point Administration”),
the administrator to the Company and an affiliate of the Adviser, and payment of fees
in connection with outsourced administrative functions, and are based on the actual amounts
for the 2023 fiscal year. See “Related Party Transactions —
Administrator” in the Notes to the Financial Statements. “Other expenses”
also includes the ongoing administrative expenses to the independent accountants and
legal counsel of the Company, compensation of independent directors, and cost and expenses
relating to rating agencies. |
Example
The
following example is furnished in response to the requirements of the SEC and illustrates the various costs and expenses that
you would pay, directly or indirectly, on a $1,000 investment in shares of the Company’s common stock for the time periods
indicated, assuming (1) total annual expenses of 7.17% of net assets attributable to the Company’s common stock and (2) a
5% annual return*:
| |
|
1 year |
|
3 years |
|
5 years |
|
10 years |
|
| You
would pay the following expenses on a $1,000 investment, assuming a 5% annual return |
|
|
$72 |
|
|
$210 |
|
$343 |
|
$651 |
|
*
The example should not be considered a representation of future returns or expenses, and actual returns and expenses may be
greater or less than those shown. The example assumes that the estimated “other expenses” set forth in the
Annual Expenses table are accurate, and that all dividends and distributions are reinvested at NAV. The Company’s actual
rate of return may be greater or less than the hypothetical 5% return shown in the example.
Consolidated
Financial Statements for the Year Ended
December 31, 2023 (Audited)
Eagle
Point Income Company Inc. and Subsidiaries
Consolidated
Statement of Assets and Liabilities
As
of December 31, 2023
(expressed
in U.S. dollars)
| ASSETS | |
| |
| Investments, at fair value (cost $254,810,654) | |
$ | 234,917,292 | |
| Cash and cash equivalents | |
| 944,060 | |
| Interest receivable | |
| 6,895,878 | |
| Receivable for shares of common stock issued pursuant to the Company's dividend reinvestment plan | |
| 144,528 | |
| Excise tax refund receivable | |
| 55,413 | |
| Prepaid expenses | |
| 770,872 | |
| Total Assets | |
| 243,728,043 | |
| | |
| | |
| | |
| | |
| LIABILITIES | |
| | |
| 5.00% Series A Term Preferred Stock due 2026, at fair value under the fair value option (1,521,649 shares outstanding) (Note 6) | |
| 35,241,087 | |
| | |
| | |
| 7.75% Series B Term Preferred Stock due 2028, at fair value under the fair value option (1,372,482 shares outstanding) (Note 6) | |
| 34,243,289 | |
| Unamortized share issuance premium associated with 7.75% Series B Term Preferred Stock due 2028 | |
| 2,932 | |
| 7.75% Series B Term Preferred Stock due 2028, at fair value, plus associated unamortized share issuance premium | |
| 34,246,221 | |
| | |
| | |
| Borrowings under credit facility (less unamortized deferred financing costs of $33,333 (Note 9)) | |
| 14,486,667 | |
| Management fees payable | |
| 706,349 | |
| Tax expense payable | |
| 228,480 | |
| Professional fees payable | |
| 149,039 | |
| Interest expense payable | |
| 143,803 | |
| Directors' fees payable | |
| 127,500 | |
| Administration fees payable | |
| 127,072 | |
| Due to affiliates | |
| 28,072 | |
| Payable for securities purchased | |
| 28,000 | |
| Other expenses payable | |
| 8,333 | |
| Total Liabilities | |
| 85,520,623 | |
| | |
| | |
| COMMITMENTS AND CONTINGENCIES (Note 7) | |
| | |
| | |
| | |
| NET ASSETS applicable to 10,997,398 shares of $0.001 par value common stock outstanding | |
$ | 158,207,420 | |
| | |
| | |
| NET ASSETS consist of: | |
| | |
| Paid-in capital (Note 5) | |
$ | 191,377,889 | |
| Aggregate distributable earnings (losses) | |
| (33,604,689 | ) |
| Accumulated other comprehensive income (loss) | |
| 434,220 | |
| Total Net Assets | |
$ | 158,207,420 | |
| Net asset value per share of common stock | |
$ | 14.39 | |
See accompanying notes to the consolidated financial statements
Eagle
Point Income Company Inc. and Subsidiaries
Consolidated
Schedule of Investments
As
of December 31, 2023
(expressed
in U.S. dollars)
| Issuer
⁽¹⁾ | |
Investment
Description ⁽²⁾ ⁽³⁾ | |
Acquisition
Date ⁽⁴⁾ | |
|
Principal
Amount | |
Cost | | |
Fair
Value ⁽⁵⁾ | | |
%
of Net Assets | |
| Investments, at fair
value | |
| |
| |
|
| |
| | |
| | |
| |
| CLO Debt ⁽⁶⁾ | |
| |
| |
|
| |
| | | |
| | | |
| | |
| Structured Finance | |
| |
| |
|
| |
| | | |
| | | |
| | |
| AGL CLO 12 Ltd. | |
Secured Note - Class E, 11.83%,
(3M SOFR + 6.41%, due 07/20/2034) | |
08/18/2023 | |
$ |
1,500,000 | |
$ | 1,430,634 | | |
$ | 1,444,800 | | |
| 0.91 | % |
| AMMC CLO 24, Limitted | |
Secured Note - Class E, 12.25%, (3M SOFR
+ 6.83%, due 01/20/2035) | |
07/26/2023 | |
|
5,000,000 | |
| 4,664,684 | | |
| 4,788,000 | | |
| 3.03 | % |
| AMMC CLO 25, Limitted | |
Secured Note - Class E, 12.98%, (3M SOFR
+ 7.59%, due 04/15/2035) | |
08/08/2023 | |
|
5,000,000 | |
| 4,735,950 | | |
| 4,885,500 | | |
| 3.09 | % |
| Ares XXXIV CLO Ltd. | |
Secured Note - Class E-R, 12.51%, (3M SOFR
+ 7.11%, due 04/17/2033) | |
08/08/2023 | |
|
1,517,600 | |
| 1,370,691 | | |
| 1,411,368 | | |
| 0.89 | % |
| Ares XLV CLO Ltd. | |
Secured Note - Class E, 11.76%, (3M SOFR
+ 6.36%, due 10/15/2030) | |
05/30/2019 | |
|
800,000 | |
| 790,180 | | |
| 752,960 | | |
| 0.48 | % |
| Barings CLO Ltd. 2018-IV | |
Secured Note - Class E, 11.48%, (3M SOFR
+ 6.08%, due 10/15/2030) | |
10/26/2018 | |
|
840,000 | |
| 836,476 | | |
| 772,296 | | |
| 0.49 | % |
| Battalion CLO XII Ltd. | |
Secured Note - Class E, 11.72%, (3M SOFR
+ 6.35%, due 05/17/2031) | |
10/04/2018 | |
|
5,060,000 | |
| 4,921,180 | | |
| 4,460,896 | | |
| 2.82 | % |
| Battalion CLO XXI Ltd. | |
Secured Note - Class E, 12.12%, (3M SOFR
+ 6.72%, due 07/15/2034) | |
06/08/2022 | |
|
5,000,000 | |
| 4,680,842 | | |
| 4,247,000 | | |
| 2.68 | % |
| Black Diamond CLO 2016-1, Ltd. | |
Secured Note - Class D-R, 11.24%, (3M SOFR
+ 5.86%, due 04/26/2031) | |
10/04/2018 | |
|
1,050,000 | |
| 1,002,793 | | |
| 900,165 | | |
| 0.57 | % |
| Black Diamond CLO 2017-1, Ltd. | |
Secured Note - Class D, 12.26%, (3M SOFR
+ 6.86%, due 04/24/2029) | |
10/04/2018 | |
|
3,600,000 | |
| 3,593,415 | | |
| 3,495,960 | | |
| 2.21 | % |
| Carlyle US CLO 2017-1, Ltd. | |
Secured Note - Class D, 11.68%, (3M SOFR
+ 6.26%, due 04/20/2031) | |
09/15/2020 | |
|
2,000,000 | |
| 1,720,927 | | |
| 1,744,200 | | |
| 1.10 | % |
| Carlyle US CLO 2018-1, Ltd. | |
Secured Note - Class D, 11.43%, (3M SOFR
+ 6.01%, due 04/20/2031) | |
10/04/2018 | |
|
665,000 | |
| 660,021 | | |
| 602,091 | | |
| 0.38 | % |
| Carlyle US CLO 2018-2, Ltd. | |
Secured Note - Class D, 10.91%, (3M SOFR
+ 5.51%, due 10/15/2031) | |
10/04/2018 | |
|
5,500,000 | |
| 5,337,175 | | |
| 4,985,750 | | |
| 3.15 | % |
| Carlyle US CLO 2019-1, Ltd. | |
Secured Note - Class D, 12.38%, (3M SOFR
+ 6.96%, due 04/20/2031) | |
08/19/2019 | |
|
3,125,000 | |
| 2,984,784 | | |
| 2,944,375 | | |
| 1.86 | % |
| CIFC Funding 2015-I, Ltd. | |
Secured Note - Class E-RR, 11.67%, (3M SOFR
+ 6.26%, due 01/22/2031) | |
10/04/2018 | |
|
5,000,000 | |
| 4,769,385 | | |
| 4,754,000 | | |
| 3.00 | % |
| CIFC Funding 2018-II, Ltd. | |
Secured Note - Class D, 11.53%, (3M SOFR
+ 6.11%, due 04/20/2031) | |
10/04/2018 | |
|
1,225,000 | |
| 1,196,576 | | |
| 1,181,880 | | |
| 0.75 | % |
| CIFC Funding 2018-III, Ltd. | |
Secured Note - Class E, 11.16%, (3M SOFR
+ 5.76%, due 07/18/2031) | |
08/16/2023 | |
|
4,750,000 | |
| 4,418,098 | | |
| 4,539,100 | | |
| 2.87 | % |
| CIFC Funding 2018-IV, Ltd. | |
Secured Note - Class E, 13.36%, (3M SOFR
+ 7.96%, due 10/17/2031) | |
05/22/2019 | |
|
2,000,000 | |
| 1,885,116 | | |
| 1,662,600 | | |
| 1.05 | % |
| CIFC Funding 2019-II, Ltd. | |
Secured Note - Class E-R, 12.25%, (3M SOFR
+ 6.85%, due 04/17/2034) | |
08/03/2023 | |
|
2,650,000 | |
| 2,603,625 | | |
| 2,650,000 | | |
| 1.68 | % |
| CIFC Funding 2019-V, Ltd. | |
Secured Note - Class D-R, 12.44%, (3M SOFR
+ 7.04%, due 01/15/2035) | |
08/03/2023 | |
|
950,000 | |
| 933,817 | | |
| 942,020 | | |
| 0.60 | % |
| CIFC Funding 2021-III, Ltd. | |
Secured Note - Class E-1, 12.06%, (3M SOFR
+ 6.66%, due 07/15/2036) | |
08/18/2023 | |
|
3,750,000 | |
| 3,651,563 | | |
| 3,704,250 | | |
| 2.34 | % |
| Cook Park CLO, Ltd. | |
Secured Note - Class E, 11.06%, (3M SOFR
+ 5.66%, due 04/17/2030) | |
10/04/2018 | |
|
1,250,000 | |
| 1,203,574 | | |
| 1,068,125 | | |
| 0.68 | % |
| Dryden 37 Senior Loan Fund, Ltd. | |
Secured Note - Class E-R, 10.81%, (3M SOFR
+ 5.41%, due 01/15/2031) | |
10/04/2018 | |
|
500,000 | |
| 486,553 | | |
| 408,100 | | |
| 0.26 | % |
| Eaton Vance CLO 2018-1, Ltd. | |
Secured Note - Class E, 11.66%, (3M SOFR
+ 6.26%, due 10/15/2030) | |
07/26/2023 | |
|
750,000 | |
| 661,506 | | |
| 684,525 | | |
| 0.43 | % |
| First Eagle BSL CLO 2019-1 Ltd. | |
Secured Note - Class D, 13.38%, (3M SOFR
+ 7.96%, due 01/20/2033) | |
12/17/2019 | |
|
5,000,000 | |
| 4,821,748 | | |
| 4,453,000 | | |
| 2.81 | % |
| Gilbert Park CLO, Ltd. | |
Secured Note - Class E, 12.06%, (3M SOFR
+ 6.66%, due 10/15/2030) | |
12/19/2023 | |
|
5,327,000 | |
| 5,109,772 | | |
| 5,115,518 | | |
| 3.23 | % |
| Harbor Park CLO, Ltd. | |
Secured Note - Class E, 11.28%, (3M SOFR
+ 5.86%, due 01/20/2031) | |
08/08/2023 | |
|
2,250,000 | |
| 2,125,238 | | |
| 2,167,875 | | |
| 1.37 | % |
| KKR CLO 14 Ltd. | |
Secured Note - Class E-R, 11.81%, (3M SOFR
+ 6.41%, due 07/15/2031) | |
12/20/2023 | |
|
2,700,000 | |
| 2,575,641 | | |
| 2,575,530 | | |
| 1.63 | % |
| KKR CLO 22 Ltd. | |
Secured Note - Class E, 11.68%, (3M SOFR
+ 6.26%, due 07/20/2031) | |
10/27/2021 | |
|
3,950,000 | |
| 3,799,266 | | |
| 3,814,120 | | |
| 2.41 | % |
| KKR CLO 26 Ltd. | |
Secured Note - Class E-R, 12.81%, (3M SOFR
+ 7.41%, due 10/15/2034) | |
08/08/2023 | |
|
750,000 | |
| 714,404 | | |
| 740,925 | | |
| 0.47 | % |
| KKR CLO 29 Ltd. | |
Secured Note - Class F, NM, (3M SOFR + 9.26%,
due 01/15/2032) | |
12/14/2021 | |
|
589,812 | |
| — | | |
| — | | |
| 0.00 | % |
| LCM XVIII, L.P. | |
Secured Note - Class E-R, 11.63%, (3M SOFR
+ 6.21%, due 04/20/2031) | |
10/04/2018 | |
|
600,000 | |
| 598,753 | | |
| 452,700 | | |
| 0.29 | % |
| Madison Park Funding XX, Ltd. | |
Secured Note - Class E-R, 10.95%, (3M SOFR
+ 5.56%, due 07/27/2030) | |
10/20/2023 | |
|
1,250,000 | |
| 1,121,821 | | |
| 1,193,750 | | |
| 0.75 | % |
| Madison Park Funding XXVII, Ltd. | |
Secured Note - Class D, 10.68%, (3M SOFR
+ 5.26%, due 04/20/2030) | |
10/04/2018 | |
|
3,050,000 | |
| 2,883,163 | | |
| 2,857,850 | | |
| 1.81 | % |
| Madison Park Funding XLII, Ltd. | |
Secured Note - Class E, 11.72%, (3M SOFR
+ 6.31%, due 11/21/2030) | |
08/15/2019 | |
|
1,875,000 | |
| 1,773,839 | | |
| 1,816,313 | | |
| 1.15 | % |
| Madison Park Funding LI, Ltd. | |
Secured Note - Class E, 11.93%, (3M SOFR
+ 6.53%, due 07/19/2034) | |
10/28/2021 | |
|
4,250,000 | |
| 4,235,377 | | |
| 4,224,075 | | |
| 2.67 | % |
| Marathon CLO IX, Ltd. | |
Secured Note - Class D, 11.71%, (3M SOFR
+ 6.31%, due 04/15/2029) | |
10/04/2018 | |
|
4,050,000 | |
| 4,013,788 | | |
| 3,200,310 | | |
| 2.02 | % |
| Marathon CLO XIII, Ltd. | |
Secured Note - Class D, 12.64%, (3M SOFR
+ 7.24%, due 04/15/2032) | |
06/04/2019 | |
|
3,500,000 | |
| 3,370,696 | | |
| 2,850,050 | | |
| 1.80 | % |
| Neuberger Berman Loan Advisers CLO 33, Ltd. | |
Secured Note - Class E-R, 11.91%, (3M SOFR
+ 6.51%, due 10/16/2033) | |
07/24/2023 | |
|
5,000,000 | |
| 4,683,412 | | |
| 4,790,000 | | |
| 3.03 | % |
| OZLM XXI, Ltd. | |
Secured Note - Class D, 11.22%, (3M SOFR
+ 5.80%, due 01/20/2031) | |
10/04/2018 | |
|
4,150,000 | |
| 4,079,041 | | |
| 3,708,855 | | |
| 2.34 | % |
| Octagon Investment Partners 37, Ltd. | |
Secured Note - Class D, 11.04%, (3M SOFR
+ 5.66%, due 07/25/2030) | |
10/04/2018 | |
|
2,575,000 | |
| 2,407,733 | | |
| 2,230,980 | | |
| 1.41 | % |
| Octagon Investment Partners 38, Ltd. | |
Secured Note - Class D, 11.38%, (3M SOFR
+ 5.96%, due 07/20/2030) | |
10/04/2018 | |
|
3,725,000 | |
| 3,664,389 | | |
| 3,342,070 | | |
| 2.11 | % |
| Octagon Investment Partners 39, Ltd. | |
Secured Note - Class E, 11.43%, (3M SOFR
+ 6.01%, due 10/20/2030) | |
10/24/2018 | |
|
1,550,000 | |
| 1,500,932 | | |
| 1,434,835 | | |
| 0.91 | % |
| Octagon Investment Partners 41, Ltd. | |
Secured Note - Class E-R, 12.79%, (3M SOFR
+ 7.39%, due 10/15/2033) | |
09/24/2021 | |
|
5,000,000 | |
| 4,814,028 | | |
| 4,667,500 | | |
| 2.95 | % |
| Palmer Square CLO 2018-1, Ltd. | |
Secured Note - Class D, 10.81%, (3M SOFR
+ 5.41%, due 04/18/2031) | |
05/30/2019 | |
|
1,120,000 | |
| 1,054,020 | | |
| 1,078,896 | | |
| 0.68 | % |
| Pikes Peak CLO 1 | |
Secured Note - Class E, 11.71%, (3M SOFR
+ 6.31%, due 07/24/2031) | |
10/28/2021 | |
|
3,500,000 | |
| 3,415,309 | | |
| 3,256,750 | | |
| 2.06 | % |
| RR 4 Ltd. | |
Secured Note - Class D, 11.51%, (3M SOFR
+ 6.11%, due 04/15/2030) | |
10/28/2021 | |
|
5,000,000 | |
| 4,821,740 | | |
| 4,682,500 | | |
| 2.96 | % |
| RR 7 Ltd. | |
Secured Note - Class D-1B, 11.89%, (3M SOFR
+ 6.50%, due 01/15/2037) | |
08/10/2023 | |
|
2,000,000 | |
| 1,920,000 | | |
| 1,932,600 | | |
| 1.22 | % |
| Rockford Tower CLO 2018-1, Ltd. | |
Secured Note - Class E, 11.48%, (3M SOFR
+ 6.11%, due 05/20/2031) | |
09/30/2021 | |
|
2,250,000 | |
| 2,197,274 | | |
| 2,027,475 | | |
| 1.28 | % |
| Rockford Tower CLO 2018-2, Ltd. | |
Secured Note - Class E, 11.68%, (3M SOFR
+ 6.26%, due 10/20/2031) | |
10/04/2018 | |
|
5,000,000 | |
| 4,857,535 | | |
| 4,523,500 | | |
| 2.86 | % |
| Rockford Tower CLO 2019-2, Ltd. | |
Secured Note - Class E, 11.68%, (3M SOFR
+ 6.31%, due 08/20/2032) | |
01/13/2021 | |
|
3,000,000 | |
| 2,965,466 | | |
| 2,683,200 | | |
| 1.70 | % |
| Rockford Tower CLO 2020-1, Ltd. | |
Secured Note - Class E, 12.58%, (3M SOFR
+ 7.16%, due 01/20/2032) | |
12/04/2020 | |
|
1,600,000 | |
| 1,575,200 | | |
| 1,544,640 | | |
| 0.98 | % |
| Rockford Tower CLO 2021-3, Ltd. | |
Secured Note - Class E, 12.40%, (3M SOFR
+ 6.98%, due 10/20/2034) | |
10/17/2023 | |
|
900,000 | |
| 771,075 | | |
| 794,070 | | |
| 0.50 | % |
| TCI-Symphony CLO 2016-1 Ltd. | |
Secured Note - Class E-R2, 12.41%, (3M SOFR
+ 7.01%, due 10/13/2032) | |
01/13/2022 | |
|
3,000,000 | |
| 3,000,000 | | |
| 2,681,700 | | |
| 1.70 | % |
| TICP CLO VIII, Ltd. | |
Secured Note - Class D-R, 12.38%, (3M SOFR
+ 6.96%, due 10/20/2034) | |
07/27/2023 | |
|
1,000,000 | |
| 936,667 | | |
| 970,100 | | |
| 0.61 | % |
| TICP CLO IX, Ltd. | |
Secured Note - Class E, 11.28%, (3M SOFR
+ 5.86%, due 01/20/2031) | |
08/22/2019 | |
|
2,500,000 | |
| 2,379,219 | | |
| 2,464,750 | | |
| 1.56 | % |
| TICP CLO XI, Ltd. | |
Secured Note - Class E, 11.68%, (3M SOFR
+ 6.26%, due 10/20/2031) | |
10/29/2021 | |
|
5,050,000 | |
| 5,020,338 | | |
| 4,984,350 | | |
| 3.15 | % |
| Venture 36 CLO, Limited | |
Secured Note - Class E, 12.60%, (3M SOFR
+ 7.18%, due 04/20/2032) | |
01/21/2021 | |
|
5,607,455 | |
| 5,069,880 | | |
| 3,693,631 | | |
| 2.33 | % |
| Venture 43 CLO, Limited | |
Secured Note - Class E, 12.81%, (3M SOFR
+ 7.41%, due 04/15/2034) | |
11/02/2021 | |
|
2,500,000 | |
| 2,444,228 | | |
| 2,130,250 | | |
| 1.35 | % |
| Vibrant CLO VI, Ltd. | |
Secured Note - Class E, 11.38%, (3M SOFR
+ 6.01%, due 06/20/2029) | |
10/04/2018 | |
|
4,350,000 | |
| 3,843,656 | | |
| 3,876,720 | | |
| 2.45 | % |
| Vibrant CLO VIII, Ltd. | |
Secured Note - Class D, 11.43%, (3M SOFR
+ 6.01%, due 01/20/2031) | |
10/04/2018 | |
|
1,750,000 | |
| 1,712,774 | | |
| 1,377,250 | | |
| 0.87 | % |
| Wellfleet CLO 2018-1, Ltd. | |
Secured Note - Class E, 11.16%, (3M SOFR
+ 5.76%, due 07/17/2031) | |
10/27/2021 | |
|
4,025,000 | |
| 3,889,666 | | |
| 3,240,125 | | |
| 2.05 | % |
| Wind River 2014-1 CLO Ltd. | |
Secured Note - Class E-R, 11.96%, (3M SOFR
+ 6.56%, due 07/18/2031) | |
08/16/2021 | |
|
2,550,000 | |
| 2,396,744 | | |
| 1,645,515 | | |
| 1.04 | % |
| Wind River 2021-3 CLO Ltd. | |
Secured Note - Class E, 12.28%, (3M SOFR
+ 6.86%, due 07/20/2033) | |
10/28/2021 | |
|
4,500,000 | |
| 4,328,769 | | |
| 4,056,750 | | |
| 2.56 | % |
| York CLO-2 Ltd. | |
Secured Note - Class
E-R, 11.32%, (3M SOFR + 5.91%, due 01/22/2031) | |
05/16/2019 | |
|
2,855,000 | |
| 2,534,215 | | |
| 2,781,627 | | |
| 1.76 | % |
| | |
| |
| |
|
| |
| 179,966,381 | | |
| 171,092,616 | | |
| 108.15 | % |
| CLO Equity ⁽⁷⁾
⁽⁸⁾ | |
| |
| |
|
| |
| | | |
| | | |
| | |
| Structured Finance | |
| |
| |
|
| |
| | | |
| | | |
| | |
| Ares XLIV CLO Ltd. | |
Subordinated Note (effective yield 12.84%,
maturity 04/15/2034) | |
06/08/2021 | |
|
8,000,000 | |
| 3,092,978 | | |
| 2,320,191 | | |
| 1.47 | % |
| Ares LVIII CLO Ltd. | |
Subordinated Note (effective yield 16.82%,
maturity 01/15/2035) | |
06/17/2021 | |
|
4,000,000 | |
| 2,666,623 | | |
| 2,360,035 | | |
| 1.49 | % |
| Bain Capital Credit CLO 2021-2, Limited | |
Subordinated Note (effective yield 29.67%,
maturity 07/16/2034) | |
08/09/2023 | |
|
3,250,000 | |
| 1,726,153 | | |
| 1,821,535 | | |
| 1.15 | % |
| Bain Capital Credit CLO 2021-7, Limited | |
Subordinated Note (effective yield 28.28%,
maturity 01/22/2035) | |
09/05/2023 | |
|
4,000,000 | |
| 2,407,456 | | |
| 2,522,224 | | |
| 1.59 | % |
| Bardin Hill CLO 2021-2 Ltd. | |
Subordinated Note (effective yield 27.0%,
maturity 10/25/2034) ⁽⁹⁾ | |
09/24/2021 | |
|
5,000,000 | |
| 3,317,212 | | |
| 3,089,013 | | |
| 1.95 | % |
| Barings CLO Ltd. 2021-I | |
Subordinated Note (effective yield 16.72%,
maturity 04/25/2034) | |
11/03/2021 | |
|
4,000,000 | |
| 3,126,732 | | |
| 2,590,010 | | |
| 1.64 | % |
| Barings CLO Ltd. 2021-III | |
Subordinated Note (effective yield 16.58%,
maturity 01/18/2035) | |
11/17/2021 | |
|
5,000,000 | |
| 3,749,041 | | |
| 2,881,547 | | |
| 1.82 | % |
| Boyce Park CLO, Ltd. | |
Subordinated Note (effective yield 22.80%,
maturity 04/21/2035) | |
09/27/2023 | |
|
3,000,000 | |
| 2,154,956 | | |
| 2,162,491 | | |
| 1.37 | % |
| Boyce Park CLO, Ltd. | |
Class M-2 Notes (effective yield 22.80%,
maturity 04/21/2035) | |
09/27/2023 | |
|
3,214,286 | |
| 67,051 | | |
| 65,134 | | |
| 0.04 | % |
| Carlyle US CLO 2021-2, Ltd. | |
Subordinated Note (effective yield 14.27%,
maturity 04/20/2034) | |
10/28/2021 | |
|
3,000,000 | |
| 2,431,397 | | |
| 1,945,175 | | |
| 1.23 | % |
| Carlyle US CLO 2021-5, Ltd. | |
Subordinated Note (effective yield 14.31%,
maturity 07/20/2034) | |
11/02/2021 | |
|
5,000,000 | |
| 3,952,294 | | |
| 3,144,341 | | |
| 1.99 | % |
| Carlyle US CLO 2022-2, Ltd. | |
Subordinated Note (effective yield 21.94%,
maturity 04/20/2035) | |
08/15/2023 | |
|
5,004,700 | |
| 3,622,418 | | |
| 3,544,767 | | |
| 2.24 | % |
| CIFC Funding 2019-VI, Ltd. | |
Subordinated Note (effective yield 19.84%,
maturity 01/16/2033) | |
12/02/2019 | |
|
6,000,000 | |
| 4,295,701 | | |
| 3,735,027 | | |
| 2.36 | % |
| CIFC Funding 2022-IV, Ltd. | |
Subordinated Note (effective yield 20.19%,
maturity 07/16/2035) | |
10/23/2023 | |
|
1,100,000 | |
| 913,000 | | |
| 914,659 | | |
| 0.58 | % |
| Clover CLO 2021-2, Ltd. | |
Subordinated Note (effective yield 21.42%,
maturity 07/20/2034) | |
08/09/2023 | |
|
2,350,000 | |
| 1,598,418 | | |
| 1,653,107 | | |
| 1.04 | % |
| Elmwood CLO 21 Ltd. | |
Subordinated Note (effective yield 18.35%,
maturity 10/20/2036) | |
10/26/2023 | |
|
5,000,000 | |
| 3,417,500 | | |
| 3,400,776 | | |
| 2.15 | % |
| Kings Park CLO, Ltd. | |
Subordinated Note (effective yield 28.47%,
maturity 01/21/2035) | |
04/27/2023 | |
|
1,000,000 | |
| 593,794 | | |
| 650,350 | | |
| 0.41 | % |
| KKR CLO 29 Ltd. | |
Subordinated Note (effective yield 18.49%,
maturity 01/15/2032) | |
12/14/2021 | |
|
5,500,000 | |
| 4,124,223 | | |
| 3,589,738 | | |
| 2.27 | % |
| Madison Park Funding XXXVII, Ltd. | |
Subordinated Note (effective yield 34.55%,
maturity 07/15/2049) | |
03/11/2020 | |
|
4,000,000 | |
| 2,344,416 | | |
| 2,528,547 | | |
| 1.60 | % |
See accompanying notes to the consolidated financial statements
Eagle
Point Income Company Inc. and Subsidiaries
Consolidated
Schedule of Investments
As
of December 31, 2023
(expressed
in U.S. dollars)
| Issuer
⁽¹⁾ | |
Investment
Description ⁽²⁾ ⁽³⁾ | |
Acquisition
Date ⁽⁴⁾ | |
|
Principal
Amount | |
Cost | | |
Fair
Value ⁽⁵⁾ | | |
%
of Net Assets | |
| CLO Equity ⁽⁷⁾
⁽⁸⁾ (continued) | |
| |
| |
|
| |
| | | |
| | | |
| | |
| Structured Finance | |
| |
| |
|
| |
| | | |
| | | |
| | |
| Marathon CLO XIII, Ltd. | |
Subordinated Note (effective yield 13.02%,
maturity 04/15/2032) | |
06/04/2019 | |
|
5,300,000 | |
| 3,208,228 | | |
| 1,506,058 | | |
| 0.95 | % |
| Octagon Investment Partners 37, Ltd. | |
Subordinated Note (effective yield 4.80%,
maturity 07/25/2030) | |
01/31/2020 | |
|
6,000,000 | |
| 3,054,254 | | |
| 1,893,737 | | |
| 1.20 | % |
| Octagon Investment Partners 43, Ltd. | |
Income Note (effective yield 10.80%, maturity
10/25/2032) | |
08/02/2019 | |
|
5,750,000 | |
| 4,050,799 | | |
| 2,510,526 | | |
| 1.59 | % |
| Point Au Roche Park CLO, Ltd. | |
Subordinated Note (effective yield 15.82%,
maturity 07/20/2034) | |
02/02/2022 | |
|
5,945,000 | |
| 4,667,753 | | |
| 4,024,287 | | |
| 2.54 | % |
| RR 23 LTD | |
Subordinated Note (effective yield 19.59%,
maturity 10/15/2035) | |
10/12/2023 | |
|
5,000,000 | |
| 3,062,500 | | |
| 3,133,790 | | |
| 1.98 | % |
| Venture 37 CLO, Limited | |
Subordinated Note (effective yield 3.94%,
maturity 07/15/2032) | |
05/21/2019 | |
|
5,200,000 | |
| 3,199,684 | | |
| 1,741,821 | | |
| 1.10 | % |
| Wind River 2022-1 CLO
Ltd. | |
Subordinated Note (effective
yield 30.35%, maturity 07/20/2035) | |
08/15/2023 | |
|
5,490,000 | |
| 3,547,441 | | |
| 3,605,735 | | |
| 2.28 | % |
| | |
| |
| |
|
| |
| 74,392,022 | | |
| 63,334,621 | | |
| 40.03 | % |
| CFO Debt ⁽⁷⁾ | |
| |
| |
|
| |
| | | |
| | | |
| | |
| Structured Finance | |
| |
| |
|
| |
| | | |
| | | |
| | |
| Glendower Capital Secondaries CFO, LLC | |
Class B Loan, Delayed Draw, 11.50% (due
07/12/2038) ⁽¹¹⁾ ⁽¹²⁾ | |
07/13/2023 | |
|
183,622 | |
| 178,736 | | |
| 185,477 | | |
| 0.12 | % |
| Glendower Capital Secondaries
CFO, LLC | |
Class C Loan, Delayed
Draw, 14.50% (due 07/12/2038) ⁽¹¹⁾ ⁽¹²⁾ | |
07/13/2023 | |
|
84,080 | |
| 81,843 | | |
| 85,005 | | |
| 0.05 | % |
| | |
| |
| |
|
| |
| 260,579 | | |
| 270,482 | | |
| 0.17 | % |
| CFO Equity ⁽⁷⁾
⁽⁸⁾ | |
| |
| |
|
| |
| | | |
| | | |
| | |
| Structured Finance | |
| |
| |
|
| |
| | | |
| | | |
| | |
| Glendower Capital Secondaries CFO, LLC | |
Subordinated Loan, Delayed Draw (effective
yield 44.85%, maturity 07/12/2038) ⁽¹¹⁾ | |
07/13/2023 | |
|
191,672 | |
| 191,672 | | |
| 219,573 | | |
| 0.14 | % |
| | |
| |
| |
|
| |
| | | |
| | | |
| | |
Total investments
at fair value as of
December 31, 2023 | |
| |
| |
|
| |
$ | 254,810,654 | | |
$ | 234,917,292 | | |
| 148.49 | % |
| | |
| |
| |
|
| |
| | | |
| | | |
| | |
| Liabilities, at fair
value ⁽¹⁰⁾ | |
| |
| |
|
| |
| | | |
| | | |
| | |
| 5.00% Series A Term Preferred Stock due
2026 | |
Preferred Stock | |
| |
$ |
(38,041,225 | ) |
$ | (38,041,225 | ) | |
$ | (35,241,087 | ) | |
| -22.28 | % |
| 7.75% Series B Term
Preferred Stock due 2028 | |
Preferred Stock | |
| |
|
(34,312,050 | ) |
| (34,309,118 | ) | |
| (34,243,289 | ) | |
| -21.64 | % |
| Total liabilities
at fair value as of December 31, 2023 | |
| |
| |
|
| |
$ | (72,350,343 | ) | |
$ | (69,484,376 | ) | |
| -43.92 | % |
| | |
| |
| |
|
| |
| | | |
| | | |
| | |
| Net assets above (below) fair value of investments and liabilities at fair value | |
| |
|
| |
| | | |
| (7,225,496 | ) | |
| | |
| | |
| |
| |
|
| |
| | | |
| | | |
| | |
| Net assets as of
December 31, 2023 | |
| |
| |
|
| |
| | | |
$ | 158,207,420 | | |
| | |
| ⁽¹⁾ | The
Company is not affiliated with, nor does it "control" (as such term is defined
in the Investment Company Act of 1940 (the "1940 Act")), any of the issuers
listed. In general, under the 1940 Act, the Company would be presumed to "control"
an issuer if we owned 25% or more of its voting securities. |
| ⁽²⁾ | All
securities are exempt from registration under the Securities Act of 1933, as amended,
are deemed to be "restricted" securities, are categorized as structured finance
securities and the country of risk is the United States. |
| ⁽³⁾ | Pursuant
to the terms of the credit facility agreement, a security interest in favor of the lender
has been granted with respect to all investments. See Note 9 "Revolving Credit Facility"
for further discussion. |
| ⁽⁴⁾ | Acquisition
date represents the initial purchase date or the date when the investment was contributed
to the Company. See Note 1 "Organization" for further discussion. |
| ⁽⁵⁾ | Fair
value is determined by the Adviser in accordance with written valuation policies and
procedures, subject to oversight by the Company’s Board of Directors, in accordance
with Rule 2a-5 under the 1940 Act. |
| ⁽⁶⁾ | Variable
rate investment. Interest rate shown reflects the rate in effect at the reporting
date. Investment description includes the reference rate and spread. |
| ⁽⁷⁾ | Classified
as Level III investment. See Note 3 "Investments" for further discussion. |
| ⁽⁸⁾ | CLO
equity and CFO equity are entitled to recurring distributions which are generally equal
to the remaining cash flow of payments made by underlying assets less contractual payments
to debt holders and fund expenses. The effective yield is estimated based on the current
projection of the amount and timing of these recurring distributions in addition to the
estimated amount of terminal principal payment. The effective yield and investment cost
may ultimately not be realized. As of December 21, 2023, the Company's weighted average
effective yield on its aggregate CLO equity positions, based on current amortized cost,
was 18.26%. |
| ⁽⁹⁾ | Fair
value includes the Company's interest in fee rebates on CLO equity. |
| ⁽¹⁰⁾ | The
Company has accounted for its 5.00% Series A Term Preferred Stock due 2026 and 7.75%
Series B Term Preferred Stock due 2028 utilizing the fair value option election under
ASC Topic 825. Accordingly, the Series A Term Preferred Stock and Series B Term Preferred
Stock are carried at fair value. See Note 2 "Summary of Significant Accounting Policies"
for further discussion. |
| ⁽¹¹⁾ | This
investment has an unfunded commitment as of December 31, 2023. See Note 7 "Commitments
and Contingencies" for further discussion. |
| ⁽¹²⁾ | Fixed
rate investment. |
See accompanying notes to the consolidated financial statements
Eagle
Point Income Company Inc. and Subsidiaries
Consolidated
Statement of Operations
For
the year ended December 31, 2023
(expressed
in U.S. dollars)
| INVESTMENT INCOME | |
| |
| Interest income | |
$ | 26,689,756 | |
| Other income | |
| 61,065 | |
| Total Investment Income | |
| 26,750,821 | |
| | |
| | |
| EXPENSES | |
| | |
| Interest expense | |
| 3,249,279 | |
| Management fees | |
| 2,268,058 | |
| Professional fees | |
| 1,230,215 | |
| Commission expense | |
| 1,051,958 | |
| Administration fees | |
| 558,546 | |
| Directors’ fees | |
| 255,000 | |
| Tax expense ⁽¹⁾ | |
| 223,867 | |
| Amortization of deferred financing costs | |
| 21,730 | |
| Other expenses | |
| 499,503 | |
| Total Expenses | |
| 9,358,156 | |
| | |
| | |
| NET INVESTMENT INCOME | |
| 17,392,665 | |
| | |
| | |
| NET REALIZED AND UNREALIZED GAIN (LOSS) | |
| | |
| Net realized gain (loss) on investments | |
| (12,614 | ) |
| Net change in unrealized appreciation (depreciation) on investments | |
| 13,153,774 | |
| Net change in unrealized (appreciation) depreciation on liabilities at fair value under the fair value option | |
| (1,246,996 | ) |
| NET REALIZED AND UNREALIZED GAIN (LOSS) | |
| 11,894,164 | |
| | |
| | |
| NET INCREASE (DECREASE) IN NET ASSETS RESULTING FROM OPERATIONS | |
$ | 29,286,829 | |
| ⁽¹⁾ | Tax
expense consists of $79,280 of estimated Delaware franchise tax and $200,000 of estimated
excise tax, offset by $55,413 of excise tax refund related to the 2022 tax year. |
See
accompanying notes to the consolidated financial statements
Eagle
Point Income Company Inc. and Subsidiaries
Consolidated
Statement of Comprehensive Income
For the year ended December 31, 2023
(expressed in U.S. dollars)
| NET INCREASE (DECREASE) IN NET ASSETS RESULTING FROM OPERATIONS | |
$ | 29,286,829 | |
| | |
| | |
| OTHER COMPREHENSIVE INCOME (LOSS) (1) | |
| | |
| Change in unrealized (appreciation) depreciation on liabilities at fair value under the fair value option | |
| 2,259,484 | |
| | |
| | |
| NET INCREASE (DECREASE) IN NET ASSETS RESULTING FROM COMPREHENSIVE INCOME | |
$ | 31,546,313 | |
| (1) | See
Note 2 “Summary of Significant Accounting Policies - Other Financial Assets and Financial Liabilities at Fair Value”
for further discussion relating to other comprehensive income. |
See
accompanying notes to the consolidated financial statements
Eagle
Point Income Company Inc. and Subsidiaries
Consolidated
Statements of Changes in Net Assets
(expressed
in U.S. dollars, except share amounts)
| | |
For the
year ended
December 31, 2023 | | |
For the
year ended
December 31, 2022 | |
| Net increase (decrease) in net assets resulting from operations: | |
| | | |
| | |
| Net investment income | |
$ | 17,392,665 | | |
$ | 11,590,146 | |
| Net realized gain (loss) on investments | |
| (12,614 | ) | |
| 38,548 | |
| Net change in unrealized appreciation (depreciation) on investments | |
| 13,153,774 | | |
| (31,296,039 | ) |
| Net change in
unrealized (appreciation) depreciation on liabilities at fair value under the fair value option | |
| (1,246,996 | ) | |
| 3,721,302 | |
| Total net increase (decrease) in net assets resulting from operations | |
| 29,286,829 | | |
| (15,946,043 | ) |
| | |
| | | |
| | |
| Other comprehensive income (loss): | |
| | | |
| | |
| Net change in
unrealized (appreciation) depreciation on liabilities at fair value under the fair value option | |
| 2,259,484 | | |
| (1,038,890 | ) |
| Total other comprehensive income (loss) | |
| 2,259,484 | | |
| (1,038,890 | ) |
| | |
| | | |
| | |
| Common stock distributions: | |
| | | |
| | |
| Common stock distributions from net investment income | |
| (18,077,406 | ) | |
| (10,788,143 | ) |
| Common stock distributions from tax return of capital | |
| — | | |
| — | |
| Total common stock distributions | |
| (18,077,406 | ) | |
| (10,788,143 | ) |
| | |
| | | |
| | |
| Capital share transactions: | |
| | | |
| | |
| Issuance of shares of common stock
pursuant to the Company’s “at the market” program and the Committed Equity Financing (Note 5), net of commissions and
offering expenses | |
| 42,319,019 | | |
| 14,243,028 | |
| Issuance of shares of common stock pursuant to the Company’s dividend reinvestment plan | |
| 475,654 | | |
| 124,721 | |
| Total capital share transactions | |
| 42,794,673 | | |
| 14,367,749 | |
| | |
| | | |
| | |
| Total increase (decrease) in net assets | |
| 56,263,580 | | |
| (13,405,327 | ) |
| Net assets at beginning of period | |
| 101,943,840 | | |
| 115,349,167 | |
| Net assets at end of period | |
$ | 158,207,420 | | |
$ | 101,943,840 | |
| | |
| | | |
| | |
| Capital share activity: | |
| | | |
| | |
| Shares of common stock issued
pursuant to the Company’s “at the market” program and the Committed Equity Financing | |
| 3,065,862 | | |
| 1,006,487 | |
| Shares of common stock issued pursuant to the Company’s dividend reinvestment plan | |
| 34,779 | | |
| 8,306 | |
| Total increase (decrease) in capital share activity | |
| 3,100,641 | | |
| 1,014,793 | |
See
accompanying notes to the consolidated financial statements
Eagle
Point Income Company Inc. and Subsidiaries
Consolidated
Statement of Cash Flows
For
the year ended December 31, 2023
(expressed
in U.S. dollars)
| CASH FLOWS FROM OPERATING ACTIVITIES | |
| |
| Net increase (decrease) in net assets resulting from operations | |
$ | 29,286,829 | |
| | |
| | |
| Adjustments to reconcile net
increase (decrease) in net assets resulting from operations to net cash provided by (used in) operating activities: | |
| | |
| Purchases of investments | |
| (83,535,538 | ) |
| Proceeds from sales of investments and repayments of principal ⁽¹⁾ | |
| 5,590,430 | |
| Net realized (gain) loss on investments | |
| 12,614 | |
| Net change in unrealized (appreciation) depreciation on investments | |
| (13,153,774 | ) |
| Net change in unrealized appreciation (depreciation) on liabilities at fair value under the fair value option | |
| 1,246,996 | |
| Amortization (accretion) included in interest expense | |
| (10,858 | ) |
| Amortization (accretion) of premiums or discounts on debt securities | |
| (422,249 | ) |
| Amortization of deferred financing costs | |
| 21,730 | |
| Changes in assets and liabilities: | |
| | |
| Interest receivable | |
| (2,330,747 | ) |
| Prepaid expenses | |
| (190,197 | ) |
| Excise tax refund receivable | |
| (55,413 | ) |
| Management fees payable | |
| 249,904 | |
| Professional fees payable | |
| (131,163 | ) |
| Administration fees payable | |
| (10,311 | ) |
| Interest expense payable | |
| 417 | |
| Tax expense payable | |
| (34,164 | ) |
| Due to affiliates | |
| 28,072 | |
| Other expenses payable | |
| 6,250 | |
| Net cash provided by (used in) operating activities | |
| (63,431,172 | ) |
| | |
| | |
| CASH FLOWS FROM FINANCING ACTIVITIES | |
| | |
| Borrowings under credit facility | |
| 32,745,000 | |
| Repayments under credit facility | |
| (27,255,000 | ) |
| Payment for deferred financing costs | |
| (50,000 | ) |
| Common stock distributions paid to stockholders | |
| (18,077,406 | ) |
| Proceeds from issuance of shares of common stock pursuant to the Company’s “at the market” program, net of commissions and offering expenses, and the Committed Equity Financing (Note 5) | |
| 42,319,019 | |
| Proceeds from issuance of shares of common stock pursuant to the Company’s dividend reinvestment plan | |
| 341,578 | |
| Proceeds from issuance of 7.75% Series B Term Preferred Stock due 2028 | |
| 32,501,875 | |
| Proceeds from
issuance of shares of 7.75% Series B Term Preferred Stock due 2028 pursuant to the Company’s “at the
market” program | |
| 1,813,107 | |
| Net cash provided by (used in) financing activities | |
| 64,338,173 | |
| | |
| | |
| NET INCREASE (DECREASE) IN CASH | |
| 907,001 | |
| | |
| | |
| CASH AND CASH EQUIVALENTS, BEGINNING OF PERIOD | |
| 37,059 | |
| | |
| | |
| CASH AND CASH EQUIVALENTS, END OF PERIOD | |
$ | 944,060 | |
| | |
| | |
| Supplemental disclosures: | |
| | |
| Cash paid for interest expense | |
$ | 2,997,537 | |
| Cash paid for excise taxes | |
$ | 244,914 | |
| Cash paid for interest expense on credit facility | |
$ | 262,183 | |
| Cash paid for franchise taxes | |
$ | 68,530 | |
| ⁽¹⁾ | Proceeds
from sales or maturity of investments includes $4,401,367 of return of capital on CLO
Equity investments from recurring cash flows. |
See
accompanying notes to the consolidated financial statements
Eagle
Point Income Company Inc. and Subsidiaries
Notes
to Consolidated Financial Statements
December
31, 2023
Eagle
Point Income Company Inc. (the “Company”) is an externally managed, diversified closed-end management investment company
registered under the Investment Company Act of 1940, as amended (the “1940 Act”). The Company’s primary investment
objective is to generate high current income, with a secondary objective to generate capital appreciation. The Company seeks to
achieve its investment objectives by investing primarily in junior debt tranches of collateralized loan obligations, or “CLOs,”
that are collateralized by a portfolio consisting primarily of below investment grade U.S. senior secured loans with a large number
of distinct underlying borrowers across various industry sectors. The Company focuses on CLO debt tranches rated “BB”
(e.g., BB+, BB or BB-, or their equivalent) by Moody’s Investors Service, Inc., or “Moody’s,” Standard & Poor’s, or “S&P,” or Fitch Ratings, Inc., or “Fitch,” and/or other applicable nationally
recognized statistical rating organizations. The Company may invest up to 35% of its total assets (at the time of investment)
in unrated CLO equity securities and related securities and instruments. The Company may also invest in other junior debt tranches
of CLOs, senior debt tranches of CLOs, loan accumulation facilities (“LAF”) and other related securities and instruments.
The
Company was initially formed on September 28, 2018 and commenced operations on October 4, 2018. On July 23, 2019, the Company
priced its initial public offering (the “IPO”) and on July 24, 2019, the Company’s shares began trading on the
New York Stock Exchange (“NYSE”) under the symbol “EIC”.
The
Company intends to operate so as to qualify to be taxed as a regulated investment company (“RIC”) under subchapter
M of the Internal Revenue Code of 1986, as amended (the “Code”), for federal income tax purposes.
Eagle
Point Income Management LLC (the “Adviser”) is the investment adviser of the Company and manages the investments of
the Company subject to the supervision of the Company’s Board of Directors (the “Board”). The Adviser is registered
as an investment adviser with the U.S. Securities and Exchange Commission (the “SEC”) under the Investment Advisers
Act of 1940, as amended. Eagle Point Administration LLC, an affiliate of the Adviser, is the administrator of the Company (the
“Administrator”).
The
consolidated financial statements include the accounts of the Company and its wholly-owned subsidiaries- Eagle Point Income Company
Sub II (Cayman) Ltd. (the “Cayman Subsidiary”), a Cayman Islands exempted company, and Eagle Point Income Company
Sub (US) LLC (the “US Subsidiary), a Delaware limited liability company (together the “Subsidiaries”). All intercompany
accounts have been eliminated upon consolidation. As of December 31, 2023, the US Subsidiary and the Cayman Subsidiary represented
0.2% and 0.0% of the Company’s net assets, respectively.
| 2. | SUMMARY
OF SIGNIFICANT ACCOUNTING POLICIES |
Basis
of Accounting
The
consolidated financial statements have been prepared in conformity with U.S. generally accepted accounting principles (“U.S.
GAAP”). The Company is an investment company and follows the accounting and reporting guidance applicable to investment
companies in the Financial Accounting Standards Board (“FASB”) Accounting Standards Codification (“ASC”)
Topic 946 Financial Services – Investment Companies. Items included in the consolidated financial statements are measured
and presented in United States dollars.
Use
of Estimates
The
preparation of financial statements in conformity with U.S. GAAP requires management to make estimates and assumptions which affect
the reported amounts included in the consolidated financial statements and accompanying notes as of the reporting date. Actual
results may differ from those estimates.
Valuation
of Investments
The
most significant estimate inherent in the preparation of the consolidated financial statements is the valuation of investments.
The
Company accounts for its investments in accordance with U.S. GAAP, and fair values its investment portfolio in
Eagle
Point Income Company Inc. and Subsidiaries
Notes
to Consolidated Financial Statements
December
31, 2023
accordance with
the provisions of the FASB ASC Topic 820, Fair Value Measurements and Disclosures, which defines fair value, establishes
a framework for measuring fair value and requires enhanced disclosures about fair value measurements. Investments are reflected
in the consolidated financial statements at fair value. Fair value is the estimated amount that would be received to sell an asset,
or paid to transfer a liability, in an orderly transaction between market participants at the measurement date (i.e., the exit
price).
Pursuant
to Rule 2a-5 under the 1940 Act adopted by the SEC in December 2020 (“Rule 2a-5”), the Board has elected to designate
the Adviser as “valuation designee” to perform fair value determinations, subject to Board oversight and certain other
conditions. In the absence of readily available market quotations, as defined by Rule 2a-5, the Adviser determines the fair value
of the Company’s investments in accordance with its written valuation policy approved by the Board. There is no single method
for determining fair value in good faith. As a result, determining fair value requires judgment be applied to the specific facts
and circumstances of each portfolio investment while employing a consistently applied valuation process for the types of investments
held by the Company. Due to the uncertainty of valuation, this estimate may differ significantly from the value that would have
been used had a ready market for the investments existed, and the differences could be material.
The
Company determines fair value based on assumptions that market participants would use in pricing an asset or liability in an orderly
transaction at the measurement date. When considering market participant assumptions in fair value measurements, the following
fair value hierarchy prioritizes and ranks the level of market price observability used in measuring investments:
| ● | Level
I – Unadjusted quoted prices in active markets for identical assets or liabilities
that the Company is able to access as of the reporting date. |
| ● | Level
II – Inputs, other than quoted prices included in Level I, that are observable
either directly or indirectly as of the reporting date. These inputs may include (a)
quoted prices for similar assets in active markets, (b) quoted prices for identical or
similar assets in markets that are not active, (c) inputs other than quoted prices that
are observable for the asset, or (d) inputs derived principally from or corroborated
by observable market data by correlation or other means. |
| ● | Level
III – Pricing inputs are unobservable for the investment and little, if any,
active market exists as of the reporting date. Fair value inputs require significant
judgment or estimation from the Adviser. |
In
certain cases, inputs used to measure fair value may fall into different levels of the fair value hierarchy. In such cases, the
determination of which category within the fair value hierarchy is appropriate for any given investment is based on the lowest
level of input significant to that fair value measurement. The assessment of the significance of a particular input to the fair
value measurement in its entirety requires judgment and consideration of factors specific to the investment.
Market
price observability is impacted by a number of factors, including the type of investment, the characteristics specific to the
investment and the state of the marketplace (including the existence and transparency of transactions between market participants).
Investments with readily available actively quoted prices, or for which fair value can be measured from actively quoted prices
in an orderly market, will generally have a higher degree of market price observability and a lesser degree of judgment used in
measuring fair value.
Investments
for which observable, quoted prices in active markets do not exist are reported at fair value based on Level III inputs. The amount
determined to be fair value may incorporate the Adviser’s own assumptions (including assumptions the Adviser believes market
participants would use in valuing investments and assumptions relating to appropriate risk adjustments for nonperformance and
lack of marketability), as provided for in the Adviser’s valuation policy.
An
estimate of fair value is made for each investment at least monthly taking into account information available as of the reporting
date and is subject to review by the Board on a quarterly basis.
See
Note 3 “Investments” for further discussion relating to the Company’s investments.
Eagle
Point Income Company Inc. and Subsidiaries
Notes
to Consolidated Financial Statements
December
31, 2023
Other
Financial Assets and Financial Liabilities at Fair Value
The
Fair Value Option (“FVO”) under FASB ASC Subtopic 825-10, Fair Value Option (“ASC 825”), allows
companies to make an irrevocable election to use fair value as the initial and subsequent accounting measurement for certain financial
assets and liabilities. The decision to elect the FVO is determined on an instrument-by-instrument basis and must be applied to
an entire instrument. Assets and liabilities measured at fair value are required to be reported separately from those instruments
measured using another accounting method and changes in fair value attributable to instrument-specific credit risk on financial
liabilities for which the FVO is elected are required to be presented separately in other comprehensive income. Additionally,
upfront offering costs related to such instruments, inclusive of costs associated with issuances under the Company’s at-the-market
(“ATM”) program, are recognized in earnings as incurred and are not deferred.
The
Company elected to account for its 5.00% Series A Term Preferred Stock due 2026 (the “Series A Term Preferred Stock”)
and its 7.75% Series B Term Preferred Stock due 2028 (“Series B Term Preferred Stock”, and collectively with the Series
A Term Preferred Stock, the “Preferred Stock”) utilizing the FVO under ASC 825. The primary reason for electing the
FVO is to reflect economic events in the same period in which they are incurred and address simplification of reporting and presentation.
Investment
Income Recognition
Interest
income from investments in CLO debt and collateralized fund obligation (“CFO”) debt is recorded using the accrual
basis of accounting to the extent such amounts are expected to be collected. Interest income on such investments is generally
expected to be received in cash. The Company applies the provisions of Accounting Standards Update No. 2017-08, Premium Amortization
on Purchased Callable Debt Securities (“ASU 2017-08”), in calculating amortization of premium for applicable investments.
Amortization of premium or accretion of discount is recognized using the effective interest method.
In
certain circumstances, all or a portion of interest income from a given investment may be paid in the form of additional investment
principal, often referred to as payment-in-kind (“PIK”) interest. PIK interest is included in interest income and
interest receivable through the payment date. The PIK interest rate represents the coupon rate at payment date when PIK interest
is received. On the payment date, all or a portion of interest receivable is capitalized as additional principal in the investment.
To the extent the Company does not believe it will ultimately be able to collect PIK interest, the investment will be placed on
non-accrual status, and previously recorded PIK interest income will be reversed.
CLO
equity investments, fee rebates and CFO equity investments recognize investment income for U.S. GAAP purposes on the accrual basis
utilizing an effective interest methodology based upon an effective yield to maturity utilizing projected cash flows. ASC Topic
325-40, Beneficial Interests in Securitized Financial Assets, requires investment income from such investments to be recognized
under the effective interest method, with any difference between cash distributed and the amount calculated pursuant to the effective
interest method being recorded as an adjustment to the cost basis of the investment. It is the Adviser’s policy to update
the effective yield for each CLO equity and fee rebate position held within the Company’s portfolio at the initiation of
each investment and each subsequent quarter thereafter. It is the Adviser’s policy to review the effective yield for each
CFO equity position at each measurement date and update periodically based on the facts and circumstances known to the Adviser.
Other
Income
Other
income includes the Company’s share of income under the terms of fee rebate agreements and commitment fee income.
Interest
Expense
Interest
expense includes the Company’s distributions associated with its Series A Term Preferred Stock, Series B Term Preferred
Stock and amounts due under the credit facility agreement in relation to the outstanding borrowings and unused commitment fees.
Interest
expense also includes the Company’s amortization of original issue premiums and discounts associated with its Preferred
Stock.
Eagle
Point Income Company Inc. and Subsidiaries
Notes
to Consolidated Financial Statements
December
31, 2023
The
following table summarizes the components of interest expense for the year ended December 31, 2023:
| | |
Series A Term
Preferred Stock | | |
Series B Term
Preferred Stock | | |
Revolving Credit
Facility | | |
Total | |
| Distributions declared and paid | |
$ | 1,902,067 | | |
$ | 1,095,470 | | |
$ | - | | |
$ | 2,997,537 | |
| Interest expense on credit facility | |
| - | | |
| - | | |
| 262,600 | | |
| 262,600 | |
| Amortization of issuance premium | |
| (10,290 | ) | |
| (568 | ) | |
| - | | |
| (10,858 | ) |
| | |
$ | 1,891,777 | | |
$ | 1,094,902 | | |
$ | 262,600 | | |
$ | 3,249,279 | |
Interest
expense is recorded as an expense on the Consolidated Statement of Operations. The Company’s Preferred Stock has no interest
payable as of December 31, 2023.
Please
refer to Note 6 “Mandatory Redeemable Preferred Stock” and Note 9 “Revolving Credit Facility” for further
discussion relating to the Preferred Stock issuances and on the interest expense due under the credit facility agreement, respectively.
Original
Issue Discounts and Premiums
Original
issue discounts and premiums on liabilities consist of discounts or premiums recorded in connection with the issuance of the Preferred
Stock as part of the Company’s ATM program, consistent with FASB ASC Topic 835-30-35-2. The original issue discounts and
premiums are capitalized at the time of issuance and amortized using the effective interest method over the respective terms of
each of the Preferred Stock. Amortization and accretion of original issue discounts and premiums are reflected as an expense and
a contra expense within interest expense in the Consolidated Statement of Operations, respectively.
Securities
Transactions
The
Company records the purchase and sale of securities on the trade date. Realized gains and losses on investments sold are recorded
on the basis of the specific identification method.
In
certain circumstances where the Adviser determines it is unlikely to fully amortize a CLO equity or CLO debt investment’s
remaining amortized cost, such remaining cost is written-down to its current fair value and recognized as a realized loss in the
Consolidated Statement of Operations.
Cash
and Cash Equivalents
The
Company has defined cash and cash equivalents as cash and short-term, highly liquid investments with original maturities of three
months or less from the date of purchase. The Company maintains its cash in bank accounts which, at times, may exceed federal
insured limits. The Adviser monitors the performance of the financial institution where the accounts are held in order to manage
any risk associated with such accounts.
Expense
Recognition
Expenses
are recorded on the accrual basis of accounting.
Prepaid
Expenses
Prepaid
expenses consist primarily of insurance premiums, shelf registration expenses, ATM program expenses and the Committed Equity Financing
(as defined in Note 5 “Common Stock”) expenses. Prepaid shelf registration expenses, ATM program expenses and Committed
Equity Financing expenses represent fees and expenses incurred in connection with the initial registration of the Company’s
current shelf registration, ATM program and the Committed Equity Financing. Such costs are allocated pro-rata based on the amount
issued relative to the total respective offering amount to paid-in-capital or expense depending on the security being issued pursuant
to the shelf registration, ATM program and the Committed Equity Financing. Any subsequent costs incurred to maintain the Company’s
ATM program and the Committed Equity Financing are expensed as incurred.
Any
unallocated prepaid expense balance associated with the shelf registration, ATM program and the Committed Equity Financing are
accelerated into expense at the earlier of the end of the program period or at the effective date
Eagle
Point Income Company Inc. and Subsidiaries
Notes
to Consolidated Financial Statements
December
31, 2023
of a new shelf registration
or ATM program.
Deferred
Financing Costs
Deferred
financing costs consist of fees and expenses incurred in connection with the Revolving Credit Facility (refer to Note 9 “Revolving
Credit Facility”). Deferred financing costs are capitalized and amortized over the term of the Revolving Credit Facility,
and are reflected in borrowings under the credit facility on the Consolidated Statement of Asset and Liabilities (if any). Amortization
of deferred financing costs are recorded as an expense on the Consolidated Statement of Operations on a straight-line basis, which
approximates the effective interest method.
Offering
Expenses
Offering
expenses associated with the issuance and sale of shares of common stock, inclusive of expenses incurred associated with offerings
under the ATM program, are charged to paid-in capital at the time the shares are sold in accordance with guidance noted in FASB
ASC Topic 946-20-25-5, Investment Companies – Investment Company Activities – Recognition, during the period
incurred.
Federal
and Other Taxes
The
Company intends to continue to operate so as to qualify to be taxed as a RIC under subchapter M of the Code and, as such, to not
be subject to federal income tax on the portion of its taxable income and gains distributed to stockholders. To qualify for RIC
tax treatment, among other requirements, the Company is required to distribute at least 90% of its investment company taxable
income, as defined by the Code. Accordingly, the Company intends to distribute its taxable income and net realized gains, if any,
to stockholders in accordance with timing requirements imposed by the Code. Therefore, no federal income tax provision is required.
The Company’s tax year end is December 31. The Company intends to file federal income and excise tax returns as well as
any applicable state tax filings. The statute of limitations on the Company’s tax return filings generally remains open
for three years. The Company has analyzed its tax positions for its tax year ended December 31, 2023, including open tax years,
and does not believe there are any uncertain tax positions requiring recognition in the Company’s consolidated financial
statements.
Because
U.S. federal income tax regulations differ from U.S. GAAP, distributions in accordance with tax regulations may differ from net
investment income and realized capital gains recognized for financial reporting purposes. Differences may be permanent or temporary.
Permanent differences are reclassified among capital accounts in the consolidated financial statements to reflect their tax character.
Temporary differences arise when certain items of income, expense, gain or loss are recognized at some time in the future. Differences
in classification may also result from the treatment of short-term capital gains as ordinary income for federal income tax purposes.
The tax basis components of distributable earnings differ from the amounts reflected in the Statement of Assets and Liabilities
due to temporary book/tax differences arising primarily from partnerships and passive foreign investment company investments.
For
the year ended December 31, 2023, $2,542,562 was reclassified between aggregate distributable earnings(losses) and paid-in capital.
This amount represents $1,375,980 nondeductible offering expenses related to the Series B Term Preferred Stock, $144,587 nondeductible
U.S. federal excise taxes incurred in relation to the 2023 and 2022 excise tax years, and $1,021,995 of adjustments
related to return of capital. This difference has no effect on net assets or net asset value per share.
For
the tax year ended December 31, 2023, the estimated components of distributable earnings, on a tax basis, were as follows:
Eagle
Point Income Company Inc. and Subsidiaries
Notes
to Consolidated Financial Statements
December
31, 2023
| | |
For
the tax year ended December 31, 2023 | |
| | |
| | |
| Undistributed
ordinary income | |
$ | 5,699,348 | |
| | |
| | |
| Capital
loss carryforward | |
| 14,223,033 | |
| | |
| | |
| Net
unrealized depreciation | |
| (27,217,255 | ) |
As of the tax period ended December 31, 2023, the Company has $4,486,098 of short-term capital losses and
$9,736,935 of long-term capital loses which can be carried forward for an unlimited period.
The
following table summarizes the tax character of distributions to common and preferred shareholders for the respective tax years.
Tax information for the tax year ended December 31, 2023 is estimated and is not considered final until the Company files its
tax return, amounts in millions.
| Tax
Year | |
Ordinary
Dividend | |
Return
of Capital |
| 2023 | |
$ | 21,074,943 | |
$ | - |
| 2022 | |
| 12,677,539 | |
| - |
| 2021 | |
| 8,744,744 | |
| - |
| 2020 | |
| 7,997,030 | |
| 1,106,093 |
As
of December 31, 2023, the Company’s tax cost for federal income tax purposes was $262,134,547. Accordingly, accumulated
net unrealized depreciation on investments held by the Company was $27,217,255, consisting of $1,797,281 gross unrealized appreciation
and $29,014,536 gross unrealized depreciation.
Depending
on the level of taxable income earned in a tax year, the Company is permitted to carry forward taxable income (including net capital
gains, if any) in excess of its current year distributions from the current tax year into the next tax year and pay a nondeductible
4% U.S. federal excise tax on such taxable income, as required.
The
Company has determined that its estimated current year annual taxable income will be in excess of current year distributions from
such income, as a result the Company has accrued a U.S. federal excise tax for the year ended December 31, 2023 of $200,000, which
was offset by an adjustment of $55,413 related to the U.S. federal excise tax for the year ended December 31, 2022, both of which
are reported on the Statement of Operations.
For
the year ended December 31, 2023, the Company incurred $79,280 in Delaware franchise tax expense related to the 2023 tax year
end, which is reported on the Statement of Operations.
The
Company’s subsidiary, Eagle Point Income Company Sub (US) LLC has elected to be treated as a corporation for U.S. tax purposes
and may be subject to federal, state and local tax where it operates or is deemed to operate. The subsidiary has no significant
tax liability as of December 31, 2023.
Distributions
The
composition of distributions paid to common stockholders from net investment income and capital gains are determined in accordance
with U.S. federal income tax regulations, which differ from U.S. GAAP. Distributions to common stockholders and can be comprised
of net investment income, net realized capital gains and return of capital for U.S. federal income tax purposes and are intended
to be paid monthly. Distributions payable to common stockholders are recorded as a liability on ex-dividend date. Unless a common
stockholder opts out of the Company’s dividend reinvestment plan (the “DRIP”), distributions are automatically
reinvested in full shares of the Company as of the payment date, pursuant to the DRIP. The Company’s common stockholders
who opt-out of participation in the
Eagle
Point Income Company Inc. and Subsidiaries
Notes
to Consolidated Financial Statements
December
31, 2023
DRIP (including those common stockholders whose shares are held through a broker who has opted
out of participation in the DRIP) generally will receive all distributions in cash.
In
addition to the regular monthly distributions, and subject to available taxable earnings of the Company, the Company may make
periodic special and/or supplemental distributions representing the excess of the Company’s net taxable income over the
Company’s aggregate monthly distributions paid during the year.
The
characterization of distributions paid to common stockholders, as set forth in the Consolidated Financial Highlights, reflect
estimates made by the Company for federal income tax purposes. Such estimates are subject to change once the final determination
of the source of all distributions has been made and the final tax return has been filed by the Company.
For
the year ended December 31, 2023, the Company declared and paid monthly distributions on common stock of approximately $18.1 million
or $1.98 per share.
For
the year ended December 31, 2023, the Company declared and paid dividends on the Series A Term Preferred Stock of approximately
$1.9 million or approximately $1.25 per share of Series A Term Preferred Stock.
For
the year ended December 31, 2023, the Company declared and paid dividends on the Series B Term Preferred Stock of approximately
$1.1 million or approximately $0.83 per share of Series B Term Preferred Stock.
Fair
Value Measurement
The
following table summarizes the valuation of the Company’s investments measured and reported at fair value under the fair
value hierarchy levels described in Note 2 “Summary of Significant Accounting Policies” as of December 31, 2023:
| Fair
Value Measurement (in millions) | |
| | |
| | |
| | |
| |
| | |
Level
I | | |
Level
II | | |
Level
III | | |
Total | |
| Assets
at Fair Value | |
| | | |
| | | |
| | | |
| | |
| Investments
at Fair Value | |
| | | |
| | | |
| | | |
| | |
| CLO
Debt | |
$ | - | | |
$ | 171.09 | | |
$ | - | | |
$ | 171.09 | |
| CLO
Equity | |
| - | | |
| - | | |
| 63.33 | | |
| 63.33 | |
| CFO
Debt | |
| - | | |
| - | | |
| 0.27 | | |
| 0.27 | |
| CFO
Equity | |
| - | | |
| - | | |
| 0.22 | | |
| 0.22 | |
| Total
Investentments at Fair Value (1) | |
$ | - | | |
$ | 171.09 | | |
$ | 63.82 | | |
$ | 234.92 | |
| Total
Assets at Fair Value (1) | |
$ | - | | |
$ | 171.09 | | |
$ | 63.82 | | |
$ | 234.92 | |
| | |
| | | |
| | | |
| | | |
| | |
| Liabilities
at Fair Value Under FVO | |
| | | |
| | | |
| | | |
| | |
| Series
A Term Preferred Stock | |
$ | 35.24 | | |
$ | - | | |
$ | - | | |
$ | 35.24 | |
| Series
B Term Preferred Stock | |
$ | 34.24 | | |
| - | | |
| - | | |
| 34.24 | |
| Total
Liabilities at Fair Value Under FVO (1) | |
$ | 69.48 | | |
$ | - | | |
$ | - | | |
$ | 69.48 | |
(1)
Amounts may not foot due to rounding.
Significant
Unobservable Inputs
The
following table summarizes the quantitative inputs and assumptions used for investments categorized as Level III of the fair value
hierarchy as of December 31, 2023.
Eagle
Point Income Company Inc. and Subsidiaries
Notes
to Consolidated Financial Statements
December
31, 2023
| |
|
Quantitative
Information about Level III Fair Value Measurements |
| Assets |
|
Fair
Value as of
December
31, 2023 |
|
Valuation
Techniques/Methodologies |
|
Unobservable
Inputs |
|
Range
/ Weighted Average(1) |
| CLO Equity |
|
$ |
63.33 |
|
Discounted
Cash Flows |
|
Annual Default Rate (²) |
|
0.00%
- 4.64% |
| |
|
|
|
|
|
Annual Prepayment Rate (²)
(³) |
|
15%
- 25% |
| |
|
|
|
|
|
Reinvestment Spread |
|
3.63%
- 3.99% / 3.78% |
| |
|
|
|
|
|
Reinvestment Price (²) |
|
98.00%
- 99.50% |
| |
|
|
|
|
|
Recovery Rate |
|
68.60%
- 69.95% / 69.55% |
| |
|
|
|
|
|
Expected Yield |
|
17.65%
- 98.52% / 29.48% |
| CFO Debt |
|
0.27 |
|
Discounted
Cash Flows |
|
Discount Rate |
|
11.38%
- 14.66% / 12.41% |
| CFO Equity |
|
0.22 |
|
Discounted
Cash Flows |
|
Discount Rate |
|
42.50% |
| Total Fair Value of Level III
Investments(⁵) |
|
$ |
63.82 |
|
|
|
|
|
|
(1) Weighted average calculations are based on the fair value of investments.
(2) A weighted average is not presented as the input in the discounted cash flow model varies over the life of an investment.
(3) 0% is assumed for defaulted and non-performing assets.
(4) Range not shown as only one position is included in the category.
(5) Amounts may not foot due to rounding.
In
addition to the techniques and inputs noted in the above table, the Adviser may use other valuation techniques and methodologies
when determining the fair value measurements of the Company’s investments, as provided for in the Adviser’s valuation
policy approved by the Board. Please refer to Note 2 “Summary of Significant Accounting Policies” for further discussion.
The above table is not intended to be all-inclusive, but rather provides information on the significant Level III inputs as they
relate to the Company’s fair value measurements as of December 31, 2023. Unobservable inputs and assumptions are reviewed
at each measurement date and updated as necessary to reflect current market conditions.
Increases
(decreases) in the annual default rate, reinvestment price, expected yield and discount rate in isolation would result in a lower
(higher) fair value measurement. Increases (decreases) in the reinvestment spread and recovery rate in isolation would result
in a higher (lower) fair value measurement. Changes in the annual prepayment rate may result in a higher (lower) fair value, depending
on the circumstances. Generally, a change in the assumption used for the annual default rate may be accompanied by a directionally
opposite change in the assumption used for the annual prepayment rate and recovery rate.
Change
in Investments Classified as Level III
The
changes in investments classified as Level III are as follows for the year ended December 31, 2023:
| Change
in Investments Classified as Level III (in millions) | |
| | |
| | |
| | |
| |
| | |
CLO
Equity | | |
CFO
Debt | | |
CFO
Equity | | |
Total | |
| Balance
as of January 1, 2023 | |
$ | 41.11 | | |
$ | - | | |
$ | - | | |
$ | 41.11 | |
| Purchases
of investments | |
| 23.99 | | |
| 0.27 | | |
| 0.19 | | |
| 24.45 | |
| Proceeds
from sales or maturity of investments (1) | |
| (4.40 | ) | |
| - | | |
| - | | |
| (4.40 | ) |
| Net
realized gains (losses) and net change in unrealized appreciation (depreciation) | |
| 2.63 | | |
| 0.00 | | |
| 0.03 | | |
| 2.66 | |
| Balance
as of December 31, 2023 (2) (3) | |
$ | 63.33 | | |
$ | 0.27 | | |
$ | 0.22 | | |
$ | 63.82 | |
Change
in unrealized appreciation (depreciation) on investments still held as of
December 31, 2023 | |
$ | 2.63 | | |
$ | 0.00 | | |
$ | 0.03 | | |
$ | 2.66 | |
(1) Proceeds from sales or maturity of investments represent the return of capital on portfolio investments from recurring cash flows.
(2) There were no transfers in or out of Level III during the period.
(3) Amounts may not foot due to rounding.
The
net realized gains (losses) recorded for Level III investments, if any, are reported in the net realized gain (loss) on investments
balance in the Consolidated Statement of Operations. Net changes in unrealized appreciation (depreciation) are reported in the
net change in unrealized appreciation (depreciation) on investments balance in the Consolidated Statement of Operations.
Eagle
Point Income Company Inc. and Subsidiaries
Notes
to Consolidated Financial Statements
December
31, 2023
Fair
Value – Valuation Techniques and Inputs
The
Adviser establishes valuation processes and procedures to ensure the valuation techniques are fair and consistent, and valuation
inputs are supportable. The Adviser has a Valuation Committee comprised of various senior personnel of the Adviser, the majority
of which are not members of the Company’s portfolio management function. The Valuation Committee is responsible for overseeing
the valuation process, evaluating the overall fairness and consistent application of the Adviser’s written valuation policies
approved by the Board. The Valuation Committee reviews and approves the valuation on a monthly basis.
Valuation
of CLO Debt
The
Company’s investments in CLO debt have been valued using an independent pricing service. The valuation methodology of the
independent pricing service includes incorporating data comprised of observable market transactions, executable bids, broker quotes
from dealers with two sided markets, as well as transaction activity from comparable securities to those being valued. As the
independent pricing service contemplates real time market data and no unobservable inputs or significant judgment has been used
by the Adviser in the valuation of the Company’s investment in CLO debt, such positions are considered Level II assets.
Valuation
of CLO Equity
The
Adviser utilizes the output of a financial model to estimate the fair value of CLO equity investments. The model contains detailed
information on the characteristics of each CLO, including recent information about assets and liabilities from data sources such
as trustee reports, and is used to project future cash flows to the CLO note tranches, as well as management fees. Key inputs
to the model, including, but not limited to assumptions for future loan default rates, recovery rates, prepayment rates, reinvestment
rates and discount rates are determined by considering both observable and third-party market data and prevailing general market
assumptions and conventions as well as those of the Adviser. Additionally, a third-party independent valuation firm is used as
an input by the Adviser to determine the fair value of the Company’s investments in CLO equity. The valuation firm’s
advice is only one factor considered in the valuation of such investments, and the Adviser does not solely rely on such advice
in determining the fair value of the Company’s investments in accordance with the 1940 Act.
The
Adviser categorizes CLO equity as Level III investments. Certain pricing inputs may be unobservable. An active market may exist,
but not necessarily for CLO equity investments that the Company holds as of the reporting date.
Valuation
of CFO Debt and CFO Equity
The
Adviser engages a nationally recognized independent valuation agent to determine fair value of the CFO debt and CFO equity held
by the Company. The independent valuation agent performs a discounted cash flow analysis, or other valuation techniques appropriate
for the facts and circumstances, to determine the fair value of such investments, ultimately providing a high and low valuation
for each investment. The final valuation recorded is within the high and low band provided by the valuation agent. Given the illiquidity
of these investments and lack of observable inputs, the Adviser categorizes these investments as Level III investments.
The
Adviser may also utilize the mid-point of an indicative broker quotation, if available, to value such investments as of the reporting
date. The Adviser generally categorizes investments valued utilizing indicative broker quotations as Level II or Level III depending
on whether an active market exists as of the reporting date.
Valuation
of Preferred Stock
The
Preferred Stock is considered a Level I security and is valued at the official closing price, taken from the NYSE.
Investment
Risk Factors
The
following list is not intended to be a comprehensive list of all of the potential risks associated with the Company. The Company’s
prospectus provides a detailed discussion of the Company’s risks and considerations. The risks described in the prospectus
are not the only risks the Company faces. Additional risks and uncertainties not currently known to the Company or that are currently
deemed to be immaterial also may materially and adversely affect its business, financial condition and/or operating results.
Eagle
Point Income Company Inc. and Subsidiaries
Notes
to Consolidated Financial Statements
December
31, 2023
Risks
of Investing in CLOs and Other Structured Debt Securities
CLOs
and other structured finance securities are generally backed by a pool of credit-related assets that serve as collateral. Accordingly,
CLO and structured finance securities present risks similar to those of other types of credit investments, including default (credit),
interest rate and prepayment risks. In addition, CLOs and other structured finance securities are often governed by a complex
series of legal documents and contracts, which increases the risk of dispute over the interpretation and enforceability of such
documents relative to other types of investments.
Subordinated
Securities Risk
CLO
junior debt and equity securities that the Company may acquire are subordinated to more senior tranches of CLO debt. CLO junior
debt and equity securities are subject to increased risks of default relative to the holders of superior priority interests in
the same CLO. In addition, at the time of issuance, CLO equity securities are under-collateralized in that the face amount of
the CLO debt and CLO equity of a CLO at inception exceed its total assets. The Company will typically be in a subordinated or
first loss position with respect to realized losses on the underlying assets held by the CLOs in which the Company is invested.
High-Yield
Investment Risk
The
CLO junior debt and equity securities that the Company acquires are typically rated below investment grade or, in the case of
CLO equity securities, unrated and are therefore considered “higher-yield” or “junk” securities and are
considered speculative with respect to timely payment of interest and repayment of principal. The senior secured loans and other
credit-related assets underlying CLOs are also typically higher-yield investments. Investing in CLO junior debt and equity securities
and other high-yield investments typically involves greater credit and liquidity risk than investment grade obligations, which
may adversely impact the Company’s performance.
Leverage
Risk
The
use of leverage, whether directly or indirectly through investments such as CLO junior debt and equity securities that inherently
involve leverage, may magnify the Company’s risk of loss. CLO junior debt and equity securities are very highly leveraged
(with CLO equity securities typically being leveraged ten times), and therefore the CLO securities in which the Company invests
are subject to a higher degree of loss since the use of leverage magnifies losses.
Credit
Risk
If
(1) a CLO in which the Company invests, (2) an underlying asset of any such CLO or (3) any other type of credit investment in
the Company’s portfolio declines in price or fails to pay interest or principal when due because the issuer or debtor, as
the case may be, experiences a decline in its financial status, the Company’s income, net asset value (“NAV”)
and/or market price would be adversely impacted.
Key
Personnel Risk
The
Adviser manages our investments. Consequently, the Company’s success depends, in large part, upon the services of the Adviser
(including Eagle Point Credit Management LLC, which provides the Adviser with investment professionals and other resources under
a personnel and resources agreement) and the skill and expertise of the Adviser’s professional personnel. There can be no
assurance that the professional personnel of the Adviser (or Eagle Point Credit Management LLC) will continue to serve in their
current positions or continue to be employed by the Adviser. We can offer no assurance that their services will be available for
any length of time or that the Adviser will continue indefinitely as the Company’s investment adviser.
Conflicts
of Interest Risk
The
Company’s executive officers and directors, and the Adviser and certain of its affiliates and their officers and employees,
including the Senior Investment Team, have several conflicts of interest as a result of the other activities in which they engage.
Prepayment
Risk
The
assets underlying the CLO securities in which the Company invests are subject to prepayment by the underlying corporate borrowers.
As such, the CLO securities and related investments in which the Company invests are subject to prepayment risk. If the Company
or a CLO collateral manager are unable to reinvest prepaid amounts in a new
Eagle
Point Income Company Inc. and Subsidiaries
Notes
to Consolidated Financial Statements
December
31, 2023
investment with an expected rate of return at least
equal to that of the investment repaid, the Company’s investment performance will be adversely impacted.
Liquidity
Risk
Generally,
there is no public market for the CLO investments in which the Company invests. As such, the Company may not be able to sell such
investments quickly, or at all. If the Company is able to sell such investments, the prices the Company receives may not reflect
the Adviser’s assessment of their fair value or the amount paid for such investments by the Company.
Management
Fee Risk
The
Company’s management fee structure may incentivize the Adviser to use leverage in a manner that adversely impacts the Company’s
performance.
Fair
Valuation of the Company’s Portfolio Investments
Generally,
there is no public market for the CLO investments and certain other credit assets in which the Company may invest. The Adviser
values these securities at least quarterly, or more frequently as may be required from time to time, at fair value. The Adviser’s
determinations of the fair value of the Company’s investments have a material impact on the Company’s net earnings
through the recording of unrealized appreciation or depreciation of investments and may cause the Company’s NAV on a given
date to understate or overstate, possibly materially, the value that the Company ultimately realizes on one or more of the Company’s
investments.
Limited
Investment Opportunities Risk
The
market for CLO securities is more limited than the market for other credit related investments. The Company can offer no assurances
that sufficient investment opportunities for the Company’s capital will be available. In recent years there has been a marked
increase in the number of, and flow of capital into, investment vehicles established to pursue investments in CLO securities whereas
the size of this market is relatively limited. While the Company cannot determine the precise effect of such competition, such
increase may result in greater competition for investment opportunities, which may result in an increase in the price of such
investments relative to the risk taken on by holders of such investments. Such competition may also result under certain circumstances
in increased price volatility or decreased liquidity with respect to certain positions.
Market
Risk
Political,
regulatory, economic and social developments, and developments that impact specific economic sectors, industries or segments of
the market, can affect the value of the Company’s investments. A disruption or downturn in the capital markets and the credit
markets could impair the Company’s ability to raise capital, reduce the availability of suitable investment opportunities
for the Company, or adversely and materially affect the value of the Company’s investments, any of which would negatively
affect the Company’s business. These risks may be magnified if certain events or developments adversely interrupt the global
supply chain, and could affect companies worldwide.
Loan
Accumulation Facilities Risk
The
Company may invest in LAFs, which are short to medium term facilities often provided by the bank that will serve as placement
agent or arranger on a CLO transaction and which acquire loans on an interim basis which are expected to form part of the portfolio
of a future CLO. Investments in LAFs have risks similar to those applicable to investments in CLOs. Leverage is typically utilized
in such a facility and as such the potential risk of loss will be increased for such facilities employing leverage. In the event
a planned CLO is not consummated, or the loans are not eligible for purchase by the CLO, the Company may be responsible for either
holding or disposing of the loans. This could expose the Company to credit and/or mark-to-market losses, and other risks.
Synthetic
Investments Risk
The
Company may invest in synthetic investments, such as significant risk transfer securities and credit risk transfer securities
issued by banks or other financial institutions, or acquire interests in lease agreements that have the general characteristics
of loans and are treated as loans for withholding tax purposes. In addition to the credit risks associated with the applicable
reference assets, the Company will usually have a contractual relationship only with the
Eagle
Point Income Company Inc. and Subsidiaries
Notes
to Consolidated Financial Statements
December
31, 2023
counterparty of such synthetic investment,
and not with the reference obligor of the reference asset. Accordingly, the Company generally will have no right to directly enforce
compliance by the reference obligor with the terms of the reference asset nor will it have any rights of setoff against the reference
obligor or rights with respect to the reference asset. The Company will not directly benefit from the collateral supporting the
reference asset and will not have the benefit of the remedies that would normally be available to a holder of such reference asset.
In addition, in the event of the insolvency of the counterparty, the Company may be treated as a general creditor of such counterparty,
and will not have any claim with respect to the reference asset.
Currency
Risk
Although
the Company primarily makes investments denominated in U.S. dollars, the Company may make investments denominated in other currencies.
The Company’s investments denominated in currencies other than U.S. dollars will be subject to the risk that the value of
such currency will decrease in relation to the U.S. dollar. The Company may or may not hedge currency risk.
Hedging
Risk
Hedging
transactions seeking to reduce risks may result in poorer overall performance than if the Company had not engaged in such hedging
transactions. Additionally, such transactions may not fully hedge the Company’s risks.
Reinvestment
Risk
CLOs
will typically generate cash from asset repayments and sales that may be reinvested in substitute assets, subject to compliance
with applicable investment tests. If the CLO collateral manager causes the CLO to purchase substitute assets at a lower yield
than those initially acquired or sale proceeds are maintained temporarily in cash, it would reduce the excess interest-related
cash flow, thereby having a negative effect on the fair value of the Company’s assets and the market value of the Company’s
securities. In addition, the reinvestment period for a CLO may terminate early, which would cause the holders of the CLO’s
securities to receive principal payments earlier than anticipated. There can be no assurance that the Company will be able to
reinvest such amounts in an alternative investment that provides a comparable return relative to the credit risk assumed.
Interest
Rate Risk
The
price of certain of the Company’s investments may be significantly affected by changes in interest rates, including recent
increases in interest rates. Although senior secured loans are generally floating rate instruments, the Company’s investments
in senior secured loans through investments in junior equity and debt tranches of CLOs are sensitive to interest rate levels and
volatility. For example, because CLO debt securities are floating rate securities, a reduction in interest rates would generally
result in a reduction in the coupon payment and cash flow the Company receives on the Company’s CLO debt investments. Further,
in the event of a significant rising interest rate environment and/or economic downturn, loan defaults may increase and result
in credit losses that may adversely affect the Company’s cash flow, fair value of the Company’s assets and operating
results. Because CLOs generally issue debt on a floating rate basis, an increase in the relevant benchmark index will increase
the financing costs of CLOs.
Furthermore,
certain senior secured loans that constitute the collateral of the CLOs in which the Company invests may continue to pay interest
at a floating rate based on LIBOR (or a “synthetic” calculation of LIBOR which is currently expected to continue to
be published until September 30, 2024) or may convert to a fixed rate of interest. To the extent that any LIBOR replacement rate
utilized for senior secured loans differs from that utilized for debt of a CLO that holds those loans, for the duration of such
mismatch, the CLO would experience an interest rate mismatch between its assets and liabilities, which could have an adverse impact
on the cash flows distributed to CLO equity investors (and, therefore, the Company’s net investment income and portfolio
returns) until such mismatch is corrected or minimized.
Refinancing
Risk
If
the Company incurs debt financing and subsequently refinance such debt, the replacement debt may be at a higher cost and on less
favorable terms and conditions. If the Company fails to extend, refinance or replace such debt financings prior to their maturity
on commercially reasonable terms, the Company’s liquidity will be lower than it would have been with the benefit of such
financings, which would limit the Company’s ability to grow, and holders
Eagle
Point Income Company Inc. and Subsidiaries
Notes
to Consolidated Financial Statements
December
31, 2023
of the Company’s common stock would not benefit
from the potential for increased returns on equity that incurring leverage creates.
Tax
Risk
If
the Company fails to qualify for tax treatment as a RIC under Subchapter M of the Code for any reason, or otherwise becomes subject
to corporate income tax, the resulting corporate taxes (and any related penalties) could substantially reduce the Company’s
net assets, the amount of income available for distributions to the Company’s stockholders, and the amount of income available
for payment of the Company’s other liabilities.
Counterparty
Risk
The
Company may be exposed to counterparty risk, which could make it difficult for the Company or the issuers in which the Company
invests to collect on obligations, thereby resulting in potentially significant losses.
Price
Risk
Investors
who buy shares at different times will likely pay different prices.
Global
Risks
Due
to highly interconnected global economies and financial markets, the value of the Company’s securities and its underlying
investments may go up or down in response to governmental actions and/or general economic conditions throughout the world. Events
such as war, military conflict, acts of terrorism, social unrest, natural disasters, recessions, inflation, rapid interest rate
changes, supply chain disruptions, sanctions, the spread of infectious illness or other public health threats could also significantly
impact the Company and its investments.
Banking
Risk
The
possibility of future bank failures poses risks of reduced financial market liquidity at clearing, cash management and other custodial
financial institutions. The failure of banks which hold cash on behalf of the Company, the Company’s underlying obligors,
the collateral managers of the CLOs in which the Company invests (or managers of other securitized or pooled vehicles in which
the Company invests), or the Company’s service providers could adversely affect the Company’s ability to pursue its
investment strategies and objectives. For example, if an underlying obligor has a commercial relationship with a bank that has
failed or is otherwise distressed, such company may experience delays or other disruptions in meeting its obligations and consummating
business transactions. Additionally, if a collateral manager has a commercial relationship with a distressed bank, the manager
may experience issues conducting its operations or consummating transactions on behalf of the CLOs it manages, which could negatively
affect the performance of such CLOs (and, therefore, the performance of the Company).
| 4. | RELATED
PARTY TRANSACTIONS |
Investment
Adviser
On
October 5, 2018, the Company entered into an investment advisory agreement with the Adviser (the “Advisory Agreement”).
Pursuant to the terms of the Advisory Agreement, the Company pays the Adviser, for its services, a management fee equal to an
annual rate of 1.25% of the Company’s “Managed Assets”. Managed Assets are defined as the Company’s total
assets (including assets attributable to the Company’s use of leverage) minus the sum of the Company’s accrued liabilities
(other than liabilities incurred for the purpose of creating leverage). The management fee is calculated monthly and payable quarterly
in arrears based on the Company’s Managed Assets at the end of each calendar month. For the year ended December 31, 2023,
the Company was charged a management fee of approximately $2.3 million, of which $0.7 million was payable as of December 31, 2023.
Administrator
Effective
October 5, 2018, the Company entered into an administration agreement (the “Administration Agreement”) with the Administrator,
an affiliate of the Adviser. Pursuant to the Administration Agreement, the Administrator performs, or arranges for the performance
of, the Company’s required administrative services, which include being responsible for the financial records which the
Company is required to maintain and preparing reports which are disseminated to the Company’s stockholders. In addition,
the Administrator provides the Company with accounting services, assists the Company in determining and publishing its NAV, oversees
the preparation and filing
Eagle
Point Income Company Inc. and Subsidiaries
Notes
to Consolidated Financial Statements
December
31, 2023
of the Company’s tax returns, monitors the Company’s compliance with tax laws and regulations,
and prepares and assists the Company with any audits by an independent public accounting firm of the consolidated financial statements.
The Administrator is also responsible for printing and disseminating reports to the Company’s stockholders and maintaining
the Company’s website, providing support to investor relations, generally overseeing the payment of the Company’s
expenses and the performance of administrative and professional services rendered to the Company by others, and providing such
other administrative services as the Company may from time to time designate.
Payments
under the Administration Agreement are equal to an amount based upon the Company’s allocable portion of the Administrator’s
overhead in performing its obligations under the Administration Agreement, including rent, the fees and expenses associated with
performing compliance functions and the Company’s allocable portion of the compensation of the Company’s chief compliance
officer, chief financial officer, chief operating officer and the Company’s allocable portion of the compensation of any
related support staff. The Company’s allocable portion of such compensation is based on an allocation of the time spent
on the Company relative to other matters. To the extent the Administrator outsources any of its functions, the Company pays the
fees on a direct basis, without profit to the Administrator. Certain accounting and other administrative services have been delegated
by the Administrator to SS&C Technologies, Inc. (“SS&C”). The Administration Agreement may be terminated by
the Company without penalty upon not less than sixty days’ written notice to the Administrator and by the Administrator
upon not less than ninety days’ written notice to the Company. The Administration Agreement is approved by the Board, including
by a majority of the Company’s independent directors, on an annual basis.
For
the year ended December 31, 2023, the Company was charged a total of approximately $0.56 million in administration fees consisting
of approximately $0.43 million and $0.13 million, relating to services provided by the Administrator and SS&C, respectively,
which are included in the Consolidated Statement of Operations, and of which approximately $0.13 million was payable as of December
31, 2023 and reflected on the Consolidated Statement of Assets and Liabilities.
Affiliated
Ownership
As
of December 31, 2023, the Adviser and its affiliates and senior investment team held an aggregate of 0.5% of the Company’s
common stock. Additionally, the senior investment team held an aggregate of 0.1% of the Series A Term Preferred Stock as of December
31, 2023. An affiliate of Enstar holds an indirect non-controlling ownership interest in the Adviser. As of December 31, 2023,
subsidiaries of Enstar, including Cavello Bay, held an aggregate of 34.2% of the Company’s common stock.
Exemptive
Relief
On
March 17, 2015, the SEC issued an order granting the Company exemptive relief to co-invest in certain negotiated investments with
affiliated investment funds managed by the Adviser, subject to certain conditions.
Due
to Affiliates
Due
to affiliates reported in the Consolidated Statement of Assets and Liabilities represents amounts payable to the Adviser for expenses
paid on behalf of the Company.
As
of December 31, 2022, there were 150,000,000 shares of common stock authorized, of which 7,896,757 shares were issued and outstanding.
On
December 13, 2022, the Company launched a new ATM offering to sell up to $4.0 million aggregate amount of its common stock, pursuant
to a prospectus supplement filed with the SEC on May 29, 2020 and additional supplements thereafter. On January 20, 2023, the
Company filed a prospectus supplement to update the aggregate offering price of common stock sold through the existing ATM offering
from $4.0 million to $5.75 million, exclusive of any shares of common stock previously sold through the ATM offering. On May 12,
2023, the Company filed a prospectus supplement to update the aggregate offering price of common stock sold through the existing
ATM offering from $5.75 million to $4.1 million, exclusive of any shares of common stock previously sold through the
Eagle
Point Income Company Inc. and Subsidiaries
Notes
to Consolidated Financial Statements
December
31, 2023
ATM offering.
On June 12, 2023, the Company filed a prospectus supplement to update the aggregate offering price of common stock sold through
the existing ATM offering from $4.1 million to $1.54 million, exclusive of any shares of common stock previously sold through
the ATM offering. On June 14, 2023, the Company filed a prospectus supplement to update the aggregate offering price of common
stock sold through the existing ATM offering from $1.5 million to $75.0 million, exclusive of any shares of common stock previously
sold through the ATM offering.
On
June 29, 2023, the Company filed a new shelf registration statement with 150,000,000 shares of common stock authorized. As a result
of the new shelf registration, $123,158 in remaining prepaid expense balance associated with the previous shelf registration was
expensed into professional fees in the Consolidated Statement of Operations.
On
June 30, 2023, the Company launched a new ATM offering to sell up to $75.0 million aggregate amount of its common stock, pursuant
to a prospectus filed with the SEC on June 29, 2023.
On
August 16, 2022, the Company entered into an agreement (the “Purchase Agreement”) with B. Riley Principal Capital
II, LLC (“BRPC II”) in which BRPC II has committed to purchase from the Company, at the Company’s discretion,
up to $20.0 million of the Company’s common stock, subject to terms and conditions specified in the Purchase Agreement (referred
to as the “Committed Equity Financing”). The Company filed a registration statement on December 15, 2022 in relation
to the Committed Equity Financing.
For
the year ended December 31, 2023, the Company sold 3,065,862 shares of its common stock, pursuant to the ATM offerings and Committed
Equity Financing, for total net proceeds to the Company of approximately $42.3 million. In connection with such sales, the Company
paid a total of approximately $0.7 million in sales agent commissions.
For
the year ended December 31, 2023, 34,779 shares of common stock were issued in connection with the DRIP for total net proceeds
to the Company of approximately $0.5 million.
As
of December 31, 2023, there were 150,000,000 shares of common stock authorized, of which 10,997,398 shares were issued and outstanding.
| 6. | MANDATORY
REDEEMABLE PREFERRED STOCK |
As
of December 31, 2023, there were 20,000,000 shares of preferred stock authorized, par value $0.001 per share, of which 1,521,649
shares of Series A Term Preferred Stock and 1,372,482 of Series B Term Preferred were issued and outstanding.
The
Company has accounted for its Preferred Stock as a liability under ASC 480 due to their mandatory redemption requirements.
Except
where otherwise stated in the 1940 Act or the Company’s certificate of incorporation, each holder of Preferred Stock will
be entitled to one vote for each share of preferred stock held on each matter submitted to a vote of the Company’s stockholders.
The Company’s preferred stockholders and common stockholders will vote together as a single class on all matters submitted
to the Company’s stockholders. Additionally, the Company’s preferred stockholders will have the right to elect two
Preferred Directors at all times, while the Company’s preferred stockholders and common stockholders, voting together as
a single class, will elect the remaining members of the Board.
The
Company has elected the FVO under ASC 825 for its Preferred Stock. Accordingly, the Preferred Stock is measured at fair value.
Series
A Term Preferred Stock
The
Company is required to redeem all outstanding shares of the Series A Term Preferred Stock on October 30, 2026, at a redemption
price of $25 per share (the “Series A Liquidation Preference”), plus accumulated but unpaid dividends, if any. At
any time on or after October 31, 2023, the Company may, at its sole option, redeem the
Eagle
Point Income Company Inc. and Subsidiaries
Notes
to Consolidated Financial Statements
December
31, 2023
outstanding shares of the Series A Term
Preferred Stock.
The
estimated change in fair value of the Series A Term Preferred Stock attributable to market risk for the year ended December 31,
2023 is approximately ($0.9) million, which is recorded as unrealized (appreciation) depreciation on liabilities at fair value
under the FVO on the Consolidated Statement of Operations.
The
estimated change in fair value of the Series A Term Preferred Stock attributable to instrument-specific credit risk for the year
ended December 31, 2023 is approximately $1.9 million, which is recorded as unrealized (appreciation) depreciation on liabilities
at fair value under the FVO on the Consolidated Statement of Comprehensive Income. The Company defines the change in fair value
attributable to instrument-specific credit risk as the excess of the total change in fair value over the change in fair value
attributable to changes in a base market rate, such as a United States treasury bond index with a similar maturity to the instrument
being valued.
On
June 30, 2023, the Company launched a new ATM offering to sell up to 1,000,000 shares of Series A Term Preferred Stock with an
aggregate liquidation preference of $25 million, pursuant to a prospectus filed with the SEC on June 29, 2023.
Series
B Term Preferred Stock
On
July 26, 2023, the Company closed an underwritten public offering of 1,130,500 shares of its Series B Term Preferred Stock, resulting
in net proceeds to the Company of approximately $27.1 million after payment of underwriting discounts and commissions of approximately
$0.9 million and offering expenses of approximately $0.3 million. On August 3, 2023, the underwriters purchased an additional
169,575 shares of its Series B Term Preferred Stock pursuant to the underwriters’ overallotment option, which resulted in
additional net proceeds to the Company of approximately $4.1 million after payment of underwriting discounts and commissions of
approximately $0.1 million.
The
Company is required to redeem all outstanding shares of the Series B Term Preferred Stock on July 31, 2028, at a redemption price
of $25 per share (the “Series B Liquidation Preference”), plus accumulated but unpaid dividends, if any. At any time
on or after July 31, 2025, the Company may, at its sole option, redeem the outstanding shares of the Series B Term Preferred Stock.
The
Company has accounted for its Series B Term Preferred Stock utilizing the FVO under ASC 825. Accordingly, the Series B Term Preferred
Stock are measured at their fair value and issuance costs in the aggregate amount of approximately $1.3 million, which consisted
of approximately $1.0 million of underwriting commissions, $0.2 million of professional fees and $0.1 million of other expenses,
were expensed as incurred in the year ended December 31, 2023.
The
estimated change in fair value of the Series B Term Preferred Stock attributable to market risk for the year ended December 31,
2023 is approximately ($0.3) million, which is recorded as unrealized (appreciation) depreciation on liabilities at fair value
under the FVO on the Consolidated Statement of Operations.
The
estimated change in fair value of the Series B Term Preferred Stock attributable to instrument-specific credit risk for the year
ended December 31, 2023 is approximately $0.4 million, which is recorded as unrealized (appreciation) depreciation on liabilities
at fair value under the FVO on the Consolidated Statement of Comprehensive Income. The Company defines the change in fair value
attributable to instrument-specific credit risk as the excess of the total change in fair value over the change in fair value
attributable to changes in a base market rate, such as a United States treasury bond index with a similar maturity to the instrument
being valued.
Pursuant
to a prospectus supplement filed with the SEC on August 22, 2023, the Company updated the ATM offering to allow the Company to
sell up to 1,000,000 shares of Series B Term Preferred Stock with an aggregate liquidation preference of $25 million, pursuant
to a prospectus filed with the SEC on June 29, 2023.
For
the year ended December 31, 2023, the Company sold 72,407 shares of its Series B Term Preferred Stock pursuant to the ATM offering
for total proceeds to the company of approximately $1.8 million. In connection with such sales,
Eagle
Point Income Company Inc. and Subsidiaries
Notes
to Consolidated Financial Statements
December
31, 2023
the Company paid a total of $36,274
in sales commissions.
See
Note 10 “Asset Coverage” for further discussion on the Company’s calculation of asset coverage with respect
to its Preferred Stock.
| 7. | COMMITMENTS
AND CONTINGENCIES |
The
Company is not currently subject to any material legal proceedings. From time to time, the Company may be a party to certain legal
proceedings in the ordinary course of business, including proceedings relating to the enforcement of the Company’s rights
under contracts. While the outcome of these legal proceedings cannot be predicted with certainty, the Company does not expect
these proceedings will have a material effect upon its financial condition or results of operations.
As
of December 31, 2023, the Company had total unfunded commitments of $0.8
million arising from CFO debt and CFO equity investments.
Under
the Company’s organizational documents, its officers and directors are indemnified against certain liabilities arising out
of the performance of their duties to the Company. In addition, during the normal course of business, the Company enters into
contracts containing a variety of representations which provide general indemnifications. The Company’s maximum exposure
under these agreements cannot be known; however, the Company expects any risk of loss to be remote.
| 9. | REVOLVING
CREDIT FACILITY |
The
Company may utilize leverage to the extent permitted by the 1940 Act. The Company may obtain leverage using any form of financial
leverage instruments, including funds borrowed from banks or other financial institutions, margin facilities, notes or preferred
stock and leverage attributable to repurchase agreements or similar transactions. Instruments that create leverage are generally
considered to be senior securities under the 1940 Act. The use of leverage creates an opportunity for increased net income and
capital appreciation, but also creates additional risks and expenses which will be borne entirely by common stock holders. The
Company’s leverage strategy may not ultimately be successful.
On
September 24, 2021 the Company entered into a credit agreement, which was amended on September 6, 2022 and September 18, 2023,
with BNP Paribas, as lender, that established a revolving credit facility (the “Revolving Credit Facility”). Pursuant
to the terms of the Revolving Credit Facility, the Company can borrow up to an aggregate principal balance of $25.0 million (the
“Commitment Amount”). The Revolving Credit facility is collateralized by certain investments held by the Company.
The Company has granted a security interest in certain assets to BNP Paribus, as lender. Such borrowings under the Revolving Credit
Facility bore interest at 1-month LIBOR plus a spread under the original credit agreement, and bear interest at Term SOFR plus
a spread under the amended credit agreement. The Company is required to pay a commitment fee on the unused amount.
The
Revolving Credit Facility will mature on the earlier of (i) the termination of the Commitment, as defined by the terms of the
Revolving Credit Facility or (ii) the scheduled maturity date of September 21, 2024. The Company has the option to extend the
maturity from time to time in accordance with the Revolving Credit Facility agreement.
For
the year ended December 31, 2023, the Company had an average outstanding borrowing and average interest rate of approximately
$3.1 million and 5.90%, respectively. The interest expense for the year ended December 31, 2023 on the Revolving Credit Facility
was approximately $0.3 million, inclusive of the unused fee, and is recorded on the Consolidated Statement of Operations. As of
December 31, 2023, the Company had an outstanding borrowing amount of $14.5 million.
See
Note 10 “Asset Coverage” for further discussion on the Company’s calculation of asset coverage with respect
to
Eagle
Point Income Company Inc. and Subsidiaries
Notes
to Consolidated Financial Statements
December
31, 2023
the
Revolving Credit Facility.
Under
the provisions of the 1940 Act, the Company is permitted to issue senior securities, including debt securities and preferred stock,
and borrow from banks or other financial institutions, provided that the Company satisfies certain asset coverage requirements.
With
respect to senior securities that are stocks, such as the Preferred Stock, the Company is required to have asset coverage of at
least 200%, as measured at the time of issuance of any such senior securities that are stocks and calculated as the ratio of the
Company’s total consolidated assets, less all liabilities and indebtedness not represented by senior securities, over the
aggregate amount of the Company’s outstanding senior securities representing indebtedness plus the aggregate liquidation
preference of any outstanding shares of senior securities that are stocks.
With
respect to senior securities representing indebtedness, such as the Revolving Credit Facility or any bank borrowings (other than
temporary borrowings as defined under the 1940 Act), the Company is required to have asset coverage of at least 300%, as measured
at the time of borrowing and calculated as the ratio of the Company’s total consolidated assets, less all liabilities and
indebtedness not represented by senior securities, over the aggregate amount of the Company’s outstanding senior securities
representing indebtedness.
If
the Company’s asset coverage declines below 300% (or 200%, as applicable), the Company would be prohibited under the 1940
Act from incurring additional debt or issuing additional preferred stock and from declaring certain distributions to its stockholders.
In addition, the terms of the Revolving Credit Facility require the Company to cure any breach of the applicable asset coverage
if the Company fails to maintain the applicable asset coverage, and the terms of the Preferred Stock require the Company to redeem
shares of the Preferred Stock, if such failure to maintain the applicable asset coverage is not cured by a certain date.
The
following table summarizes the Company’s asset coverage with respect to its Preferred Stock and Revolving Credit Facility
as of December 31, 2023, and as of December 31, 2022:
| | |
As
of | | |
As
of | |
| | |
December
31, 2023 | | |
December
31, 2022 | |
| Total
Assets | |
$ | 243,728,043 | | |
$ | 148,573,523 | |
| Less
liabilities and debts not represented by senior securities | |
| (1,513,315 | ) | |
| (1,414,870 | ) |
| Net
total assets and liabilities | |
$ | 242,214,728 | | |
$ | 147,158,653 | |
| Preferred
Stock | |
$ | 72,353,275 | | |
$ | 38,041,225 | |
| Revolving
Credit Facility | |
| 14,520,000 | | |
| 9,030,000 | |
| | |
$ | 86,873,275 | | |
$ | 47,071,225 | |
| Asset
coverage for preferred stock (1) | |
| 279 | % | |
| 313 | % |
| Asset
coverage for debt securities (2) | |
| 1668 | % | |
| 1630 | % |
(1) Asset coverage of the preferred stock is calculated in accordance with Section 18(h)
of the 1940 act, as generally described above.
(2) Asset coverage of the debt securities is calculated in accordance with Section 18(h)
of the 1940 act, as generally described above.
| 11. | RECENT
ACCOUNTING PRONOUCEMENT |
In
March 2020, FASB issued Accounting Standards Update No. 2020-04 (“ASU 2020-04”) related to FASB ASC Topic 848 Reference
Rate Reform– Facilitation of the Effects of Reference Rate Reform. ASU 2020-04 provides optional guidance for a limited
period of time to ease the potential burden in accounting for (or recognizing the effects of) reference rate reform on financial
reporting. The Company has fully adopted the provisions of ASU 2020-04, which did not have a material impact on the Company’s
consolidated financial statements and related disclosures.
Eagle
Point Income Company Inc. and Subsidiaries
Notes
to Consolidated Financial Statements
December
31, 2023
In
June 2022, the FASB issued Accounting Standards Update No. 2022-03 (“ASU 2022-03”) related to FASB ASC Topic 820 Fair
Value Measurements - Fair Value Measurement of Equity Securities Subject to Contractual Sale Restrictions. This change prohibits
entities from taking into account contractual restrictions on the sale of equity securities when estimating fair value and introduces
required disclosures for such transactions. The standard is effective for annual periods beginning after December 15, 2023, and
should be applied prospectively. The Company is currently evaluating the impact, if any, of applying ASU 2022-03.
On
January 31, 2024, the Company paid a monthly distribution of $0.20 per share on its common stock to holders of record as of January
11, 2024. Additionally, on February 13, 2024, the Company declared three separate distributions of $0.20 per share on its common
stock. The distributions are payable on each of April 30, 2024, May 31, 2024 and June 28, 2024 to holders of record as of April
10, 2024, May 13, 2024 and June 10, 2024, respectively.
On
January 31, 2024, the Company paid a monthly distribution of $0.104167 per share on its Series A Preferred Stock to holders of
record as of January 11, 2024. Additionally, on February 13, 2024, the Company declared three separate distributions of $0.104167
per share on its Series A Preferred Stock. The distributions are payable on each of April 30, 2024, May 31, 2024 and June 28,
2024 to holders of record as of April 10, 2024, May 13, 2024 and June 10, 2024, respectively.
On
January 31, 2024, the Company paid a monthly distribution of $0.161459 per share on its Series B Preferred Stock to holders of
record as of January 11, 2024. Additionally, on February 13, 2024, the Company declared three separate distributions of $0.161459
per share on its Series B Preferred Stock. The distributions are payable on each of April 30, 2024, May 31, 2024 and June 28,
2024 to holders of record as of April 10, 2024, May 13, 2024 and June 10, 2024, respectively.
For
the period from January 1, 2024 to February 21, 2024, the Company sold 1,178,064 shares of its common stock, pursuant to the ATM
offering, for total net proceeds to the Company of approximately $17.4 million. In connection with such sales, the Company paid
a total of approximately $0.4 million in sales agent commissions.
For
the period from January 1, 2024 to February 21, 2024, the Company sold 49,611 shares of its Series B Preferred Stock, pursuant
to the ATM offering, for total net proceeds to the Company of approximately $1.2 million. In connection with such sales, the
Company paid a total of approximately $24,812 in sales agent commissions.
As
of February 20, 2024, the BNP Credit Facility was fully undrawn.
Management’s
unaudited estimate of the range of the Company’s NAV per common share as of January 31, 2024 was $14.94 to $15.04.
Management
of the Company has evaluated the need for disclosures and/or adjustments resulting from subsequent events through the date of
release of this report, and has determined there are no events in addition to those described above which would require adjustment
to or disclosure in the consolidated financial statements and related notes through the date of release of this report.
Eagle Point Income Company
Inc.
Consolidated Financial
Highlights
| Per
Share Data | |
For
the year ended
December 31,
2023 | | |
For
the year ended
December 31,
2022 | | |
For
the year ended
December 31,
2021 | | |
For
the year ended
December 31,
2020 | | |
For
the year ended
December 31,
2019 | | |
For
the period from
October 16, 2018
to December 31, 2018 | |
| | |
| | | |
| | | |
| | | |
| | | |
| | | |
| | |
| Net
asset value, beginning of period | |
$ | 12.91 | | |
$ | 16.76 | | |
$ | 16.89 | | |
$ | 19.34 | | |
$ | 18.28 | | |
$ | 20.00 | |
| | |
| | | |
| | | |
| | | |
| | | |
| | | |
| | |
| Net
investment income, before fee waivers and expenses reimbursed (1) (2) | |
| 1.90 | | |
| 1.64 | | |
| 0.98 | | |
| 1.27 | | |
| 1.15 | | |
| 0.10 | |
| Management
fee voluntarily waived by the Adviser (1) | |
| - | | |
| - | | |
| - | | |
| - | | |
| 0.08 | | |
| 0.05 | |
| Expenses
reimbursed by the Adviser (1) | |
| - | | |
| - | | |
| - | | |
| - | | |
| 0.06 | | |
| 0.20 | |
| Administration
fee voluntarily waived by the Administrator (1) | |
| - | | |
| - | | |
| - | | |
| - | | |
| 0.03 | | |
| - | |
| Net
investment income | |
| 1.90 | | |
| 1.64 | | |
| 0.98 | | |
| 1.27 | | |
| 1.32 | | |
| 0.35 | |
| | |
| | | |
| | | |
| | | |
| | | |
| | | |
| | |
| Net
realized gain (loss) and change in unrealized appreciation (depreciation) on investments (1) (3) | |
| 1.32 | | |
| (4.45 | ) | |
| 0.38 | | |
| (2.21 | ) | |
| 0.70 | | |
| (1.72 | ) |
| Net
change in unrealized (appreciation) depreciation on liabilities at fair value under the fair value option | |
| (0.14 | ) | |
| 0.53 | | |
| (0.01 | ) | |
| - | | |
| - | | |
| - | |
| | |
| | | |
| | | |
| | | |
| | | |
| | | |
| | |
| Net
income (loss) and net increase (decrease) in net assets resulting from operations | |
| 3.08 | | |
| (2.28 | ) | |
| 1.35 | | |
| (0.94 | ) | |
| 2.02 | | |
| (1.37 | ) |
| | |
| | | |
| | | |
| | | |
| | | |
| | | |
| | |
| Common
stock distributions from net investment income (4) | |
| (1.98 | ) | |
| (1.53 | ) | |
| (1.33 | ) | |
| (1.32 | ) | |
| (0.69 | ) | |
| (0.35 | ) |
| Common
stock distributions from net realized gains on investments (4) | |
| - | | |
| - | | |
| - | | |
| - | | |
| - | | |
| - | |
| Common
stock distributions from tax return of capital (4) | |
| - | | |
| - | | |
| - | | |
| (0.18 | ) | |
| - | | |
| - | |
| Total
common stock distributions declared to stockholders (4) | |
| (1.98 | ) | |
| (1.53 | ) | |
| (1.33 | ) | |
| (1.50 | ) | |
| (0.69 | ) | |
| (0.35 | ) |
| | |
| | | |
| | | |
| | | |
| | | |
| | | |
| | |
Common
stock distributions based on weighted average
shares impact (5) | |
| - | | |
| - | | |
| (0.02 | ) | |
| - | | |
| (0.15 | ) | |
| - | |
| Total
common stock distributions | |
| (1.98 | ) | |
| (1.53 | ) | |
| (1.35 | ) | |
| (1.50 | ) | |
| (0.84 | ) | |
| (0.35 | ) |
| | |
| | | |
| | | |
| | | |
| | | |
| | | |
| | |
| Effect
of other comprehensive income | |
| 0.25 | | |
| (0.15 | ) | |
| (0.13 | ) | |
| - | | |
| - | | |
| - | |
| | |
| | | |
| | | |
| | | |
| | | |
| | | |
| | |
| Effect
of shares issued (6) | |
| 0.20 | | |
| 0.14 | | |
| 0.10 | | |
| - | | |
| (0.19 | ) | |
| - | |
| Effect
of underwriting discounts, commissions and offering expenses associated with shares issued (6) | |
| (0.07 | ) | |
| (0.03 | ) | |
| (0.10 | ) | |
| (0.01 | ) | |
| | | |
| | |
| Effect
of offering expenses associated with shares issued (7) | |
| - | | |
| - | | |
| - | | |
| - | | |
| (0.12 | ) | |
| - | |
| Effect
of shares issued in accordance with the Company’s dividend reinvestment plan | |
| - | | |
| - | | |
| - | | |
| - | | |
| - | | |
| | |
| Effect
of paid-in capital contribution (8) | |
| - | | |
| - | | |
| - | | |
| - | | |
| 0.19 | | |
| - | |
| Net
effect of shares issued | |
| 0.13 | | |
| 0.11 | | |
| - | | |
| (0.01 | ) | |
| (0.12 | ) | |
| - | |
| | |
| | | |
| | | |
| | | |
| | | |
| | | |
| | |
| Net
asset value at end of period | |
$ | 14.39 | | |
$ | 12.91 | | |
$ | 16.76 | | |
$ | 16.89 | | |
$ | 19.34 | | |
$ | 18.28 | |
| Per
share market value at beginning of period (9) | |
$ | 13.87 | | |
$ | 17.03 | | |
$ | 14.41 | | |
$ | 18.76 | | |
$ | 19.89 | | |
| N/A
| |
| Per
share market value at end of period | |
$ | 14.57 | | |
$ | 13.87 | | |
$ | 17.03 | | |
$ | 14.41 | | |
$ | 18.76 | | |
| N/A
| |
| | |
| | | |
| | | |
| | | |
| | | |
| | | |
| | |
| Total
return, based on market value (10) | |
| 21.37 | % | |
| (8.67 | %) | |
| 26.55 | % | |
| (14.07 | %) | |
| (2.27 | %) | |
| N/A
| |
| Total
return, based on net asset value (11) | |
| 26.80 | % | |
| (13.84 | %) | |
| 7.22 | % | |
| (4.91 | %) | |
| 9.56 | % | |
| (6.85 | %) |
| | |
| | | |
| | | |
| | | |
| | | |
| | | |
| | |
| Shares
of common stock outstanding at end of period | |
| 10,997,398 | | |
| 7,896,757 | | |
| 6,881,964 | | |
| 6,106,458 | | |
| 6,018,273 | | |
| 3,769,596 | |
| | |
| | | |
| | | |
| | | |
| | | |
| | | |
| | |
| Ratios
and Supplemental Data: | |
| | | |
| | | |
| | | |
| | | |
| | | |
| | |
| Net
asset value at end of period | |
$ | 158,207,420 | | |
$ | 101,943,840 | | |
$ | 115,349,167 | | |
$ | 103,120,136 | | |
$ | 116,408,383 | | |
$ | 68,923,362 | |
| Ratio
of net investment income to average net assets (12) (14) | |
| 13.83 | % | |
| 11.20 | % | |
| 5.66 | % | |
| 8.65 | % | |
| 6.67 | % | |
| 8.54 | % |
| Ratio
of expenses, before fee waivers and expenses reimbursed, to average net assets (12) (13) (14) | |
| 7.44 | % | |
| 7.16 | % | |
| 5.36 | % | |
| 3.99 | % | |
| 2.75 | % | |
| 3.12 | % |
| Ratio
of expenses, after fee waivers and expenses reimbursed, to average net assets (12) (13) (14) | |
| N/A | | |
| N/A | | |
| N/A | | |
| N/A | | |
| 1.89 | % | |
| 0.00 | % |
| Portfolio
turnover rate (15) | |
| 3.18 | % | |
| 6.32 | % | |
| 27.98 | % | |
| 29.14 | % | |
| 11.42 | % | |
| 2.35 | % |
| Asset
coverage of preferred stock | |
| 279 | % | |
| 313 | % | |
| 313 | % | |
| N/A | | |
| N/A | | |
| - | |
| Asset
coverage of debt securities | |
| 1668 | % | |
| 1630 | % | |
| 873 | % | |
| 796 | % | |
| 947 | % | |
| - | |
| | |
| | | |
| | | |
| | | |
| | | |
| | | |
| | |
| Credit
Facility: | |
| | | |
| | | |
| | | |
| | | |
| | | |
| | |
| Principal
amount outstanding at end of period | |
$ | 14,520,000 | | |
$ | 9,030,000 | | |
$ | 19,550,000 | | |
$ | 14,815,000 | | |
$ | 13,743,000 | | |
$ | - | |
| Asset
coverage per $1,000 at end of period (16) | |
$ | 16,681.46 | | |
$ | 16,296.64 | | |
$ | 8,732.75 | | |
$ | 7,960.52 | | |
$ | 9,470.38 | | |
$ | - | |
Eagle Point Income Company
Inc.
Consolidated Financial
Highlights
Footnotes to the Financial
Highlights:
| (1) | Per share amounts are based on the weighted average of shares of common
stock outstanding for the period. |
| (2) | Per share distributions paid to preferred stockholders are reflected
in net investment income, and totaled ($0.33), ($0.27) and ($0.05) per share of common stock for the year ended December 31, 2023,
and the years ended December 31, 2022 and December 31, 2021, respectively. |
| (3) | Net realized gain (loss) and change in unrealized appreciation (depreciation)
on investments may include a balancing figure to reconcile to the change in NAV per share at the end of each period. The amount
shown for a share outstanding throughout the period may not agree with the change in the aggregate net realized gain (loss) and
change in unrealized appreciation (depreciation) on investments for the period because of the timing of sales of the Company’s
common stock in relation to fluctuating market values for the portfolio. |
| (4) | The information provided is based on estimates available at each respective
period. The Company’s final taxable income and the actual amount required to be distributed will be finally determined when
the Company files its final tax returns and may vary from these estimates. |
| (5) | Represents the difference between the per share amount distributed
to common stockholders of record and the per share amount distributed based on the weighted average of shares of common stock outstanding
for the period. |
| (6) | Represents the effect per share of the Company’s issuance of
shares of common stock pursuant to a private placement in May 2019 and the Company’s ATM and follow on offerings. Effect
of shares issued reflect the impact of the offering price when compared to management’s estimated NAV per share at the time
of each respective offering. |
| (7) | Represents the effect per share of offering expenses incurred prior
to or in connection with the Company’s IPO. |
| (8) | Represents the effect of the paid-in capital contribution made by
an affiliate of the Adviser pursuant to a private placement in May 2019. |
| (9) | Represents the IPO price as of July 23, 2019 for the year ended December
31, 2019. |
| (10) | Total return based on market value is calculated assuming shares of
the Company’s common stock were purchased at the market price as of the beginning of the period, and distributions paid to
common stockholders during the period were reinvested at prices obtained by the Company’s dividend reinvestment plan, and
the total number of shares were sold at the closing market price per share on the last day of the period. For the year ended December
31, 2019 the total return on market value is calculated as the change in market value per share for the period commencing July
23, 2019, the date of the Company’s IPO, through December 31, 2019. The beginning market value per share is based on the
initial public offering price of $19.89 per share. Total return does not reflect any sales load. |
| (11) | Total return based on net asset value is calculated as the change
in net asset value per share during the period plus declared and paid dividends per share, divided by the beginning net asset value
per share. |
| (12) | Ratios for the period from October 16, 2018 to December 31, 2018 are
annualized. Ratios include the impact of the fee waivers and expenses reimbursed by the Adviser, where applicable. |
| (13) | Expenses of the Company for the period from October 16, 2018 to December
31, 2018 and for the period from January 1, 2019 to May 31, 2019 were reimbursed by the Adviser. In addition, the Adviser has voluntarily
waived the management fee and the Administrator has voluntarily waived the administration fee for the same periods from October
16, 2018 to December 31, 2018 and from January 1, 2019 to May 31, 2019. |
| (14) | Ratios for the years ended December 31, 2023, December 31, 2022, December
31, 2021, December 31, 2020 and December 31, 2019 include interest expense on the credit facility of 0.21%, 0.63%, 0.40%, 0.60%
and 0.04% of average net assets, respectively. Ratios for the years ended December 31, 2023, December 31, 2022 and December 31,
2021 include interest expense on the Series A Term Preferred Stock and Series B Term Preferred Stock of 2.38%, 1.83% and 0.31%
of average net assets, respectively. Ratios for the years ended December 31, 2023, December 31, 2022, December 31, 2021 and December
31, 2019 include excise tax expense of 0.11%, 0.27%, 0.06% and 0.10% of average net assets, respectively. |
| (15) | The portfolio turnover rate is calculated as the lesser of total investment
purchases executed during the period or the total of investment sales and repayments of principal executed during the period, divided
by the average fair value of the investments for the same period. |
| (16) | The asset coverage per unit figure is the ratio of the Company’s
total assets, less liabilities and indebtedness not represented by the credit facility, to the aggregate dollar amount of outstanding
borrowings of the credit facility, in accordance with section 18(h) of the 1940 Act. The asset coverage per unit figure is expressed
in terms of dollar amounts per $1,000 principal amount. |
Eagle Point Income Company
Inc.
Consolidated Financial
Highlights
Financial highlights for
the period from October 4, 2018 (Commencement of Operations) to October 15, 2018 for the Members are as follows:
| Per Unit Data | |
For
the period from
October 4, 2018
(Commencement of Operations)
to October 15, 2018 | |
| | |
| | |
| Net asset value at beginning of period | |
$ | 1,000.00 | |
| | |
| | |
| Net investment income | |
| 2.69 | |
| Net change in unrealized appreciation (depreciation) on investments | |
| 0.51 | |
| Net income (loss) and net increase (decrease) in net assets resulting from operations | |
| 3.20 | |
| Net asset value at end of period | |
$ | 1,003.20 | |
| Total return (1) | |
| 0.32 | % |
| | |
| | |
| Ratios and Supplemental Data: | |
| | |
| | |
| | |
| Net asset value at end of period | |
$ | 75,391,911 | |
| Ratio of net investment income to average net assets (1) | |
| 0.27 | % |
| Ratio of expenses to average net assets (2) | |
| 0.00 | % |
| Portfolio turnover rate (3) | |
| 0.00 | % |
| (1) | Total return and ratio of net investment income to average net assets for the period from October
4, 2018 (Commencement of Operations) to October 15, 2018 are not annualized. |
| (2) | No expenses were borne by the Company from October 4, 2018 (Commencement
of Operations) to October 15, 2018. |
| (3) | The Company did not enter transactions to purchase or sell securities
from October 4, 2018 (Commencement of Operations) to October 15, 2018. As such, the portfolio turnover rate is 0.00%. |
Note: The above Financial
Highlights for the period from October 4, 2018 (Commencement of Operations) to October 15, 2018 for Members represents the period
when the Company was initially organized as a Delaware limited liability company.
Eagle Point Income Company
Inc.
Supplemental
Information
Senior Securities Table
Information about the Company’s
senior securities shown in the following table has been derived from the Company’s consolidated financial statements as of
and for the dates noted.
| Class |
|
Total
Amount Outstanding
Exclusive of Treasury Securities
(in millions) |
|
Asset
Coverage Per
Unit (1) |
|
Involuntary
Liquidating
Preference
Per Unit (2) |
|
Average
Market Value
Per Unit (3) |
| |
|
|
|
|
|
|
|
|
| For
the year ended December 31, 2023 |
|
|
|
|
|
|
|
|
| Preferred
Stock |
|
$72,353,275
|
|
$69.70
|
|
$25
|
|
$23.81
|
| Revolving
Credit Facility (BNP Paribas) |
|
$14,520,000
|
|
$16,681.46
|
|
N/A
|
|
N/A
|
| |
|
|
|
|
|
|
|
|
| For
the year ended December 31, 2022 |
|
|
|
|
|
|
|
|
| Preferred
Stock |
|
$38,041,225
|
|
$78.16
|
|
$25
|
|
$23.68
|
| Revolving
Credit Facility (BNP Paribas) |
|
$9,030,000
|
|
$16,296.64
|
|
N/A
|
|
N/A
|
| |
|
|
|
|
|
|
|
|
| For
the year ended December 31, 2021 |
|
|
|
|
|
|
|
|
| Preferred
Stock |
|
$35,000,000
|
|
$78.24
|
|
$25
|
|
$25.32
|
| Revolving
Credit Facility (BNP Paribas) |
|
$19,550,000
|
|
$8,732.75
|
|
N/A
|
|
N/A
|
| |
|
|
|
|
|
|
|
|
| For
the year ended December 31, 2020 |
|
|
|
|
|
|
|
|
| Revolving
Credit Facility (Société Générale) |
|
$14,815,000
|
|
$7,960.52
|
|
N/A
|
|
N/A
|
| |
|
|
|
|
|
|
|
|
| For
the year ended December 31, 2019 |
|
|
|
|
|
|
|
|
| Revolving
Credit Facility (Société Générale) |
|
$13,743,000
|
|
$9,470.38
|
|
N/A
|
|
N/A
|

| |
KPMG LLP
345 Park Avenue
New York, NY 10154-0102
|
Report of Independent Registered Public Accounting
Firm
To the Shareholders and Board of Directors
Eagle Point Income Company Inc.:
Opinion on the Consolidated Financial Statements
We have audited the accompanying consolidated statement of
assets and liabilities of Eagle Point Income Company Inc. and Subsidiaries (the Company), including the consolidated schedule of investments,
as of December 31, 2023, the related consolidated statements of operations, comprehensive income, and cash flows for the year then ended,
the consolidated statements of changes in net assets for each of the years in the two-year period then ended, and the related notes (collectively,
the consolidated financial statements) and the consolidated financial highlights for each of the years in the five-year period then ended,
the period from October 16, 2018 to December 31, 2018, and the period from October 4, 2018 (commencement of operations) to October 15,
2018. In our opinion, the consolidated financial statements and consolidated financial highlights present fairly, in all material respects,
the financial position of the Company as of December 31, 2023, the results of its operations and its cash flows for the year then ended,
the changes in its net assets for each of the years in the two -year period then ended, and the consolidated financial highlights for
each of the years in the five-year period then ended, the period from October 16, 2018 to December 31, 2018, and the period from October
4, 2018 to October 15, 2018, in conformity with U.S. generally accepted accounting principles.
Basis for Opinion
These consolidated financial statements and consolidated financial
highlights are the responsibility of the Company's management. Our responsibility is to express an opinion on these consolidated financial
statements and consolidated financial highlights based on our audits. We are a public accounting firm registered with the Public Company
Accounting Oversight Board (United States) (PCAOB) and are required to be independent with respect to the Company in accordance with the
U.S. federal securities laws and the applicable rules and regulations of the Securities and Exchange Commission and the PCAOB.
We conducted our audits in accordance with the standards of the PCAOB.
Those standards require that we plan and perform the audit to obtain reasonable assurance about whether the consolidated financial statements
and consolidated financial highlights are free of material misstatement, whether due to error or fraud. Our audits included performing
procedures to assess the risks of material misstatement of the consolidated financial statements and consolidated financial highlights,
whether due to error or fraud, and performing procedures that respond to those risks. Such procedures included examining, on a test basis,
evidence regarding the amounts and disclosures in the consolidated financial statements and consolidated financial highlights. Such procedures
also included confirmation of securities owned as of December 31, 2023, by correspondence with custodians, brokers and other counterparties.
Our audits also included evaluating the accounting principles used and significant estimates made by management, as well as evaluating
the overall presentation of the consolidated financial statements and consolidated financial highlights. We believe that our audits provide
a reasonable basis for our opinion.
KPMG
LLP, a Delaware limited liability partnership and a member firm of
the
KPMG global organization of independent member firms affiliated with
KPMG
International Limited, a private English company limited by guarantee.
54

Accompanying Supplemental Information
We have also previously audited, in accordance
with the standards of the PCAOB, the consolidated statements of assets and liabilities, including the consolidated schedules of investments,
of the Company as of December 31, 2022, 2021, 2020 and 2019 and the related consolidated statements of operations and cash flows for
the respective years then ended and the consolidated statements of changes in net assets for each of the years in the respective two-year
periods then ended, and the related notes, and the consolidated statements of comprehensive income for the years ended December 31, 2022
and 2021 (none of which are presented herein), and we expressed unqualified opinions on those consolidated financial statements. The
senior securities information included on page 53, for the years ended December 31, 2023, 2022, 2021, 2020 and 2019, under the caption
“Supplemental Information” (the Supplemental Information) has been subjected to audit procedures performed in conjunction
with the audits of the Company’s respective consolidated financial statements. The Supplemental Information is the responsibility
of the Company’s management. Our audit procedures included determining whether the Supplemental Information reconciles to the respective
consolidated financial statements or the underlying accounting and other records, as applicable, and performing procedures to test the
completeness and accuracy of the information presented in the Supplemental Information. In forming our opinion on the Supplemental Information,
we evaluated whether the Supplemental Information, including its form and content, is presented in conformity with the instructions in
Form N-2. In our opinion, the Supplemental Information is fairly stated, in all material respects, in relation to the respective consolidated
financial statements as a whole.
| |
 |
We have served as the auditor of one or more Eagle Point Income Management
LLC advised companies since 2014.
New York, New York
February 21, 2024
55
Price
Range of Common Stock
Our
common stock began trading on July 24, 2019 and is currently traded on the NYSE under the symbol “EIC.” The following
table lists the high and low closing sale price for our common stock, the high and low closing sale price as a percentage
of NAV and distributions declared per share each quarter since January 1, 2022.
| |
|
|
|
Closing
Sales Price |
|
Premium
(Discount)
of
High
Sales
Price |
|
Premium
(Discount)
of Low
Sales
Price |
|
Distributions |
| Period |
|
NAV(1) |
|
High |
|
Low |
|
to
NAV(2) |
|
to
NAV(2) |
|
Declared(3) |
| Fiscal
year ending December 31, 2022(4) |
|
|
|
|
|
|
|
|
|
|
|
|
| First
quarter |
|
$16.52 |
|
$17.38 |
|
$15.85 |
|
5.2% |
|
(4.1)% |
|
$0.38 |
| Second
quarter |
|
$13.66 |
|
$17.91 |
|
$14.75 |
|
31.1% |
|
8.0% |
|
$0.38 |
| Third
quarter |
|
$13.05 |
|
$17.29 |
|
$13.60 |
|
32.5% |
|
4.2% |
|
$0.42 |
| Fourth
quarter |
|
$12.91 |
|
$16.11 |
|
$13.57 |
|
24.8% |
|
5.1% |
|
$0.48 |
| Fiscal
year ending December 31, 2023(5) |
|
|
|
|
|
|
|
|
|
|
|
|
| First
quarter |
|
$13.20 |
|
$15.48 |
|
$13.85 |
|
17.3% |
|
4.9% |
|
$0.48 |
| Second
quarter |
|
$13.00 |
|
$14.88 |
|
$13.05 |
|
14.5% |
|
0.3% |
|
$0.48 |
| Third
quarter |
|
$14.08 |
|
$14.55 |
|
$13.14 |
|
3.3% |
|
(6.7)% |
|
$0.54 |
| Fourth
quarter |
|
$14.39 |
|
$14.91 |
|
$13.64 |
|
3.5% |
|
(5.2)% |
|
$0.60 |
| (1) | |
| (2) | |
| (3) | Represents
the cash distributions (including dividends, dividends reinvested and returns of capital,
if any) per share that we have declared on our common stock in the specified quarter.
Tax characteristics of distributions will vary. |
| (4) | |
| (5) | |
Shares
of closed-end management investment companies may trade at a market price that is less than the NAV that is attributable to those
shares. The possibility that the Company’s shares of common stock will trade at a discount to NAV or at a premium that is
unsustainable over the long term is separate and distinct from the risk that the Company’s NAV will decrease. It is not
possible to predict whether the Company’s shares will trade at, above or below NAV in the future. Our NAV per share was
$14.39 as of December 31, 2023. The closing sales price for shares of the Company’s common stock on the NYSE on December 29,
2022 was $14.57, which represented a 1.25% premium to NAV per share. On February 15, 2024, the last reported closing sales price
of the Company’s common stock was $15.74 per share. As of February 15, 2024, there were 10 stockholders of record of
the Company’s common stock (which does not reflect holders whose shares are held in street name by a broker, bank or other
nominee).
Dividend
Reinvestment Plan
The
Company has adopted a dividend reinvestment plan (“DRIP”). Under the DRIP, each registered holder of at least one
full share of our common stock will be automatically enrolled in the DRIP and distributions on shares of the Company’s common
stock are automatically reinvested in additional shares of the Company’s common stock by Equiniti Trust Company, LLC (formerly,
American Stock Transfer & Trust Company, LLC) (the “DRIP Agent”) unless a stockholder “opts-out” of
the DRIP. Holders of the Company’s common stock who receive distributions in the form of additional shares of the Company’s
common stock are nonetheless required to pay applicable federal, state or local taxes on the reinvested distribution but will
not receive a corresponding cash distribution with which to pay any applicable tax. Distributions that are reinvested through
the issuance of new shares increase the Company’s stockholders’ equity on which a management fee is payable to the
Adviser. If we declare a distribution payable in cash, holders of shares of the Company’s common stock who opt-out of participation
in the DRIP (including those holders whose shares are held through a broker or other nominee who has opted out of participation
in the DRIP) generally will receive such distributions in cash.
The
DRIP Agent, on the Company’s behalf, will primarily use newly-issued, authorized shares of common stock to implement reinvestment
of distributions under the DRIP (regardless of whether the outstanding shares are trading at a premium or at a discount to the
Company’s net asset value (the “NAV”)). However, the Company reserves the right to instruct the DRIP Agent to
purchase shares of the Company’s common stock on the open market (on the New York Stock Exchange or elsewhere) in connection
with the reinvestment of distributions under the DRIP to the extent that the Company’s shares of common stock are trading
at a discount to NAV per share.
The
number of shares of common stock to be credited to each participant’s account will be determined based on the closing market
price per share of common stock on the payment date (the “Market Price”). If 95% of the Market Price is greater than
the Company’s last determined NAV per share, the number of shares to be credited to each participant’s account pursuant
to DRIP will be determined by dividing the aggregate dollar amount of the distribution by 95% of the Market Price. If 95% of the
Market Price is less than the Company’s last determined NAV per share, the number of shares to be credited to each participant’s
account pursuant to DRIP will be determined by dividing the aggregate dollar amount of the distribution by the lesser of (i) the
last determined NAV per share and (ii) the Market Price.
In
the event that the DRIP Agent is instructed to buy shares of our common stock on the open market, any shares so purchased will
be allocated to each participant based upon the average purchase price (excluding any brokerage charges or other fees) of all
shares purchased with respect to the distribution. In any case, the DRIP Agent (or the DRIP Agent’s broker) will have until
the last business day before the next date on which the shares trade on an “ex-dividend” basis or 30 days after the
payment date for the applicable distribution, whichever is sooner, to invest the distribution amount in shares acquired on the
open market. To the extent that the DRIP Agent is unable to reinvest the full amount of the distribution through open market purchases,
the balance shall be credited to participants’ accounts in the form of newly-issued shares of common stock, in accordance
with the procedures described above. Open market purchases may be made on any securities exchange where shares of our common stock
are traded, in the over-the-counter market or in negotiated transactions, and may be on such terms as to price, delivery and otherwise
as the DRIP Agent shall determine.
There
are no brokerage charges with respect to shares of common stock issued directly by the Company. However, whenever shares are purchased
or sold on the NYSE or otherwise on the open market, each participant will pay a pro rata portion of brokerage trading fees, currently
$0.07 per share purchased or sold. Brokerage trading fees will be deducted from amounts to be invested.
Holders
of the Company’s common stock can also sell shares held in the DRIP account at any time by contacting the DRIP Agent in
writing at Equiniti Trust Company, LLC, P.O. Box 922, Wall Street Station, New York, NY 10269-0560. The DRIP Agent will mail a
check to such holder (less applicable brokerage trading fees) on the settlement date, which is three business
days after the shares
have been sold. If a stockholder chooses to sell its shares through a broker, the holder will need to request that the DRIP Agent
electronically transfer their shares to the broker through the Direct Registration System.
Stockholders
participating in the DRIP may withdraw from the DRIP at any time by contacting the DRIP Agent in writing at Equiniti Trust Company,
LLC, P.O. Box 922, Wall Street Station, New York, NY 10269-0560. Such termination will be effective immediately if the notice
is received by the DRIP Agent prior to any dividend or distribution record date; otherwise, such termination will be effective
on the first trading day after the payment date for such dividend or distribution and thus apply to any subsequent dividend or
distribution. If a holder of the Company’s common stock withdraws, full shares will be credited to their account, and the
stockholder will be sent a check for the cash adjustment of any fractional share at the market value per share of the Company’s
common stock as of the close of business on the day the termination is effective, less any applicable fees. Alternatively, if
the stockholder wishes, the DRIP Agent will sell their full and fractional shares and send them the proceeds, less a transaction
fee of $15.00 and less brokerage trading fees of $0.07 per share. If a stockholder does not maintain at least one whole share
of common stock in the DRIP account, the DRIP Agent may terminate such stockholder’s participation in the DRIP after written
notice. Upon termination, stockholders will be sent a check for the cash value of any fractional share in the DRIP account, less
any applicable broker commissions and taxes.
Stockholders
who are not participants in the DRIP, but hold at least one full share of our common stock, may join the DRIP by notifying the
DRIP Agent in writing at Equiniti Trust Company, LLC, P.O. Box 922, Wall Street Station, New York, NY 10269-0560. If received
in proper form by the DRIP Agent before the record date of a dividend, the election will be effective with respect to all dividends
paid after such record date. If a stockholder wishes to participate in the DRIP and their shares are held in the name of a brokerage
firm, bank or other nominee, the stockholder should contact their nominee to see if it will participate in the DRIP. If a stockholder
wishes to participate in the DRIP, but the brokerage firm, bank or other nominee is unable to participate on their behalf, the
stockholder will need to request that their shares be re-registered in their own name, or the stockholder will not be able to
participate. The DRIP Agent will administer the DRIP on the basis of the number of shares certified from time to time by the stockholder
as representing the total amount registered in their name and held for their account by their nominee.
Experience
under the DRIP may indicate that changes are desirable. Accordingly, the Company and the DRIP Agent reserve the right to amend
or terminate the DRIP upon written notice to each participant at least 30 days before the record date for the payment of any dividend
or distribution by the Company.
All
correspondence or additional information about the DRIP should be directed to Equiniti Trust Company, LLC, 6201 15th Avenue, Brooklyn,
NY 11219.
Additional
Information
Management
Our
Board of Directors (the “Board”) is responsible for managing the Company’s affairs, including the appointment
of advisers and sub-advisers. The Board has appointed officers who assist in managing the Company’s day-to-day affairs.
The
Board
The
Board currently consists of six members, four of whom are not “interested persons”
(as defined in the 1940 Act) of the Company. The Company refers to these directors as
the Company’s “independent directors.”
Under
our certificate of incorporation and bylaws, our board of directors is divided into three classes with staggered terms, with the
term of only one of the three classes expiring at each annual meeting of our stockholders. The classification of the board across
staggered terms may prevent replacement of a majority of the directors for up to a two-year period.
The
directors and officers of the Company are listed below. Except as indicated, each individual has held the office shown or other
offices with the same company for the last five years. Certain of the Company’s officers and directors also are officers
or managers of our Adviser and its affiliates. Each of our directors also serves as a director/trustee of Eagle Point Credit Company
Inc., and Eagle Point Institutional Income Fund, each a registered investment company for which an affiliate of our Adviser serves
as investment adviser.
Name,
Address1
and
Age |
|
Position(s)
held with
the
Company |
|
Term of Office and
Length of Time Served |
|
Principal
Occupation(s)
During
the Past 5 Years |
|
Other
Directorships3 |
| |
|
|
|
|
|
|
Interested
Directors2 |
|
|
|
|
|
|
| |
|
|
|
|
|
|
|
|
Thomas
P. Majewski
Age: 49 |
|
Class
III Director, Chief Executive Officer, and Chairman of the Board |
|
Since
inception;
Term
expires 2026
|
|
Managing
Partner of Eagle Point Credit Management LLC (including certain affiliated advisers, such as the Adviser) since September
2012. Chief Executive Officer of Eagle Point Credit Company Inc. since May 2014; Eagle Point Institutional Income Fund since
January 2022; and Eagle Point Enhanced Income Trust since August 2023. |
|
Eagle
Point Credit Company Inc., Eagle Point Institutional Income Fund, and Eagle Point Enhanced Income Trust |
| |
|
|
|
|
|
|
|
|
James
R. Matthews
Age: 56 |
|
Class
II Director |
|
Since
inception;
Term
expires 2025
|
|
Managing
Director of Stone Point Capital LLC since October 2011. |
|
Eagle
Point Credit Company Inc., Eagle Point Institutional Income Fund, and Eagle Point Enhanced Income Trust |
| |
|
|
|
|
|
|
| Independent
Directors |
|
|
|
|
|
|
| |
|
|
|
|
|
|
|
|
Scott
W. Appleby
Age: 59
|
|
Class
I Director |
|
Since
inception;
Term
expires 2024 |
|
President
of Appleby Capital, Inc., a financial advisory firm, since April 2009. |
|
Eagle
Point Credit Company Inc., Eagle Point Institutional Income Fund, and Eagle Point Enhanced Income Trust |
Name,
Address1
and
Age |
|
Position(s)
held with
the
Company |
|
Term
of Office and
Length
of Time Served |
|
Principal
Occupation(s)
During
the Past 5 Years |
|
Other
Directorships3 |
Kevin
F. McDonald
Age: 57 |
|
Class
III Director |
|
Since
inception;
Term
expires 2026 |
|
Chief
Operating Officer of AltaRock Partners, an asset management firm, since January 2019;
Director of Business Development and Investor Relations of Folger Hill Asset Management,
LP from December 2014 to July 2018. |
|
Eagle
Point Credit Company Inc., Eagle Point Institutional Income Fund, and Eagle Point Enhanced
Income Trust |
| |
|
|
|
|
|
|
|
|
Paul
E. Tramontano
Age: 62
|
|
Class
II Director |
|
Since
inception;
Term
expires 2025 |
|
Executive Managing Director at Cresset
Asset Management, LLC since April 2023; Senior Managing Director and Wealth Manager at First Republic Investment Management
from October 2015 to April 2023. |
|
Eagle
Point Credit Company Inc., Eagle Point Institutional Income Fund, and Eagle Point Enhanced Income Trust |
| |
|
|
|
|
|
|
|
|
Jeffrey
L. Weiss
Age: 62 |
|
Class
I Director |
|
Since
inception;
Term
expires 2024 |
|
Private Investor since June 2012;
Managing Partner of Colter Lewis Investment Partners since January 2018. |
|
Eagle
Point Credit Company Inc., Eagle Point Institutional Income Fund, and Eagle Point Enhanced Income Trust |
| 1 | The
business address of each of our directors is c/o Eagle Point Income Company Inc., 600
Steamboat Road, Suite 202, Greenwich, Connecticut 06830. |
| 2 | Mr.
Majewski is an interested director due to his position as our Chief Executive Officer
and his position with the Adviser. Mr. Matthews is an interested director due to his
position with Stone Point Capital LLC, which is an affiliate of the Adviser. |
| 3 | Eagle
Point Credit Company Inc., Eagle Point Institutional Income Fund, and Eagle Point Enhanced
Income Trust are each considered to be in the same fund complex as us and, as a result,
each director serves as a director/trustee of four investment companies in the same complex.
Each director was elected as trustee of Eagle Point Institutional Income Fund and Eagle
Point Enhanced Income Trust in January 2022 and August 2023, respectively. |
The
Company’s registration statement, prospectus and proxy statement for the annual stockholders’ meeting include additional
information about our directors. A copy of the prospectus and proxy statement is available free of charge at www.eaglepointincome.com
or upon request by calling (844) 810-6501.
Officers
Information
regarding our officers who are not directors is as follows:
Name,
Address1
and
Age |
|
Positions
Held with the
Company |
|
Term
of Office and
Length
of Time
Served2 |
|
Principal
Occupation(s)
During
the Last Five Years |
| |
|
|
|
|
|
|
Kenneth
P. Onorio
Age: 56
|
|
Chief
Financial Officer and Chief Operating Officer
|
|
Since
inception
|
|
Chief Financial Officer of Eagle Point Credit Company Inc. since July 2014 and Chief Operating Officer of Eagle Point Credit
Company Inc. since November 2014; Chief Financial Officer and Chief Operating Officer of Eagle Point Institutional Income
Fund since January 2022; Chief Financial Officer and Chief Operating Officer of Eagle Point Enhanced Income Trust since August
2023; Chief Financial Officer of Eagle Point Credit Management (including certain affiliated advisers, such as the Adviser)
since July 2014; Chief Operating Officer of Eagle Point Credit Management (including certain affiliated advisers, such as
the Adviser) since August 2014. |
| |
|
|
|
|
|
|
Nauman
S. Malik
Age:
43
|
|
Chief
Compliance Officer |
|
Since
inception |
|
Chief
Compliance Officer of Eagle Point Credit Company Inc. since September 2015, Eagle Point Institutional
Income Fund since January
|
| |
|
|
|
|
|
|
| |
|
|
|
|
|
2022,
and Eagle Point Enhanced Income Trust since August 2023; General Counsel of Eagle Point
Credit Management (including certain affiliated advisers, such as the Adviser) since
June 2015; Chief Compliance Officer of the Adviser from October 2018 to March 2020 and
Eagle Point Credit Management from September 2015 to March 2020. |
| |
|
|
|
|
|
|
Courtney
B. Fandrick
Age:
41
|
|
Secretary |
|
Since
inception |
|
Chief
Compliance Officer of Eagle Point Credit Management (including certain affiliated advisers,
such as the Adviser) since April 2020; Secretary of Eagle Point Credit Company Inc. since
August 2015, Eagle Point Institutional Income Fund since January 2022, and Eagle Point Enhanced
Income Trust since August 2023; Deputy Chief Compliance Officer of the Adviser from October
2018 to March 2020 and Eagle Point Credit Management from December 2014 to March 2020.
|
| 1 | The
business address of each of our officers is c/o Eagle Point Income Company Inc., 600
Steamboat Road, Suite 202, Greenwich, Connecticut 06830. All of our officers are officers
or employees of the Adviser or affiliated companies. |
| 2 | Each
officer holds office until his or her successor is chosen and qualifies, or until his
or her earlier resignation or removal. |
Director
and Officer Compensation
Our
independent directors received compensation from the Company in the amounts set forth in the following table during the fiscal
year ended December 31, 2023.
| Name |
|
Aggregate
Compensation
from
the Company1, 2 |
| |
|
|
Scott
W. Appleby |
|
$65,000 |
| Kevin
F. McDonald |
|
$60,000
|
| Paul
E. Tramontano |
|
$60,000
|
| Jeffrey
L. Weiss |
|
$70,000 |
TOTAL |
|
$255,000* |
* Reflects
$32,500, $30,000, $30,000, and $35,000 relating to the year ended December 31, 2022 that was payable to each of Mr. Appleby, Mr.
McDonald, Mr. Tramontano and Mr. Weiss as of December 31, 2022, respectively, and paid during the year ended December 31, 2023;
does not reflect $127,500 relating to the year ended December 31, 2023 that was paid during the month ended January 31, 2024,
which amount was comprised of $32,500, $30,000, $30,000, and $35,000 paid to each of Mr. Appleby, Mr. McDonald, Mr. Tramontano
and Mr. Weiss, respectively.
| 1 | For
a discussion of the independent directors’ compensation, see below. |
| 2 | The
Company does not maintain a pension plan or retirement plan for any of our directors. |
As
compensation for serving on the Board, each independent director receives an annual fee of $60,000, as well as reasonable out-of-pocket
expenses incurred in attending Board and committee meetings. The chairman of the audit committee receives an additional annual
fee of $10,000 and the chairman of the nominating committee receives an additional annual fee of $5,000 for their additional services
in these capacities.
No
compensation is, or is expected to be, paid by us to our directors who are “interested persons” of us, as such term
is defined in the 1940 Act, or to our officers. Our officers are compensated by the Adviser or one of its affiliates, as applicable.
We
have entered into an Administration Agreement pursuant to which Eagle Point Administration LLC, our administrator (“Eagle
Point Administration”), performs, or arranges for the performance of, our required administrative services, among other
things. Payments under the Administration Agreement are equal to an amount based upon our allocable portion of Eagle Point Administration’s
overhead in performing its obligations under the Administration Agreement, including rent, the fees
and expenses associated with
performing compliance functions and our allocable portion of the compensation of our chief financial officer and chief compliance
officer and our allocable portion of the compensation of any administrative support staff. Our allocable portion of such total
compensation is based on an allocation of the time spent on us relative to other matters. The Administration Agreement will remain
in effect if approved by the Board, including by a majority of our independent directors, on an annual basis. The Administration
Agreement was most recently approved by the Board in May 2023.
Stockholder
Meeting Information
An
annual meeting of stockholders of the Company was held on May 11, 2023. At the meeting, the two nominees for re-election as Class
III directors, Thomas P. Majewski and Kevin F. McDonald, were each elected to serve as a director for a term expiring at the Company’s
2026 annual meeting or until his successor is duly elected and qualified. A discussion regarding the voting at such meeting is
available in our Semiannual Report for the period ended June 30, 2023. A copy of the Semiannual Report is available free of charge
at www.eaglepointincome.com, upon request by calling (844) 810-6501, or from the EDGAR Database on the SEC’s website (www.sec.gov).
Investment
Advisory Agreement
Subject
to the overall supervision of our Board, the Adviser manages the day-to-day operations of, and provides investment advisory and
management services to, us pursuant to an Investment Advisory Agreement (the “Advisory Agreement”). A discussion regarding
the basis for the Board’s approval of the Advisory Agreement is available in our Semiannual Report for the period ended
June 30, 2023. A copy of the Semiannual Report is available free of charge at www.eaglepointincome.com, upon request by calling
(844) 810-6501, or from the EDGAR Database on the SEC’s website (www.sec.gov).
Portfolio
Information
The
Company files its complete schedule of portfolio holdings with the SEC for the first and third quarters of each fiscal year as
an exhibit to its reports on Form N-PORT. The Company’s Form N-PORT is available without charge, upon request by calling
(844) 810-6501, or from the EDGAR Database on the SEC’s website (www.sec.gov).
Proxy
Information
The
Company has delegated its proxy voting responsibility to the Adviser. A description of these policies and procedures is available
(1) without charge, upon request, by calling toll free (844) 810-6501; and (2) in the Company’s pre-effective amendment
to its registration statement on Form N-2 filed on June 28, 2023 with the SEC, which can be found on the SEC’s website (www.sec.gov).
Information
regarding how the Company voted proxies relating to portfolio securities for the 12-month period ending June 30, 2023 is available:
(1) without charge, upon request, by calling toll free (844) 810-6501; and (2) in the Company’s Form N-PX filing, which
can be found on the SEC’s website (www.sec.gov).
The Company also makes this information available on its website at www.eaglepointincome.com.
Tax
Information
For
the tax year ended December 31, 2023, the Company recorded distributions on our common stock equal to $1.98 per share or $18.1
million.
Privacy
Notice
The
Company is committed to protecting your privacy. This privacy notice explains the privacy policies of Eagle Point Income Company
Inc. and its affiliated companies. The terms of this notice apply to both current and former stockholders. The Company will safeguard,
according to strict standards of security and confidentiality, all information it receives about you. With regard to this information,
the Company maintains procedural safeguards that are reasonably designed to comply with
federal standards. We have implemented
procedures that are designed to restrict access to your personal information to authorized employees of the Company’s investment
adviser, Eagle Point Income Management, LLC and its affiliates who need to know your personal information to perform their jobs,
and in connection with servicing your account. The Company’s goal is to limit the collection and use of information about
you. While we may share your personal information with our affiliates in connection with servicing your account, our affiliates
are not permitted to share your information with non-affiliated entities, except as permitted or required by law.
When
you purchase shares of the Company’s common stock and in the course of providing you with products and services, we and
certain of our service providers, such as a transfer agent, may collect personal information about you, such as your name, address,
social security number or tax identification number. This information may come from sources such as account applications and other
forms, from other written, electronic or verbal correspondence, from your transactions, from your brokerage or financial advisory
firm, financial adviser or consultant, and/or information captured on applicable websites.
We
do not disclose any personal information provided by you or gathered by us to non-affiliated third parties, except as permitted
or required by law or for our everyday business purposes, such as to process transactions or service your account. For example,
we may share your personal information in order to send you annual and semiannual reports, proxy statements and other information
required by law, and to send you information the Company believes may be of interest to you. We may disclose your personal information
to unaffiliated third-party financial service providers (which may include a custodian, transfer agent, accountant or financial
printer) who need to know that information in order to provide services to you or to the Company. These companies are required
to protect your information and use it solely for the purpose for which they received it or as otherwise permitted by law. We
may also provide your personal information to your brokerage or financial advisory firm and/or to your financial adviser or consultant,
as well as to professional advisors, such as accountants, lawyers and consultants.
We
reserve the right to disclose or report personal or account information to non-affiliated third parties in limited circumstances
where we believe in good faith that disclosure is required by law, such as in accordance with a court order or at the request
of government regulators or law enforcement authorities or to protect our rights or property. We may also disclose your personal
information to a non-affiliated third party at your request or if you consent in writing to the disclosure.
If
you have any queries or concerns about the privacy of your personal information, please contact our investor relations team at
(203) 340-8510 or (844) 810-6501.
We
will review this policy from time to time and may update it at our discretion.
* * *
End
of Annual Report. Back Cover Follows.

Item
2. Code of Ethics
As
of the end of the period covered by this report, Eagle Point Income Company Inc. (the “registrant”) has adopted a code of
ethics that applies to the registrant’s principal executive officer, principal financial officer, principal accounting officer
or controller, or persons performing similar functions, regardless of whether these individuals are employed by the registrant or a third
party (the “SOX Code of Ethics”). The registrant did not amend, or grant any waivers from, any provisions of the SOX Code
of Ethics during the period covered by this report. The registrant’s SOX Code of Ethics is available upon request to any person
without charge. Such requests should be submitted to the registrant’s Chief Compliance Officer at (203) 340-8500, toll free (844)
810-6501 or cco@eaglepointcredit.com.
Item
3. Audit Committee Financial Expert
The
registrant’s board of directors has determined that the registrant has at least one “audit committee financial expert”
(as defined in Item 3 of Form N-CSR) serving on its Audit Committee. The board of directors has determined that Jeffrey L. Weiss satisfies
the requirements of an audit committee financial expert. Mr. Weiss is “independent” within the meaning of that term used
in Form N-CSR.
Item
4. Principal Accountant Fees and Services
| (a) | Audit
Fees. The aggregate fees billed for professional services rendered by KPMG LLP (“KPMG”),
the registrant’s independent registered public accounting firm, for the audit of the
registrant’s annual financial statements or services that are normally provided by
the accountant in connection with statutory and regulatory filings or engagements for the
fiscal years ended December 31, 2022 and December 31, 2023 were $168,000 and $186,500, respectively. |
| (b) | Audit-Related
Fees. The aggregate fees billed for assurance and related services by KPMG that are reasonably
related to the performance of the audit of the registrant’s financial statements and
not reported under paragraph (a) of this Item 4 in the fiscal years ended December 31, 2022
and December 31, 2023 were $224,000 and $209,000, respectively. These fees include
audit-related services in connection with the registrant’s “at the market”
common stock and preferred stock issuance program, the filing of its registration statement
for a committed equity facility and the issuance of 7.75% Series B Term Preferred Stock due
2028 |
| (c) | Tax
Fees. The aggregate fees billed for professional services by KPMG for tax compliance,
tax advice and tax planning in the fiscal years ended December 31, 2022 and December 31,
2023 were $67,685 and $97,391, respectively. These fees were in connection with the
preparation of the registrant’s regulated investment company tax compliance and related
tax advice |
| (d) | All
Other Fees. The aggregate fees billed for all other services not listed in (a) through
(c) above by KPMG in the fiscal years ended December 31, 2022 and December 31, 2023 were
$0 and $0, respectively. |
| (e) | (1)
The registrant’s Audit Committee has adopted written policies relating to the pre-approval
of audit and permitted non-audit services to be performed by the registrant’s independent
registered public accounting firm. Under the policies, on an annual basis, the registrant’s
Audit Committee reviews and pre-approves proposed audit and permitted non-audit services
to be performed by the independent registered public accounting firm on behalf of the registrant. |
In
addition, the registrant’s Audit Committee pre-approves annually any permitted non-audit services (including audit-related services)
to be provided by the independent registered public accounting firm to the registrant’s investment adviser and any entity controlling,
controlled by, or under common control with the registrant’s investment adviser that provides ongoing services to the registrant
(together, the “Service Affiliates”), provided, in each case, that the engagement relates directly to the operations and
financial reporting of the registrant. Although the Audit Committee does not pre-approve all services provided by the independent registered
public accounting firm to Service Affiliates (for instance, if the engagement does not relate directly to the operations and financial
reporting of the registrant), the Audit Committee receives an annual report showing the aggregate fees paid by Service Affiliates for
such services.
The
registrant’s Audit Committee may also from time to time pre-approve individual non-audit services to be provided to the registrant
or a Service Affiliate that were not pre-approved as part of the annual process described above. The Audit Committee may form and delegate
authority to subcommittees consisting of one (1) or more members when appropriate, including the authority to grant pre-approvals of
audit and permitted non-audit services, provided that any decisions of such subcommittee to grant pre-approvals shall be presented
to the full Audit Committee at its next scheduled meeting.
The
pre-approval policies provide for waivers of the requirement that the Audit Committee pre-approve permitted non-audit services provided
to the registrant pursuant to de minimis exceptions described in Section 10A of the Securities Exchange Act of 1934, as amended (the
“Exchange Act”) and applicable regulations.
(2)
None of the independent accountant’s expenses described in paragraphs (b) through (d) of this item were approved by the Audit Committee
pursuant to paragraph (c)(7)(i)(C) of Rule 2-01 of Regulation S-X as all such expenses were pre-approved by the Audit Committee.
| (g) | For
the fiscal years ended December 31, 2022 and December 31, 2023, the aggregate fees billed
by KPMG for non-audit services rendered to the registrant and for non-audit services rendered
to the registrant’s investment adviser and/or to any entity controlling, controlled
by or under common control with the registrant’s investment adviser that provides ongoing
services to the registrant were $291,685 and $306,391, respectively. For the years
ended December 31, 2022 and December 31, 2023, these fees were for the services rendered
in connection with tax compliance, tax advice, tax planning, the registrant’s “at
the market” common stock and preferred stock issuance program, the filing of its registration
statement for a committed equity facility, and the offering of 7.75% Series B Term Preferred
Stock. These fees exclude any fees paid by Eagle Point Credit Management LLC and its affiliates |
| (h) | The
registrant’s Audit Committee has considered whether the provision of non-audit services
that were rendered to the investment adviser and/or to any entity controlling, controlled
by or under common control with the registrant’s investment adviser that provides ongoing
services to the registrant that were not required to be pre-approved pursuant to paragraph
(c)(7)(ii) of Rule 2-01 of Regulation S-X is compatible with maintaining KPMG’s independence. |
Item
5. Audit Committee of Listed Registrant
| (a) | The
registrant has a separately-designated standing Audit Committee established in accordance
with Section 3(a)(58)(A) of the Exchange Act. The members of the committee are Jeffrey L.
Weiss (chair), Scott Appleby, Kevin McDonald and Paul Tramontano. |
Item
6. Investments
| (a) | A
schedule of investments is included in the Company’s report to stockholders under Item
1. |
Item
7. Disclosure of Proxy Voting Policies and Procedures for Closed-End Management Investment Companies
The
registrant has delegated its proxy voting responsibility to the Adviser. The Proxy Voting Policies and Procedures of the Adviser are
set forth below. The guidelines will be reviewed periodically by the Adviser and the registrant’s independent directors, and, accordingly,
are subject to change.
Introduction
An
investment adviser registered under the Investment Advisers Act of 1940, as amended (the “Advisers Act”) has a fiduciary
duty to act solely in the best interests of its clients. As part of this duty, the Adviser recognizes that it must vote client securities
in a timely manner free of conflicts of interest and in the best interests of the Adviser’s clients.
These
policies and procedures for voting proxies for the Adviser’s investment advisory clients are intended to comply with Section 206
of, and Rule 206(4)-6 under, the Advisers Act.
Proxy
Policies
Based
on the nature of the registrant’s investment strategy, the Adviser does not expect to receive proxy proposals but may from time
to time receive amendments, consents or resolutions applicable to investments held by the registrant. The Adviser’s general policy
is to exercise voting or consult authority in a manner that serves the interests of the registrant’s stockholders. The Adviser
may occasionally be subject to material conflicts of interest in voting proxies due to business or personal relationships it maintains
with persons having an interest in the outcome of certain votes. If at any time the Adviser becomes aware of a material conflict of interest
relating to a particular proxy proposal, the Adviser’s Chief Compliance Officer will review the proposal and determine how to vote
the proxy in a manner consistent with interests of the registrant’s stockholders.
Proxy
Voting Records
Information
regarding how the Adviser voted proxies relating to the registrant’s portfolio securities is available: (1) without charge, upon
request, by calling toll free (844) 810-6501; and (2) on the SEC’s website at http://www.sec.gov. You may also obtain
information about how the Adviser voted proxies by making a written request for proxy voting information to: Eagle Point Income Management
LLC, 600 Steamboat Road, Suite 202, Greenwich, CT 06830 or cco@eaglepointcredit.com.
Item
8. Portfolio Managers of Closed-End Investment Companies
Information
pertaining to the portfolio managers of the registrant, and information relating to the registrant’s investment adviser, is set
forth below as of December 31, 2023.
The
management of the registrant’s investment portfolio is the responsibility of the Adviser pursuant to an investment advisory agreement
(“Investment Advisory Agreement”).
Our
executive officers and directors, and the Adviser and certain of its affiliates and their officers and employees, including the senior
investment team, have several conflicts of interest as a result of the other activities in which they engage. The Adviser is affiliated
with other entities engaged in the financial services business. Also, under a personnel and resources agreement, Eagle Point Credit Management
LLC makes available certain personnel and resources, including portfolio managers and investment personnel, to the Adviser as the Adviser
may determine to be reasonably necessary to the conduct of its operations. These relationships may cause the Adviser’s and certain
of its affiliates’ interests, and the interests of their officers and employees, including the senior investment team, to diverge
from the registrant’s interests and may result in conflicts of interest that may not be foreseen or resolved in a manner that is
always or exclusively in the registrant’s best interest. The Adviser has entered into, and may in the future enter into additional,
business arrangements with certain of the registrant’s stockholders. In such cases, such stockholders may have an incentive to
vote shares held by them in a manner that takes such arrangements into account.
There
are no restrictions on the ability of the Adviser and certain of its affiliates to manage accounts for multiple clients, including accounts
for affiliates of the Adviser or their directors, officers or employees, following the same, similar or different investment objectives,
philosophies and strategies as those used by the Adviser for the registrant’s account. In those situations, the Adviser and its
affiliates may have conflicts of interest in allocating investment opportunities between the registrant and any other account managed
by the Adviser or an affiliate. Such conflicts of interest would be expected to be heightened where the Adviser manages an account for
an affiliate or its directors, officers or employees. In addition, certain of these accounts may provide for higher management fees or
have incentive fees or may allow for higher expense reimbursements, all of which may contribute to a conflict of interest and create
an incentive for the Adviser to favor such other accounts. Further, accounts managed by the Adviser or certain of its affiliates hold,
and may in the future be allocated, certain investments in collateralized loan obligations (“CLOs”), such as debt tranches,
which conflict with the positions held by other accounts in such CLOs, such as the registrant. In these cases, when exercising the rights
of each account with respect to such investments, the Adviser and/or its affiliates will have a conflict of interest as actions on behalf
of one account may have an adverse effect on another account managed by the Adviser or such affiliate, including the registrant. In such
cases, such conflicts may not be resolved in a manner that is always or exclusively in our best interests.
In
addition, certain of the Adviser’s affiliates (and the investment funds that they manage) may also invest in companies that compete
with the Adviser and that therefore manage other accounts and funds that compete for investment opportunities with the registrant. The
registrant’s executive officers and Directors, as well as other current and potential future affiliated persons, officers and employees
of the Adviser and certain of its affiliates, may serve as officers, directors or principals of, or manage the accounts for, other entities
with investment strategies that substantially or partially overlap with the strategy that the registrant pursues. Accordingly, they may
have obligations to investors in those entities, the fulfillment of which obligations may not be in the best interests of the registrant
or the registrant’s common stockholders.
Further,
the professional staff of the Adviser will devote as much time to the registrant as such professionals deem appropriate to perform their
duties in accordance with the Investment Advisory Agreement. However, such persons are also committed to providing investment advisory
and other services for other clients and engage in other business ventures in which the registrant has no interest. Certain of the Adviser’s
and its affiliates’ senior personnel and ultimate managers serve and may serve as officers, directors, managers or principals of
other entities that operate in the same or a related line of business as the Adviser, and its affiliates, or that are service providers
to firms or entities such as the Adviser, the registrant, CLOs or other similar entities. Accordingly, such persons may have obligations
to investors in those entities the fulfillment of which may not be in the registrant’s best interest. In addition, certain of such
persons hold direct and indirect personal investments in various companies, including certain investment advisers and other operating
companies, some of which do or may provide services to the Adviser, the registrant, or other accounts serviced by the Adviser or its
affiliates, or to any issuer in which the registrant may invest. The registrant may pay fees or other compensation to any such operating
company or financial institution for services received. Further, these relationships may result in conflicts of interest that may not
be foreseen or may not be resolved in a manner that is always or exclusively in the registrant’s best interest. As a result of
these separate business activities and payment structures, the Adviser and the portfolio managers have conflicts of interest in allocating
management time, services and functions among the registrant and its affiliates and other business ventures or clients.
As
a fiduciary, the Adviser owes a duty of loyalty to its clients, including the registrant, and must treat each client fairly. When the
Adviser purchases or sells securities for more than one account, the trades must be allocated in a manner consistent with its fiduciary
duties. To this end, the Adviser and Eagle Point Credit Management LLC have adopted and reviewed policies and procedures pursuant to
which it allocates investment opportunities appropriate for more than one client account in a manner deemed appropriate in its sole discretion
to achieve a fair and equitable result over time. Pursuant to these policies and procedures, when allocating investment opportunities,
the Adviser and Eagle Point Credit Management LLC may take into account regulatory, tax or legal requirements applicable to an account.
In allocating investment opportunities, the Adviser may use rotational, percentage or other allocation methods provided that doing so
is consistent with the Adviser’s and Eagle Point Credit Management LLC’s internal conflict of interest and allocation policies
and the requirements of the Advisers Act, the Investment Company Act of 1940, as amended (the “1940 Act”), and other applicable
laws. In addition, an account managed by the Adviser, such as the registrant, is expected to be considered for the allocation of investment
opportunities together with other accounts managed by affiliates of the Adviser and Eagle Point Credit Management. There is no assurance
that investment opportunities will be allocated to any particular account equitably in the short-term or that any such account, including
the registrant, will be able to participate in all investment opportunities that are suitable for it.
In
the ordinary course of business, the registrant may enter into transactions with persons who are affiliated with the registrant by reason
of being under common control of the Adviser or its affiliates. In order to ensure that the registrant does not engage in any prohibited
transactions with any affiliated persons, the registrant has implemented certain policies and procedures whereby its executive officers
screen each of its transactions for any possible affiliations between the registrant, the Adviser and its affiliates and the registrant’s
employees, officers and directors. The registrant will not enter into any such transactions unless and until it is satisfied that doing
so is consistent with the 1940 Act, applicable SEC exemptive rules, interpretations or guidance, or the terms of the registrant’s
exemptive order (discussed below), as applicable. The registrant’s affiliations may require it to forgo attractive investment opportunities.
The
registrant may co-invest on a concurrent basis with other accounts managed by the Adviser and may do so with other accounts managed by
certain of the Adviser’s affiliates subject to compliance with applicable regulations and regulatory guidance and applicable written
allocation procedures. The registrant is able to rely on the exemptive relief granted by the SEC to Eagle Point Credit Management LLC
and certain of its affiliates to participate in certain negotiated co-investments alongside other accounts managed by Eagle Point Credit
Management LLC or certain of its affiliates, including Eagle Point Credit Company Inc. and Eagle Point Institutional Income Fund, subject
to certain conditions, including that (i) a majority of the registrant’s directors who have no financial interest in the transaction
and a majority of the registrant’s directors who are not interested persons, as defined in the 1940 Act, of the registrant approve
the co-investment and (ii) the price, terms and conditions of the co-investment are the same for each participant. The Adviser may determine
not to allocate certain potential co-investment opportunities to the registrant after taking into account regulatory requirements or
other considerations. A copy of the registrant’s application for exemptive relief, including all of the conditions, and the related
order are available on the SEC’s website at www.sec.gov.
In
order to address such conflicts of interest, the registrant has adopted a Code of Ethics. Similarly, the Adviser has separately adopted
a Code of Ethics (“Code”). The Adviser’s Code requires the officers and employees of the Adviser to act in the best
interests of its client accounts (including the registrant), act in good faith and in an ethical manner, avoid conflicts of interests
with the client accounts to the extent reasonably possible and identify and manage conflicts of interest to the extent that they arise.
Personnel subject to each code of ethics may invest in securities for their personal investment accounts, including securities that may
be purchased or held by us, so long as such investments are made in accordance with the code’s requirements. The registrant’s
Directors and officers, and the officers and employees of the Adviser, are also required to comply with applicable provisions of the
U.S. federal securities laws and make prompt reports to supervisory personnel of any actual or suspected violations of law.
In
addition, the Adviser has built a professional working environment, firm-wide compliance culture and compliance procedures and systems
designed to protect against potential incentives that may favor one account over another. The Adviser has adopted policies and procedures
that address the allocation of investment opportunities, execution of portfolio transactions, personal trading by employees and other
potential conflicts of interest that are designed to ensure that all client accounts are treated equitably over time.
Investment
Personnel. The senior investment team of the Adviser is primarily responsible for the registrant’s day-to-day investment management
and the implementation of the registrant’s investment strategy and process, with oversight provided by the Adviser’s board
of managers. Biographical information on the senior investment team, each of whom has served as a portfolio manager since the registrant’s
inception, is set forth below:
Thomas
P. Majewski, Managing Partner (Since November 2012).
Mr.
Majewski is the Founder and Managing Partner of the Adviser. He manages the Adviser and its affiliates (“Eagle Point” or
the “firm”) and oversees all of the firm’s investment offerings. Mr. Majewski is Chairman of the firm’s Investment
Committee.
Mr.
Majewski has over 28 years of experience in credit and structured finance. He led the creation of some of the earliest refinancing CLOs,
pioneering techniques that are now commonplace in the market. Prior to founding Eagle Point in 2012, Mr. Majewski held leadership positions
within the fixed income divisions at J.P. Morgan, Merrill Lynch, Bear Stearns, and Royal Bank of Scotland. He was the US Country Head
at AMP Capital/AE Capital, where he oversaw a diverse portfolio of credit and other private investments on behalf of Australian investors.
Mr. Majewski began his career in the securitization group at Arthur Andersen.
Mr.
Majewski also serves as a director and Chief Executive Officer of Eagle Point Credit Company; director, Chairman and Chief Executive
Officer of Eagle Point Income Company; and trustee, Chairman and Chief Executive Officer of Eagle Point Enhanced Income Trust.
Mr.
Majewski holds a BS in Accounting from Binghamton University.
Daniel
W. Ko, Principal and Portfolio Manager (Since December 2012). Mr. Ko is a Senior Principal and Portfolio Manager at
the Adviser. He is a member of the firm’s Investment Committee.
Mr.
Ko has over 17 years of experience in structured finance. Prior to joining Eagle Point in 2012, he was a Vice President in Bank of America’s
(f/k/a Bank of America Merrill Lynch) CLO structuring group, where he modeled cash flows, negotiated terms with debt and equity investors,
and coordinated the rating process. Mr. Ko was also responsible for exploring non-standard structuring initiatives, including financing
trades with dynamic leverage, emerging market CBOs and European CLOs. Earlier, he managed their legacy CLO, TruPS CDO, and ABS CDO portfolios
and started in their CDO/CLO structuring group.
Mr.
Ko holds a BS in Finance and Accounting, magna cum laude, from The Wharton School of the University of Pennsylvania..
Daniel
M. Spinner (CAIA), Principal and Portfolio Manager (Since February 2013). Mr. Spinner is a Senior Principal and Portfolio
Manager at the Adviser. He is a member of the firm’s Investment Committee.
Mr.
Spinner has over 27 years of experience in credit and advising, financing, and investing in alternative asset management firms and funds.
He has been involved in the credit markets for the majority of his career. Prior to joining Eagle Point in 2013, Mr. Spinner oversaw
the Private Equity, Special Opportunities Credit, and Real Estate allocations for the 1199SEIU Benefit and Pension Funds. He was also
a Managing Director in the Financial Institutions Group at Bear Stearns focused on alternative asset managers, and a co-founder and President
of Structured Capital Partners (a financial holding company formed to invest in CLO and structured credit managers). Mr. Spinner started
his career in the Financial Institutions Group at Chase Manhattan Bank.
Mr.
Spinner holds a BA in Business Management, summa cum laude, from Gettysburg College and an MBA from Columbia Business School.
The
following table sets forth other accounts within each category listed for which members of the senior investment team are jointly and
primarily responsible for day-to-day portfolio management as of December 31, 2023. Among the accounts listed below, three of the “Registered
Investment Companies” (with total assets of $1,056.3), eight of the “Other Pooled Investment Vehicles” (with total
assets of $2,645.3) and 32 of the “Other Accounts” (with total assets of $2,072) are subject to a performance fee.
| | |
Registered Investment Companies | | |
Other Pooled
Investment Vehicles | | |
Other
Accounts | |
| Portfolio
Manager | |
Number
of
Accounts | | |
Total
Assets
(in millions) | | |
Number
of
Accounts | | |
Total
Assets
(in millions) | | |
Number
of
Accounts | | |
Total
Assets
(in millions) | |
| Thomas
P. Majewski | |
| 3 | | |
$ | 1,056.3 | | |
| 13 | | |
$ | 3,283.8 | | |
| 61 | | |
$ | 5,265.2 | |
| Daniel
W. Ko | |
| 3 | | |
$ | 1,056.3 | | |
| 13 | | |
$ | 3,283.8 | | |
| 61 | | |
$ | 5,265.2 | |
| Daniel
M. Spinner | |
| 3 | | |
$ | 1,056.3 | | |
| 13 | | |
$ | 3,283.8 | | |
| 61 | | |
$ | 5,265.2 | |
*
Total Assets are estimated and unaudited and may vary from final audited figures. Total assets exclude amounts invested in the equity
of another investment vehicle managed by the portfolio manager so as to avoid double counting.
Compensation.
Investment
professionals of the Adviser are paid out of the total revenues of the Adviser and certain of its affiliates, including Eagle Point Credit
Management LLC, including the advisory fees earned with respect to providing advisory services to the registrant. Professional compensation
is structured so that key professionals benefit from strong investment performance generated on accounts that the Adviser and such affiliates
manage and from their longevity with the Adviser and its affiliates. Each member of the senior investment team has indirect equity ownership
interests in the Adviser and related long-term incentives. Members of the senior investment team also receive a fixed base salary and
an annual market and performance-based cash bonus. The bonus is determined by the Adviser’s ultimate board of managers, and is
based on both quantitative and qualitative analysis of several factors, including the profitability of the Adviser and its affiliates,
and the contribution of the individual employee. Many of the factors considered by management in reaching its compensation determinations
will be impacted by the registrant’s long-term performance and the value of the registrant’s assets as well as the portfolios
managed for the Adviser’s and such affiliates’ other clients.
Securities
Owned in the Company by Portfolio Managers.
The
table below sets forth the dollar range of the value of the shares of the registrant’s common stock which are owned beneficially
by each portfolio manager as of December 31, 2023. For purposes of this table, beneficial ownership is defined to mean a direct or indirect
pecuniary interest.
| Name
of Portfolio Manager |
|
Dollar
Range
of Equity Securities
in the Company(1) |
| Thomas
P. Majewski |
|
$100,001-$500,000 |
| Daniel
W. Ko |
|
$50,001-$100,000 |
| Daniel
M. Spinner |
|
$100,001-$500,000 |
| (1) |
Dollar
ranges are as follows: None, $1 – $10,000, $10,001 – $50,000, $50,001 – $100,000,
$100,001 – $500,000, $500,001 – $1,000,000 and over $1,000,000. |
Item
9. Purchases of Equity Securities by Closed-End Management Investment Company and Affiliated Purchases
There
have been no purchases by or on behalf of the registrant of shares or other units of any class of the registrant’s equity securities
that are registered pursuant to Section 12 of the Exchange Act during the period covered by this report.
Item
10. Submission of Matters to a Vote of Security Holders
There
have been no material changes to the procedures by which stockholders may recommend nominees to the registrant’s board of directors.
Item
11. Controls and Procedures
| (a) | The
registrant’s principal executive and principal financial officers, or persons performing
similar functions, have concluded that the registrant’s disclosure controls and procedures
(as defined in Rule 30(a)-3(c) under the Investment Company Act of 1940, as amended (the
“1940 Act”)) are effective as of a date within 90 days of the filing of this
report, based on the evaluation of these controls and procedures required by Rule 30a-3(b)
under the 1940 Act and Rules 13a-15(b) or 15d-15(b) under the Exchange Act. |
| (b) | There
were no changes in the Registrant’s internal control over financial reporting (as defined
in Rule 30a-3(d) under the 1940 Act) that occurred during the period covered by this report
that have materially affected, or are reasonably likely to materially affect, the registrant’s
internal control over financial reporting. |
Item
12. Disclosure of Securities Lending Activities for Closed-End Management Investment Companies.
The
registrant did not engage in securities lending activity during the fiscal year ended December 31, 2023.
Item
13. Exhibits
SIGNATURES
Pursuant
to the requirements of the Securities Exchange Act of 1934 and the Investment Company Act of 1940, the registrant has duly caused this
report to be signed on its behalf by the undersigned, thereunto duly authorized.
| |
EAGLE POINT INCOME COMPANY INC. |
| |
|
|
| |
By:
|
/s/ Thomas P. Majewski |
|
| |
|
Thomas
P. Majewski |
| |
|
Chief
Executive Officer |
| |
Date:
|
February
22, 2024 |
Pursuant
to the requirements of the Securities Exchange Act of 1934 and the Investment Company Act of 1940, this report has been signed below
by the following persons on behalf of the registrant and in the capacity and on the dates indicated.
| By:
|
/s/ Thomas P. Majewski |
|
|
| |
Thomas
P. Majewski |
| |
Chief
Executive Officer (principal executive officer) |
| Date:
|
February
22, 2024 |
| By:
|
/s/ Kenneth P. Onorio |
|
|
| |
Kenneth
P. Onorio |
| |
Chief
Financial Officer (principal financial officer) |
| Date:
|
February
22, 2024 |
Eagle Point Income Company N CSRS
Exhibit (a)(2)
CERTIFICATIONS
(Section
302)
I,
Thomas P. Majewski, Chief Executive Officer of the Registrant, certify that:
| 1. | I
have reviewed this report on Form N-CSR of Eagle Point Income Company Inc.; |
| 2. | Based
on my knowledge, this report does not contain any untrue statement of a material fact or
omit to state a material fact necessary to make the statements made, in light of the circumstances
under which such statements were made, not misleading with respect to the period covered
by this report; |
| 3. | Based
on my knowledge, the financial statements, and other financial information included in this
report, fairly present in all material respects the financial condition, results of operations,
changes in net assets, and cash flows (if the financial statements are required to include
a statement of cash flows) of the registrant as of, and for, the periods presented in this
report; |
| 4. | The
registrant’s other certifying officer(s) and I are responsible for establishing and
maintaining disclosure controls and procedures (as defined in Rule 30a-3(c) under the Investment
Company Act of 1940) and internal control over financial reporting (as defined in Rule 30a-3(d)
under the Investment Company Act of 1940) for the registrant and have; |
| a. | Designed
such disclosure controls and procedures, or caused such disclosure controls and procedures
to be designed under our supervision, to ensure that material information relating to the
registrant, including its consolidated subsidiaries, is made known to us by others within
those entities, particularly during the period in which this report is being prepared; |
| b. | Designed
such internal control over financial reporting, or caused such internal control over financial
reporting to be designed under our supervision, to provide reasonable assurance regarding
the reliability of financial reporting and the preparation of financial statements for external
purposes in accordance with generally accepted accounting principles; |
| c. | Evaluated
the effectiveness of the registrant’s disclosure controls and procedures and presented
in this report our conclusions about the effectiveness of the disclosure controls and procedures,
as of a date within 90 days prior to the filing date of this report based on such evaluation;
and |
| d. | Disclosed
in this report any change in the registrant’s internal control over financial reporting
that occurred during the period covered by this report that has materially affected, or is
reasonably likely to materially affect, the registrant’s internal control over financial
reporting; and |
| 5. | The
registrant’s other certifying officer(s) and I have disclosed to the registrant’s
auditors and the Audit Committee of the registrant’s board of directors (or persons
performing the equivalent functions): |
| a. | All
significant deficiencies and material weaknesses in the design or operation of internal control
over financial reporting which are reasonably likely to adversely affect the registrant’s
ability to record, process, summarize, and report financial information; and |
| b. | Any
fraud, whether or not material, that involves management or other employees who have a significant
role in the registrant’s internal control over financial reporting. |
Dated:
February 22, 2024
| By:
|
/s/ Thomas P. Majewski |
|
|
| |
Thomas
P. Majewski |
| |
Chief
Executive Officer |
CERTIFICATIONS
(Section
302)
I,
Kenneth P. Onorio, Chief Financial Officer of the Registrant, certify that:
| 1. | I
have reviewed this report on Form N-CSR of Eagle Point Income Company Inc.; |
| 2. | Based
on my knowledge, this report does not contain any untrue statement of a material fact or
omit to state a material fact necessary to make the statements made, in light of the circumstances
under which such statements were made, not misleading with respect to the period covered
by this report; |
| 3. | Based
on my knowledge, the financial statements, and other financial information included in this
report, fairly present in all material respects the financial condition, results of operations,
changes in net assets, and cash flows (if the financial statements are required to include
a statement of cash flows) of the registrant as of, and for, the periods presented in this
report; |
| 4. | The
registrant’s other certifying officer(s) and I are responsible for establishing and
maintaining disclosure controls and procedures (as defined in Rule 30a-3(c) under the Investment
Company Act of 1940) and internal control over financial reporting (as defined in Rule 30a-3(d)
under the Investment Company Act of 1940) for the registrant and have; |
| a. | Designed
such disclosure controls and procedures, or caused such disclosure controls and procedures
to be designed under our supervision, to ensure that material information relating to the
registrant, including its consolidated subsidiaries, is made known to us by others within
those entities, particularly during the period in which this report is being prepared; |
| b. | Designed
such internal control over financial reporting, or caused such internal control over financial
reporting to be designed under our supervision, to provide reasonable assurance regarding
the reliability of financial reporting and the preparation of financial statements for external
purposes in accordance with generally accepted accounting principles; |
| c. | Evaluated
the effectiveness of the registrant’s disclosure controls and procedures and presented
in this report our conclusions about the effectiveness of the disclosure controls and procedures,
as of a date within 90 days prior to the filing date of this report based on such evaluation;
and |
| d. | Disclosed
in this report any change in the registrant’s internal control over financial reporting
that occurred during the period covered by this report that has materially affected, or is
reasonably likely to materially affect, the registrant’s internal control over financial
reporting; and |
| 5. | The
registrant’s other certifying officer(s) and I have disclosed to the registrant’s
auditors and the Audit Committee of the registrant’s board of directors (or persons
performing the equivalent functions): |
| a. | All
significant deficiencies and material weaknesses in the design or operation of internal control
over financial reporting which are reasonably likely to adversely affect the registrant’s
ability to record, process, summarize, and report financial information; and |
| b. | Any
fraud, whether or not material, that involves management or other employees who have a significant
role in the registrant’s internal control over financial reporting. |
Dated:
February 22, 2024
| By:
|
/s/ Kenneth P. Onorio |
|
|
| |
Kenneth
P. Onorio |
| |
Chief
Financial Officer |
Eagle Point Income Company N CSRS
Exhibit (b)
Certification
Under Section 906
of the Sarbanes-Oxley Act of 2002
Thomas
P. Majewski, Chief Executive Officer, and Kenneth P. Onorio, Chief Financial Officer of Eagle Point Income Company Inc. (the “registrant”),
each certify to the best of his knowledge that:
| 1. | The
registrant’s periodic report on Form N-CSR for the period ended December 31, 2023 (the
“Form N-CSR”) fully complies with the requirements of section 13(a) or 15(d)
of the Securities Exchange Act of 1934, as amended; and |
| 2. | The
information contained in the Form N-CSR fairly presents, in all material respects, the financial
condition and results of operations of the registrant. |
| Chief Executive Officer |
|
Chief Financial Officer |
| Eagle Point Income Company Inc. |
|
Eagle Point Income Company Inc. |
| |
|
|
|
|
| /s/
Thomas P. Majewski |
|
|
/s/
Kenneth P. Onorio |
|
| Thomas P. Majewski |
|
Kenneth P. Onorio |
| Date: February 22, 2024 |
|
Date: February 22, 2024 |
This
certification is being furnished to the Securities and Exchange Commission pursuant to Rule 30a-2(b) under the Investment Company Act
of 1940, as amended, and 18 U.S.C. 1350 and is not being filed as part of the Form N-CSR with the Securities and Exchange Commission.
Eagle Point Income Company N CSRS
Exhibit 99(c)

| |
|
KPMG LLP
345 Park Avenue
New York, NY 10154-0102 |
Consent of Independent Registered Public Accounting
Firm
We consent to the incorporation by reference in the registration statement
(File Nos. 333-272168 and 333-266905) on Form N-2 of our report dated February 21, 2024, with respect to the consolidated financial statements,
the consolidated financial highlights and the accompanying Supplemental Information of Eagle Point Income Company Inc. and Subsidiaries,
which appear in this Form N-CSR.
New York, New York
February 22, 2024

v3.24.0.1
N-2 - USD ($)
|
|
|
3 Months Ended |
12 Months Ended |
|
|
|
Jan. 31, 2024 |
Dec. 31, 2023 |
Dec. 31, 2023 |
Sep. 30, 2023 |
[8] |
Jun. 30, 2023 |
[8] |
Mar. 31, 2023 |
[8] |
Dec. 31, 2022 |
Sep. 30, 2022 |
[9] |
Jun. 30, 2022 |
[9] |
Mar. 31, 2022 |
[9] |
Dec. 31, 2023 |
Dec. 31, 2022 |
Dec. 31, 2021 |
Feb. 15, 2024 |
Dec. 31, 2020 |
Dec. 31, 2019 |
| Cover [Abstract] |
|
|
|
|
|
|
|
|
|
|
|
|
|
|
|
|
|
|
|
|
|
|
| Entity Central Index Key |
|
|
|
|
|
|
|
|
|
|
|
|
|
|
0001754836
|
|
|
|
|
|
|
|
| Amendment Flag |
|
|
|
|
|
|
|
|
|
|
|
|
|
|
false
|
|
|
|
|
|
|
|
| Entity Inv Company Type |
|
|
|
|
|
|
|
|
|
|
|
|
|
|
N-2
|
|
|
|
|
|
|
|
| Document Type |
|
|
|
|
|
|
|
|
|
|
|
|
|
|
N-CSR
|
|
|
|
|
|
|
|
| Entity Registrant Name |
|
|
|
|
|
|
|
|
|
|
|
|
|
|
Eagle Point Income Co Inc.
|
|
|
|
|
|
|
|
| Fee Table [Abstract] |
|
|
|
|
|
|
|
|
|
|
|
|
|
|
|
|
|
|
|
|
|
|
| Shareholder Transaction Expenses [Table Text Block] |
|
|
|
|
|
|
|
|
|
|
|
|
|
|
| Stockholder
Transaction Expenses (as a percentage of the offering price): |
|
|
| Sales
load |
|
—%(1) |
| Offering
expenses borne by the Company |
|
—%(2) |
| Dividend
reinvestment plan expenses |
|
Up
to $15(3) |
| Total
stockholder transaction expenses |
|
—% |
| (1) | In
the event that the Company sells its securities publicly through underwriters or agents,
the related prospectus supplement will disclose the applicable sales load. |
| (2) | In
the event that the Company sells its securities publicly through underwriters or agents,
the related prospectus supplement will disclose the estimated amount of total offering
expenses (which may include offering expenses borne by third parties on the Company’s
behalf), the offering price and the offering expenses borne by the Company as a percentage
of the offering price. |
| (3) | The
expenses associated with the dividend reinvestment plan are included in “Other
expenses.” If a participant elects by written notice to the plan administrator
prior to termination of his or her account to have the plan administrator sell part or
all of the shares held by the plan administrator in the participant’s account and
remit the proceeds to the participant, the plan administrator is authorized to deduct
a $15.00 transaction fee plus a $0.07 per share brokerage commission from the proceeds.
See the section “Dividend Reinvestment Plan,” below. |
|
|
|
|
|
|
|
|
| Sales Load [Percent] |
[1] |
|
|
|
|
|
|
|
|
|
|
|
|
|
0.00%
|
|
|
|
|
|
|
|
| Dividend Reinvestment and Cash Purchase Fees |
[2] |
|
|
|
|
|
|
|
|
|
|
|
|
|
$ 15
|
|
|
|
|
|
|
|
| Underwriters Compensation [Percent] |
[3] |
|
|
|
|
|
|
|
|
|
|
|
|
|
0.00%
|
|
|
|
|
|
|
|
| Other Transaction Expenses [Abstract] |
|
|
|
|
|
|
|
|
|
|
|
|
|
|
|
|
|
|
|
|
|
|
| Annual Expenses [Table Text Block] |
|
|
|
|
|
|
|
|
|
|
|
|
|
|
| Annual
Expenses (as a percentage of net assets attributable to common stock): |
|
|
| Management
fee |
|
1.94%(4) |
| Interest
payments on borrowed funds |
|
3.74%(5) |
| Other
expenses |
|
1.49%(6) |
| Total
annual expenses |
|
7.17% |
| (4) | The Company has agreed to
pay the Adviser as compensation under the Investment Advisory Agreement a management fee at an annual rate of 1.25% which is
calculated monthly based the Company’s Managed Assets at the end of each calendar month and payable quarterly in arrears.
“Managed Assets” means the Company’s total assets (including assets attributable to the use of leverage) minus the
sum of accrued liabilities (other than liabilities incurred for the purpose of creating leverage). Because Managed Assets include
the Company’s use of leverage, they will typically be greater than the Company’s net assets. The management fee
referenced in the table above is based on Managed Assets as of December 31, 2023 and assumes the pro forma effect of (i) the
issuance in the Company’s “at-the-market” offering of 1.1 million shares of our common stock and 45,322 shares of
our Series B Preferred Stock from January 1, 2024 through February 15, 2024, yielding net proceeds to the Company of approximately
$16.9 million; (ii) the hypothetical borrowings of the full $25,000,000 available under the BNP Credit Facility, which would mean
that the Company’s adjusted total assets are assumed to equal approximately $269.6 million. These management fees are
indirectly borne by holders of the Company’s common stock and are not borne by the holders of preferred stock, if any, or the
holders of any other securities that the Company may issue. See “The Adviser and the Administrator —
Investment Advisory Agreement — Management” in the Company’s prospectus for additional information
regarding the calculation of the management fee. |
| (5) | “Interest
payments on borrowed funds” represents the Company’s annualized interest
expense and includes dividends payable on the Series A Term Preferred Stock and Series
B Term Preferred Stock, outstanding on December 31, 2023, and includes the pro forma
effect of the Series B Preferred Stock issuance and assumed borrowings under the BNP Credit Facility described above, which,
in the aggregate, have a weighted average interest rate of 6.60% per annum. The Company
may issue additional shares of preferred stock. In the event that the Company were to
issue additional shares of preferred stock, the Company’s borrowing costs, and
correspondingly its total annual expenses, including, |
| in the case of such preferred stock,
the base management fee as a percentage of the Company’s managed assets attributable
to common stock, would increase. |
| (6) | “Other
expenses” includes the Company’s overhead expenses, including payments under
the Administration Agreement based on the Company’s allocable portion of overhead
and other expenses incurred by Eagle Point Administration LLC (“Eagle Point Administration”),
the administrator to the Company and an affiliate of the Adviser, and payment of fees
in connection with outsourced administrative functions, and are based on the actual amounts
for the 2023 fiscal year. See “Related Party Transactions —
Administrator” in the Notes to the Financial Statements. “Other expenses”
also includes the ongoing administrative expenses to the independent accountants and
legal counsel of the Company, compensation of independent directors, and cost and expenses
relating to rating agencies. |
|
|
|
|
|
|
|
|
| Management Fees [Percent] |
[4] |
|
|
|
|
|
|
|
|
|
|
|
|
|
1.94%
|
|
|
|
|
|
|
|
| Interest Expenses on Borrowings [Percent] |
[5] |
|
|
|
|
|
|
|
|
|
|
|
|
|
3.74%
|
|
|
|
|
|
|
|
| Other Annual Expenses [Abstract] |
|
|
|
|
|
|
|
|
|
|
|
|
|
|
|
|
|
|
|
|
|
|
| Other Annual Expenses [Percent] |
[6] |
|
|
|
|
|
|
|
|
|
|
|
|
|
1.49%
|
|
|
|
|
|
|
|
| Total Annual Expenses [Percent] |
|
|
|
|
|
|
|
|
|
|
|
|
|
|
7.17%
|
|
|
|
|
|
|
|
| Expense Example [Table Text Block] |
|
|
|
|
|
|
|
|
|
|
|
|
|
|
Example
The
following example is furnished in response to the requirements of the SEC and illustrates the various costs and expenses that
you would pay, directly or indirectly, on a $1,000 investment in shares of the Company’s common stock for the time periods
indicated, assuming (1) total annual expenses of 7.17% of net assets attributable to the Company’s common stock and (2) a
5% annual return*:
| |
|
1 year |
|
3 years |
|
5 years |
|
10 years |
|
| You
would pay the following expenses on a $1,000 investment, assuming a 5% annual return |
|
|
$72 |
|
|
$210 |
|
$343 |
|
$651 |
|
*
The example should not be considered a representation of future returns or expenses, and actual returns and expenses may be
greater or less than those shown. The example assumes that the estimated “other expenses” set forth in the
Annual Expenses table are accurate, and that all dividends and distributions are reinvested at NAV. The Company’s actual
rate of return may be greater or less than the hypothetical 5% return shown in the example.
|
|
|
|
|
|
|
|
| Expense Example, Year 01 |
|
|
|
|
|
|
|
|
|
|
|
|
|
|
$ 72
|
|
|
|
|
|
|
|
| Expense Example, Years 1 to 3 |
|
|
|
|
|
|
|
|
|
|
|
|
|
|
210
|
|
|
|
|
|
|
|
| Expense Example, Years 1 to 5 |
|
|
|
|
|
|
|
|
|
|
|
|
|
|
343
|
|
|
|
|
|
|
|
| Expense Example, Years 1 to 10 |
|
|
|
|
|
|
|
|
|
|
|
|
|
|
$ 651
|
|
|
|
|
|
|
|
| Purpose of Fee Table , Note [Text Block] |
|
|
|
|
|
|
|
|
|
|
|
|
|
|
The
following table is intended to assist you in understanding the costs and expenses that an investor in shares of the Company’s
common stock will bear directly or indirectly. The expenses shown in the table under “Annual Expenses” are estimated
based on historical fees and expenses incurred by the Company, as appropriate. In addition, such amounts are based on the
Company’s pro forma assets as of December 31, 2023, which have been adjusted to reflect (i) the issuance in the
Company’s “at-the-market” offering of 1.1 million shares of our common stock and 45,322 shares of our Series B
Preferred Stock from January 1, 2024 through February 15, 2024, yielding net proceeds to the Company of approximately $16.9 million;
(ii) the hypothetical borrowings of the full $25,000,000 available under the BNP Credit Facility, which would mean that the
Company’s adjusted total assets are assumed to equal approximately $269.6 million. As of December 31, 2023, and pro forma for
the issuances and assumed borrowings described above (excluding any regular monthly distributions paid after December 31, 2023), the
Company’s leverage represented approximately 36.7% of the Company’s total assets (less current liabilities). Such
expenses, and actual leverage incurred by the Company, may vary in the future. Whenever this report (or other Company disclosures,
including the Company’s prospectus) contain a reference to fees or expenses paid by the Company, the Company’s common
stockholders will indirectly bear such fees or expenses.
|
|
|
|
|
|
|
|
| Basis of Transaction Fees, Note [Text Block] |
|
|
|
|
|
|
|
|
|
|
|
|
|
|
as a percentage of the offering price
|
|
|
|
|
|
|
|
| Other Expenses, Note [Text Block] |
|
|
|
|
|
|
|
|
|
|
|
|
|
|
“Other
expenses” includes the Company’s overhead expenses, including payments under
the Administration Agreement based on the Company’s allocable portion of overhead
and other expenses incurred by Eagle Point Administration LLC (“Eagle Point Administration”),
the administrator to the Company and an affiliate of the Adviser, and payment of fees
in connection with outsourced administrative functions, and are based on the actual amounts
for the 2023 fiscal year. See “Related Party Transactions —
Administrator” in the Notes to the Financial Statements. “Other expenses”
also includes the ongoing administrative expenses to the independent accountants and
legal counsel of the Company, compensation of independent directors, and cost and expenses
relating to rating agencies.
|
|
|
|
|
|
|
|
| Financial Highlights [Abstract] |
|
|
|
|
|
|
|
|
|
|
|
|
|
|
|
|
|
|
|
|
|
|
| Senior Securities [Table Text Block] |
|
|
|
|
|
|
|
|
|
|
|
|
|
|
| Class |
|
Total
Amount Outstanding
Exclusive of Treasury Securities
(in millions) |
|
Asset
Coverage Per
Unit (1) |
|
Involuntary
Liquidating
Preference
Per Unit (2) |
|
Average
Market Value
Per Unit (3) |
| |
|
|
|
|
|
|
|
|
| For
the year ended December 31, 2023 |
|
|
|
|
|
|
|
|
| Preferred
Stock |
|
$72,353,275
|
|
$69.70
|
|
$25
|
|
$23.81
|
| Revolving
Credit Facility (BNP Paribas) |
|
$14,520,000
|
|
$16,681.46
|
|
N/A
|
|
N/A
|
| |
|
|
|
|
|
|
|
|
| For
the year ended December 31, 2022 |
|
|
|
|
|
|
|
|
| Preferred
Stock |
|
$38,041,225
|
|
$78.16
|
|
$25
|
|
$23.68
|
| Revolving
Credit Facility (BNP Paribas) |
|
$9,030,000
|
|
$16,296.64
|
|
N/A
|
|
N/A
|
| |
|
|
|
|
|
|
|
|
| For
the year ended December 31, 2021 |
|
|
|
|
|
|
|
|
| Preferred
Stock |
|
$35,000,000
|
|
$78.24
|
|
$25
|
|
$25.32
|
| Revolving
Credit Facility (BNP Paribas) |
|
$19,550,000
|
|
$8,732.75
|
|
N/A
|
|
N/A
|
| |
|
|
|
|
|
|
|
|
| For
the year ended December 31, 2020 |
|
|
|
|
|
|
|
|
| Revolving
Credit Facility (Société Générale) |
|
$14,815,000
|
|
$7,960.52
|
|
N/A
|
|
N/A
|
| |
|
|
|
|
|
|
|
|
| For
the year ended December 31, 2019 |
|
|
|
|
|
|
|
|
| Revolving
Credit Facility (Société Générale) |
|
$13,743,000
|
|
$9,470.38
|
|
N/A
|
|
N/A
|
| (1) | The
asset coverage per unit figure is the ratio of the Company’s total assets, less
all liabilities and indebtedness not represented by senior securities, to the aggregate
dollar amount of senior securities, as calculated separately for each of the Preferred
Stock and Revolving Credit Facility in accordance with section 18(h) of the 1940 Act.
With respect to the Preferred Stock, the asset coverage per unit figure is expressed
in terms of dollar amounts per share of outstanding preferred stock (based on a per share
liquidation preference of $25). With respect to the Revolving Credit Facility, the asset
coverage per unit figure is expressed in terms of dollar amounts per $1,000 of indebtedness. |
| (2) | The
involuntary liquidating preference per unit is the amount to which a share of Preferred
Stock would be entitled in preference to any security junior to it upon our involuntary
liquidation. |
| (3) | The
average market value per unit is calculated by taking the average of the closing price
of the Series A Term Preferred Stock (NYSE: EICA) and Series B Term Preferred Stock (NYSE:
EICB). |
|
|
|
|
|
|
|
|
| Senior Securities, Note [Text Block] |
|
|
|
|
|
|
|
|
|
|
|
|
|
|
Senior Securities Table
Information about the Company’s
senior securities shown in the following table has been derived from the Company’s consolidated financial statements as of
and for the dates noted.
| Class |
|
Total
Amount Outstanding
Exclusive of Treasury Securities
(in millions) |
|
Asset
Coverage Per
Unit (1) |
|
Involuntary
Liquidating
Preference
Per Unit (2) |
|
Average
Market Value
Per Unit (3) |
| |
|
|
|
|
|
|
|
|
| For
the year ended December 31, 2023 |
|
|
|
|
|
|
|
|
| Preferred
Stock |
|
$72,353,275
|
|
$69.70
|
|
$25
|
|
$23.81
|
| Revolving
Credit Facility (BNP Paribas) |
|
$14,520,000
|
|
$16,681.46
|
|
N/A
|
|
N/A
|
| |
|
|
|
|
|
|
|
|
| For
the year ended December 31, 2022 |
|
|
|
|
|
|
|
|
| Preferred
Stock |
|
$38,041,225
|
|
$78.16
|
|
$25
|
|
$23.68
|
| Revolving
Credit Facility (BNP Paribas) |
|
$9,030,000
|
|
$16,296.64
|
|
N/A
|
|
N/A
|
| |
|
|
|
|
|
|
|
|
| For
the year ended December 31, 2021 |
|
|
|
|
|
|
|
|
| Preferred
Stock |
|
$35,000,000
|
|
$78.24
|
|
$25
|
|
$25.32
|
| Revolving
Credit Facility (BNP Paribas) |
|
$19,550,000
|
|
$8,732.75
|
|
N/A
|
|
N/A
|
| |
|
|
|
|
|
|
|
|
| For
the year ended December 31, 2020 |
|
|
|
|
|
|
|
|
| Revolving
Credit Facility (Société Générale) |
|
$14,815,000
|
|
$7,960.52
|
|
N/A
|
|
N/A
|
| |
|
|
|
|
|
|
|
|
| For
the year ended December 31, 2019 |
|
|
|
|
|
|
|
|
| Revolving
Credit Facility (Société Générale) |
|
$13,743,000
|
|
$9,470.38
|
|
N/A
|
|
N/A
|
| (1) | The
asset coverage per unit figure is the ratio of the Company’s total assets, less
all liabilities and indebtedness not represented by senior securities, to the aggregate
dollar amount of senior securities, as calculated separately for each of the Preferred
Stock and Revolving Credit Facility in accordance with section 18(h) of the 1940 Act.
With respect to the Preferred Stock, the asset coverage per unit figure is expressed
in terms of dollar amounts per share of outstanding preferred stock (based on a per share
liquidation preference of $25). With respect to the Revolving Credit Facility, the asset
coverage per unit figure is expressed in terms of dollar amounts per $1,000 of indebtedness. |
| (2) | The
involuntary liquidating preference per unit is the amount to which a share of Preferred
Stock would be entitled in preference to any security junior to it upon our involuntary
liquidation. |
| (3) | The
average market value per unit is calculated by taking the average of the closing price
of the Series A Term Preferred Stock (NYSE: EICA) and Series B Term Preferred Stock (NYSE:
EICB). |
|
|
|
|
|
|
|
|
| Senior Securities Averaging Method, Note [Text Block] |
|
|
|
|
|
|
|
|
|
|
|
|
|
|
The
average market value per unit is calculated by taking the average of the closing price
of the Series A Term Preferred Stock (NYSE: EICA) and Series B Term Preferred Stock (NYSE:
EICB).
|
|
|
|
|
|
|
|
| General Description of Registrant [Abstract] |
|
|
|
|
|
|
|
|
|
|
|
|
|
|
|
|
|
|
|
|
|
|
| Investment Objectives and Practices [Text Block] |
|
|
|
|
|
|
|
|
|
|
|
|
|
|
Investment Objectives
and Strategies
We are an externally managed,
diversified closed-end management investment company that has registered as an investment company under the Investment Company
Act of 1940, as amended (the “1940 Act”). We have elected to be treated, and intend to qualify annually, as a regulated
investment company, or “RIC,” under Subchapter M of the Internal Revenue Code of 1986, as amended, or the “Code,”
beginning with our tax year ended December 31, 2018. We were formed on September 28, 2018
as EP Income Company LLC, a Delaware
limited liability company, and converted into a Delaware corporation on October 16, 2018.
Our primary investment
objective is to generate high current income, with a secondary objective to generate capital appreciation. We seek to achieve our
investment objectives by investing primarily in junior debt tranches of CLOs, that are collateralized by a portfolio consisting
primarily of below investment grade U.S. senior secured loans with a large number of distinct underlying borrowers across various
industry sectors. We focus on CLO debt tranches rated “BB” (e.g., BB+, BB or BB-, or their equivalent) by Moody’s
Investors Service, Inc., or “Moody’s,” Standard & Poor’s, or “S&P,” or Fitch Ratings,
Inc., or “Fitch,” and/or other applicable nationally recognized statistical rating organizations. We may also invest
in other junior debt tranches of CLOs, loan accumulation facilities, senior debt tranches of CLOs and other related securities
and instruments, including synthetic investments, such as significant risk transfer securities and credit risk transfer securities
issued by banks or other financial institutions. In addition, we may invest up to 35% of our total assets (at the time of investment)
in CLO equity securities. We expect our investments in CLO equity securities to primarily reflect minority ownership positions.
We may also invest in other securities and instruments that the Adviser believes are consistent with our investment objectives
such as securities issued by other securitization vehicles, such as collateralized bond obligations or “CBOs”. The
amount that we will invest in other securities and instruments, which may include investments in debt and other securities issued
by CLOs collateralized by non-U.S. loans or securities of other collective investment vehicles, will vary from time to time and,
as such, may constitute a material part of our portfolio on any given date, all as based on the Adviser’s assessment of prevailing
market conditions. The CLO securities in which we primarily seek to invest are rated below investment grade or, in the case of
CLO equity securities, are unrated and are considered speculative with respect to timely payment of interest and repayment of principal.
Below investment grade and unrated securities are also sometimes referred to as “junk” securities.
These investment objectives
are not fundamental policies of ours and may be changed by our board of directors without prior approval of our stockholders.
Investment Restrictions
Our investment objectives
and our investment policies and strategies, except for the eight investment restrictions designated as fundamental policies under
this caption, are not fundamental and may be changed by the board of directors without stockholder approval.
The following eight investment
restrictions are designated as fundamental policies and, as such, cannot be changed without the approval of the holders of a majority
of our outstanding voting securities:
| 1. | We may not borrow money, except as permitted by (i) the 1940 Act,
or interpretations or modifications by the SEC, SEC staff or other authority with appropriate jurisdiction, or (ii) exemptive or
other relief or permission from the SEC, SEC staff or other authority with appropriate jurisdiction; |
| 2. | We may not engage in the business of underwriting securities issued
by others, except to the extent that we may be deemed to be an underwriter in connection with the disposition of portfolio securities; |
| 3. | We may not purchase or sell physical commodities or contracts
for the purchase or sale of physical commodities. Physical commodities do not include futures contracts with respect to securities,
securities indices, currency or other financial instruments; |
| 4. | We may not purchase or sell real estate, which term does not
include securities of companies which deal in real estate or mortgages or investments secured by real estate or interests therein,
except that we reserve freedom of action to hold and to sell real estate acquired as a result of our ownership of securities; |
| 5. | We may not make loans, except to the extent permitted by (i)
the 1940 Act, or interpretations or modifications by the SEC, SEC staff or other authority with appropriate jurisdiction, or (ii)
exemptive or other relief or permission from the SEC, SEC staff or other authority with appropriate jurisdiction. For purposes
of this investment restriction, the purchase of debt obligations (including acquisitions of loans, loan participations or other
forms of debt instruments) shall not constitute loans by us; |
| 6. | We may not issue senior securities, except to the extent permitted
by (i) the 1940 Act, or interpretations or modifications by the SEC, the SEC staff or other authority with appropriate jurisdiction,
or (ii) exemptive or other relief or permission from the SEC, SEC staff or other authority with appropriate jurisdiction; |
| 7. | We may not invest in any security if as a result of such investment,
25% or more of the value of our total assets, taken at market value at the time of each investment, are in the securities of issuers
in any particular industry or group of |
| | | industries
except (a) securities issued or guaranteed by the U.S. government and its agencies and
instrumentalities or tax-exempt securities of state and municipal governments or their
political subdivisions (however, not including private purpose industrial development
bonds issued on behalf of non-government issuers), or (b) as otherwise provided by the
1940 Act, as amended from time to time, and as modified or supplemented from time to
time by (i) the rules and regulations promulgated by the SEC under the 1940 Act, as amended
from time to time, and (ii) any exemption or other relief applicable to us from the provisions
of the 1940 Act, as amended from time to time. For purposes of this restriction, in the
case of investments in loan participations between us and a bank or other lending institution
participating out the loan, we will treat both the lending bank or other lending institution
and the borrower as “issuers.” For purposes of this restriction, an investment
in a CLO, collateralized bond obligation, collateralized debt obligation or a swap or
other derivative will be considered to be an investment in the industry or group of industries
(if any) of the underlying or reference security, instrument or asset; and |
| 8. | We may not engage in short sales, purchases on margin, or
the writing of put or call options, except as permitted by (i) the 1940 Act, or interpretations or modifications by the SEC, SEC
staff or other authority with appropriate jurisdiction or (ii) exemptive or other relief or permission from the SEC, SEC staff
or other authority with appropriate jurisdiction. |
The latter part of certain
of our fundamental investment restrictions (i.e., the references to “except to the extent permitted by (i) the 1940
Act, or interpretations or modifications by the SEC, the SEC staff or other authority with appropriate jurisdiction, or (ii) exemptive
or other relief or permission from the SEC, SEC staff or other authority with appropriate jurisdiction”) provides us with
flexibility to change our limitations in connection with changes in applicable law, rules, regulations or exemptive relief. The
language used in these restrictions provides the necessary flexibility to allow our board of directors to respond efficiently to
these kinds of developments without the delay and expense of a stockholder meeting.
Whenever an investment
policy or investment restriction set forth in this report or in our prospectus states a maximum percentage of assets that may be
invested in any security or other asset, or describes a policy regarding quality standards, such percentage limitation or standard
shall be determined immediately after and as a result of our acquisition of such security or asset. Accordingly, any later increase
or decrease resulting from a change in values, assets or other circumstances or any subsequent rating change made by a rating agency
(or as determined by the Adviser if the security is not rated by a rating agency) will not compel us to dispose of such security
or other asset. Notwithstanding the foregoing, we must always be in compliance with the borrowing policies set forth above.
|
|
|
|
|
|
|
|
| Risk Factors [Table Text Block] |
|
|
|
|
|
|
|
|
|
|
|
|
|
|
Investment
Risk Factors
The
following list is not intended to be a comprehensive list of all of the potential risks associated with the Company. The Company’s
prospectus provides a detailed discussion of the Company’s risks and considerations. The risks described in the prospectus
are not the only risks the Company faces. Additional risks and uncertainties not currently known to the Company or that are currently
deemed to be immaterial also may materially and adversely affect its business, financial condition and/or operating results.
Risks
of Investing in CLOs and Other Structured Debt Securities
CLOs
and other structured finance securities are generally backed by a pool of credit-related assets that serve as collateral. Accordingly,
CLO and structured finance securities present risks similar to those of other types of credit investments, including default (credit),
interest rate and prepayment risks. In addition, CLOs and other structured finance securities are often governed by a complex
series of legal documents and contracts, which increases the risk of dispute over the interpretation and enforceability of such
documents relative to other types of investments.
Subordinated
Securities Risk
CLO
junior debt and equity securities that the Company may acquire are subordinated to more senior tranches of CLO debt. CLO junior
debt and equity securities are subject to increased risks of default relative to the holders of superior priority interests in
the same CLO. In addition, at the time of issuance, CLO equity securities are under-collateralized in that the face amount of
the CLO debt and CLO equity of a CLO at inception exceed its total assets. The Company will typically be in a subordinated or
first loss position with respect to realized losses on the underlying assets held by the CLOs in which the Company is invested.
High-Yield
Investment Risk
The
CLO junior debt and equity securities that the Company acquires are typically rated below investment grade or, in the case of
CLO equity securities, unrated and are therefore considered “higher-yield” or “junk” securities and are
considered speculative with respect to timely payment of interest and repayment of principal. The senior secured loans and other
credit-related assets underlying CLOs are also typically higher-yield investments. Investing in CLO junior debt and equity securities
and other high-yield investments typically involves greater credit and liquidity risk than investment grade obligations, which
may adversely impact the Company’s performance.
Leverage
Risk
The
use of leverage, whether directly or indirectly through investments such as CLO junior debt and equity securities that inherently
involve leverage, may magnify the Company’s risk of loss. CLO junior debt and equity securities are very highly leveraged
(with CLO equity securities typically being leveraged ten times), and therefore the CLO securities in which the Company invests
are subject to a higher degree of loss since the use of leverage magnifies losses.
Credit
Risk
If
(1) a CLO in which the Company invests, (2) an underlying asset of any such CLO or (3) any other type of credit investment in
the Company’s portfolio declines in price or fails to pay interest or principal when due because the issuer or debtor, as
the case may be, experiences a decline in its financial status, the Company’s income, net asset value (“NAV”)
and/or market price would be adversely impacted.
Key
Personnel Risk
The
Adviser manages our investments. Consequently, the Company’s success depends, in large part, upon the services of the Adviser
(including Eagle Point Credit Management LLC, which provides the Adviser with investment professionals and other resources under
a personnel and resources agreement) and the skill and expertise of the Adviser’s professional personnel. There can be no
assurance that the professional personnel of the Adviser (or Eagle Point Credit Management LLC) will continue to serve in their
current positions or continue to be employed by the Adviser. We can offer no assurance that their services will be available for
any length of time or that the Adviser will continue indefinitely as the Company’s investment adviser.
Conflicts
of Interest Risk
The
Company’s executive officers and directors, and the Adviser and certain of its affiliates and their officers and employees,
including the Senior Investment Team, have several conflicts of interest as a result of the other activities in which they engage.
Prepayment
Risk
The
assets underlying the CLO securities in which the Company invests are subject to prepayment by the underlying corporate borrowers.
As such, the CLO securities and related investments in which the Company invests are subject to prepayment risk. If the Company
or a CLO collateral manager are unable to reinvest prepaid amounts in a new
investment with an expected rate of return at least
equal to that of the investment repaid, the Company’s investment performance will be adversely impacted.
Liquidity
Risk
Generally,
there is no public market for the CLO investments in which the Company invests. As such, the Company may not be able to sell such
investments quickly, or at all. If the Company is able to sell such investments, the prices the Company receives may not reflect
the Adviser’s assessment of their fair value or the amount paid for such investments by the Company.
Management
Fee Risk
The
Company’s management fee structure may incentivize the Adviser to use leverage in a manner that adversely impacts the Company’s
performance.
Fair
Valuation of the Company’s Portfolio Investments
Generally,
there is no public market for the CLO investments and certain other credit assets in which the Company may invest. The Adviser
values these securities at least quarterly, or more frequently as may be required from time to time, at fair value. The Adviser’s
determinations of the fair value of the Company’s investments have a material impact on the Company’s net earnings
through the recording of unrealized appreciation or depreciation of investments and may cause the Company’s NAV on a given
date to understate or overstate, possibly materially, the value that the Company ultimately realizes on one or more of the Company’s
investments.
Limited
Investment Opportunities Risk
The
market for CLO securities is more limited than the market for other credit related investments. The Company can offer no assurances
that sufficient investment opportunities for the Company’s capital will be available. In recent years there has been a marked
increase in the number of, and flow of capital into, investment vehicles established to pursue investments in CLO securities whereas
the size of this market is relatively limited. While the Company cannot determine the precise effect of such competition, such
increase may result in greater competition for investment opportunities, which may result in an increase in the price of such
investments relative to the risk taken on by holders of such investments. Such competition may also result under certain circumstances
in increased price volatility or decreased liquidity with respect to certain positions.
Market
Risk
Political,
regulatory, economic and social developments, and developments that impact specific economic sectors, industries or segments of
the market, can affect the value of the Company’s investments. A disruption or downturn in the capital markets and the credit
markets could impair the Company’s ability to raise capital, reduce the availability of suitable investment opportunities
for the Company, or adversely and materially affect the value of the Company’s investments, any of which would negatively
affect the Company’s business. These risks may be magnified if certain events or developments adversely interrupt the global
supply chain, and could affect companies worldwide.
Loan
Accumulation Facilities Risk
The
Company may invest in LAFs, which are short to medium term facilities often provided by the bank that will serve as placement
agent or arranger on a CLO transaction and which acquire loans on an interim basis which are expected to form part of the portfolio
of a future CLO. Investments in LAFs have risks similar to those applicable to investments in CLOs. Leverage is typically utilized
in such a facility and as such the potential risk of loss will be increased for such facilities employing leverage. In the event
a planned CLO is not consummated, or the loans are not eligible for purchase by the CLO, the Company may be responsible for either
holding or disposing of the loans. This could expose the Company to credit and/or mark-to-market losses, and other risks.
Synthetic
Investments Risk
The
Company may invest in synthetic investments, such as significant risk transfer securities and credit risk transfer securities
issued by banks or other financial institutions, or acquire interests in lease agreements that have the general characteristics
of loans and are treated as loans for withholding tax purposes. In addition to the credit risks associated with the applicable
reference assets, the Company will usually have a contractual relationship only with the
counterparty of such synthetic investment,
and not with the reference obligor of the reference asset. Accordingly, the Company generally will have no right to directly enforce
compliance by the reference obligor with the terms of the reference asset nor will it have any rights of setoff against the reference
obligor or rights with respect to the reference asset. The Company will not directly benefit from the collateral supporting the
reference asset and will not have the benefit of the remedies that would normally be available to a holder of such reference asset.
In addition, in the event of the insolvency of the counterparty, the Company may be treated as a general creditor of such counterparty,
and will not have any claim with respect to the reference asset.
Currency
Risk
Although
the Company primarily makes investments denominated in U.S. dollars, the Company may make investments denominated in other currencies.
The Company’s investments denominated in currencies other than U.S. dollars will be subject to the risk that the value of
such currency will decrease in relation to the U.S. dollar. The Company may or may not hedge currency risk.
Hedging
Risk
Hedging
transactions seeking to reduce risks may result in poorer overall performance than if the Company had not engaged in such hedging
transactions. Additionally, such transactions may not fully hedge the Company’s risks.
Reinvestment
Risk
CLOs
will typically generate cash from asset repayments and sales that may be reinvested in substitute assets, subject to compliance
with applicable investment tests. If the CLO collateral manager causes the CLO to purchase substitute assets at a lower yield
than those initially acquired or sale proceeds are maintained temporarily in cash, it would reduce the excess interest-related
cash flow, thereby having a negative effect on the fair value of the Company’s assets and the market value of the Company’s
securities. In addition, the reinvestment period for a CLO may terminate early, which would cause the holders of the CLO’s
securities to receive principal payments earlier than anticipated. There can be no assurance that the Company will be able to
reinvest such amounts in an alternative investment that provides a comparable return relative to the credit risk assumed.
Interest
Rate Risk
The
price of certain of the Company’s investments may be significantly affected by changes in interest rates, including recent
increases in interest rates. Although senior secured loans are generally floating rate instruments, the Company’s investments
in senior secured loans through investments in junior equity and debt tranches of CLOs are sensitive to interest rate levels and
volatility. For example, because CLO debt securities are floating rate securities, a reduction in interest rates would generally
result in a reduction in the coupon payment and cash flow the Company receives on the Company’s CLO debt investments. Further,
in the event of a significant rising interest rate environment and/or economic downturn, loan defaults may increase and result
in credit losses that may adversely affect the Company’s cash flow, fair value of the Company’s assets and operating
results. Because CLOs generally issue debt on a floating rate basis, an increase in the relevant benchmark index will increase
the financing costs of CLOs.
Furthermore,
certain senior secured loans that constitute the collateral of the CLOs in which the Company invests may continue to pay interest
at a floating rate based on LIBOR (or a “synthetic” calculation of LIBOR which is currently expected to continue to
be published until September 30, 2024) or may convert to a fixed rate of interest. To the extent that any LIBOR replacement rate
utilized for senior secured loans differs from that utilized for debt of a CLO that holds those loans, for the duration of such
mismatch, the CLO would experience an interest rate mismatch between its assets and liabilities, which could have an adverse impact
on the cash flows distributed to CLO equity investors (and, therefore, the Company’s net investment income and portfolio
returns) until such mismatch is corrected or minimized.
Refinancing
Risk
If
the Company incurs debt financing and subsequently refinance such debt, the replacement debt may be at a higher cost and on less
favorable terms and conditions. If the Company fails to extend, refinance or replace such debt financings prior to their maturity
on commercially reasonable terms, the Company’s liquidity will be lower than it would have been with the benefit of such
financings, which would limit the Company’s ability to grow, and holders
of the Company’s common stock would not benefit
from the potential for increased returns on equity that incurring leverage creates.
Tax
Risk
If
the Company fails to qualify for tax treatment as a RIC under Subchapter M of the Code for any reason, or otherwise becomes subject
to corporate income tax, the resulting corporate taxes (and any related penalties) could substantially reduce the Company’s
net assets, the amount of income available for distributions to the Company’s stockholders, and the amount of income available
for payment of the Company’s other liabilities.
Counterparty
Risk
The
Company may be exposed to counterparty risk, which could make it difficult for the Company or the issuers in which the Company
invests to collect on obligations, thereby resulting in potentially significant losses.
Price
Risk
Investors
who buy shares at different times will likely pay different prices.
Global
Risks
Due
to highly interconnected global economies and financial markets, the value of the Company’s securities and its underlying
investments may go up or down in response to governmental actions and/or general economic conditions throughout the world. Events
such as war, military conflict, acts of terrorism, social unrest, natural disasters, recessions, inflation, rapid interest rate
changes, supply chain disruptions, sanctions, the spread of infectious illness or other public health threats could also significantly
impact the Company and its investments.
Banking
Risk
The
possibility of future bank failures poses risks of reduced financial market liquidity at clearing, cash management and other custodial
financial institutions. The failure of banks which hold cash on behalf of the Company, the Company’s underlying obligors,
the collateral managers of the CLOs in which the Company invests (or managers of other securitized or pooled vehicles in which
the Company invests), or the Company’s service providers could adversely affect the Company’s ability to pursue its
investment strategies and objectives. For example, if an underlying obligor has a commercial relationship with a bank that has
failed or is otherwise distressed, such company may experience delays or other disruptions in meeting its obligations and consummating
business transactions. Additionally, if a collateral manager has a commercial relationship with a distressed bank, the manager
may experience issues conducting its operations or consummating transactions on behalf of the CLOs it manages, which could negatively
affect the performance of such CLOs (and, therefore, the performance of the Company).
|
|
|
|
|
|
|
|
| Effects of Leverage [Text Block] |
|
|
|
|
|
|
|
|
|
|
|
|
|
|
Use of Leverage and
Leverage Risks
The use of leverage, whether
directly through borrowing under a revolving credit facility with BNP Paribas (the “Credit Facility”) or the issuance
of the Series A Term Preferred Stock and Series B Term Preferred Stock, or indirectly through investments such as CLO junior debt
and equity securities that inherently involve leverage, may magnify our risk of loss. CLO junior debt and equity securities are
very highly leveraged (with CLO equity securities typically being leveraged ten times), and therefore the CLO securities in which
we invest are subject to a higher degree of loss since the use of leverage magnifies losses.
We have incurred leverage
by issuing preferred stock and incurring indebtedness for borrowed money. We may incur additional leverage, directly or indirectly,
through one or more special purpose vehicles, indebtedness for borrowed money, as well as leverage in the form of derivative transactions,
additional shares of preferred stock, debt securities and other structures and instruments, in significant amounts and on terms
that the Adviser and our board of directors deem appropriate, subject to applicable limitations under the 1940 Act. Such leverage
may be used for the acquisition and financing of our investments, to pay fees and expenses and for other purposes. Such leverage
may be secured and/or unsecured. The more leverage we employ, the more likely a substantial change will occur in our NAV. Accordingly,
any event that adversely affects the value of an investment would be magnified to the extent leverage is utilized. The cumulative
effect of the use of leverage with respect to any investments in a market that moves adversely to such investments could result
in a substantial loss that would be greater than if our investments were not leveraged.
The following table is
intended to illustrate the effect of the use of direct leverage on returns from an investment in our common stock assuming various
annual returns, net of expenses. The calculations in the table below are hypothetical and actual returns may be higher or lower
than those appearing in the table below.
| Assumed Return on Our Portfolio (Net of Expenses) |
-10% |
-5% |
0% |
5% |
10% |
| Corresponding return to common stockholder(1) |
-19.24% |
-11.49% |
-3.74% |
4.01% |
11.76% |
| (1) | Assumes
(i) $269.6 million in pro forma total assets as of December 31, 2023 (adjusted to reflect (i) the issuance in the Company’s
“at-the-market” offering of 1.1 million shares of our common stock and 45,322 shares of our Series B Preferred Stock
from January 1, 2024 through February 15, 2024, yielding net proceeds to the Company of approximately $16.9 million; (ii) the
hypothetical borrowings of the full $25,000,000 available under the BNP Credit Facility) (ii) $174.0 million in pro forma net assets
as of December 31, 2023 (adjusted to reflect the issuances and borrowings described above); and (iii) an annualized average interest
rate on our indebtedness and preferred equity, as of December 31, 2023 (adjusted to reflect the issuances and borrowings described
above), of 6.60%. |
Based on our assumed leverage
described above, our investment portfolio would have been required to experience an annual return of at least 2.41% to cover annual
interest payments on our outstanding indebtedness and preferred equity.
|
|
|
|
|
|
|
|
| Effects of Leverage [Table Text Block] |
|
|
|
|
|
|
|
|
|
|
|
|
|
|
The following table is
intended to illustrate the effect of the use of direct leverage on returns from an investment in our common stock assuming various
annual returns, net of expenses. The calculations in the table below are hypothetical and actual returns may be higher or lower
than those appearing in the table below.
| Assumed Return on Our Portfolio (Net of Expenses) |
-10% |
-5% |
0% |
5% |
10% |
| Corresponding return to common stockholder(1) |
-19.24% |
-11.49% |
-3.74% |
4.01% |
11.76% |
| (1) | Assumes
(i) $269.6 million in pro forma total assets as of December 31, 2023 (adjusted to reflect (i) the issuance in the Company’s
“at-the-market” offering of 1.1 million shares of our common stock and 45,322 shares of our Series B Preferred Stock
from January 1, 2024 through February 15, 2024, yielding net proceeds to the Company of approximately $16.9 million; (ii) the
hypothetical borrowings of the full $25,000,000 available under the BNP Credit Facility) (ii) $174.0 million in pro forma net assets
as of December 31, 2023 (adjusted to reflect the issuances and borrowings described above); and (iii) an annualized average interest
rate on our indebtedness and preferred equity, as of December 31, 2023 (adjusted to reflect the issuances and borrowings described
above), of 6.60%. |
|
|
|
|
|
|
|
|
| Return at Minus Ten [Percent] |
[7] |
|
|
|
|
|
|
|
|
|
|
|
|
|
(19.24%)
|
|
|
|
|
|
|
|
| Return at Minus Five [Percent] |
[7] |
|
|
|
|
|
|
|
|
|
|
|
|
|
(11.49%)
|
|
|
|
|
|
|
|
| Return at Zero [Percent] |
[7] |
|
|
|
|
|
|
|
|
|
|
|
|
|
(3.74%)
|
|
|
|
|
|
|
|
| Return at Plus Five [Percent] |
[7] |
|
|
|
|
|
|
|
|
|
|
|
|
|
4.01%
|
|
|
|
|
|
|
|
| Return at Plus Ten [Percent] |
[7] |
|
|
|
|
|
|
|
|
|
|
|
|
|
11.76%
|
|
|
|
|
|
|
|
| Effects of Leverage, Purpose [Text Block] |
|
|
|
|
|
|
|
|
|
|
|
|
|
|
The following table is
intended to illustrate the effect of the use of direct leverage on returns from an investment in our common stock assuming various
annual returns, net of expenses. The calculations in the table below are hypothetical and actual returns may be higher or lower
than those appearing in the table below.
|
|
|
|
|
|
|
|
| Share Price [Table Text Block] |
|
|
|
|
|
|
|
|
|
|
|
|
|
|
Price
Range of Common Stock
Our
common stock began trading on July 24, 2019 and is currently traded on the NYSE under the symbol “EIC.” The following
table lists the high and low closing sale price for our common stock, the high and low closing sale price as a percentage
of NAV and distributions declared per share each quarter since January 1, 2022.
| |
|
|
|
Closing
Sales Price |
|
Premium
(Discount)
of
High
Sales
Price |
|
Premium
(Discount)
of Low
Sales
Price |
|
Distributions |
| Period |
|
NAV(1) |
|
High |
|
Low |
|
to
NAV(2) |
|
to
NAV(2) |
|
Declared(3) |
| Fiscal
year ending December 31, 2022(4) |
|
|
|
|
|
|
|
|
|
|
|
|
| First
quarter |
|
$16.52 |
|
$17.38 |
|
$15.85 |
|
5.2% |
|
(4.1)% |
|
$0.38 |
| Second
quarter |
|
$13.66 |
|
$17.91 |
|
$14.75 |
|
31.1% |
|
8.0% |
|
$0.38 |
| Third
quarter |
|
$13.05 |
|
$17.29 |
|
$13.60 |
|
32.5% |
|
4.2% |
|
$0.42 |
| Fourth
quarter |
|
$12.91 |
|
$16.11 |
|
$13.57 |
|
24.8% |
|
5.1% |
|
$0.48 |
| Fiscal
year ending December 31, 2023(5) |
|
|
|
|
|
|
|
|
|
|
|
|
| First
quarter |
|
$13.20 |
|
$15.48 |
|
$13.85 |
|
17.3% |
|
4.9% |
|
$0.48 |
| Second
quarter |
|
$13.00 |
|
$14.88 |
|
$13.05 |
|
14.5% |
|
0.3% |
|
$0.48 |
| Third
quarter |
|
$14.08 |
|
$14.55 |
|
$13.14 |
|
3.3% |
|
(6.7)% |
|
$0.54 |
| Fourth
quarter |
|
$14.39 |
|
$14.91 |
|
$13.64 |
|
3.5% |
|
(5.2)% |
|
$0.60 |
| (1) | NAV
per share is determined as of the last day in the relevant quarter and therefore may
not reflect the NAV per share on the date of the high and low sales prices. The NAVs
shown are based on outstanding shares at the end of each period. |
| (2) | Calculated
as of the respective high or low closing sales price divided by the quarter end NAV. |
| (3) | Represents
the cash distributions (including dividends, dividends reinvested and returns of capital,
if any) per share that we have declared on our common stock in the specified quarter.
Tax characteristics of distributions will vary. |
| (4) | For
the fiscal year ending December 31, 2022, as reported on the Company’s 2022
Form 1099-DIV, distributions made by the Company were comprised of net investment income,
as calculated on a per share basis, of 100% (or $1.53 per share of common stock). |
| (5) | For
the fiscal year ending December 31, 2023, as reported on the Company’s 2023
Form 1099-DIV, distributions made by the Company were comprised of net investment income,
as calculated on a per share basis, of 100% (or $1.98 per share of common stock). |
Shares
of closed-end management investment companies may trade at a market price that is less than the NAV that is attributable to those
shares. The possibility that the Company’s shares of common stock will trade at a discount to NAV or at a premium that is
unsustainable over the long term is separate and distinct from the risk that the Company’s NAV will decrease. It is not
possible to predict whether the Company’s shares will trade at, above or below NAV in the future. Our NAV per share was
$14.39 as of December 31, 2023. The closing sales price for shares of the Company’s common stock on the NYSE on December 29,
2022 was $14.57, which represented a 1.25% premium to NAV per share. On February 15, 2024, the last reported closing sales price
of the Company’s common stock was $15.74 per share. As of February 15, 2024, there were 10 stockholders of record of
the Company’s common stock (which does not reflect holders whose shares are held in street name by a broker, bank or other
nominee).
|
|
|
|
|
|
|
|
| Lowest Price or Bid |
|
|
|
|
$ 13.64
|
[8] |
$ 13.14
|
$ 13.05
|
$ 13.85
|
$ 13.57
|
[9] |
$ 13.60
|
$ 14.75
|
$ 15.85
|
|
|
|
|
|
|
|
|
| Highest Price or Bid |
|
|
|
|
$ 14.91
|
[8] |
$ 14.55
|
$ 14.88
|
$ 15.48
|
$ 16.11
|
[9] |
$ 17.29
|
$ 17.91
|
$ 17.38
|
|
|
|
|
|
|
|
|
| Lowest Price or Bid, NAV |
|
$ 14.94
|
|
|
|
|
|
|
|
|
|
|
|
|
|
|
|
|
|
|
|
|
| Highest Price or Bid, NAV |
|
15.04
|
|
|
|
|
|
|
|
|
|
|
|
|
|
|
|
|
|
|
|
|
| Highest Price or Bid, Premium (Discount) to NAV [Percent] |
[10] |
|
|
|
3.50%
|
[8] |
3.30%
|
14.50%
|
17.30%
|
24.80%
|
[9] |
32.50%
|
31.10%
|
5.20%
|
|
|
|
|
|
|
|
|
| Lowest Price or Bid, Premium (Discount) to NAV [Percent] |
[10] |
|
|
|
(5.20%)
|
[8] |
(6.70%)
|
0.30%
|
4.90%
|
5.10%
|
[9] |
4.20%
|
8.00%
|
(4.10%)
|
|
|
|
|
|
|
|
|
| Share Price |
|
$ 15.42
|
$ 14.57
|
|
$ 14.57
|
|
|
|
|
|
|
|
|
|
$ 14.57
|
|
|
|
|
$ 15.74
|
|
|
| NAV Per Share |
[11] |
|
$ 14.39
|
[8] |
$ 14.39
|
[8] |
$ 14.08
|
$ 13.00
|
$ 13.20
|
$ 12.91
|
[9] |
$ 13.05
|
$ 13.66
|
$ 16.52
|
$ 14.39
|
[8] |
$ 12.91
|
[9] |
|
|
|
|
| Latest Premium (Discount) to NAV [Percent] |
|
2.87%
|
1.25%
|
|
|
|
|
|
|
|
|
|
|
|
|
|
|
|
|
|
|
|
| Capital Stock, Long-Term Debt, and Other Securities [Abstract] |
|
|
|
|
|
|
|
|
|
|
|
|
|
|
|
|
|
|
|
|
|
|
| Capital Stock [Table Text Block] |
|
|
|
|
|
|
|
|
|
|
|
|
|
|
In addition
to our common stock, the Company has two preferred equity securities which trade on the NYSE, summarized below:
| Security |
NYSE
Symbol |
Par
Amount
Outstanding |
Rate |
Payment
Frequency |
Callable |
Maturity |
| 5.00%
Series A Term Preferred Stock due 2026 |
EICA |
$38.0
million |
5.00% |
Monthly |
Callable |
October
2026 |
| 7.75%
Series B Term Preferred Stock due 2028 |
EICB |
$34.3
million |
7.75% |
Monthly |
July
2025 |
July
2028 |
|
|
|
|
|
|
|
|
| Document Period End Date |
|
|
|
|
|
|
|
|
|
|
|
|
|
|
Dec. 31, 2023
|
|
|
|
|
|
|
|
| Risks of Investing in CLOs and Other Structured Debt Securities [Member] |
|
|
|
|
|
|
|
|
|
|
|
|
|
|
|
|
|
|
|
|
|
|
| General Description of Registrant [Abstract] |
|
|
|
|
|
|
|
|
|
|
|
|
|
|
|
|
|
|
|
|
|
|
| Risk [Text Block] |
|
|
|
|
|
|
|
|
|
|
|
|
|
|
Risks
of Investing in CLOs and Other Structured Debt Securities
CLOs
and other structured finance securities are generally backed by a pool of credit-related assets that serve as collateral. Accordingly,
CLO and structured finance securities present risks similar to those of other types of credit investments, including default (credit),
interest rate and prepayment risks. In addition, CLOs and other structured finance securities are often governed by a complex
series of legal documents and contracts, which increases the risk of dispute over the interpretation and enforceability of such
documents relative to other types of investments.
|
|
|
|
|
|
|
|
| Subordinated Securities Risk [Member] |
|
|
|
|
|
|
|
|
|
|
|
|
|
|
|
|
|
|
|
|
|
|
| General Description of Registrant [Abstract] |
|
|
|
|
|
|
|
|
|
|
|
|
|
|
|
|
|
|
|
|
|
|
| Risk [Text Block] |
|
|
|
|
|
|
|
|
|
|
|
|
|
|
Subordinated
Securities Risk
CLO
junior debt and equity securities that the Company may acquire are subordinated to more senior tranches of CLO debt. CLO junior
debt and equity securities are subject to increased risks of default relative to the holders of superior priority interests in
the same CLO. In addition, at the time of issuance, CLO equity securities are under-collateralized in that the face amount of
the CLO debt and CLO equity of a CLO at inception exceed its total assets. The Company will typically be in a subordinated or
first loss position with respect to realized losses on the underlying assets held by the CLOs in which the Company is invested.
|
|
|
|
|
|
|
|
| High-Yield Investment Risk [Member] |
|
|
|
|
|
|
|
|
|
|
|
|
|
|
|
|
|
|
|
|
|
|
| General Description of Registrant [Abstract] |
|
|
|
|
|
|
|
|
|
|
|
|
|
|
|
|
|
|
|
|
|
|
| Risk [Text Block] |
|
|
|
|
|
|
|
|
|
|
|
|
|
|
High-Yield
Investment Risk
The
CLO junior debt and equity securities that the Company acquires are typically rated below investment grade or, in the case of
CLO equity securities, unrated and are therefore considered “higher-yield” or “junk” securities and are
considered speculative with respect to timely payment of interest and repayment of principal. The senior secured loans and other
credit-related assets underlying CLOs are also typically higher-yield investments. Investing in CLO junior debt and equity securities
and other high-yield investments typically involves greater credit and liquidity risk than investment grade obligations, which
may adversely impact the Company’s performance.
|
|
|
|
|
|
|
|
| Leverage Risk [Member] |
|
|
|
|
|
|
|
|
|
|
|
|
|
|
|
|
|
|
|
|
|
|
| General Description of Registrant [Abstract] |
|
|
|
|
|
|
|
|
|
|
|
|
|
|
|
|
|
|
|
|
|
|
| Risk [Text Block] |
|
|
|
|
|
|
|
|
|
|
|
|
|
|
Leverage
Risk
The
use of leverage, whether directly or indirectly through investments such as CLO junior debt and equity securities that inherently
involve leverage, may magnify the Company’s risk of loss. CLO junior debt and equity securities are very highly leveraged
(with CLO equity securities typically being leveraged ten times), and therefore the CLO securities in which the Company invests
are subject to a higher degree of loss since the use of leverage magnifies losses.
|
|
|
|
|
|
|
|
| Credit Risk [Member] |
|
|
|
|
|
|
|
|
|
|
|
|
|
|
|
|
|
|
|
|
|
|
| General Description of Registrant [Abstract] |
|
|
|
|
|
|
|
|
|
|
|
|
|
|
|
|
|
|
|
|
|
|
| Risk [Text Block] |
|
|
|
|
|
|
|
|
|
|
|
|
|
|
Credit
Risk
If
(1) a CLO in which the Company invests, (2) an underlying asset of any such CLO or (3) any other type of credit investment in
the Company’s portfolio declines in price or fails to pay interest or principal when due because the issuer or debtor, as
the case may be, experiences a decline in its financial status, the Company’s income, net asset value (“NAV”)
and/or market price would be adversely impacted.
|
|
|
|
|
|
|
|
| Key Personnel Risk [Member] |
|
|
|
|
|
|
|
|
|
|
|
|
|
|
|
|
|
|
|
|
|
|
| General Description of Registrant [Abstract] |
|
|
|
|
|
|
|
|
|
|
|
|
|
|
|
|
|
|
|
|
|
|
| Risk [Text Block] |
|
|
|
|
|
|
|
|
|
|
|
|
|
|
Key
Personnel Risk
The
Adviser manages our investments. Consequently, the Company’s success depends, in large part, upon the services of the Adviser
(including Eagle Point Credit Management LLC, which provides the Adviser with investment professionals and other resources under
a personnel and resources agreement) and the skill and expertise of the Adviser’s professional personnel. There can be no
assurance that the professional personnel of the Adviser (or Eagle Point Credit Management LLC) will continue to serve in their
current positions or continue to be employed by the Adviser. We can offer no assurance that their services will be available for
any length of time or that the Adviser will continue indefinitely as the Company’s investment adviser.
|
|
|
|
|
|
|
|
| Conflicts of Interest Risk [Member] |
|
|
|
|
|
|
|
|
|
|
|
|
|
|
|
|
|
|
|
|
|
|
| General Description of Registrant [Abstract] |
|
|
|
|
|
|
|
|
|
|
|
|
|
|
|
|
|
|
|
|
|
|
| Risk [Text Block] |
|
|
|
|
|
|
|
|
|
|
|
|
|
|
Conflicts
of Interest Risk
The
Company’s executive officers and directors, and the Adviser and certain of its affiliates and their officers and employees,
including the Senior Investment Team, have several conflicts of interest as a result of the other activities in which they engage.
|
|
|
|
|
|
|
|
| Prepayment Risk [Member] |
|
|
|
|
|
|
|
|
|
|
|
|
|
|
|
|
|
|
|
|
|
|
| General Description of Registrant [Abstract] |
|
|
|
|
|
|
|
|
|
|
|
|
|
|
|
|
|
|
|
|
|
|
| Risk [Text Block] |
|
|
|
|
|
|
|
|
|
|
|
|
|
|
Prepayment
Risk
The
assets underlying the CLO securities in which the Company invests are subject to prepayment by the underlying corporate borrowers.
As such, the CLO securities and related investments in which the Company invests are subject to prepayment risk. If the Company
or a CLO collateral manager are unable to reinvest prepaid amounts in a new
investment with an expected rate of return at least
equal to that of the investment repaid, the Company’s investment performance will be adversely impacted.
|
|
|
|
|
|
|
|
| Liquidity Risk [Member] |
|
|
|
|
|
|
|
|
|
|
|
|
|
|
|
|
|
|
|
|
|
|
| General Description of Registrant [Abstract] |
|
|
|
|
|
|
|
|
|
|
|
|
|
|
|
|
|
|
|
|
|
|
| Risk [Text Block] |
|
|
|
|
|
|
|
|
|
|
|
|
|
|
Liquidity
Risk
Generally,
there is no public market for the CLO investments in which the Company invests. As such, the Company may not be able to sell such
investments quickly, or at all. If the Company is able to sell such investments, the prices the Company receives may not reflect
the Adviser’s assessment of their fair value or the amount paid for such investments by the Company.
|
|
|
|
|
|
|
|
| Management Fee Risk [Member] |
|
|
|
|
|
|
|
|
|
|
|
|
|
|
|
|
|
|
|
|
|
|
| General Description of Registrant [Abstract] |
|
|
|
|
|
|
|
|
|
|
|
|
|
|
|
|
|
|
|
|
|
|
| Risk [Text Block] |
|
|
|
|
|
|
|
|
|
|
|
|
|
|
Management
Fee Risk
The
Company’s management fee structure may incentivize the Adviser to use leverage in a manner that adversely impacts the Company’s
performance.
|
|
|
|
|
|
|
|
| Fair Valuation of the Company’s Portfolio Investments [Member] |
|
|
|
|
|
|
|
|
|
|
|
|
|
|
|
|
|
|
|
|
|
|
| General Description of Registrant [Abstract] |
|
|
|
|
|
|
|
|
|
|
|
|
|
|
|
|
|
|
|
|
|
|
| Risk [Text Block] |
|
|
|
|
|
|
|
|
|
|
|
|
|
|
Fair
Valuation of the Company’s Portfolio Investments
Generally,
there is no public market for the CLO investments and certain other credit assets in which the Company may invest. The Adviser
values these securities at least quarterly, or more frequently as may be required from time to time, at fair value. The Adviser’s
determinations of the fair value of the Company’s investments have a material impact on the Company’s net earnings
through the recording of unrealized appreciation or depreciation of investments and may cause the Company’s NAV on a given
date to understate or overstate, possibly materially, the value that the Company ultimately realizes on one or more of the Company’s
investments.
|
|
|
|
|
|
|
|
| Limited Investment Opportunities Risk [Member] |
|
|
|
|
|
|
|
|
|
|
|
|
|
|
|
|
|
|
|
|
|
|
| General Description of Registrant [Abstract] |
|
|
|
|
|
|
|
|
|
|
|
|
|
|
|
|
|
|
|
|
|
|
| Risk [Text Block] |
|
|
|
|
|
|
|
|
|
|
|
|
|
|
Limited
Investment Opportunities Risk
The
market for CLO securities is more limited than the market for other credit related investments. The Company can offer no assurances
that sufficient investment opportunities for the Company’s capital will be available. In recent years there has been a marked
increase in the number of, and flow of capital into, investment vehicles established to pursue investments in CLO securities whereas
the size of this market is relatively limited. While the Company cannot determine the precise effect of such competition, such
increase may result in greater competition for investment opportunities, which may result in an increase in the price of such
investments relative to the risk taken on by holders of such investments. Such competition may also result under certain circumstances
in increased price volatility or decreased liquidity with respect to certain positions.
|
|
|
|
|
|
|
|
| Market Risk [Member] |
|
|
|
|
|
|
|
|
|
|
|
|
|
|
|
|
|
|
|
|
|
|
| General Description of Registrant [Abstract] |
|
|
|
|
|
|
|
|
|
|
|
|
|
|
|
|
|
|
|
|
|
|
| Risk [Text Block] |
|
|
|
|
|
|
|
|
|
|
|
|
|
|
Market
Risk
Political,
regulatory, economic and social developments, and developments that impact specific economic sectors, industries or segments of
the market, can affect the value of the Company’s investments. A disruption or downturn in the capital markets and the credit
markets could impair the Company’s ability to raise capital, reduce the availability of suitable investment opportunities
for the Company, or adversely and materially affect the value of the Company’s investments, any of which would negatively
affect the Company’s business. These risks may be magnified if certain events or developments adversely interrupt the global
supply chain, and could affect companies worldwide.
|
|
|
|
|
|
|
|
| Loan Accumulation Facilities Risk [Member] |
|
|
|
|
|
|
|
|
|
|
|
|
|
|
|
|
|
|
|
|
|
|
| General Description of Registrant [Abstract] |
|
|
|
|
|
|
|
|
|
|
|
|
|
|
|
|
|
|
|
|
|
|
| Risk [Text Block] |
|
|
|
|
|
|
|
|
|
|
|
|
|
|
Loan
Accumulation Facilities Risk
The
Company may invest in LAFs, which are short to medium term facilities often provided by the bank that will serve as placement
agent or arranger on a CLO transaction and which acquire loans on an interim basis which are expected to form part of the portfolio
of a future CLO. Investments in LAFs have risks similar to those applicable to investments in CLOs. Leverage is typically utilized
in such a facility and as such the potential risk of loss will be increased for such facilities employing leverage. In the event
a planned CLO is not consummated, or the loans are not eligible for purchase by the CLO, the Company may be responsible for either
holding or disposing of the loans. This could expose the Company to credit and/or mark-to-market losses, and other risks.
|
|
|
|
|
|
|
|
| Synthetic Investments Risk [Member] |
|
|
|
|
|
|
|
|
|
|
|
|
|
|
|
|
|
|
|
|
|
|
| General Description of Registrant [Abstract] |
|
|
|
|
|
|
|
|
|
|
|
|
|
|
|
|
|
|
|
|
|
|
| Risk [Text Block] |
|
|
|
|
|
|
|
|
|
|
|
|
|
|
Synthetic
Investments Risk
The
Company may invest in synthetic investments, such as significant risk transfer securities and credit risk transfer securities
issued by banks or other financial institutions, or acquire interests in lease agreements that have the general characteristics
of loans and are treated as loans for withholding tax purposes. In addition to the credit risks associated with the applicable
reference assets, the Company will usually have a contractual relationship only with the
counterparty of such synthetic investment,
and not with the reference obligor of the reference asset. Accordingly, the Company generally will have no right to directly enforce
compliance by the reference obligor with the terms of the reference asset nor will it have any rights of setoff against the reference
obligor or rights with respect to the reference asset. The Company will not directly benefit from the collateral supporting the
reference asset and will not have the benefit of the remedies that would normally be available to a holder of such reference asset.
In addition, in the event of the insolvency of the counterparty, the Company may be treated as a general creditor of such counterparty,
and will not have any claim with respect to the reference asset.
|
|
|
|
|
|
|
|
| Currency Risk [Member] |
|
|
|
|
|
|
|
|
|
|
|
|
|
|
|
|
|
|
|
|
|
|
| General Description of Registrant [Abstract] |
|
|
|
|
|
|
|
|
|
|
|
|
|
|
|
|
|
|
|
|
|
|
| Risk [Text Block] |
|
|
|
|
|
|
|
|
|
|
|
|
|
|
Currency
Risk
Although
the Company primarily makes investments denominated in U.S. dollars, the Company may make investments denominated in other currencies.
The Company’s investments denominated in currencies other than U.S. dollars will be subject to the risk that the value of
such currency will decrease in relation to the U.S. dollar. The Company may or may not hedge currency risk.
|
|
|
|
|
|
|
|
| Hedging Risk [Member] |
|
|
|
|
|
|
|
|
|
|
|
|
|
|
|
|
|
|
|
|
|
|
| General Description of Registrant [Abstract] |
|
|
|
|
|
|
|
|
|
|
|
|
|
|
|
|
|
|
|
|
|
|
| Risk [Text Block] |
|
|
|
|
|
|
|
|
|
|
|
|
|
|
Hedging
Risk
Hedging
transactions seeking to reduce risks may result in poorer overall performance than if the Company had not engaged in such hedging
transactions. Additionally, such transactions may not fully hedge the Company’s risks.
|
|
|
|
|
|
|
|
| Reinvestment Risk [Member] |
|
|
|
|
|
|
|
|
|
|
|
|
|
|
|
|
|
|
|
|
|
|
| General Description of Registrant [Abstract] |
|
|
|
|
|
|
|
|
|
|
|
|
|
|
|
|
|
|
|
|
|
|
| Risk [Text Block] |
|
|
|
|
|
|
|
|
|
|
|
|
|
|
Reinvestment
Risk
CLOs
will typically generate cash from asset repayments and sales that may be reinvested in substitute assets, subject to compliance
with applicable investment tests. If the CLO collateral manager causes the CLO to purchase substitute assets at a lower yield
than those initially acquired or sale proceeds are maintained temporarily in cash, it would reduce the excess interest-related
cash flow, thereby having a negative effect on the fair value of the Company’s assets and the market value of the Company’s
securities. In addition, the reinvestment period for a CLO may terminate early, which would cause the holders of the CLO’s
securities to receive principal payments earlier than anticipated. There can be no assurance that the Company will be able to
reinvest such amounts in an alternative investment that provides a comparable return relative to the credit risk assumed.
|
|
|
|
|
|
|
|
| Interest Rate Risk [Member] |
|
|
|
|
|
|
|
|
|
|
|
|
|
|
|
|
|
|
|
|
|
|
| General Description of Registrant [Abstract] |
|
|
|
|
|
|
|
|
|
|
|
|
|
|
|
|
|
|
|
|
|
|
| Risk [Text Block] |
|
|
|
|
|
|
|
|
|
|
|
|
|
|
Interest
Rate Risk
The
price of certain of the Company’s investments may be significantly affected by changes in interest rates, including recent
increases in interest rates. Although senior secured loans are generally floating rate instruments, the Company’s investments
in senior secured loans through investments in junior equity and debt tranches of CLOs are sensitive to interest rate levels and
volatility. For example, because CLO debt securities are floating rate securities, a reduction in interest rates would generally
result in a reduction in the coupon payment and cash flow the Company receives on the Company’s CLO debt investments. Further,
in the event of a significant rising interest rate environment and/or economic downturn, loan defaults may increase and result
in credit losses that may adversely affect the Company’s cash flow, fair value of the Company’s assets and operating
results. Because CLOs generally issue debt on a floating rate basis, an increase in the relevant benchmark index will increase
the financing costs of CLOs.
Furthermore,
certain senior secured loans that constitute the collateral of the CLOs in which the Company invests may continue to pay interest
at a floating rate based on LIBOR (or a “synthetic” calculation of LIBOR which is currently expected to continue to
be published until September 30, 2024) or may convert to a fixed rate of interest. To the extent that any LIBOR replacement rate
utilized for senior secured loans differs from that utilized for debt of a CLO that holds those loans, for the duration of such
mismatch, the CLO would experience an interest rate mismatch between its assets and liabilities, which could have an adverse impact
on the cash flows distributed to CLO equity investors (and, therefore, the Company’s net investment income and portfolio
returns) until such mismatch is corrected or minimized.
|
|
|
|
|
|
|
|
| Refinancing Risk [Member] |
|
|
|
|
|
|
|
|
|
|
|
|
|
|
|
|
|
|
|
|
|
|
| General Description of Registrant [Abstract] |
|
|
|
|
|
|
|
|
|
|
|
|
|
|
|
|
|
|
|
|
|
|
| Risk [Text Block] |
|
|
|
|
|
|
|
|
|
|
|
|
|
|
Refinancing
Risk
If
the Company incurs debt financing and subsequently refinance such debt, the replacement debt may be at a higher cost and on less
favorable terms and conditions. If the Company fails to extend, refinance or replace such debt financings prior to their maturity
on commercially reasonable terms, the Company’s liquidity will be lower than it would have been with the benefit of such
financings, which would limit the Company’s ability to grow, and holders
of the Company’s common stock would not benefit
from the potential for increased returns on equity that incurring leverage creates.
|
|
|
|
|
|
|
|
| Tax Risk [Member] |
|
|
|
|
|
|
|
|
|
|
|
|
|
|
|
|
|
|
|
|
|
|
| General Description of Registrant [Abstract] |
|
|
|
|
|
|
|
|
|
|
|
|
|
|
|
|
|
|
|
|
|
|
| Risk [Text Block] |
|
|
|
|
|
|
|
|
|
|
|
|
|
|
Tax
Risk
If
the Company fails to qualify for tax treatment as a RIC under Subchapter M of the Code for any reason, or otherwise becomes subject
to corporate income tax, the resulting corporate taxes (and any related penalties) could substantially reduce the Company’s
net assets, the amount of income available for distributions to the Company’s stockholders, and the amount of income available
for payment of the Company’s other liabilities.
|
|
|
|
|
|
|
|
| Counterparty Risk [Member] |
|
|
|
|
|
|
|
|
|
|
|
|
|
|
|
|
|
|
|
|
|
|
| General Description of Registrant [Abstract] |
|
|
|
|
|
|
|
|
|
|
|
|
|
|
|
|
|
|
|
|
|
|
| Risk [Text Block] |
|
|
|
|
|
|
|
|
|
|
|
|
|
|
Counterparty
Risk
The
Company may be exposed to counterparty risk, which could make it difficult for the Company or the issuers in which the Company
invests to collect on obligations, thereby resulting in potentially significant losses.
|
|
|
|
|
|
|
|
| Price Risk [Member] |
|
|
|
|
|
|
|
|
|
|
|
|
|
|
|
|
|
|
|
|
|
|
| General Description of Registrant [Abstract] |
|
|
|
|
|
|
|
|
|
|
|
|
|
|
|
|
|
|
|
|
|
|
| Risk [Text Block] |
|
|
|
|
|
|
|
|
|
|
|
|
|
|
Price
Risk
Investors
who buy shares at different times will likely pay different prices.
|
|
|
|
|
|
|
|
| Global Risks [Member] |
|
|
|
|
|
|
|
|
|
|
|
|
|
|
|
|
|
|
|
|
|
|
| General Description of Registrant [Abstract] |
|
|
|
|
|
|
|
|
|
|
|
|
|
|
|
|
|
|
|
|
|
|
| Risk [Text Block] |
|
|
|
|
|
|
|
|
|
|
|
|
|
|
Global
Risks
Due
to highly interconnected global economies and financial markets, the value of the Company’s securities and its underlying
investments may go up or down in response to governmental actions and/or general economic conditions throughout the world. Events
such as war, military conflict, acts of terrorism, social unrest, natural disasters, recessions, inflation, rapid interest rate
changes, supply chain disruptions, sanctions, the spread of infectious illness or other public health threats could also significantly
impact the Company and its investments.
|
|
|
|
|
|
|
|
| Banking Risk [Member] |
|
|
|
|
|
|
|
|
|
|
|
|
|
|
|
|
|
|
|
|
|
|
| General Description of Registrant [Abstract] |
|
|
|
|
|
|
|
|
|
|
|
|
|
|
|
|
|
|
|
|
|
|
| Risk [Text Block] |
|
|
|
|
|
|
|
|
|
|
|
|
|
|
Banking
Risk
The
possibility of future bank failures poses risks of reduced financial market liquidity at clearing, cash management and other custodial
financial institutions. The failure of banks which hold cash on behalf of the Company, the Company’s underlying obligors,
the collateral managers of the CLOs in which the Company invests (or managers of other securitized or pooled vehicles in which
the Company invests), or the Company’s service providers could adversely affect the Company’s ability to pursue its
investment strategies and objectives. For example, if an underlying obligor has a commercial relationship with a bank that has
failed or is otherwise distressed, such company may experience delays or other disruptions in meeting its obligations and consummating
business transactions. Additionally, if a collateral manager has a commercial relationship with a distressed bank, the manager
may experience issues conducting its operations or consummating transactions on behalf of the CLOs it manages, which could negatively
affect the performance of such CLOs (and, therefore, the performance of the Company).
|
|
|
|
|
|
|
|
| Revolving Credit Facility (BNP Paribas) [Member] |
|
|
|
|
|
|
|
|
|
|
|
|
|
|
|
|
|
|
|
|
|
|
| Financial Highlights [Abstract] |
|
|
|
|
|
|
|
|
|
|
|
|
|
|
|
|
|
|
|
|
|
|
| Senior Securities Amount |
|
|
$ 14,520,000
|
|
$ 14,520,000
|
|
|
|
|
$ 9,030,000
|
|
|
|
|
$ 14,520,000
|
|
$ 9,030,000
|
|
$ 19,550,000
|
|
|
|
| Senior Securities Coverage per Unit |
[12] |
|
$ 16,681.46
|
|
$ 16,681.46
|
|
|
|
|
$ 16,296.64
|
|
|
|
|
$ 16,681.46
|
|
$ 16,296.64
|
|
$ 8,732.75
|
|
|
|
| Revolving Credit Facility (Societe Generale) [Member] |
|
|
|
|
|
|
|
|
|
|
|
|
|
|
|
|
|
|
|
|
|
|
| Financial Highlights [Abstract] |
|
|
|
|
|
|
|
|
|
|
|
|
|
|
|
|
|
|
|
|
|
|
| Senior Securities Amount |
|
|
|
|
|
|
|
|
|
|
|
|
|
|
|
|
|
|
|
|
$ 14,815,000
|
$ 13,743,000
|
| Senior Securities Coverage per Unit |
[12] |
|
|
|
|
|
|
|
|
|
|
|
|
|
|
|
|
|
|
|
$ 7,960.52
|
$ 9,470.38
|
| Common Shares [Member] |
|
|
|
|
|
|
|
|
|
|
|
|
|
|
|
|
|
|
|
|
|
|
| Other Annual Expenses [Abstract] |
|
|
|
|
|
|
|
|
|
|
|
|
|
|
|
|
|
|
|
|
|
|
| Basis of Transaction Fees, Note [Text Block] |
|
|
|
|
|
|
|
|
|
|
|
|
|
|
as a percentage of net assets attributable to common stock
|
|
|
|
|
|
|
|
| Capital Stock, Long-Term Debt, and Other Securities [Abstract] |
|
|
|
|
|
|
|
|
|
|
|
|
|
|
|
|
|
|
|
|
|
|
| Capital Stock [Table Text Block] |
|
|
|
|
|
|
|
|
|
|
|
|
|
|
As
of December 31, 2022, there were 150,000,000 shares of common stock authorized, of which 7,896,757 shares were issued and outstanding.
On
December 13, 2022, the Company launched a new ATM offering to sell up to $4.0 million aggregate amount of its common stock, pursuant
to a prospectus supplement filed with the SEC on May 29, 2020 and additional supplements thereafter. On January 20, 2023, the
Company filed a prospectus supplement to update the aggregate offering price of common stock sold through the existing ATM offering
from $4.0 million to $5.75 million, exclusive of any shares of common stock previously sold through the ATM offering. On May 12,
2023, the Company filed a prospectus supplement to update the aggregate offering price of common stock sold through the existing
ATM offering from $5.75 million to $4.1 million, exclusive of any shares of common stock previously sold through the
ATM offering.
On June 12, 2023, the Company filed a prospectus supplement to update the aggregate offering price of common stock sold through
the existing ATM offering from $4.1 million to $1.54 million, exclusive of any shares of common stock previously sold through
the ATM offering. On June 14, 2023, the Company filed a prospectus supplement to update the aggregate offering price of common
stock sold through the existing ATM offering from $1.5 million to $75.0 million, exclusive of any shares of common stock previously
sold through the ATM offering.
On
June 29, 2023, the Company filed a new shelf registration statement with 150,000,000 shares of common stock authorized. As a result
of the new shelf registration, $123,158 in remaining prepaid expense balance associated with the previous shelf registration was
expensed into professional fees in the Consolidated Statement of Operations.
On
June 30, 2023, the Company launched a new ATM offering to sell up to $75.0 million aggregate amount of its common stock, pursuant
to a prospectus filed with the SEC on June 29, 2023.
On
August 16, 2022, the Company entered into an agreement (the “Purchase Agreement”) with B. Riley Principal Capital
II, LLC (“BRPC II”) in which BRPC II has committed to purchase from the Company, at the Company’s discretion,
up to $20.0 million of the Company’s common stock, subject to terms and conditions specified in the Purchase Agreement (referred
to as the “Committed Equity Financing”). The Company filed a registration statement on December 15, 2022 in relation
to the Committed Equity Financing.
For
the year ended December 31, 2023, the Company sold 3,065,862 shares of its common stock, pursuant to the ATM offerings and Committed
Equity Financing, for total net proceeds to the Company of approximately $42.3 million. In connection with such sales, the Company
paid a total of approximately $0.7 million in sales agent commissions.
For
the year ended December 31, 2023, 34,779 shares of common stock were issued in connection with the DRIP for total net proceeds
to the Company of approximately $0.5 million.
As
of December 31, 2023, there were 150,000,000 shares of common stock authorized, of which 10,997,398 shares were issued and outstanding.
|
|
|
|
|
|
|
|
| Outstanding Security, Authorized [Shares] |
|
|
150,000,000
|
|
|
|
|
|
|
|
|
|
|
|
|
|
|
|
|
|
|
|
| Outstanding Security, Not Held [Shares] |
|
|
7,896,757
|
|
|
|
|
|
|
|
|
|
|
|
|
|
|
|
|
|
|
|
| Preferred Shares [Member] |
|
|
|
|
|
|
|
|
|
|
|
|
|
|
|
|
|
|
|
|
|
|
| Financial Highlights [Abstract] |
|
|
|
|
|
|
|
|
|
|
|
|
|
|
|
|
|
|
|
|
|
|
| Senior Securities Amount |
|
|
$ 72,353,275
|
|
$ 72,353,275
|
|
|
|
|
$ 38,041,225
|
|
|
|
|
$ 72,353,275
|
|
$ 38,041,225
|
|
$ 35,000,000
|
|
|
|
| Senior Securities Coverage per Unit |
[12] |
|
$ 69.70
|
|
$ 69.70
|
|
|
|
|
$ 78.16
|
|
|
|
|
$ 69.70
|
|
$ 78.16
|
|
$ 78.24
|
|
|
|
| Preferred Stock Liquidating Preference |
[13] |
|
$ 25
|
|
$ 25
|
|
|
|
|
$ 25
|
|
|
|
|
25
|
|
25
|
|
25
|
|
|
|
| Senior Securities Average Market Value per Unit |
[14] |
|
|
|
|
|
|
|
|
|
|
|
|
|
$ 23.81
|
|
$ 23.68
|
|
$ 25.32
|
|
|
|
| Capital Stock, Long-Term Debt, and Other Securities [Abstract] |
|
|
|
|
|
|
|
|
|
|
|
|
|
|
|
|
|
|
|
|
|
|
| Capital Stock [Table Text Block] |
|
|
|
|
|
|
|
|
|
|
|
|
|
|
| 6. | MANDATORY
REDEEMABLE PREFERRED STOCK |
As
of December 31, 2023, there were 20,000,000 shares of preferred stock authorized, par value $0.001 per share, of which 1,521,649
shares of Series A Term Preferred Stock and 1,372,482 of Series B Term Preferred were issued and outstanding.
The
Company has accounted for its Preferred Stock as a liability under ASC 480 due to their mandatory redemption requirements.
Except
where otherwise stated in the 1940 Act or the Company’s certificate of incorporation, each holder of Preferred Stock will
be entitled to one vote for each share of preferred stock held on each matter submitted to a vote of the Company’s stockholders.
The Company’s preferred stockholders and common stockholders will vote together as a single class on all matters submitted
to the Company’s stockholders. Additionally, the Company’s preferred stockholders will have the right to elect two
Preferred Directors at all times, while the Company’s preferred stockholders and common stockholders, voting together as
a single class, will elect the remaining members of the Board.
The
Company has elected the FVO under ASC 825 for its Preferred Stock. Accordingly, the Preferred Stock is measured at fair value.
Series
A Term Preferred Stock
The
Company is required to redeem all outstanding shares of the Series A Term Preferred Stock on October 30, 2026, at a redemption
price of $25 per share (the “Series A Liquidation Preference”), plus accumulated but unpaid dividends, if any. At
any time on or after October 31, 2023, the Company may, at its sole option, redeem the
outstanding shares of the Series A Term
Preferred Stock.
The
estimated change in fair value of the Series A Term Preferred Stock attributable to market risk for the year ended December 31,
2023 is approximately ($0.9) million, which is recorded as unrealized (appreciation) depreciation on liabilities at fair value
under the FVO on the Consolidated Statement of Operations.
The
estimated change in fair value of the Series A Term Preferred Stock attributable to instrument-specific credit risk for the year
ended December 31, 2023 is approximately $1.9 million, which is recorded as unrealized (appreciation) depreciation on liabilities
at fair value under the FVO on the Consolidated Statement of Comprehensive Income. The Company defines the change in fair value
attributable to instrument-specific credit risk as the excess of the total change in fair value over the change in fair value
attributable to changes in a base market rate, such as a United States treasury bond index with a similar maturity to the instrument
being valued.
On
June 30, 2023, the Company launched a new ATM offering to sell up to 1,000,000 shares of Series A Term Preferred Stock with an
aggregate liquidation preference of $25 million, pursuant to a prospectus filed with the SEC on June 29, 2023.
Series
B Term Preferred Stock
On
July 26, 2023, the Company closed an underwritten public offering of 1,130,500 shares of its Series B Term Preferred Stock, resulting
in net proceeds to the Company of approximately $27.1 million after payment of underwriting discounts and commissions of approximately
$0.9 million and offering expenses of approximately $0.3 million. On August 3, 2023, the underwriters purchased an additional
169,575 shares of its Series B Term Preferred Stock pursuant to the underwriters’ overallotment option, which resulted in
additional net proceeds to the Company of approximately $4.1 million after payment of underwriting discounts and commissions of
approximately $0.1 million.
The
Company is required to redeem all outstanding shares of the Series B Term Preferred Stock on July 31, 2028, at a redemption price
of $25 per share (the “Series B Liquidation Preference”), plus accumulated but unpaid dividends, if any. At any time
on or after July 31, 2025, the Company may, at its sole option, redeem the outstanding shares of the Series B Term Preferred Stock.
The
Company has accounted for its Series B Term Preferred Stock utilizing the FVO under ASC 825. Accordingly, the Series B Term Preferred
Stock are measured at their fair value and issuance costs in the aggregate amount of approximately $1.3 million, which consisted
of approximately $1.0 million of underwriting commissions, $0.2 million of professional fees and $0.1 million of other expenses,
were expensed as incurred in the year ended December 31, 2023.
The
estimated change in fair value of the Series B Term Preferred Stock attributable to market risk for the year ended December 31,
2023 is approximately ($0.3) million, which is recorded as unrealized (appreciation) depreciation on liabilities at fair value
under the FVO on the Consolidated Statement of Operations.
The
estimated change in fair value of the Series B Term Preferred Stock attributable to instrument-specific credit risk for the year
ended December 31, 2023 is approximately $0.4 million, which is recorded as unrealized (appreciation) depreciation on liabilities
at fair value under the FVO on the Consolidated Statement of Comprehensive Income. The Company defines the change in fair value
attributable to instrument-specific credit risk as the excess of the total change in fair value over the change in fair value
attributable to changes in a base market rate, such as a United States treasury bond index with a similar maturity to the instrument
being valued.
Pursuant
to a prospectus supplement filed with the SEC on August 22, 2023, the Company updated the ATM offering to allow the Company to
sell up to 1,000,000 shares of Series B Term Preferred Stock with an aggregate liquidation preference of $25 million, pursuant
to a prospectus filed with the SEC on June 29, 2023.
For
the year ended December 31, 2023, the Company sold 72,407 shares of its Series B Term Preferred Stock pursuant to the ATM offering
for total proceeds to the company of approximately $1.8 million. In connection with such sales,
the Company paid a total of $36,274
in sales commissions.
See
Note 10 “Asset Coverage” for further discussion on the Company’s calculation of asset coverage with respect
to its Preferred Stock.
|
|
|
|
|
|
|
|
| Security Voting Rights [Text Block] |
|
|
|
|
|
|
|
|
|
|
|
|
|
|
Except
where otherwise stated in the 1940 Act or the Company’s certificate of incorporation, each holder of Preferred Stock will
be entitled to one vote for each share of preferred stock held on each matter submitted to a vote of the Company’s stockholders.
The Company’s preferred stockholders and common stockholders will vote together as a single class on all matters submitted
to the Company’s stockholders. Additionally, the Company’s preferred stockholders will have the right to elect two
Preferred Directors at all times, while the Company’s preferred stockholders and common stockholders, voting together as
a single class, will elect the remaining members of the Board.
|
|
|
|
|
|
|
|
| Outstanding Security, Authorized [Shares] |
|
|
20,000,000
|
|
|
|
|
|
|
|
|
|
|
|
|
|
|
|
|
|
|
|
| 5.00% Series A Term Preferred Stock due 2026 [Member] |
|
|
|
|
|
|
|
|
|
|
|
|
|
|
|
|
|
|
|
|
|
|
| Capital Stock, Long-Term Debt, and Other Securities [Abstract] |
|
|
|
|
|
|
|
|
|
|
|
|
|
|
|
|
|
|
|
|
|
|
| Security Title [Text Block] |
|
|
|
|
|
|
|
|
|
|
|
|
|
|
5.00%
Series A Term Preferred Stock due 2026
|
|
|
|
|
|
|
|
| Preferred Stock Restrictions, Other [Text Block] |
|
|
|
|
|
|
|
|
|
|
|
|
|
|
The
Company is required to redeem all outstanding shares of the Series A Term Preferred Stock on October 30, 2026, at a redemption
price of $25 per share (the “Series A Liquidation Preference”), plus accumulated but unpaid dividends, if any. At
any time on or after October 31, 2023, the Company may, at its sole option, redeem the
outstanding shares of the Series A Term
Preferred Stock.
|
|
|
|
|
|
|
|
| Outstanding Security, Not Held [Shares] |
|
|
1,521,649
|
|
|
|
|
|
|
|
|
|
|
|
|
|
|
|
|
|
|
|
| 7.75% Series B Term Preferred Stock due 2028 [Member] |
|
|
|
|
|
|
|
|
|
|
|
|
|
|
|
|
|
|
|
|
|
|
| Capital Stock, Long-Term Debt, and Other Securities [Abstract] |
|
|
|
|
|
|
|
|
|
|
|
|
|
|
|
|
|
|
|
|
|
|
| Security Title [Text Block] |
|
|
|
|
|
|
|
|
|
|
|
|
|
|
7.75%
Series B Term Preferred Stock due 2028
|
|
|
|
|
|
|
|
| Preferred Stock Restrictions, Other [Text Block] |
|
|
|
|
|
|
|
|
|
|
|
|
|
|
The
Company is required to redeem all outstanding shares of the Series B Term Preferred Stock on July 31, 2028, at a redemption price
of $25 per share (the “Series B Liquidation Preference”), plus accumulated but unpaid dividends, if any. At any time
on or after July 31, 2025, the Company may, at its sole option, redeem the outstanding shares of the Series B Term Preferred Stock.
|
|
|
|
|
|
|
|
| Outstanding Security, Not Held [Shares] |
|
|
1,372,482
|
|
|
|
|
|
|
|
|
|
|
|
|
|
|
|
|
|
|
|
|
|
| X |
- ReferencesReference 1: http://www.xbrl.org/2003/role/presentationRef
-Publisher SEC
-Name Form N-2
-Section Item 3
-Subsection 1
-Paragraph Instruction 6
| Name: |
cef_AnnualExpensesTableTextBlock |
| Namespace Prefix: |
cef_ |
| Data Type: |
dtr-types:textBlockItemType |
| Balance Type: |
na |
| Period Type: |
duration |
|
| X |
- ReferencesReference 1: http://www.xbrl.org/2003/role/presentationRef
-Publisher SEC
-Name Form N-2
-Section Item 3
-Subsection 1
-Paragraph Instruction 4
| Name: |
cef_BasisOfTransactionFeesNoteTextBlock |
| Namespace Prefix: |
cef_ |
| Data Type: |
dtr-types:textBlockItemType |
| Balance Type: |
na |
| Period Type: |
duration |
|
| X |
- ReferencesReference 1: http://www.xbrl.org/2003/role/presentationRef
-Publisher SEC
-Name Form N-2
-Section Item 10
| Name: |
cef_CapitalStockLongTermDebtAndOtherSecuritiesAbstract |
| Namespace Prefix: |
cef_ |
| Data Type: |
xbrli:stringItemType |
| Balance Type: |
na |
| Period Type: |
duration |
|
| X |
- ReferencesReference 1: http://www.xbrl.org/2003/role/presentationRef
-Publisher SEC
-Name Form N-2
-Section Item 10
-Subsection 1
-Paragraph a
| Name: |
cef_CapitalStockTableTextBlock |
| Namespace Prefix: |
cef_ |
| Data Type: |
dtr-types:textBlockItemType |
| Balance Type: |
na |
| Period Type: |
duration |
|
| X |
- ReferencesReference 1: http://www.xbrl.org/2003/role/presentationRef
-Publisher SEC
-Name Form N-2
-Section Item 3
-Subsection 1
| Name: |
cef_DividendReinvestmentAndCashPurchaseFees |
| Namespace Prefix: |
cef_ |
| Data Type: |
xbrli:monetaryItemType |
| Balance Type: |
na |
| Period Type: |
duration |
|
| X |
- ReferencesReference 1: http://www.xbrl.org/2003/role/presentationRef
-Publisher SEC
-Name Form N-2
-Section Item 8
-Subsection 3
-Paragraph b
-Subparagraph 3
| Name: |
cef_EffectsOfLeveragePurposeTextBlock |
| Namespace Prefix: |
cef_ |
| Data Type: |
dtr-types:textBlockItemType |
| Balance Type: |
na |
| Period Type: |
duration |
|
| X |
- ReferencesReference 1: http://www.xbrl.org/2003/role/presentationRef
-Publisher SEC
-Name Form N-2
-Section Item 8
-Subsection 3
-Paragraph b
-Subparagraph 3
| Name: |
cef_EffectsOfLeverageTableTextBlock |
| Namespace Prefix: |
cef_ |
| Data Type: |
dtr-types:textBlockItemType |
| Balance Type: |
na |
| Period Type: |
duration |
|
| X |
- ReferencesReference 1: http://www.xbrl.org/2003/role/presentationRef
-Publisher SEC
-Name Form N-2
-Section Item 8
-Subsection 3
-Paragraph b
| Name: |
cef_EffectsOfLeverageTextBlock |
| Namespace Prefix: |
cef_ |
| Data Type: |
dtr-types:textBlockItemType |
| Balance Type: |
na |
| Period Type: |
duration |
|
| X |
- ReferencesReference 1: http://www.xbrl.org/2003/role/presentationRef
-Publisher SEC
-Name Form N-2
-Section Item 3
-Subsection 1
| Name: |
cef_ExpenseExampleTableTextBlock |
| Namespace Prefix: |
cef_ |
| Data Type: |
dtr-types:textBlockItemType |
| Balance Type: |
na |
| Period Type: |
duration |
|
| X |
- ReferencesReference 1: http://www.xbrl.org/2003/role/presentationRef
-Publisher SEC
-Name Form N-2
-Section Item 3
-Subsection 1
-Paragraph Instruction 11
| Name: |
cef_ExpenseExampleYear01 |
| Namespace Prefix: |
cef_ |
| Data Type: |
xbrli:monetaryItemType |
| Balance Type: |
na |
| Period Type: |
duration |
|
| X |
- ReferencesReference 1: http://www.xbrl.org/2003/role/presentationRef
-Publisher SEC
-Name Form N-2
-Section Item 3
-Subsection 1
-Paragraph Instruction 11
| Name: |
cef_ExpenseExampleYears1to10 |
| Namespace Prefix: |
cef_ |
| Data Type: |
xbrli:monetaryItemType |
| Balance Type: |
na |
| Period Type: |
duration |
|
| X |
- ReferencesReference 1: http://www.xbrl.org/2003/role/presentationRef
-Publisher SEC
-Name Form N-2
-Section Item 3
-Subsection 1
-Paragraph Instruction 11
| Name: |
cef_ExpenseExampleYears1to3 |
| Namespace Prefix: |
cef_ |
| Data Type: |
xbrli:monetaryItemType |
| Balance Type: |
na |
| Period Type: |
duration |
|
| X |
- ReferencesReference 1: http://www.xbrl.org/2003/role/presentationRef
-Publisher SEC
-Name Form N-2
-Section Item 3
-Subsection 1
-Paragraph Instruction 11
| Name: |
cef_ExpenseExampleYears1to5 |
| Namespace Prefix: |
cef_ |
| Data Type: |
xbrli:monetaryItemType |
| Balance Type: |
na |
| Period Type: |
duration |
|
| X |
- ReferencesReference 1: http://www.xbrl.org/2003/role/presentationRef
-Publisher SEC
-Name Form N-2
-Section Item 3
-Subsection 1
| Name: |
cef_FeeTableAbstract |
| Namespace Prefix: |
cef_ |
| Data Type: |
xbrli:stringItemType |
| Balance Type: |
na |
| Period Type: |
duration |
|
| X |
- ReferencesReference 1: http://www.xbrl.org/2003/role/presentationRef
-Publisher SEC
-Name Form N-2
-Section Item 4
| Name: |
cef_FinancialHighlightsAbstract |
| Namespace Prefix: |
cef_ |
| Data Type: |
xbrli:stringItemType |
| Balance Type: |
na |
| Period Type: |
duration |
|
| X |
- ReferencesReference 1: http://www.xbrl.org/2003/role/presentationRef
-Publisher SEC
-Name Form N-2
-Section Item 8
| Name: |
cef_GeneralDescriptionOfRegistrantAbstract |
| Namespace Prefix: |
cef_ |
| Data Type: |
xbrli:stringItemType |
| Balance Type: |
na |
| Period Type: |
duration |
|
| X |
- ReferencesReference 1: http://www.xbrl.org/2003/role/presentationRef
-Publisher SEC
-Name Form N-2
-Section Item 8
-Subsection 5
-Paragraph b
| Name: |
cef_HighestPriceOrBid |
| Namespace Prefix: |
cef_ |
| Data Type: |
dtr-types:perShareItemType |
| Balance Type: |
na |
| Period Type: |
duration |
|
| X |
- ReferencesReference 1: http://www.xbrl.org/2003/role/presentationRef
-Publisher SEC
-Name Form N-2
-Section Item 8
-Subsection 5
-Paragraph b
-Subparagraph Instruction 4
| Name: |
cef_HighestPriceOrBidNav |
| Namespace Prefix: |
cef_ |
| Data Type: |
dtr-types:perShareItemType |
| Balance Type: |
na |
| Period Type: |
duration |
|
| X |
- ReferencesReference 1: http://www.xbrl.org/2003/role/presentationRef
-Publisher SEC
-Name Form N-2
-Section Item 8
-Subsection 5
-Paragraph b
-Subparagraph Instructions 4, 5
| Name: |
cef_HighestPriceOrBidPremiumDiscountToNavPercent |
| Namespace Prefix: |
cef_ |
| Data Type: |
dtr-types:percentItemType |
| Balance Type: |
na |
| Period Type: |
duration |
|
| X |
- ReferencesReference 1: http://www.xbrl.org/2003/role/presentationRef
-Publisher SEC
-Name Form N-2
-Section Item 3
-Subsection 1
-Paragraph Instruction 8
| Name: |
cef_InterestExpensesOnBorrowingsPercent |
| Namespace Prefix: |
cef_ |
| Data Type: |
dtr-types:percentItemType |
| Balance Type: |
na |
| Period Type: |
duration |
|
| X |
- ReferencesReference 1: http://www.xbrl.org/2003/role/presentationRef
-Publisher SEC
-Name Form N-2
-Section Item 8
-Subsection 2
-Paragraph b, d
| Name: |
cef_InvestmentObjectivesAndPracticesTextBlock |
| Namespace Prefix: |
cef_ |
| Data Type: |
dtr-types:textBlockItemType |
| Balance Type: |
na |
| Period Type: |
duration |
|
| X |
- ReferencesReference 1: http://www.xbrl.org/2003/role/presentationRef
-Publisher SEC
-Name Form N-2
-Section Item 8
-Subsection 5
-Paragraph c
| Name: |
cef_LatestPremiumDiscountToNavPercent |
| Namespace Prefix: |
cef_ |
| Data Type: |
dtr-types:percentItemType |
| Balance Type: |
na |
| Period Type: |
duration |
|
| X |
- ReferencesReference 1: http://www.xbrl.org/2003/role/presentationRef
-Publisher SEC
-Name Form N-2
-Section Item 8
-Subsection 5
-Paragraph b
| Name: |
cef_LowestPriceOrBid |
| Namespace Prefix: |
cef_ |
| Data Type: |
dtr-types:perShareItemType |
| Balance Type: |
na |
| Period Type: |
duration |
|
| X |
- ReferencesReference 1: http://www.xbrl.org/2003/role/presentationRef
-Publisher SEC
-Name Form N-2
-Section Item 8
-Subsection 5
-Paragraph b
-Subparagraph Instruction 4
| Name: |
cef_LowestPriceOrBidNav |
| Namespace Prefix: |
cef_ |
| Data Type: |
dtr-types:perShareItemType |
| Balance Type: |
na |
| Period Type: |
duration |
|
| X |
- ReferencesReference 1: http://www.xbrl.org/2003/role/presentationRef
-Publisher SEC
-Name Form N-2
-Section Item 8
-Subsection 5
-Paragraph b
-Subparagraph Instructions 4, 5
| Name: |
cef_LowestPriceOrBidPremiumDiscountToNavPercent |
| Namespace Prefix: |
cef_ |
| Data Type: |
dtr-types:percentItemType |
| Balance Type: |
na |
| Period Type: |
duration |
|
| X |
- ReferencesReference 1: http://www.xbrl.org/2003/role/presentationRef
-Publisher SEC
-Name Form N-2
-Section Item 3
-Subsection 1
-Paragraph Instruction 7
-Subparagraph a
| Name: |
cef_ManagementFeesPercent |
| Namespace Prefix: |
cef_ |
| Data Type: |
dtr-types:percentItemType |
| Balance Type: |
na |
| Period Type: |
duration |
|
| X |
- ReferencesReference 1: http://www.xbrl.org/2003/role/presentationRef
-Publisher SEC
-Name Form N-2
-Section Item 3
-Subsection 1
-Paragraph Instruction 9
| Name: |
cef_OtherAnnualExpensesAbstract |
| Namespace Prefix: |
cef_ |
| Data Type: |
xbrli:stringItemType |
| Balance Type: |
na |
| Period Type: |
duration |
|
| X |
- ReferencesReference 1: http://www.xbrl.org/2003/role/presentationRef
-Publisher SEC
-Name Form N-2
-Section Item 3
-Subsection 1
-Paragraph Instruction 9
| Name: |
cef_OtherAnnualExpensesPercent |
| Namespace Prefix: |
cef_ |
| Data Type: |
dtr-types:percentItemType |
| Balance Type: |
na |
| Period Type: |
duration |
|
| X |
- ReferencesReference 1: http://www.xbrl.org/2003/role/presentationRef
-Publisher SEC
-Name Form N-2
-Section Item 3
-Subsection 1
-Paragraph Instruction 6
| Name: |
cef_OtherExpensesNoteTextBlock |
| Namespace Prefix: |
cef_ |
| Data Type: |
dtr-types:textBlockItemType |
| Balance Type: |
na |
| Period Type: |
duration |
|
| X |
- ReferencesReference 1: http://www.xbrl.org/2003/role/presentationRef
-Publisher SEC
-Name Form N-2
-Section Item 3
-Subsection 1
-Paragraph Instruction 5
| Name: |
cef_OtherTransactionExpensesAbstract |
| Namespace Prefix: |
cef_ |
| Data Type: |
xbrli:stringItemType |
| Balance Type: |
na |
| Period Type: |
duration |
|
| X |
- ReferencesReference 1: http://www.xbrl.org/2003/role/presentationRef
-Publisher SEC
-Name Form N-2
-Section Item 10
-Subsection 5
-Paragraph 2
| Name: |
cef_OutstandingSecurityAuthorizedShares |
| Namespace Prefix: |
cef_ |
| Data Type: |
xbrli:sharesItemType |
| Balance Type: |
na |
| Period Type: |
duration |
|
| X |
- ReferencesReference 1: http://www.xbrl.org/2003/role/presentationRef
-Publisher SEC
-Name Form N-2
-Section Item 10
-Subsection 5
-Paragraph 4
| Name: |
cef_OutstandingSecurityNotHeldShares |
| Namespace Prefix: |
cef_ |
| Data Type: |
xbrli:sharesItemType |
| Balance Type: |
na |
| Period Type: |
duration |
|
| X |
- ReferencesReference 1: http://www.xbrl.org/2003/role/presentationRef
-Publisher SEC
-Name Form N-2
-Section Item 10
-Subsection 1
-Paragraph b
-Subparagraph 2
| Name: |
cef_PreferredStockRestrictionsOtherTextBlock |
| Namespace Prefix: |
cef_ |
| Data Type: |
dtr-types:textBlockItemType |
| Balance Type: |
na |
| Period Type: |
duration |
|
| X |
- ReferencesReference 1: http://www.xbrl.org/2003/role/presentationRef
-Publisher SEC
-Name Form N-2
-Section Item 3
-Subsection 1
-Paragraph Instruction 1
| Name: |
cef_PurposeOfFeeTableNoteTextBlock |
| Namespace Prefix: |
cef_ |
| Data Type: |
dtr-types:textBlockItemType |
| Balance Type: |
na |
| Period Type: |
duration |
|
| X |
- ReferencesReference 1: http://www.xbrl.org/2003/role/presentationRef
-Publisher SEC
-Name Form N-2
-Section Item 8
-Subsection 3
-Paragraph b
-Subparagraph 3
| Name: |
cef_ReturnAtMinusFivePercent |
| Namespace Prefix: |
cef_ |
| Data Type: |
dtr-types:percentItemType |
| Balance Type: |
na |
| Period Type: |
duration |
|
| X |
- ReferencesReference 1: http://www.xbrl.org/2003/role/presentationRef
-Publisher SEC
-Name Form N-2
-Section Item 8
-Subsection 3
-Paragraph b
-Subparagraph 3
| Name: |
cef_ReturnAtMinusTenPercent |
| Namespace Prefix: |
cef_ |
| Data Type: |
dtr-types:percentItemType |
| Balance Type: |
na |
| Period Type: |
duration |
|
| X |
- ReferencesReference 1: http://www.xbrl.org/2003/role/presentationRef
-Publisher SEC
-Name Form N-2
-Section Item 8
-Subsection 3
-Paragraph b
-Subparagraph 3
| Name: |
cef_ReturnAtPlusFivePercent |
| Namespace Prefix: |
cef_ |
| Data Type: |
dtr-types:percentItemType |
| Balance Type: |
na |
| Period Type: |
duration |
|
| X |
- ReferencesReference 1: http://www.xbrl.org/2003/role/presentationRef
-Publisher SEC
-Name Form N-2
-Section Item 8
-Subsection 3
-Paragraph b
-Subparagraph 3
| Name: |
cef_ReturnAtPlusTenPercent |
| Namespace Prefix: |
cef_ |
| Data Type: |
dtr-types:percentItemType |
| Balance Type: |
na |
| Period Type: |
duration |
|
| X |
- ReferencesReference 1: http://www.xbrl.org/2003/role/presentationRef
-Publisher SEC
-Name Form N-2
-Section Item 8
-Subsection 3
-Paragraph b
-Subparagraph 3
| Name: |
cef_ReturnAtZeroPercent |
| Namespace Prefix: |
cef_ |
| Data Type: |
dtr-types:percentItemType |
| Balance Type: |
na |
| Period Type: |
duration |
|
| X |
- ReferencesReference 1: http://www.xbrl.org/2003/role/presentationRef
-Publisher SEC
-Name Form N-2
-Section Item 8
-Subsection 3
-Paragraph a
| Name: |
cef_RiskFactorsTableTextBlock |
| Namespace Prefix: |
cef_ |
| Data Type: |
dtr-types:textBlockItemType |
| Balance Type: |
na |
| Period Type: |
duration |
|
| X |
- References
+ Details
| Name: |
cef_RiskTextBlock |
| Namespace Prefix: |
cef_ |
| Data Type: |
dtr-types:textBlockItemType |
| Balance Type: |
na |
| Period Type: |
duration |
|
| X |
- ReferencesReference 1: http://www.xbrl.org/2003/role/presentationRef
-Publisher SEC
-Name Form N-2
-Section Item 3
-Subsection 1
| Name: |
cef_SalesLoadPercent |
| Namespace Prefix: |
cef_ |
| Data Type: |
dtr-types:percentItemType |
| Balance Type: |
na |
| Period Type: |
duration |
|
| X |
- ReferencesReference 1: http://www.xbrl.org/2003/role/presentationRef
-Publisher SEC
-Name Form N-2
-Section Item 10
-Subsection 1
-Paragraph a
| Name: |
cef_SecurityTitleTextBlock |
| Namespace Prefix: |
cef_ |
| Data Type: |
dtr-types:textBlockItemType |
| Balance Type: |
na |
| Period Type: |
duration |
|
| X |
- ReferencesReference 1: http://www.xbrl.org/2003/role/presentationRef
-Publisher SEC
-Name Form N-2
-Section Item 10
-Subsection 1
-Paragraph a
-Subparagraph 2
| Name: |
cef_SecurityVotingRightsTextBlock |
| Namespace Prefix: |
cef_ |
| Data Type: |
dtr-types:textBlockItemType |
| Balance Type: |
na |
| Period Type: |
duration |
|
| X |
- ReferencesReference 1: http://www.xbrl.org/2003/role/presentationRef
-Publisher SEC
-Name Form N-2
-Section Item 4
-Subsection 3
-Paragraph 2
| Name: |
cef_SeniorSecuritiesAmt |
| Namespace Prefix: |
cef_ |
| Data Type: |
xbrli:monetaryItemType |
| Balance Type: |
na |
| Period Type: |
instant |
|
| X |
- ReferencesReference 1: http://www.xbrl.org/2003/role/presentationRef
-Publisher SEC
-Name Form N-2
-Section Item 4
-Subsection 3
-Paragraph 5
| Name: |
cef_SeniorSecuritiesAverageMarketValuePerUnit |
| Namespace Prefix: |
cef_ |
| Data Type: |
dtr-types:perShareItemType |
| Balance Type: |
na |
| Period Type: |
duration |
|
| X |
- ReferencesReference 1: http://www.xbrl.org/2003/role/presentationRef
-Publisher SEC
-Name Form N-2
-Section Item 4
-Subsection 3
-Paragraph Instruction 4
| Name: |
cef_SeniorSecuritiesAveragingMethodNoteTextBlock |
| Namespace Prefix: |
cef_ |
| Data Type: |
dtr-types:textBlockItemType |
| Balance Type: |
na |
| Period Type: |
duration |
|
| X |
- ReferencesReference 1: http://www.xbrl.org/2003/role/presentationRef
-Publisher SEC
-Name Form N-2
-Section Item 4
-Subsection 3
-Paragraph 3
-Subparagraph Instruction 2
| Name: |
cef_SeniorSecuritiesCvgPerUnit |
| Namespace Prefix: |
cef_ |
| Data Type: |
dtr-types:perShareItemType |
| Balance Type: |
na |
| Period Type: |
instant |
|
| X |
- ReferencesReference 1: http://www.xbrl.org/2003/role/presentationRef
-Publisher SEC
-Name Form N-2
-Section Item 4
-Subsection 3
-Paragraph Instruction 1
Reference 2: http://www.xbrl.org/2003/role/presentationRef
-Publisher SEC
-Name Form N-2
-Section Item 4
-Subsection 1
-Paragraph Instruction 2
| Name: |
cef_SeniorSecuritiesNoteTextBlock |
| Namespace Prefix: |
cef_ |
| Data Type: |
dtr-types:textBlockItemType |
| Balance Type: |
na |
| Period Type: |
duration |
|
| X |
- ReferencesReference 1: http://www.xbrl.org/2003/role/presentationRef
-Publisher SEC
-Name Form N-2
-Section Item 4
-Subsection 3
| Name: |
cef_SeniorSecuritiesTableTextBlock |
| Namespace Prefix: |
cef_ |
| Data Type: |
dtr-types:textBlockItemType |
| Balance Type: |
na |
| Period Type: |
duration |
|
| X |
- ReferencesReference 1: http://www.xbrl.org/2003/role/presentationRef
-Publisher SEC
-Name Form N-2
-Section Item 8
-Subsection 5
-Paragraph b
-Subparagraph 4
| Name: |
cef_SharePriceTableTextBlock |
| Namespace Prefix: |
cef_ |
| Data Type: |
dtr-types:textBlockItemType |
| Balance Type: |
na |
| Period Type: |
duration |
|
| X |
- ReferencesReference 1: http://www.xbrl.org/2003/role/presentationRef
-Publisher SEC
-Name Form N-2
-Section Item 3
-Subsection 1
| Name: |
cef_ShareholderTransactionExpensesTableTextBlock |
| Namespace Prefix: |
cef_ |
| Data Type: |
dtr-types:textBlockItemType |
| Balance Type: |
na |
| Period Type: |
duration |
|
| X |
- ReferencesReference 1: http://www.xbrl.org/2003/role/presentationRef
-Publisher SEC
-Name Form N-2
-Section Item 3
-Subsection 1
-Paragraph Instruction 8
| Name: |
cef_TotalAnnualExpensesPercent |
| Namespace Prefix: |
cef_ |
| Data Type: |
dtr-types:percentItemType |
| Balance Type: |
na |
| Period Type: |
duration |
|
| X |
- ReferencesReference 1: http://www.xbrl.org/2003/role/presentationRef
-Publisher SEC
-Name Form N-2
-Section Item 3
-Subsection 1
-Paragraph Instruction 5
| Name: |
cef_UnderwritersCompensationPercent |
| Namespace Prefix: |
cef_ |
| Data Type: |
dtr-types:percentItemType |
| Balance Type: |
na |
| Period Type: |
duration |
|
| X |
- DefinitionBoolean flag that is true when the XBRL content amends previously-filed or accepted submission.
| Name: |
dei_AmendmentFlag |
| Namespace Prefix: |
dei_ |
| Data Type: |
xbrli:booleanItemType |
| Balance Type: |
na |
| Period Type: |
duration |
|
| X |
- DefinitionFor the EDGAR submission types of Form 8-K: the date of the report, the date of the earliest event reported; for the EDGAR submission types of Form N-1A: the filing date; for all other submission types: the end of the reporting or transition period. The format of the date is YYYY-MM-DD.
| Name: |
dei_DocumentPeriodEndDate |
| Namespace Prefix: |
dei_ |
| Data Type: |
xbrli:dateItemType |
| Balance Type: |
na |
| Period Type: |
duration |
|
| X |
- DefinitionThe type of document being provided (such as 10-K, 10-Q, 485BPOS, etc). The document type is limited to the same value as the supporting SEC submission type, or the word 'Other'.
| Name: |
dei_DocumentType |
| Namespace Prefix: |
dei_ |
| Data Type: |
dei:submissionTypeItemType |
| Balance Type: |
na |
| Period Type: |
duration |
|
| X |
- DefinitionA unique 10-digit SEC-issued value to identify entities that have filed disclosures with the SEC. It is commonly abbreviated as CIK. Reference 1: http://www.xbrl.org/2003/role/presentationRef
-Publisher SEC
-Name Exchange Act
-Number 240
-Section 12
-Subsection b-2
| Name: |
dei_EntityCentralIndexKey |
| Namespace Prefix: |
dei_ |
| Data Type: |
dei:centralIndexKeyItemType |
| Balance Type: |
na |
| Period Type: |
duration |
|
| X |
- DefinitionOne of: N-1A (Mutual Fund), N-1 (Open-End Separate Account with No Variable Annuities), N-2 (Closed-End Investment Company), N-3 (Separate Account Registered as Open-End Management Investment Company), N-4 (Variable Annuity UIT Separate Account), N-5 (Small Business Investment Company), N-6 (Variable Life UIT Separate Account), S-1 or S-3 (Face Amount Certificate Company), S-6 (UIT, Non-Insurance Product). Reference 1: http://www.xbrl.org/2003/role/presentationRef
-Publisher SEC
-Name Regulation S-T
-Number 232
-Section 313
| Name: |
dei_EntityInvCompanyType |
| Namespace Prefix: |
dei_ |
| Data Type: |
dei:invCompanyType |
| Balance Type: |
na |
| Period Type: |
duration |
|
| X |
- DefinitionThe exact name of the entity filing the report as specified in its charter, which is required by forms filed with the SEC. Reference 1: http://www.xbrl.org/2003/role/presentationRef
-Publisher SEC
-Name Exchange Act
-Number 240
-Section 12
-Subsection b-2
| Name: |
dei_EntityRegistrantName |
| Namespace Prefix: |
dei_ |
| Data Type: |
xbrli:normalizedStringItemType |
| Balance Type: |
na |
| Period Type: |
duration |
|
| X |
- DefinitionNet asset value per share or per unit of investments in certain entities that calculate net asset value per share. Includes, but is not limited to, by unit, membership interest, or other ownership interest. Investment includes, but is not limited to, investment in certain hedge funds, venture capital funds, private equity funds, real estate partnerships or funds. Excludes fair value disclosure. Reference 1: http://fasb.org/us-gaap/role/ref/legacyRef
-Name Accounting Standards Codification
-Section 35
-Paragraph 54B
-SubTopic 10
-Topic 820
-Publisher FASB
-URI https://asc.fasb.org//1943274/2147482134/820-10-35-54B
Reference 2: http://fasb.org/us-gaap/role/ref/legacyRef
-Name Accounting Standards Codification
-Section 35
-Paragraph 59
-SubTopic 10
-Topic 820
-Publisher FASB
-URI https://asc.fasb.org//1943274/2147482134/820-10-35-59
Reference 3: http://fasb.org/us-gaap/role/ref/legacyRef
-Name Accounting Standards Codification
-Section 50
-Paragraph 6A
-SubTopic 10
-Topic 820
-Publisher FASB
-URI https://asc.fasb.org//1943274/2147482106/820-10-50-6A
Reference 4: http://www.xbrl.org/2003/role/exampleRef
-Topic 946
-SubTopic 830
-Name Accounting Standards Codification
-Section 55
-Paragraph 12
-Publisher FASB
-URI https://asc.fasb.org//1943274/2147480167/946-830-55-12
Reference 5: http://www.xbrl.org/2003/role/disclosureRef
-Topic 946
-SubTopic 210
-Name Accounting Standards Codification
-Section 45
-Paragraph 4
-Publisher FASB
-URI https://asc.fasb.org//1943274/2147480555/946-210-45-4
Reference 6: http://www.xbrl.org/2003/role/disclosureRef
-Topic 946
-SubTopic 205
-Name Accounting Standards Codification
-Section 50
-Paragraph 7
-Subparagraph (a)
-Publisher FASB
-URI https://asc.fasb.org//1943274/2147480737/946-205-50-7
Reference 7: http://www.xbrl.org/2003/role/disclosureRef
-Topic 946
-SubTopic 205
-Name Accounting Standards Codification
-Section 50
-Paragraph 7
-Subparagraph (h)
-Publisher FASB
-URI https://asc.fasb.org//1943274/2147480737/946-205-50-7
Reference 8: http://www.xbrl.org/2003/role/disclosureRef
-Topic 946
-SubTopic 505
-Name Accounting Standards Codification
-Section 50
-Paragraph 1
-Publisher FASB
-URI https://asc.fasb.org//1943274/2147481004/946-505-50-1
Reference 9: http://www.xbrl.org/2003/role/disclosureRef
-Topic 946
-SubTopic 210
-Name Accounting Standards Codification
-Section S99
-Paragraph 1
-Subparagraph (SX 210.6-04(19))
-Publisher FASB
-URI https://asc.fasb.org//1943274/2147479617/946-210-S99-1
Reference 10: http://www.xbrl.org/2003/role/disclosureRef
-Topic 946
-SubTopic 210
-Name Accounting Standards Codification
-Section S99
-Paragraph 2
-Subparagraph (SX 210.6-05(4))
-Publisher FASB
-URI https://asc.fasb.org//1943274/2147479617/946-210-S99-2
| Name: |
us-gaap_NetAssetValuePerShare |
| Namespace Prefix: |
us-gaap_ |
| Data Type: |
dtr-types:perShareItemType |
| Balance Type: |
na |
| Period Type: |
instant |
|
| X |
- DefinitionThe per share liquidation preference (or restrictions) of nonredeemable preferred stock (or preferred stock redeemable solely at the option of the issuer) that has a preference in involuntary liquidation considerably in excess of the par or stated value of the shares. The liquidation preference is the difference between the preference in liquidation and the par or stated values of the share. Reference 1: http://www.xbrl.org/2009/role/commonPracticeRef
-Topic 235
-SubTopic 10
-Name Accounting Standards Codification
-Section S99
-Paragraph 1
-Subparagraph (SX 210.4-08(d))
-Publisher FASB
-URI https://asc.fasb.org//1943274/2147480678/235-10-S99-1
Reference 2: http://fasb.org/us-gaap/role/ref/legacyRef
-Topic 210
-SubTopic 10
-Name Accounting Standards Codification
-Section S99
-Paragraph 1
-Subparagraph (SX 210.5-02(28))
-Publisher FASB
-URI https://asc.fasb.org//1943274/2147480566/210-10-S99-1
Reference 3: http://fasb.org/us-gaap/role/ref/legacyRef
-Name Accounting Standards Codification
-Topic 505
-SubTopic 10
-Section 50
-Paragraph 3
-Publisher FASB
-URI https://asc.fasb.org//1943274/2147481112/505-10-50-3
Reference 4: http://fasb.org/us-gaap/role/ref/legacyRef
-Name Accounting Standards Codification
-Topic 505
-SubTopic 10
-Section 50
-Paragraph 4
-Publisher FASB
-URI https://asc.fasb.org//1943274/2147481112/505-10-50-4
Reference 5: http://www.xbrl.org/2009/role/commonPracticeRef
-Topic 505
-SubTopic 10
-Name Accounting Standards Codification
-Section 50
-Paragraph 13
-Subparagraph (h)
-Publisher FASB
-URI https://asc.fasb.org//1943274/2147481112/505-10-50-13
| Name: |
us-gaap_PreferredStockLiquidationPreference |
| Namespace Prefix: |
us-gaap_ |
| Data Type: |
dtr-types:perShareItemType |
| Balance Type: |
na |
| Period Type: |
instant |
|
| X |
- DefinitionPrice of a single share of a number of saleable stocks of a company.
| Name: |
us-gaap_SharePrice |
| Namespace Prefix: |
us-gaap_ |
| Data Type: |
dtr-types:perShareItemType |
| Balance Type: |
na |
| Period Type: |
instant |
|
| X |
- Details
| Name: |
cef_RiskAxis=eic_RisksOfInvestingInClosAndOtherStructuredDebtSecuritiesMember |
| Namespace Prefix: |
|
| Data Type: |
na |
| Balance Type: |
|
| Period Type: |
|
|
| X |
- Details
| Name: |
cef_RiskAxis=eic_SubordinatedSecuritiesRiskMember |
| Namespace Prefix: |
|
| Data Type: |
na |
| Balance Type: |
|
| Period Type: |
|
|
| X |
- Details
| Name: |
cef_RiskAxis=eic_HighYieldInvestmentRiskMember |
| Namespace Prefix: |
|
| Data Type: |
na |
| Balance Type: |
|
| Period Type: |
|
|
| X |
- Details
| Name: |
cef_RiskAxis=eic_LeverageRiskMember |
| Namespace Prefix: |
|
| Data Type: |
na |
| Balance Type: |
|
| Period Type: |
|
|
| X |
- Details
| Name: |
cef_RiskAxis=eic_CreditRisksMember |
| Namespace Prefix: |
|
| Data Type: |
na |
| Balance Type: |
|
| Period Type: |
|
|
| X |
- Details
| Name: |
cef_RiskAxis=eic_KeyPersonnelRiskMember |
| Namespace Prefix: |
|
| Data Type: |
na |
| Balance Type: |
|
| Period Type: |
|
|
| X |
- Details
| Name: |
cef_RiskAxis=eic_ConflictsOfInterestRiskMember |
| Namespace Prefix: |
|
| Data Type: |
na |
| Balance Type: |
|
| Period Type: |
|
|
| X |
- Details
| Name: |
cef_RiskAxis=eic_PrepaymentRisksMember |
| Namespace Prefix: |
|
| Data Type: |
na |
| Balance Type: |
|
| Period Type: |
|
|
| X |
- Details
| Name: |
cef_RiskAxis=eic_LiquidityRiskMember |
| Namespace Prefix: |
|
| Data Type: |
na |
| Balance Type: |
|
| Period Type: |
|
|
| X |
- Details
| Name: |
cef_RiskAxis=eic_ManagementFeeRiskMember |
| Namespace Prefix: |
|
| Data Type: |
na |
| Balance Type: |
|
| Period Type: |
|
|
| X |
- Details
| Name: |
cef_RiskAxis=eic_FairValuationOfTheCompanysPortfolioInvestmentsMember |
| Namespace Prefix: |
|
| Data Type: |
na |
| Balance Type: |
|
| Period Type: |
|
|
| X |
- Details
| Name: |
cef_RiskAxis=eic_LimitedInvestmentOpportunitiesRiskMember |
| Namespace Prefix: |
|
| Data Type: |
na |
| Balance Type: |
|
| Period Type: |
|
|
| X |
- Details
| Name: |
cef_RiskAxis=eic_MarketRiskMember |
| Namespace Prefix: |
|
| Data Type: |
na |
| Balance Type: |
|
| Period Type: |
|
|
| X |
- Details
| Name: |
cef_RiskAxis=eic_LoanAccumulationFacilitiesRiskMember |
| Namespace Prefix: |
|
| Data Type: |
na |
| Balance Type: |
|
| Period Type: |
|
|
| X |
- Details
| Name: |
cef_RiskAxis=eic_SyntheticInvestmentsRiskMember |
| Namespace Prefix: |
|
| Data Type: |
na |
| Balance Type: |
|
| Period Type: |
|
|
| X |
- Details
| Name: |
cef_RiskAxis=eic_CurrencyRiskMember |
| Namespace Prefix: |
|
| Data Type: |
na |
| Balance Type: |
|
| Period Type: |
|
|
| X |
- Details
| Name: |
cef_RiskAxis=eic_HedgingRiskMember |
| Namespace Prefix: |
|
| Data Type: |
na |
| Balance Type: |
|
| Period Type: |
|
|
| X |
- Details
| Name: |
cef_RiskAxis=eic_ReinvestmentRiskMember |
| Namespace Prefix: |
|
| Data Type: |
na |
| Balance Type: |
|
| Period Type: |
|
|
| X |
- Details
| Name: |
cef_RiskAxis=us-gaap_InterestRateRiskMember |
| Namespace Prefix: |
|
| Data Type: |
na |
| Balance Type: |
|
| Period Type: |
|
|
| X |
- Details
| Name: |
cef_RiskAxis=eic_RefinancingRiskMember |
| Namespace Prefix: |
|
| Data Type: |
na |
| Balance Type: |
|
| Period Type: |
|
|
| X |
- Details
| Name: |
cef_RiskAxis=eic_TaxRiskMember |
| Namespace Prefix: |
|
| Data Type: |
na |
| Balance Type: |
|
| Period Type: |
|
|
| X |
- Details
| Name: |
cef_RiskAxis=eic_CounterpartyRiskMember |
| Namespace Prefix: |
|
| Data Type: |
na |
| Balance Type: |
|
| Period Type: |
|
|
| X |
- Details
| Name: |
cef_RiskAxis=eic_PriceRiskMember |
| Namespace Prefix: |
|
| Data Type: |
na |
| Balance Type: |
|
| Period Type: |
|
|
| X |
- Details
| Name: |
cef_RiskAxis=eic_GlobalRisksMember |
| Namespace Prefix: |
|
| Data Type: |
na |
| Balance Type: |
|
| Period Type: |
|
|
| X |
- Details
| Name: |
cef_RiskAxis=eic_BankingRiskMember |
| Namespace Prefix: |
|
| Data Type: |
na |
| Balance Type: |
|
| Period Type: |
|
|
| X |
- Details
| Name: |
us-gaap_DebtInstrumentAxis=eic_RevolvingCreditFacilityBNPParibasMember |
| Namespace Prefix: |
|
| Data Type: |
na |
| Balance Type: |
|
| Period Type: |
|
|
| X |
- Details
| Name: |
us-gaap_DebtInstrumentAxis=eic_RevolvingCreditFacilitySocieteGeneraleMember |
| Namespace Prefix: |
|
| Data Type: |
na |
| Balance Type: |
|
| Period Type: |
|
|
| X |
- Details
| Name: |
us-gaap_StatementClassOfStockAxis=eic_CommonSharesMember |
| Namespace Prefix: |
|
| Data Type: |
na |
| Balance Type: |
|
| Period Type: |
|
|
| X |
- Details
| Name: |
us-gaap_StatementClassOfStockAxis=eic_PreferredSharesMember |
| Namespace Prefix: |
|
| Data Type: |
na |
| Balance Type: |
|
| Period Type: |
|
|
| X |
- Details
| Name: |
us-gaap_StatementClassOfStockAxis=eic_SeriesATermPreferredStockMember |
| Namespace Prefix: |
|
| Data Type: |
na |
| Balance Type: |
|
| Period Type: |
|
|
| X |
- Details
| Name: |
us-gaap_StatementClassOfStockAxis=eic_SeriesBTermPreferredStockMember |
| Namespace Prefix: |
|
| Data Type: |
na |
| Balance Type: |
|
| Period Type: |
|
|
Eagle Point Income (NYSE:EIC)
과거 데이터 주식 차트
부터 4월(4) 2024 으로 5월(5) 2024

Eagle Point Income (NYSE:EIC)
과거 데이터 주식 차트
부터 5월(5) 2023 으로 5월(5) 2024
