0001745916
false
0001745916
2023-07-27
2023-07-27
iso4217:USD
xbrli:shares
iso4217:USD
xbrli:shares
UNITED STATES
SECURITIES AND EXCHANGE COMMISSION
Washington, D.C. 20549
FORM 8-K
CURRENT REPORT
Pursuant to Section 13 or 15(d) of the
Securities Exchange Act of 1934
Date of Report (Date of earliest event
reported): July 27, 2023
PennyMac
Financial Services, Inc.
(Exact name of registrant as specified in
its charter)
| Delaware |
001-38727 |
83-1098934 |
(State or other jurisdiction
of incorporation) |
(Commission
File Number) |
(IRS Employer
Identification No.) |
| 3043 Townsgate Road, Westlake Village, California |
91361 |
| (Address of principal executive offices) |
(Zip Code) |
(818) 224-7442
(Registrant’s telephone number, including
area code)
Not Applicable
(Former name or former address, if changed
since last report)
Check the appropriate box below if the Form 8-K filing is intended
to simultaneously satisfy the filing obligation of the registrant under any of the following provisions:
| ¨ | Written
communications pursuant to Rule 425 under the Securities Act (17 CFR 230.425) |
| ¨ | Soliciting
material pursuant to Rule 14a-12 under the Exchange Act (17 CFR 240.14a-12) |
| ¨ | Pre-commencement
communications pursuant to Rule 14d-2(b) under the Exchange Act (17 CFR 240.14d-2(b)) |
| ¨ | Pre-commencement
communications pursuant to Rule 13e-4(c) under the Exchange Act (17 CFR 240.13e-4(c)) |
Securities registered pursuant to Section 12(b) of the Act:
| Title of each class |
Trading Symbol(s) |
Name of each exchange on which registered |
|
PFSI |
New York Stock Exchange |
Indicate by check mark whether the registrant is an emerging
growth company as defined in Rule 405 of the Securities Act of 1933 (§230.405 of this chapter) or Rule 12b-2 of the Securities Exchange
Act of 1934 (§240.12b-2 of this chapter).
Emerging growth company ¨
If an emerging growth company, indicate by check mark if the
registrant has elected not to use the extended transition period for complying with any new or revised financial accounting standards
provided pursuant to Section 13(a) of the Exchange Act. ¨
Item
2.02 Results of Operations and Financial Condition.
On July 27, 2023, PennyMac
Financial Services, Inc. (the “Company”) issued a press release and a slide presentation announcing its financial results
for the fiscal quarter ended June 30, 2023. A copy of the press release and slide presentation are furnished as Exhibit 99.1
and Exhibit 99.2, respectively. The press release and the
slide presentation are being made available in connection with the Company’s recorded presentation of financial results and
live Q&A discussion on July 27, 2023. In addition, the Company has made available other
supplemental financial information for the fiscal quarter ended June 30, 2023 on its website at pfsi.pennymac.com.
The information in Item 2.02 of this report, including the exhibits
hereto, shall not be deemed “filed” for purposes of Section 18 of the Securities Exchange Act of 1934, or otherwise subject
to the liabilities of Section 18, nor shall it be deemed incorporated by reference into any disclosure document relating to the Company,
except to the extent, if any, expressly set forth by specific reference in such filing.
Item 9.01 Financial Statements and Exhibits.
(d) Exhibits.
SIGNATURE
Pursuant to the requirements
of the Securities Exchange Act of 1934, the registrant has duly caused this report to be signed on its behalf by the undersigned hereunto
duly authorized.
| |
PENNYMAC FINANCIAL SERVICES, INC. |
| |
|
| |
|
| Dated: July 27, 2023 |
/s/ Daniel S. Perotti |
| |
Daniel S. Perotti |
| |
Senior Managing Director and Chief Financial Officer |
Exhibit 99.1

PennyMac Financial Services, Inc. Reports
Second Quarter 2023 Results
WESTLAKE VILLAGE, Calif. – July 27, 2023 –
PennyMac Financial Services, Inc. (NYSE: PFSI) today reported net income of $58.3 million for the second quarter of 2023, or
$1.11 per share on a diluted basis, on revenue of $336.5 million. Book value per share increased to $69.77 from $68.91 at March 31,
2023.
PFSI’s Board of Directors declared a second quarter cash dividend
of $0.20 per share, payable on August 25, 2023, to common stockholders of record as of August 15, 2023.
Second Quarter 2023 Highlights
| · | Pretax income was $72.9 million, up 91 percent from the prior quarter and
down 59 percent from the second quarter of 2022 |
| o | Repurchased 0.4 million shares of PFSI’s common stock at an average price of $60.31 per share for a cost of $26.1 million |
| · | Production segment pretax income of $24.4 million, compared to pretax loss
of $19.6 million in the prior quarter and pretax income of $9.7 million in the second quarter of 2022 |
| o | Total loan acquisitions and originations, including those fulfilled for PennyMac Mortgage Investment Trust (NYSE: PMT) were $24.9
billion in unpaid principal balance (UPB), up 9 percent from the prior quarter and down 7 percent from the second quarter of 2022 |
| o | Broker direct interest rate lock commitments (IRLCs) were $2.8 billion in UPB, up 11 percent from the prior quarter and 27 percent
from the second quarter of 2022 |
| o | Consumer direct IRLCs were $2.2 billion in UPB, down 2 percent from the prior quarter and 50 percent from the second quarter of 2022 |
| o | Government correspondent IRLCs totaled $10.7 billion in UPB, up 4 percent from the prior quarter and down 5 percent from
the second quarter of 2022 |
| o | Conventional correspondent IRLCs for PFSI’s account totaled $7.5 billion in UPB, up 99 percent from the prior quarter |
| o | Correspondent acquisitions of conventional conforming loans fulfilled for PMT were $3.0 billion in UPB, down 54 percent from the prior
quarter and 71 percent from the second quarter of 2022 |
| · | Servicing segment pretax income was $46.5 million, down from $57.4 million
in the prior quarter and $167.6 million in the second quarter of 2022 |
| o | Pretax income excluding valuation-related items was $75.3 million, down 20 percent from the prior quarter driven by lower early buyout
(EBO) income, higher realization of mortgage servicing rights (MSR) cash flows, and higher interest expense partially offset by higher
servicing fee revenue and placement fee income |
| o | Valuation items included: |
| – | $118.9 million in MSR fair value gains, before recognition of realization of cash flows, more than offset by $155.1 million in hedging
losses |
| · | Net impact on pretax income related to these items was $(36.2) million, or
$(0.51) in earnings per share |
| · | $7.5 million of reversals related to provisions for losses on active loans |
| o | Servicing portfolio grew to $576.5 billion in UPB, up 2 percent from March 31, 2023, driven by production volumes which more
than offset prepayment activity |
| · | Investment Management segment pretax income was $2.0 million, up from $0.3
million in the prior quarter and $0.2 million in the second quarter of 2022 |
| o | Net assets under management (AUM) were $1.9 billion, down 2 percent from March 31, 2023 and 7 percent from June 30, 2022 |
Notable activity after quarter end
| · | PFSI exercised its option to extend the maturity for $650 million in term
notes secured by Ginnie Mae MSRs originally due in August 2023 for two years |
“PennyMac Financial reported solid results in the second quarter,
reflecting increased production volumes and profitability from the prior quarter as well as a continued strong contribution from our large
and growing servicing business,” said Chairman and CEO David Spector. “Strong operating performance was partially offset by
net valuation-related losses that resulted from the inverted yield curve and elevated hedge costs driven by multi-year highs in interest
rate volatility. Book value per share was up to $69.77 at quarter end. We continue to operate at high levels of efficiency while also
focusing on investing in technology to support our balanced, multi-channel production and servicing platform.”
Mr. Spector continued, “Though the mortgage origination
market remains constrained, I have never felt better about our competitive position. Our leading correspondent lending activities
continue to drive the organic growth of our servicing portfolio by adding loans at prevailing mortgage rates, which we expect will provide
meaningful opportunities for our consumer direct division in future periods when rates decline. I am also extraordinarily proud of the
growth we have achieved in broker direct since our entrance into the wholesale channel only five years ago. Our scale, platform and this
management team’s ability to adapt to changing market environments are the reasons I expect PennyMac Financial to continue leading
the industry with strong financial performance.”
The following table presents the contributions
of PennyMac Financial’s segments to pretax income:
| | |
Quarter ended June 30, 2023 | |
| | |
Mortgage Banking | | |
Investment | | |
| |
| | |
Production | | |
Servicing | | |
Total | | |
Management | | |
Total | |
| | |
| | |
| | |
| | |
| | |
| |
| | |
(in thousands) | |
| Revenue | |
| | |
| | |
| | |
| | |
| |
| Net gains on loans held for sale at fair value | |
$ | 126,249 | | |
$ | 15,170 | | |
$ | 141,419 | | |
$ | - | | |
$ | 141,419 | |
| Loan origination fees | |
| 38,968 | | |
| - | | |
| 38,968 | | |
| - | | |
| 38,968 | |
| Fulfillment fees from PMT | |
| 5,441 | | |
| - | | |
| 5,441 | | |
| - | | |
| 5,441 | |
| Net loan servicing fees | |
| - | | |
| 146,078 | | |
| 146,078 | | |
| - | | |
| 146,078 | |
| Management fees | |
| - | | |
| - | | |
| - | | |
| 7,078 | | |
| 7,078 | |
| Net interest expense: | |
| | | |
| | | |
| | | |
| | | |
| | |
| Interest income | |
| 75,423 | | |
| 97,529 | | |
| 172,952 | | |
| - | | |
| 172,952 | |
| Interest expense | |
| 75,994 | | |
| 102,648 | | |
| 178,642 | | |
| - | | |
| 178,642 | |
| | |
| (571 | ) | |
| (5,119 | ) | |
| (5,690 | ) | |
| - | | |
| (5,690 | ) |
| Other | |
| 528 | | |
| 304 | | |
| 832 | | |
| 2,421 | | |
| 3,253 | |
| Total net revenue | |
| 170,615 | | |
| 156,433 | | |
| 327,048 | | |
| 9,499 | | |
| 336,547 | |
| Expenses | |
| 146,200 | | |
| 109,889 | | |
| 256,089 | | |
| 7,541 | | |
| 263,630 | |
| Income before provision for income taxes | |
$ | 24,415 | | |
$ | 46,544 | | |
$ | 70,959 | | |
$ | 1,958 | | |
$ | 72,917 | |
Production Segment
The Production segment includes the correspondent acquisition of newly
originated government-insured and certain conventional conforming loans for PennyMac Financial’s own account, fulfillment services
on behalf of PMT and direct lending through the consumer direct and broker direct channels, including the underwriting and acquisition
of loans from correspondent sellers on a non-delegated basis.
PennyMac Financial’s loan production activity for the quarter
totaled $24.9 billion in UPB, $21.9 billion of which was for its own account, and $3.0 billion of which was fee-based fulfillment
activity for PMT. Correspondent locks for PFSI and direct lending IRLCs totaled $23.2 billion in UPB, up 23 percent from the prior quarter
and 30 percent from the second quarter of 2022.
Production segment pretax income was $24.4 million, compared to a pretax
loss of $19.6 million in the prior quarter and pretax income of $9.7 million in the second quarter of 2022. Production segment revenue
totaled $170.6 million, up 40 percent from the prior quarter and down 24 percent from the second quarter of 2022. The quarter-over-quarter
increase was driven primarily by higher volumes and margins.
The components of net gains on loans held for sale are detailed in
the following table:
| | |
Quarter ended | |
| | |
June 30, 2023 | | |
March 31, 2023 | | |
June 30, 2022 | |
| | |
| | |
| | |
| |
| | |
(in thousands) | |
| Receipt of MSRs | |
$ | 562,523 | | |
$ | 286,533 | | |
$ | 398,253 | |
| Mortgage servicing rights recapture payable to PennyMac Mortgage Investment Trust | |
| (509 | ) | |
| (485 | ) | |
| (4,752 | ) |
| (Provision for) reversal of liability for representations and warranties, net | |
| (1,131 | ) | |
| (290 | ) | |
| 45 | |
| Cash loss, including cash hedging results | |
| (308,199 | ) | |
| (271,524 | ) | |
| (368,554 | ) |
| Fair value changes of pipeline, inventory and hedges | |
| (111,265 | ) | |
| 90,151 | | |
| 197,575 | |
| Net gains on mortgage loans held for sale | |
$ | 141,419 | | |
$ | 104,385 | | |
$ | 222,567 | |
| Net gains on mortgage loans held for sale by segment: | |
| | | |
| | | |
| | |
| Production | |
$ | 126,249 | | |
$ | 74,726 | | |
$ | 152,895 | |
| Servicing | |
$ | 15,170 | | |
$ | 29,659 | | |
$ | 69,672 | |
PennyMac Financial performs fulfillment services for certain conventional
conforming and jumbo loans acquired by PMT from non-affiliates in its correspondent production business. These services include, but are
not limited to, marketing, relationship management, correspondent seller approval and monitoring, loan file review, underwriting, pricing,
hedging and activities related to the subsequent sale and securitization of loans in the secondary mortgage markets for PMT.
Fees earned from the fulfillment of correspondent loans on behalf of
PMT totaled $5.4 million in the second quarter, down 54 percent from the prior quarter and 74 percent from the second quarter
of 2022. The year-over-year decrease in fulfillment fee revenue was driven by lower conventional acquisition volumes for PMT’s account
as PFSI acquired a higher proportion of the conventional loans sourced by PMT in the second quarter of 2023.
Net interest expense totaled $0.6 million, compared to net interest
income of $2.9 million in the prior quarter. Interest income in the second quarter totaled $75.4 million, up from $57.0 million in the
prior quarter, and interest expense totaled $76.0 million, up from $54.1 million in the prior quarter, both due to higher volumes and
short-term interest rates.
Production segment expenses were $146.2 million, up 4 percent
from the prior quarter and down 32 percent from the second quarter of 2022. The increase from the prior quarter was due to increased loan
origination expenses due to higher volumes. The year-over-year decrease was driven primarily by decreased production in the direct lending
channels and the expense management activities noted in prior quarters.
Servicing Segment
The Servicing segment includes income from owned MSRs, subservicing
and special servicing activities. Servicing segment pretax income was $46.5 million, compared to $57.4 million in the prior quarter
and $167.6 million in the second quarter of 2022. Servicing segment net revenues totaled $156.4 million, down from $172.1 million
in the prior quarter and $278.6 million in the second quarter of 2022. The quarter-over-quarter decrease was primarily driven by a $14.5
million decrease in net gains on loans held for sale related to EBO activity for government-insured and guaranteed loans purchased out
of Ginnie Mae securitizations.
Revenue from net loan servicing fees totaled $146.1 million, down from
$148.8 million in the prior quarter. Revenue from net loan servicing fees included $36.2 million in net valuation related declines, compared
to $43.0 million of such declines in the prior quarter. MSR fair value gains, before realization of cash flows, were $118.9 million in
the quarter, and hedging losses were $155.1 million. Revenue from loan servicing fees included $356.5 million in servicing fees,
which were up from the prior quarter due to continued portfolio growth, reduced by $174.2 million from the realization of MSR cash flows,
which were up from $146.2 million in the prior quarter due to increased cash flow generated by the MSR asset during the quarter from servicing
and placement fees.
The following table presents a breakdown of net loan servicing fees:
| | |
Quarter ended | |
| | |
June 30, 2023 | | |
March 31, 2023 | | |
June 30, 2022 | |
| | |
| | |
| | |
| |
| | |
(in thousands) | |
| Loan servicing fees | |
$ | 356,471 | | |
$ | 338,057 | | |
$ | 302,350 | |
| Changes in fair value of MSRs and MSLs resulting from: | |
| | | |
| | | |
| | |
| Realization of cash flows | |
| (174,162 | ) | |
| (146,183 | ) | |
| (121,724 | ) |
| Change in fair value inputs | |
| 118,905 | | |
| (90,264 | ) | |
| 233,826 | |
| Hedging (losses) gains | |
| (155,136 | ) | |
| 47,227 | | |
| (176,005 | ) |
| Net change in fair value of MSRs and MSLs | |
| (210,393 | ) | |
| (189,220 | ) | |
| (63,903 | ) |
| Net loan servicing fees | |
$ | 146,078 | | |
$ | 148,837 | | |
$ | 238,447 | |
Servicing segment revenue included $15.2 million in net gains on loans
held for sale related to EBOs. These gains were down from $29.7 million in the prior quarter and $69.7 million in the second
quarter of 2022. These EBOs are previously delinquent loans that were brought back to performing status through PennyMac Financial’s
successful servicing efforts.
Net interest expense totaled $5.1 million, versus $6.2 million in the
prior quarter and $30.4 million in the second quarter of 2022. Interest income was $97.5 million, up from $71.5 million in the prior quarter
driven primarily by increased placement fees on custodial balances. Interest expense was $102.6 million, up from $77.7 million in the
prior quarter due to higher short-term interest rates and greater outstanding secured debt during the quarter.
Servicing segment expenses totaled $109.9 million, down 4 percent from
the prior quarter. Servicing segment expenses in the second quarter included $7.5 million in reversals for credit losses on active loans.
The prior quarter included $6.1 million in such reversals.
The total servicing portfolio grew to $576.5 billion in UPB at June 30,
2023, an increase of 2 percent from March 31, 2023 and 9 percent from June 30, 2022. PennyMac Financial subservices
and conducts special servicing for PMT, whose servicing portfolio totaled $234.5 billion in UPB at quarter end, down 1 percent
from March 31, 2023 and up 4 percent from June 30, 2022. PennyMac Financial’s owned MSR portfolio grew to $342.0 billion
in UPB, up 4 percent from March 31, 2023 and 14 percent from June 30, 2022.
The table below details PennyMac Financial’s servicing portfolio
UPB:
| | |
June 30, 2023
| | |
March 31, 2023
| | |
June 30, 2022
| |
| | |
| | |
| | |
| |
| | |
(in thousands) | |
| Prime servicing: | |
| | | |
| | | |
| | |
| Owned | |
| | | |
| | | |
| | |
| Mortgage servicing rights and liabilities | |
| | | |
| | | |
| | |
| Originated | |
$ | 319,257,805 | | |
$ | 302,265,588 | | |
$ | 276,627,961 | |
| Purchased | |
| 18,474,265 | | |
| 19,026,774 | | |
| 20,683,203 | |
| | |
| 337,732,070 | | |
| 321,292,362 | | |
| 297,311,164 | |
| Loans held for sale | |
| 4,250,706 | | |
| 6,692,155 | | |
| 3,575,712 | |
| | |
| 341,982,776 | | |
| 327,984,517 | | |
| 300,886,876 | |
| Subserviced for PMT | |
| 234,463,739 | | |
| 236,476,714 | | |
| 226,365,581 | |
| Total prime servicing | |
| 576,446,515 | | |
| 564,461,231 | | |
| 527,252,457 | |
| Special servicing - subserviced for PMT | |
| 12,780 | | |
| 13,167 | | |
| 23,001 | |
| Total loans serviced | |
$ | 576,459,295 | | |
$ | 564,474,398 | | |
$ | 527,275,458 | |
Investment Management Segment
PennyMac Financial manages PMT for which it earns base management fees
and may earn incentive compensation. Net AUM were $1.9 billion as of June 30, 2023, down 2 percent from March 31, 2023
and 7 percent from June 30, 2022.
Pretax income for the Investment Management segment was $2.0 million,
up from $0.3 million in the prior quarter and $0.2 million in the second quarter of 2022. Base management fees from PMT were $7.1
million, down 2 percent from the prior quarter and 11 percent from the second quarter of 2022 due to the decline in AUM. No performance
incentive fees were earned in the second quarter.
The following table presents a breakdown of management fees:
| | |
Quarter ended | |
| | |
June 30, 2023 | | |
March 31, 2023 | | |
June 30, 2022 | |
| | |
| | |
| | |
| |
| | |
(in thousands) | |
| Management fees: | |
| | | |
| | | |
| | |
| Base | |
$ | 7,078 | | |
$ | 7,257 | | |
$ | 7,910 | |
| Performance incentive | |
| - | | |
| - | | |
| - | |
| Total management fees | |
$ | 7,078 | | |
$ | 7,257 | | |
$ | 7,910 | |
| | |
| | | |
| | | |
| | |
| Net assets of PennyMac Mortgage Investment Trust | |
$ | 1,931,496 | | |
$ | 1,970,734 | | |
$ | 2,070,640 | |
Investment Management segment expenses totaled $7.5 million, down 16
percent from the prior quarter and 20 percent from the second quarter of 2022.
Consolidated Expenses
Total expenses were $263.6 million, down slightly from the
prior quarter and down 21 percent from the second quarter of 2022. The decrease from the prior year was driven primarily by the expense
management activities noted in prior quarters.
Taxes
PFSI recorded a provision for tax expense of $14.7 million, resulting
in an effective tax rate of 20.1 percent during the quarter. The tax rate is lower than PFSI’s 2022 effective tax rate of 28.5 percent
due to certain tax benefits recognized during the quarter.
***
Management’s slide presentation and accompanying material will
be available in the Investor Relations section of the Company’s website at pfsi.pennymac.com after the market closes on
Thursday, July 27, 2023. Additionally, the Company will host a live question and answer (Q&A) session the same day at 5:00 p.m. Eastern
Time. An audio webcast of the Q&A session will be available at pfsi.pennymac.com and a replay of the event will be available
shortly after its conclusion.
# -
About PennyMac Financial Services, Inc.
PennyMac Financial Services, Inc. is a specialty financial services
firm focused on the production and servicing of U.S. mortgage loans and the management of investments related to the U.S. mortgage market.
Founded in 2008, the company is recognized as a leader in the U.S. residential mortgage industry and employs over 4,000 people across
the country. For the twelve months ended June 30, 2023, PennyMac Financial’s production of newly originated loans totaled
$97 billion in unpaid principal balance, making it the second largest mortgage lender in the nation. As of June 30, 2023, PennyMac
Financial serviced loans totaling $576 billion in unpaid principal balance, making it a top five mortgage servicer in the nation. Additional
information about PennyMac Financial Services, Inc. is available at pfsi.pennymac.com.
| Media |
Investors |
| Kristyn Clark |
Kevin Chamberlain |
| kristyn.clark@pennymac.com |
Isaac Garden |
| 805.395.9943 |
PFSI_IR@pennymac.com |
| |
818.224.7028 |
Forward-Looking Statements
This press release contains forward-looking statements within the meaning
of Section 21E of the Securities Exchange Act of 1934, as amended, regarding management’s beliefs, estimates, projections,
and assumptions with respect to, among other things, the Company’s financial results, future operations, business plans and investment
strategies, as well as industry and market conditions, all of which are subject to change. Words like “believe,” “expect,”
“anticipate,” “promise,” “project,” “plan,” and other expressions or words of similar
meanings, as well as future or conditional verbs such as “will,” “would,” “should,” “could,”
or “may” are generally intended to identify forward-looking statements. Actual results and operations for any future period
may vary materially from those projected herein and from past results discussed herein. Factors which could cause actual results to differ
materially from historical results or those anticipated include, but are not limited to: interest rate changes; declines in real estate
or significant changes in U.S. housing prices or activity in the U.S. housing market; the continually changing federal, state and local
laws and regulations applicable to the highly regulated industry in which we operate; lawsuits or governmental actions that may result
from any noncompliance with the laws and regulations applicable to our business; the mortgage lending and servicing-related regulations
promulgated by the Consumer Financial Protection Bureau and its enforcement of these regulations; our dependence on U.S. government-sponsored
entities and changes in their current roles or their guarantees or guidelines; changes to government mortgage modification programs; the
licensing and operational requirements of states and other jurisdictions applicable to our business, to which our bank competitors are
not subject; foreclosure delays and changes in foreclosure practices; changes in macroeconomic and U.S. real estate market conditions;
difficulties inherent in adjusting the size of our operations to reflect changes in business levels; purchase opportunities for mortgage
servicing rights and our success in winning bids; our substantial amount of indebtedness; increases in loan delinquencies, defaults and
forbearances; our reliance on PennyMac Mortgage Investment Trust (NYSE: PMT) as a significant contributor to our mortgage banking business;
maintaining sufficient capital and liquidity and compliance with financial covenants; our obligation to indemnify third-party purchasers
or repurchase loans if loans that we originate, acquire, service or assist in the fulfillment of, fail to meet certain criteria or characteristics
or under other circumstances; our obligation to indemnify PMT if our services fail to meet certain criteria or characteristics or under
other circumstances; investment management and incentive fees; conflicts of interest in allocating our services and investment opportunities
among us and our advised entities; the effect of public opinion on our reputation; our exposure to risks of loss and disruptions in operations
resulting from adverse weather conditions, man-made or natural disasters, climate change and pandemics; our ability to effectively identify,
manage and hedge our credit, interest rate, prepayment, liquidity and climate risks; our initiation or expansion of new business activities
or strategies; our ability to detect misconduct and fraud; our ability to mitigate cybersecurity risks and cyber incidents; our ability
to pay dividends to our stockholders; and our organizational structure and certain You should not place undue reliance on any forward-
looking statement and should consider all of the uncertainties and risks described above, as well as those more fully discussed in reports
and other documents filed by the Company with the Securities and Exchange Commission from time to time. The Company undertakes no obligation
to publicly update or revise any forward-looking statements or any other information contained herein, and the statements made in this
press release are current as of the date of this release only.
The Company’s earnings materials contain financial information
calculated other than in accordance with U.S. generally accepted accounting principles (“GAAP”), such as pretax income excluding
valuation-related items that provide a meaningful perspective on the Company’s business results since the Company utilizes this
information to evaluate and manage the business. Non-GAAP disclosure has limitations as an analytical tool and should not be viewed as
a substitute for financial information determined in accordance with GAAP.
PENNYMAC FINANCIAL SERVICES, INC.
CONSOLIDATED BALANCE SHEETS (UNAUDITED)
| | |
June 30, 2023
| | |
March 31, 2023
| | |
June 30, 2022
| |
| | |
| | |
| | |
| |
| | |
(in thousands, except share amounts) | |
| ASSETS | |
| | |
| | |
| |
| Cash | |
$ | 1,532,399 | | |
$ | 1,497,903 | | |
$ | 1,415,396 | |
| Short-term investment at fair value | |
| 8,088 | | |
| 3,584 | | |
| 4,961 | |
| Loans held for sale at fair value | |
| 4,270,494 | | |
| 6,772,423 | | |
| 3,586,810 | |
| Derivative assets | |
| 85,517 | | |
| 110,664 | | |
| 103,901 | |
| Servicing advances, net | |
| 500,122 | | |
| 547,158 | | |
| 570,822 | |
| Mortgage servicing rights at fair value | |
| 6,510,585 | | |
| 6,003,390 | | |
| 5,217,167 | |
| Operating lease right-of-use assets | |
| 56,410 | | |
| 61,406 | | |
| 82,078 | |
| Investment in PennyMac Mortgage Investment Trust at fair value | |
| 1,011 | | |
| 925 | | |
| 1,037 | |
| Receivable from PennyMac Mortgage Investment Trust | |
| 25,046 | | |
| 35,166 | | |
| 43,234 | |
| Loans eligible for repurchase | |
| 4,401,098 | | |
| 4,557,325 | | |
| 2,778,768 | |
| Other | |
| 593,698 | | |
| 513,241 | | |
| 468,081 | |
| Total assets | |
$ | 17,984,468 | | |
$ | 20,103,185 | | |
$ | 14,272,255 | |
| | |
| | | |
| | | |
| | |
| LIABILITIES | |
| | | |
| | | |
| | |
| Assets sold under agreements to repurchase | |
$ | 3,780,524 | | |
$ | 5,764,157 | | |
$ | 2,441,816 | |
| Mortgage loan participation purchase and sale agreements | |
| 505,712 | | |
| 515,358 | | |
| 502,116 | |
| Notes payable secured by mortgage servicing assets | |
| 2,472,726 | | |
| 2,471,930 | | |
| 1,793,260 | |
| Unsecured senior notes | |
| 1,781,756 | | |
| 1,780,833 | | |
| 1,778,055 | |
| Derivative liabilities | |
| 22,039 | | |
| 49,087 | | |
| 42,702 | |
| Mortgage servicing liabilities at fair value | |
| 1,940 | | |
| 2,011 | | |
| 2,337 | |
| Accounts payable and accrued expenses | |
| 258,278 | | |
| 218,433 | | |
| 317,998 | |
| Operating lease liabilities | |
| 75,956 | | |
| 81,724 | | |
| 102,756 | |
| Payable to PennyMac Mortgage Investment Trust | |
| 123,287 | | |
| 142,007 | | |
| 98,991 | |
| Payable to exchanged Private National Mortgage Acceptance Company, LLC unitholders under tax receivable agreement | |
| 26,099 | | |
| 26,099 | | |
| 27,014 | |
| Income taxes payable | |
| 1,026,147 | | |
| 1,010,928 | | |
| 885,721 | |
| Liability for loans eligible for repurchase | |
| 4,401,098 | | |
| 4,557,325 | | |
| 2,778,768 | |
| Liability for losses under representations and warranties | |
| 30,146 | | |
| 31,103 | | |
| 39,336 | |
| Total liabilities | |
| 14,505,708 | | |
| 16,650,995 | | |
| 10,810,870 | |
| | |
| | | |
| | | |
| | |
| STOCKHOLDERS' EQUITY | |
| | | |
| | | |
| | |
Common stock—authorized
200,000,000 shares of $0.0001 par value; issued and outstanding 49,857,588, 50,097,030, and 52,938,854 shares, respectively | |
| 5 | | |
| 5 | | |
| 5 | |
| Retained earnings | |
| 3,478,755 | | |
| 3,452,185 | | |
| 3,461,380 | |
| Total stockholders' equity | |
| 3,478,760 | | |
| 3,452,190 | | |
| 3,461,385 | |
| Total liabilities and stockholders’ equity | |
$ | 17,984,468 | | |
$ | 20,103,185 | | |
$ | 14,272,255 | |
PENNYMAC FINANCIAL SERVICES, INC.
CONSOLIDATED STATEMENTS OF INCOME (UNAUDITED)
| | |
Quarter ended | |
| | |
June 30, 2023
| | |
March 31, 2023
| | |
June 30, 2022
| |
| | |
| | |
| | |
| |
| | |
(in thousands, except per share amounts) | |
| Revenues | |
| | |
| | |
| |
| Net gains on loans held for sale at fair value | |
$ | 141,419 | | |
$ | 104,385 | | |
$ | 222,567 | |
| Loan origination fees | |
| 38,968 | | |
| 31,390 | | |
| 39,945 | |
| Fulfillment fees from PennyMac Mortgage Investment Trust | |
| 5,441 | | |
| 11,923 | | |
| 20,646 | |
| Net loan servicing fees: | |
| | | |
| | | |
| | |
| Loan servicing fees | |
| 356,471 | | |
| 338,057 | | |
| 302,350 | |
| Change in fair value of mortgage servicing rights, mortgage servicing liabilities | |
| (55,257 | ) | |
| (236,447 | ) | |
| 112,102 | |
| Mortgage servicing rights hedging results | |
| (155,136 | ) | |
| 47,227 | | |
| (176,005 | ) |
| Net loan servicing fees | |
| 146,078 | | |
| 148,837 | | |
| 238,447 | |
| Net interest expense: | |
| | | |
| | | |
| | |
| Interest income | |
| 172,952 | | |
| 128,478 | | |
| 49,864 | |
| Interest expense | |
| 178,642 | | |
| 131,771 | | |
| 71,127 | |
| | |
| (5,690 | ) | |
| (3,293 | ) | |
| (21,263 | ) |
| Management fees from PennyMac Mortgage Investment Trust | |
| 7,078 | | |
| 7,257 | | |
| 7,910 | |
| Other | |
| 3,253 | | |
| 2,363 | | |
| 3,263 | |
| Total net revenues | |
| 336,547 | | |
| 302,862 | | |
| 511,515 | |
| Expenses | |
| | | |
| | | |
| | |
| Compensation | |
| 136,982 | | |
| 147,935 | | |
| 198,192 | |
| Technology | |
| 35,244 | | |
| 36,038 | | |
| 34,621 | |
| Loan origination | |
| 31,646 | | |
| 27,086 | | |
| 44,931 | |
| Professional services | |
| 17,888 | | |
| 21,007 | | |
| 20,793 | |
| Servicing | |
| 14,652 | | |
| 12,632 | | |
| 3,051 | |
| Occupancy and equipment | |
| 10,066 | | |
| 8,820 | | |
| 9,371 | |
| Marketing and advertising | |
| 5,578 | | |
| 3,241 | | |
| 13,007 | |
| Other | |
| 11,574 | | |
| 7,956 | | |
| 10,023 | |
| Total expenses | |
| 263,630 | | |
| 264,715 | | |
| 333,989 | |
| Income before provision for income taxes | |
| 72,917 | | |
| 38,147 | | |
| 177,526 | |
| Provision for income taxes | |
| 14,667 | | |
| 7,769 | | |
| 48,363 | |
| Net income | |
$ | 58,250 | | |
$ | 30,378 | | |
$ | 129,163 | |
| Earnings per share | |
| | | |
| | | |
| | |
| Basic | |
$ | 1.17 | | |
$ | 0.61 | | |
$ | 2.38 | |
| Diluted | |
$ | 1.11 | | |
$ | 0.57 | | |
$ | 2.28 | |
| Weighted-average common shares outstanding | |
| | | |
| | | |
| | |
| Basic | |
| 49,874 | | |
| 50,154 | | |
| 54,167 | |
| Diluted | |
| 52,264 | | |
| 53,352 | | |
| 56,642 | |
| Dividend declared per share | |
$ | 0.20 | | |
$ | 0.20 | | |
$ | 0.20 | |
Exhibit 99.2

2Q23 EARNINGS REPORT PennyMac Financial Services, Inc. July 2023
2 This presentation contains forward - looking statements within the meaning of Section 21E of the Securities Exchange Act of 1934, as amended, regarding management’s beliefs, estimates, projections and assumptions with respect to, among other things, our financial results, future operations, business plans and in vestment strategies, as well as industry and market conditions, all of which are subject to change. Words like “believe,” “expect,” “anticipate,” “promise,” “project,” “plan,” and other expression s o r words of similar meanings, as well as future or conditional verbs such as “will,” “would,” “should,” “could,” or “may” are generally intended to identify forward - looking statements. Actual results and o perations for any future period may vary materially from those projected herein and from past results discussed herein. These forward - looking statements include, but are not limited to, statements rega rding future changes in interest rates, prepayment rates and the housing market; future loan origination, servicing and production, including future production, operating and hedge expenses; fu ture loan delinquencies and forbearances; future earnings and return on equity as well as other business and financial expectations. Factors which could cause actual results to differ materially fr om historical results or those anticipated include, but are not limited to: interest rate changes; declines in real estate or significant changes in U.S. housing prices or activity in the U.S. housing mar ket; the continually changing federal, state and local laws and regulations applicable to the highly regulated industry in which we operate; lawsuits or governmental actions that may result from any no nco mpliance with the laws and regulations applicable to our business; the mortgage lending and servicing - related regulations promulgated by the Consumer Financial Protection Bureau and its enforceme nt of these regulations; our dependence on U.S. government - sponsored entities and changes in their current roles or their guarantees or guidelines; changes to government mortgage modif ica tion programs; the licensing and operational requirements of states and other jurisdictions applicable to our business, to which our bank competitors are not subject; foreclosure delays and cha nge s in foreclosure practices; changes in macroeconomic and U.S. real estate market conditions; difficulties inherent in adjusting the size of our operations to reflect changes in business levels ; p urchase opportunities for mortgage servicing rights and our success in winning bids; our substantial amount of indebtedness; increases in loan delinquencies, defaults and forbearances; our relianc e o n PennyMac Mortgage Investment Trust (NYSE: PMT) as a significant contributor to our mortgage banking business; maintaining sufficient capital and liquidity and compliance with financial cove nan ts; our obligation to indemnify third - party purchasers or repurchase loans if loans that we originate, acquire, service or assist in the fulfillment of, fail to meet certain criteria or characte ris tics or under other circumstances; our obligation to indemnify PMT if our services fail to meet certain criteria or characteristics or under other circumstances; investment management and incentive f ees ; conflicts of interest in allocating our services and investment opportunities among us and our advised entities; the effect of public opinion on our reputation; our exposure to risks of los s a nd disruptions in operations resulting from adverse weather conditions, man - made or natural disasters, climate change and pandemics; our ability to effectively identify, manage and hedge our credit, i nterest rate, prepayment, liquidity and climate risks; our initiation or expansion of new business activities or strategies; our ability to detect misconduct and fraud; our ability to mitigate cyber sec urity risks and cyber incidents; our ability to pay dividends to our stockholders; and our organizational structure and certain requirements in our charter documents. You should not place undue rel iance on any forward - looking statement and should consider all of the uncertainties and risks described above, as well as those more fully discussed in reports and other documents filed by th e C ompany with the Securities and Exchange Commission from time to time. The Company undertakes no obligation to publicly update or revise any forward - looking statements or any other information contained herein, and the statements made in this presentation are current as of the date of this presentation only. This presentation contains financial information calculated other than in accordance with U.S. generally accepted accounting pri nciples (“GAAP”), such as pretax income excluding valuation - related items that provide a meaningful perspective on the Company’s business results since the Company utilizes this information to eva luate and manage the business. Non - GAAP disclosure has limitations as an analytical tool and should not be viewed as a substitute for financial information determined in accordance wi th GAAP. FORWARD - LOOKING STATEMENTS
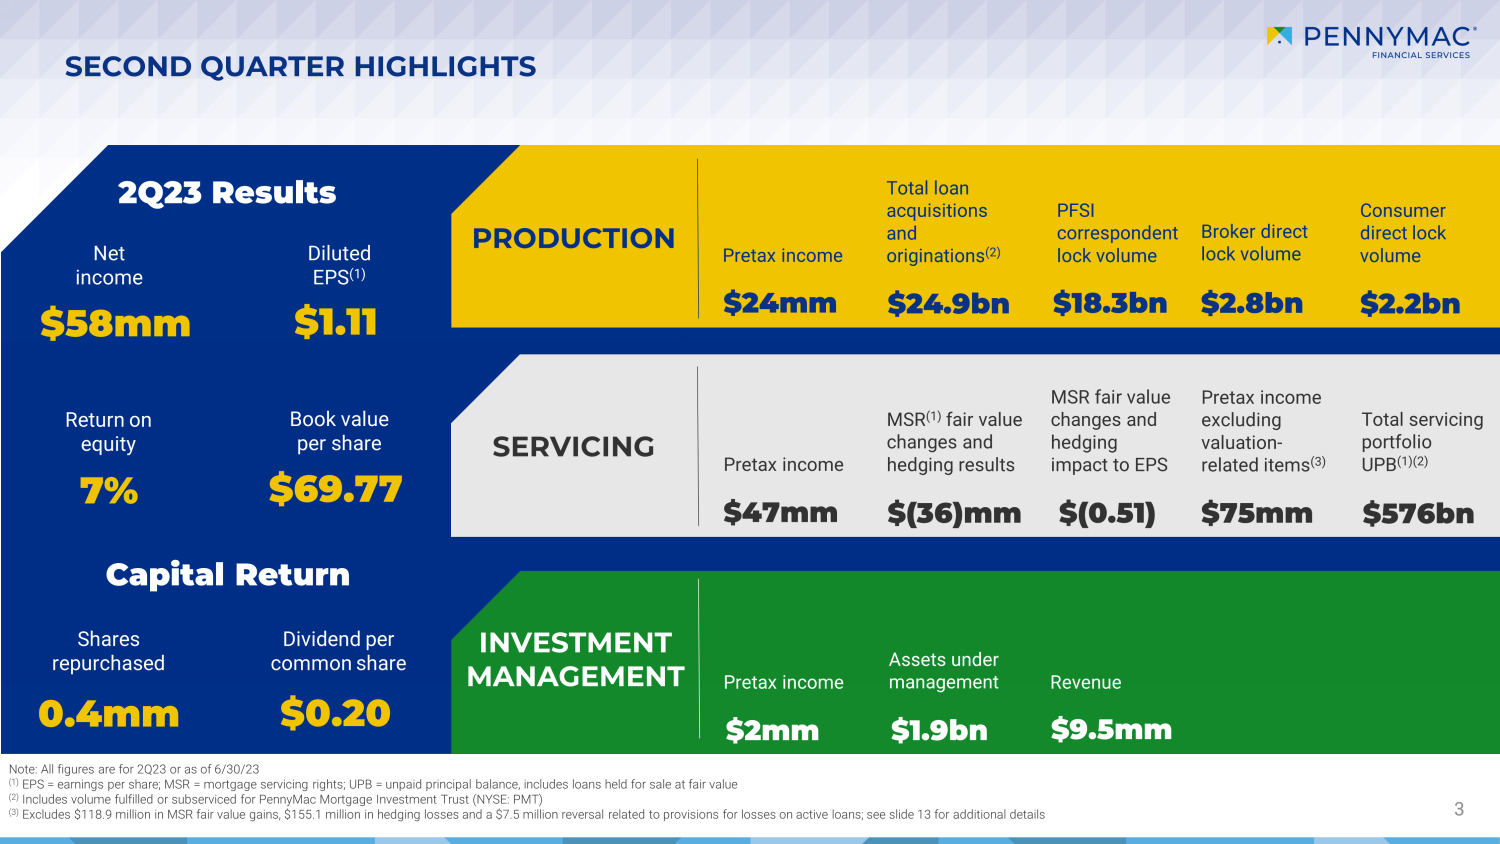
3 3 SECOND QUARTER HIGHLIGHTS PRODUCTION INVESTMENT MANAGEMENT Net income $58mm 2Q23 Results Diluted EPS (1) $1.11 Return on equity 7% Book value per share $69.77 Capital Return Shares repurchased 0.4mm Dividend per common share $0.20 Pretax income $24mm $2.2bn PFSI correspondent lock volume $18.3bn Broker direct lock volume $2.8bn $24.9bn Pretax income $2mm Assets under management $1.9bn Revenue $9.5mm Note: All figures are for 2Q23 or as of 6/30/23 (1) EPS = earnings per share; MSR = mortgage servicing rights; UPB = unpaid principal balance, includes loans held for sale at fa ir value (2) Includes volume fulfilled or subserviced for PennyMac Mortgage Investment Trust (NYSE: PMT) (3) Excludes $118.9 million in MSR fair value gains, $155.1 million in hedging losses and a $7.5 million reversal related to prov is ions for losses on active loans; see slide 13 for additional details SERVICING Pretax income $47mm MSR (1) fair value changes and hedging results $(36)mm Pretax income excluding valuation - related items (3) $75mm MSR fair value changes and hedging impact to EPS $(0.51) Total servicing portfolio UPB (1)(2) $576bn Total loan acquisitions and originations (2) Consumer direct lock volume

ORIGINATION MARKET HAS DECLINED MEANINGFULLY 4 U.S. Mortgage Origination Market (1) ($ in trillions) Mortgage Rates Remain High • Third party forecasts for 2023 originations range from $ 1.6 to $1.8 trillion in UPB, well below normalized levels ‒ Higher mortgage rates are driving borrowers to remain in their homes, leading to low inventory levels and continued home price appreciation ‒ Unit origination volume in 2023 is projected to be at the lowest level since 1990 (4) , driving expectations for industry consolidation if market conditions persist • Mortgage banking companies with large servicing portfolios and diversified business models are better positioned to offset the decline in profitability that has resulted from decreased origination volumes and margins (1) Actual originations: Inside Mortgage Finance. F orecast originations: Average of Mortgage Bankers Association ( 7 /20/23) and Fannie Mae ( 7 /10/23) forecasts. (2) Freddie Mac Primary Mortgage Market Survey 6.78 % as of 7 /20/23 (3) Bloomberg: Difference between Freddie Mac Primary Mortgage Market Survey and the 30 - Year Fannie Mae or Freddie Mac Par Coupon ( MTGEFNCL) Index. (4) Zelman & Associates 6/30/23 (2) (3) $1.8 $1.6 $1.4 $1.5 $2.6 $0.7 $0.3 $0.5 $4.4 $2.3 $1.7 $2.0 2021 2022 2023E 2024E Purchase Refinance 0.0% 1.0% 2.0% 3.0% 4.0% 5.0% 6.0% 7.0% Average 30-year fixed rate mortgage Primary/secondary spread
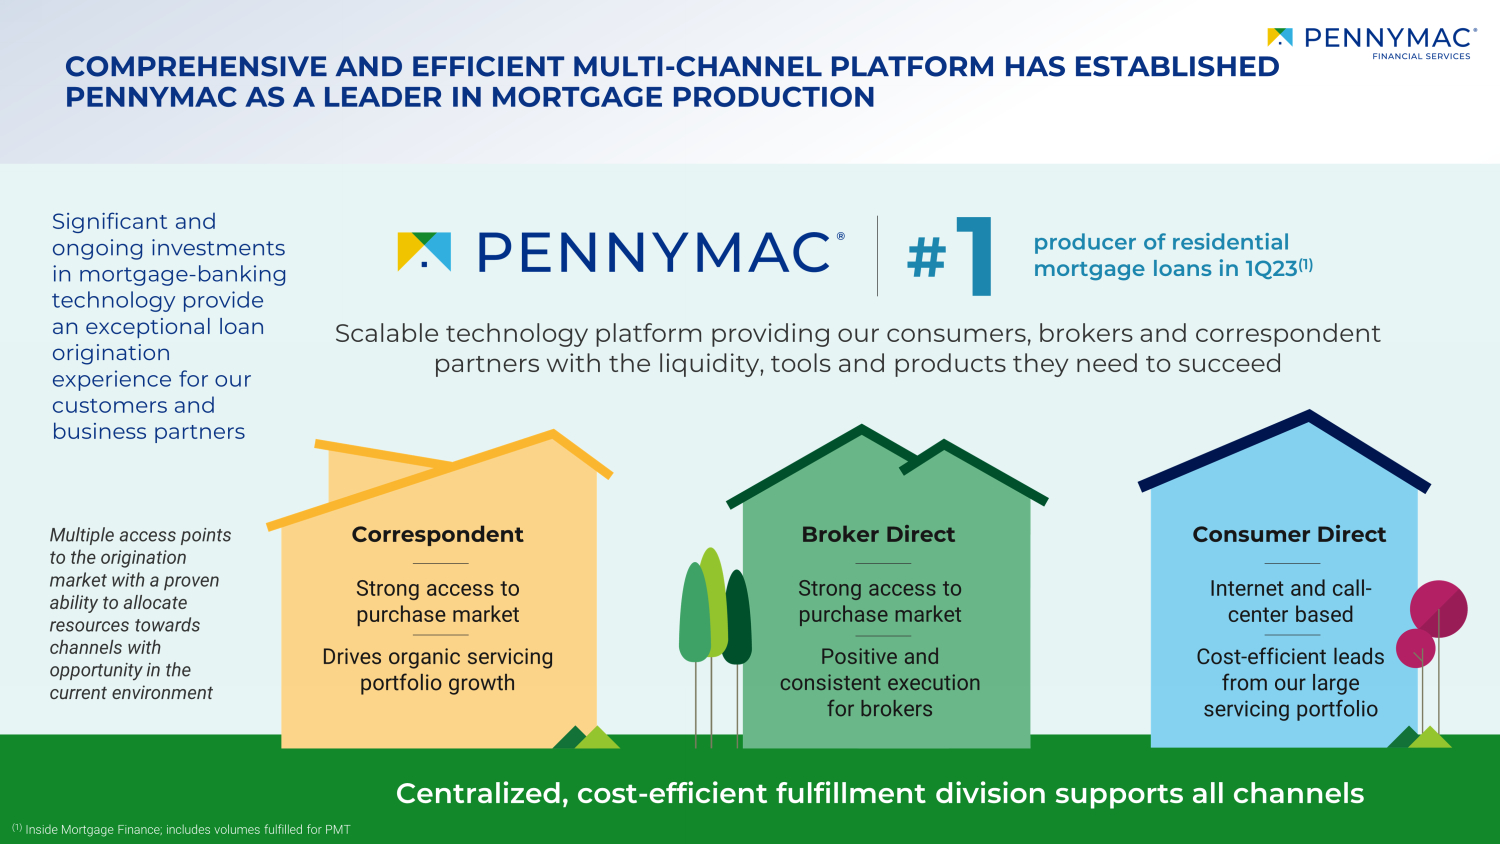
COMPREHENSIVE AND EFFICIENT MULTI - CHANNEL PLATFORM HAS ESTABLISHED PENNYMAC AS A LEADER IN MORTGAGE PRODUCTION 5 Centralized, cost - efficient fulfillment division supports all channels Multiple access points to the origination market with a proven ability to allocate resources towards channels with opportunity in the current environment Significant and ongoing investments in mortgage - banking technology provide an exceptional loan o rigination experience for our customers and business partners Scalable technology platform providing our consumers , brokers and correspondent partners with the liquidity, tools and products they need to succeed 1 producer of residential mortgage loans in 1Q23 (1) (1) Inside Mortgage Finance; includes volumes fulfilled for PMT # Strong access to purchase market Drives organic servicing portfolio growth Strong access to purchase market Positive and consistent execution for brokers Internet and call - center based Cost - efficient leads from our large servicing portfolio Correspondent Broker Direct Consumer Direct
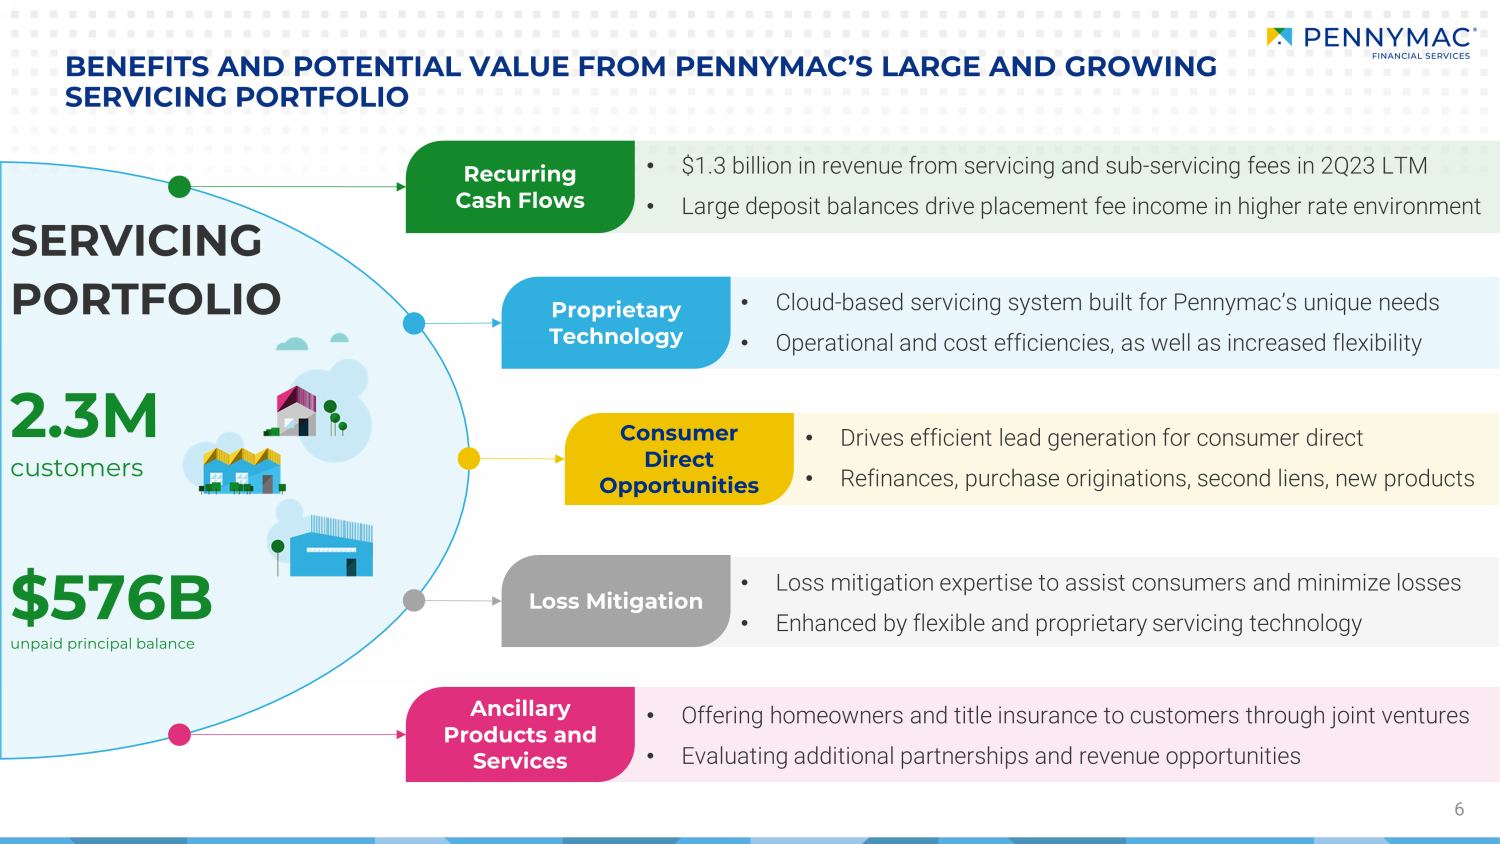
• Offering homeowners and title insurance to customers through joint ventures • Evaluating additional partnerships and revenue opportunities 6 • $1.3 billion in revenue from servicing and sub - servicing fees in 2Q23 LTM • Large deposit balances drive placement fee income in higher rate environment • Cloud - based servicing system built for Pennymac’s unique needs • Operational and cost efficiencies, as well as increased flexibility • Drives efficient lead generation for consumer direct • Refinances, purchase originations, second liens, new products • Loss mitigation expertise to assist consumers and minimize losses • Enhanced by flexible and proprietary servicing technology BENEFITS AND POTENTIAL VALUE FROM PENNYMAC’S LARGE AND GROWING SERVICING PORTFOLIO SERVICING PORTFOLIO Recurring Cash Flows Proprietary Technology Consumer Direct Opportunities Loss Mitigation Ancillary Products and Services 2.3M customers $5 76 B unpaid principal balance
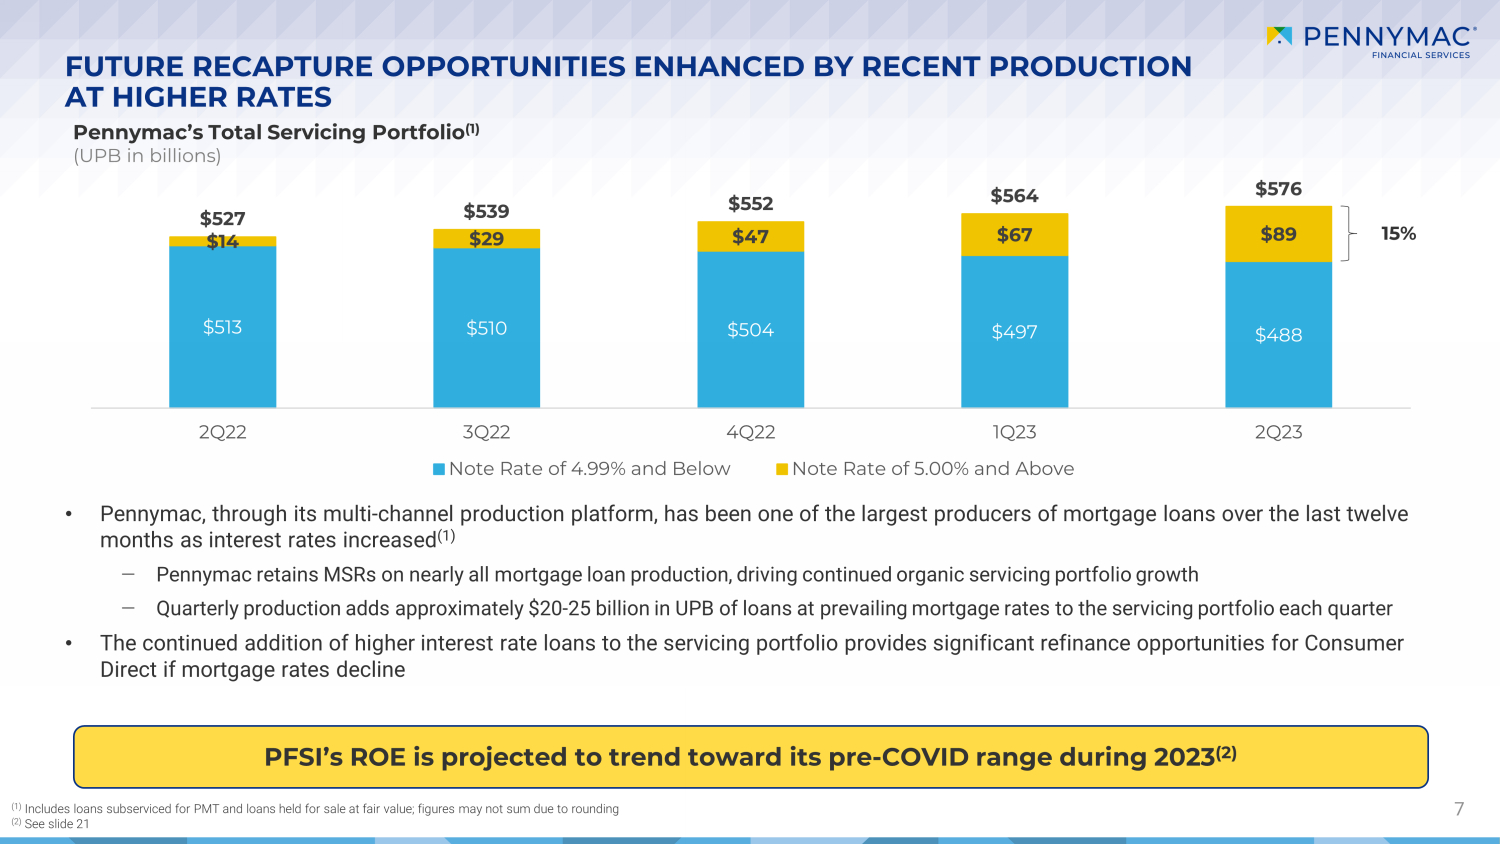
Pennymac’s Total Servicing Portfolio (1) (UPB in bill ions) FUTURE RECAPTURE OPPORTUNITIES ENHANCED BY RECENT PRODUCTION AT HIGHER RATES 7 • Pennymac, through its multi - channel production platform, has been one of the largest producers of mortgage loans over the last twelve months as interest rates increased (1) ‒ Pennymac retains MSRs on nearly all mortgage loan production, driving continued organic servicing portfolio growth ‒ Quarterly production adds approximately $20 - 25 billion in UPB of loans at prevailing mortgage rates to the servicing portfolio e ach quarter • The continued addition of higher interest rate loans to the servicing portfolio provides significant refinance opportunities for Consumer Direct if mortgage rates decline (1) Includes loans subserviced for PMT and loans held for sale at fair value; figure s may not sum due to rounding (2) See slide 21 PFSI’s ROE is projected to trend toward its pre - COVID range during 2023 (2) $513 $510 $504 $497 $488 $14 $29 $47 $67 $89 $527 $539 $552 $564 $576 2Q22 3Q22 4Q22 1Q23 2Q23 Note Rate of 4.99% and Below Note Rate of 5.00% and Above 15%

PENNYMAC’S MARKET SHARE OVER TIME ACROSS ITS BUSINESSES 8 3.3% 3.7% 4.1% 4.1% 4.3% 12/31/19 12/31/20 12/31/21 12/31/22 6/30/23 Loan Servicing Market Share (1) Correspondent Production Market Share (1) Broker Direct Market Share (1) Consumer Direct Market Share (1) Note: All figures are for PFSI and include volume fulfilled or subserviced for PMT (1) Historical market share estimates based on Inside Mortgage Finance. Inside Mortgage Finance estimates $1.6 trillion in total or igination volume for 2Q23 LTM. For 2Q23 LTM, we estimate the correspondent channel represented 29% of the overall origination market, retail represented 56%, and broker represented 15%. Loan servicing market share is based on PFSI’s servicing portfolio UPB of $576 billion divided by an estimated $13.5 trillion in mortgage debt outstanding 15.3% 17.7% 16.7% 15.0% 18.9% 2019 2020 2021 2022 2Q23LTM 0.7% 0.9% 1.6% 1.1% 0.7% 2019 2020 2021 2022 2Q23LTM 1.2% 2.1% 2.4% 2.0% 2.6% 2019 2020 2021 2022 2Q23LTM
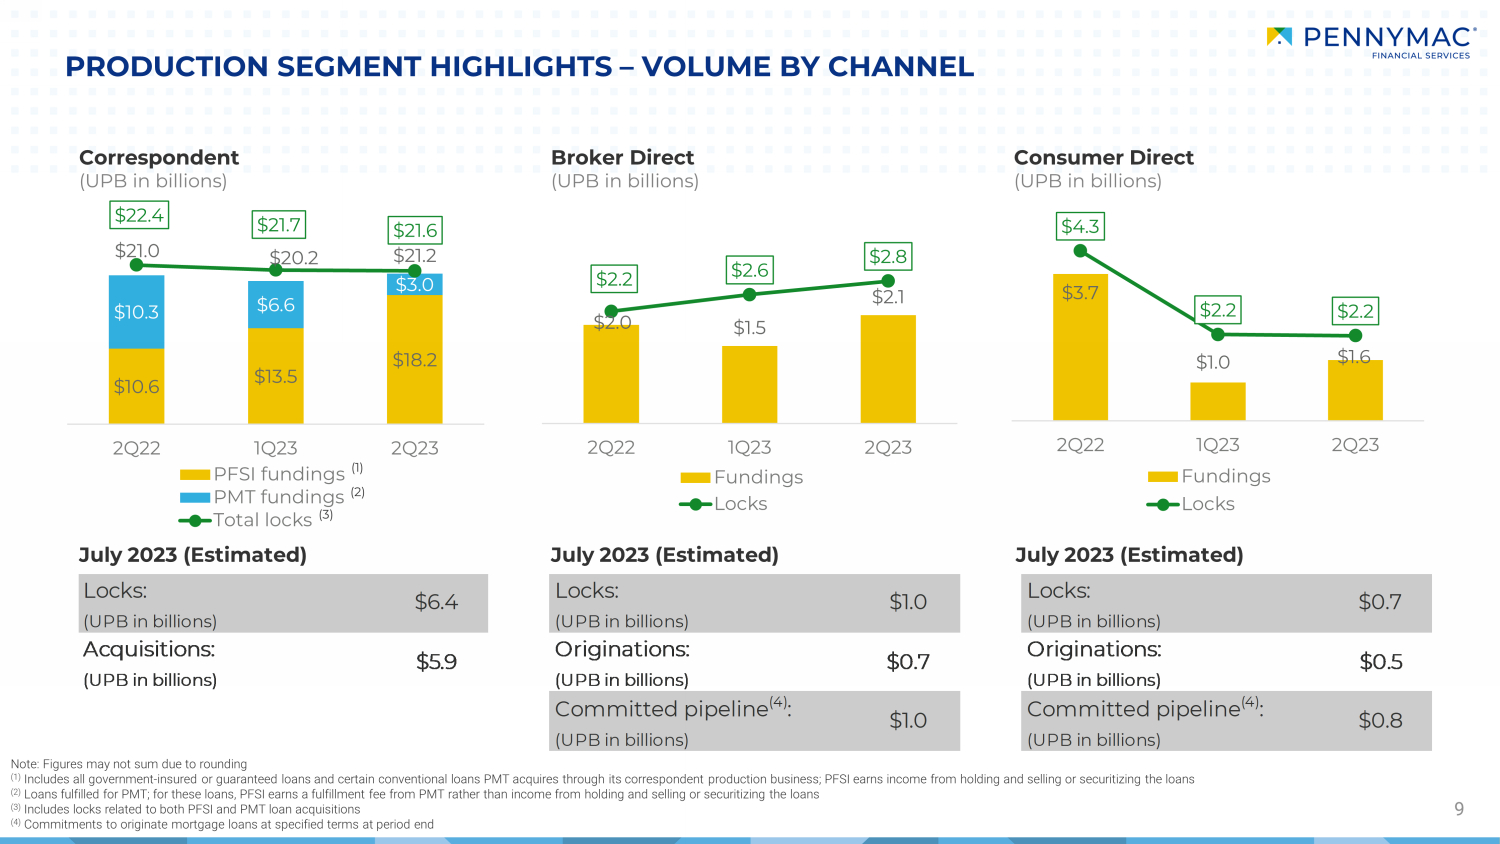
$10.6 $13.5 $18.2 $10.3 $6.6 $3.0 $21.0 $20.2 $21.2 $22.4 $21.7 $21.6 2Q22 1Q23 2Q23 PFSI fundings PMT fundings Total locks 9 PRODUCTION SEGMENT HIGHLIGHTS – VOLUME BY CHANNEL Broker Direct (UPB in billions) Consumer Direct (UPB in billions) July 2023 (Estimated) July 2023 (Estimated) July 2023 (Estimated) Note: Figures may not sum due to rounding (1) Includes all government - insured or guaranteed loans and certain conventional loans PMT acquires through its correspondent produ ction business; PFSI earns income from holding and selling or securitizing the loans (2) Loans fulfilled for PMT; for these loans, PFSI earns a fulfillment fee from PMT rather than income from holding and selling o r securitizing the loans (3) Includes locks related to both PFSI and PMT loan acquisitions (4) Commitments to originate mortgage loans at specified terms at period end (1) (2) (3) Correspondent (UPB in billions) $3.7 $1.0 $1.6 $4.3 $2.2 $2.2 2Q22 1Q23 2Q23 Fundings Locks $2.0 $1.5 $2.1 $2.2 $2.6 $2.8 2Q22 1Q23 2Q23 Fundings Locks Locks: (UPB in billions) $6.4 Locks: (UPB in billions) $1.0 Locks: (UPB in billions) $0.7 Acquisitions: (UPB in billions) $5.9 Originations: (UPB in billions) $0.7 Originations: (UPB in billions) $0.5 Committed pipeline (4) : (UPB in billions) $1.0 Committed pipeline (4) : (UPB in billions) $0.8
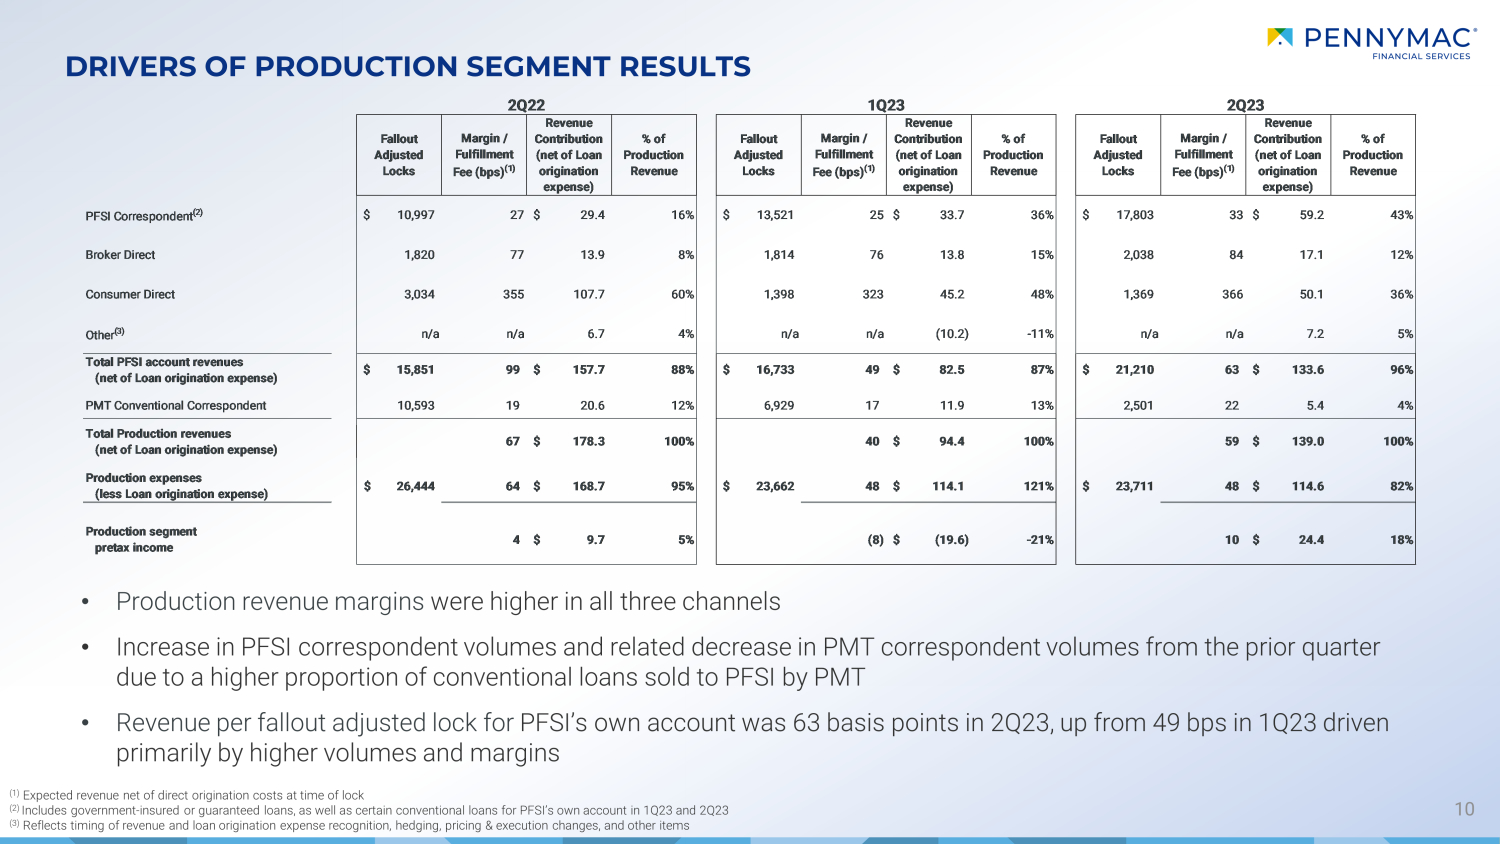
10 DRIVERS OF PRODUCTION SEGMENT RESULTS (1) Expected revenue net of direct origination costs at time of lock (2) Includes government - insured or guaranteed loans, as well as certain conventional loans for PFSI’s own account in 1Q23 and 2Q23 (3) Reflects timing of revenue and loan origination expense recognition, hedging, pricing & execution changes, and other items • Production revenue margins were higher in all three channels • Increase in PFSI correspondent volumes and related decrease in PMT correspondent volumes from the prior quarter due to a higher proportion of conventional loans sold to PFSI by PMT • Revenue per fallout adjusted lock for PFSI’s own account was 63 basis points in 2Q23, up from 49 bps in 1Q23 driven primarily by higher volumes and margins Fallout Adjusted Locks Margin / Fulfillment Fee (bps) (1) Revenue Contribution (net of Loan origination expense) % of Production Revenue Fallout Adjusted Locks Margin / Fulfillment Fee (bps) (1) Revenue Contribution (net of Loan origination expense) % of Production Revenue Fallout Adjusted Locks Margin / Fulfillment Fee (bps) (1) Revenue Contribution (net of Loan origination expense) % of Production Revenue PFSI Correspondent (2) 10,997$ 27 29.4$ 16% 13,521$ 25 33.7$ 36% 17,803$ 33 59.2$ 43% Broker Direct 1,820 77 13.9 8% 1,814 76 13.8 15% 2,038 84 17.1 12% Consumer Direct 3,034 355 107.7 60% 1,398 323 45.2 48% 1,369 366 50.1 36% Other (3) n/a n/a 6.7 4% n/a n/a (10.2) -11% n/a n/a 7.2 5% Total PFSI account revenues (net of Loan origination expense) 15,851$ 99 157.7$ 88% 16,733$ 49 82.5$ 87% 21,210$ 63 133.6$ 96% PMT Conventional Correspondent 10,593 19 20.6 12% 6,929 17 11.9 13% 2,501 22 5.4 4% Total Production revenues (net of Loan origination expense) 67 178.3$ 100% 40 94.4$ 100% 59 139.0$ 100% Production expenses (less Loan origination expense) 26,444$ 64 168.7$ 95% 23,662$ 48 114.1$ 121% 23,711$ 48 114.6$ 82% Production segment pretax income 4 9.7$ 5% (8) (19.6)$ -21% 10 24.4$ 18% 2Q231Q232Q22
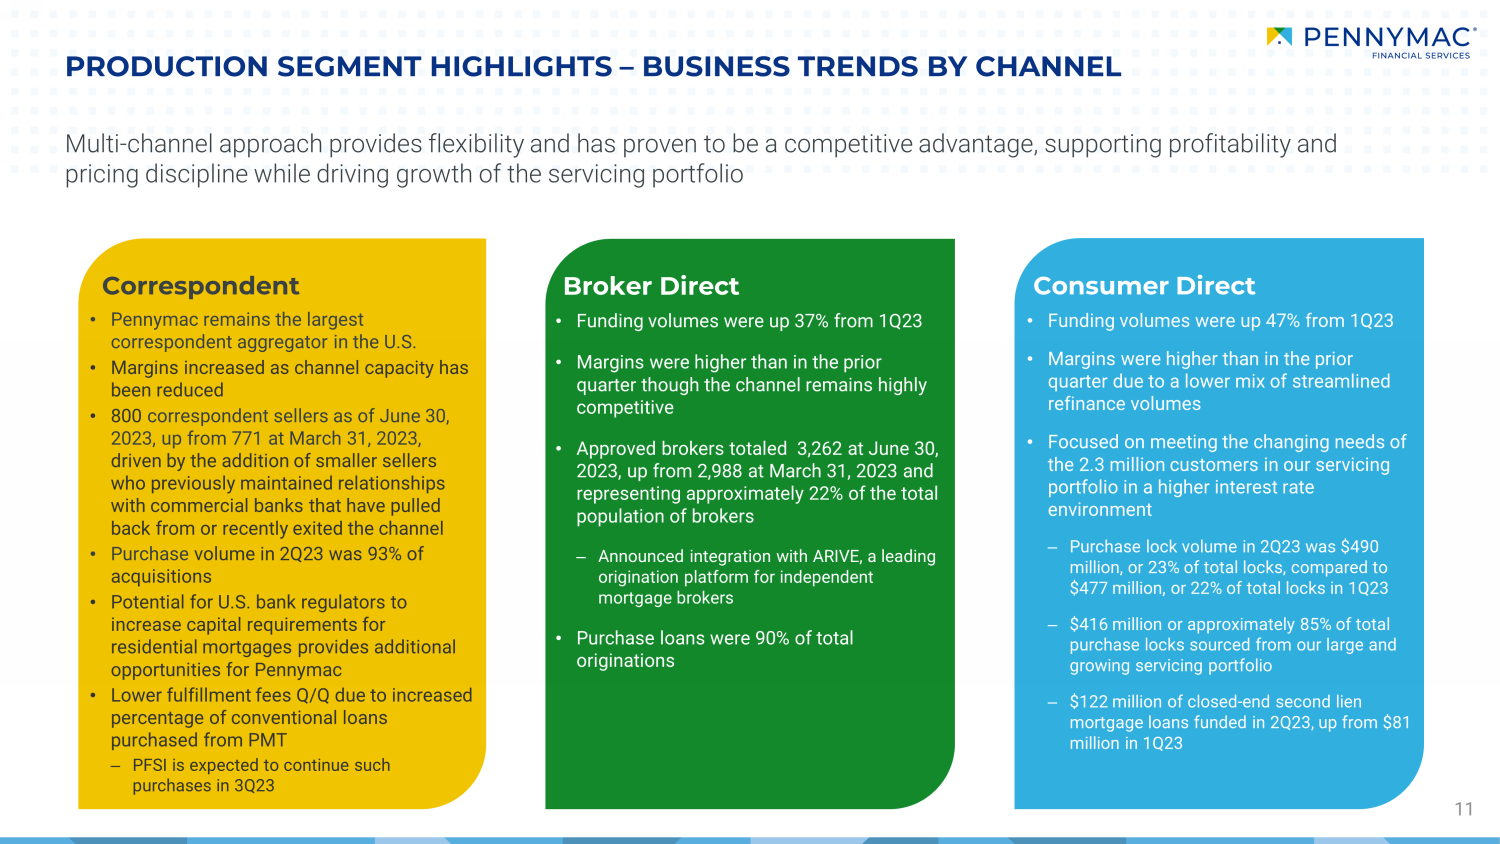
PRODUCTION SEGMENT HIGHLIGHTS – BUSINESS TRENDS BY CHANNEL 11 • Pennymac remains the largest correspondent aggregator in the U.S. • Margins increased as channel capacity has been reduced • 800 correspondent sellers as of June 30, 2023, up from 771 at March 31, 2023, driven by the addition of smaller sellers who previously maintained relationships with commercial banks that have pulled back from or recently exited the channel • Purchase volume in 2Q23 was 93% of acquisitions • Potential for U.S. bank regulators to increase capital requirements for residential mortgages provides additional opportunities for Pennymac • Lower fulfillment fees Q/Q due to increased percentage of conventional loans purchased from PMT ‒ PFSI is expected to continue such purchases in 3Q23 • Funding volumes were up 37% from 1Q23 • Margins were higher than in the prior quarter though the channel remains highly competitive • Approved brokers totaled 3,262 at June 30, 2023, up from 2,988 at March 31, 2023 and representing approximately 22% of the total population of brokers ‒ Announced integration with ARIVE, a leading origination platform for independent mortgage brokers • Purchase loans were 90% of total originations • Funding volumes were up 47% from 1Q23 • Margins were higher than in the prior quarter due to a lower mix of streamlined refinance volumes • Focused on meeting the changing needs of the 2.3 million customers in our servicing portfolio in a higher interest rate environment ‒ Purchase lock volume in 2Q23 was $490 million, or 23% of total locks, compared to $477 million, or 22% of total locks in 1Q23 ‒ $416 million or approximately 85% of total purchase locks sourced from our large and growing servicing portfolio ‒ $122 million of closed - end second lien mortgage loans funded in 2Q23, up from $81 million in 1Q23 C orrespondent Broker Direct C onsumer Direct Multi - channel approach provides flexibility and has proven to be a competitive advantage, supporting profitability and pricing discipline while driving growth of the servicing portfolio
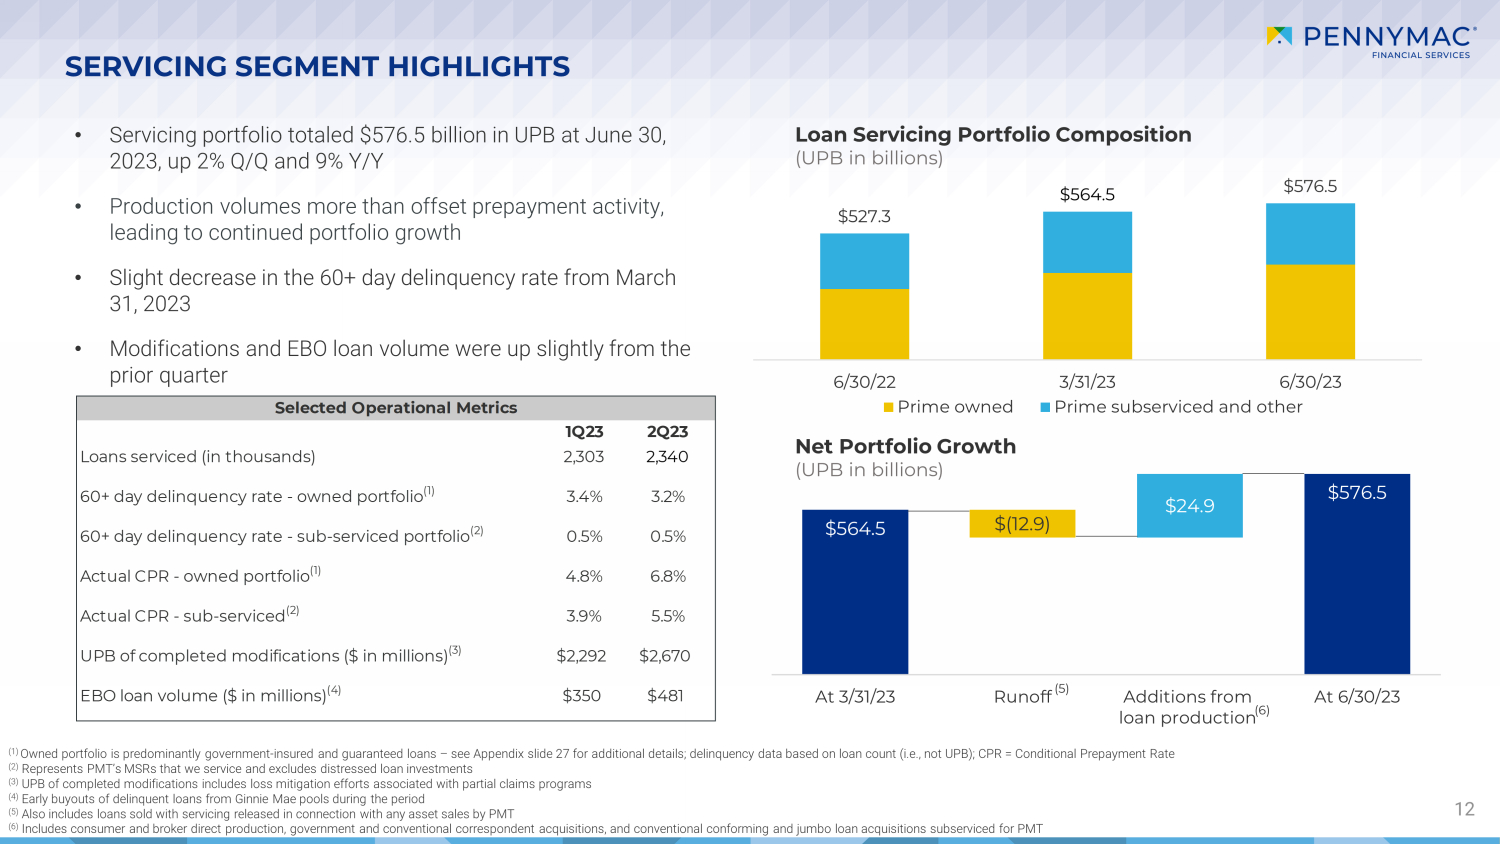
$564.5 $576.5 $(12.9) $24.9 At 3/31/23 Runoff Additions from loan production At 6/30/23 SERVICING SEGMENT HIGHLIGHTS 12 • Servicing portfolio totaled $576.5 billion in UPB at June 30, 2023, up 2% Q/Q and 9% Y/Y • Production volumes more than offset prepayment activity, leading to continued portfolio growth • Slight decrease in the 60+ day delinquency rate from March 31, 2023 • Modifications and EBO loan volume were up slightly from the prior quarter Loan Servicing Portfolio Composition (UPB in billions) Net Portfolio Growth (UPB in billions) (1) Owned portfolio is predominantly government - insured and guaranteed loans – see Appendix slide 27 for additional details; delinqu ency data based on loan count (i.e., not UPB); CPR = Conditional Prepayment Rate (2) Represents PMT’s MSRs that we service and excludes distressed loan investments (3) UPB of completed modifications includes loss mitigation efforts associated with partial claims programs (4) Early buyouts of delinquent loans from Ginnie Mae pools during the period (5) Also includes loans sold with servicing released in connection with any asset sales by PMT (6) Includes consumer and broker direct production, government and conventional correspondent acquisitions, and conventional conf or ming and jumbo loan acquisitions subserviced for PMT (5) (6) $527.3 $564.5 $576.5 6/30/22 3/31/23 6/30/23 Prime owned Prime subserviced and other 1Q23 2Q23 Loans serviced (in thousands) 2,303 2,340 60+ day delinquency rate - owned portfolio (1) 3.4% 3.2% 60+ day delinquency rate - sub-serviced portfolio (2) 0.5% 0.5% Actual CPR - owned portfolio (1) 4.8% 6.8% Actual CPR - sub-serviced (2) 3.9% 5.5% UPB of completed modifications ($ in millions) (3) $2,292 $2,670 EBO loan volume ($ in millions) (4) $350 $481 Selected Operational Metrics
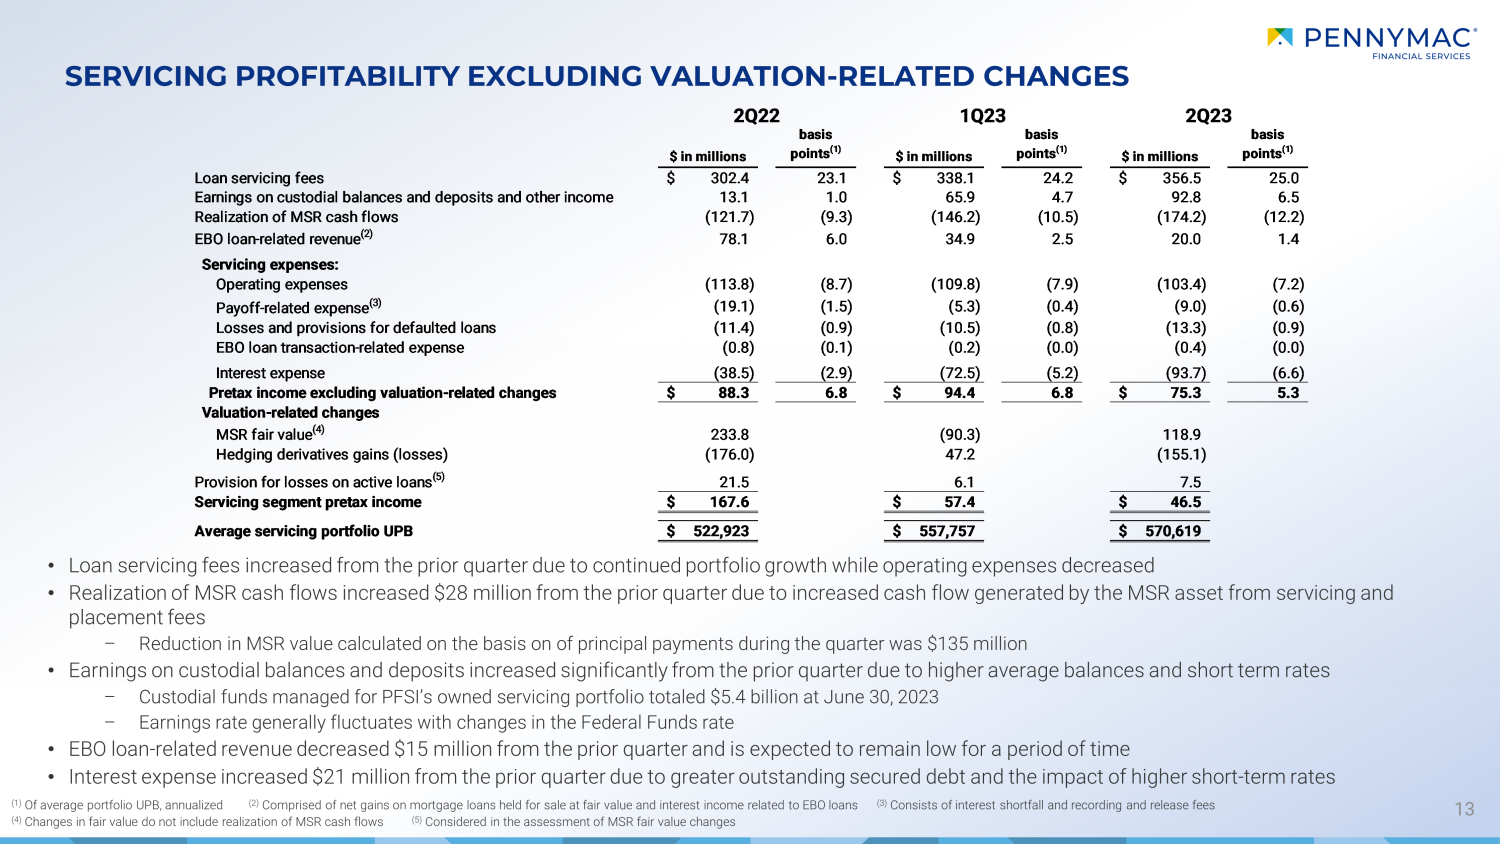
SERVICING PROFITABILITY EXCLUDING VALUATION - RELATED CHANGES 13 (1) Of average portfolio UPB, annualized (2) Comprised of net gains on mortgage loans held for sale at fair value and interest income related to EBO loans (3) Consists of interest shortfall and recording and release fees (4) Changes in fair value do not include realization of MSR cash flows (5) Considered in the assessment of MSR fair value changes • Loan servicing fees increased from the prior quarter due to continued portfolio growth while operating expenses decreased • Realization of MSR cash flows increased $28 million from the prior quarter due to increased cash flow generated by the MSR as set from servicing and placement fees – Reduction in MSR value calculated on the basis on of principal payments during the quarter was $135 million • Earnings on custodial balances and deposits increased significantly from the prior quarter due to higher average balances and sh ort term rates – Custodial funds managed for PFSI’s owned servicing portfolio totaled $5.4 billion at June 30, 2023 – Earnings rate generally fluctuates with changes in the Federal Funds rate • EBO loan - related revenue decreased $15 million from the prior quarter and is expected to remain low for a period of time • Interest expense increased $21 million from the prior quarter due to greater outstanding secured debt and the impact of highe r s hort - term rates $ in millions basis points (1) $ in millions basis points (1) $ in millions basis points (1) Loan servicing fees 302.4$ 23.1 338.1$ 24.2 356.5$ 25.0 Earnings on custodial balances and deposits and other income 13.1 1.0 65.9 4.7 92.8 6.5 Realization of MSR cash flows (121.7) (9.3) (146.2) (10.5) (174.2) (12.2) EBO loan-related revenue (2) 78.1 6.0 34.9 2.5 20.0 1.4 Servicing expenses: Operating expenses (113.8) (8.7) (109.8) (7.9) (103.4) (7.2) Payoff-related expense (3) (19.1) (1.5) (5.3) (0.4) (9.0) (0.6) Losses and provisions for defaulted loans (11.4) (0.9) (10.5) (0.8) (13.3) (0.9) EBO loan transaction-related expense (0.8) (0.1) (0.2) (0.0) (0.4) (0.0) Interest expense (38.5) (2.9) (72.5) (5.2) (93.7) (6.6) Pretax income excluding valuation-related changes 88.3$ 6.8 94.4$ 6.8 75.3$ 5.3 Valuation-related changes MSR fair value (4) 233.8 (90.3) 118.9 Hedging derivatives gains (losses) (176.0) 47.2 (155.1) Provision for losses on active loans (5) 21.5 6.1 7.5 Servicing segment pretax income 167.6$ 57.4$ 46.5$ Average servicing portfolio UPB 522,923$ 557,757$ 570,619$ 2Q231Q232Q22
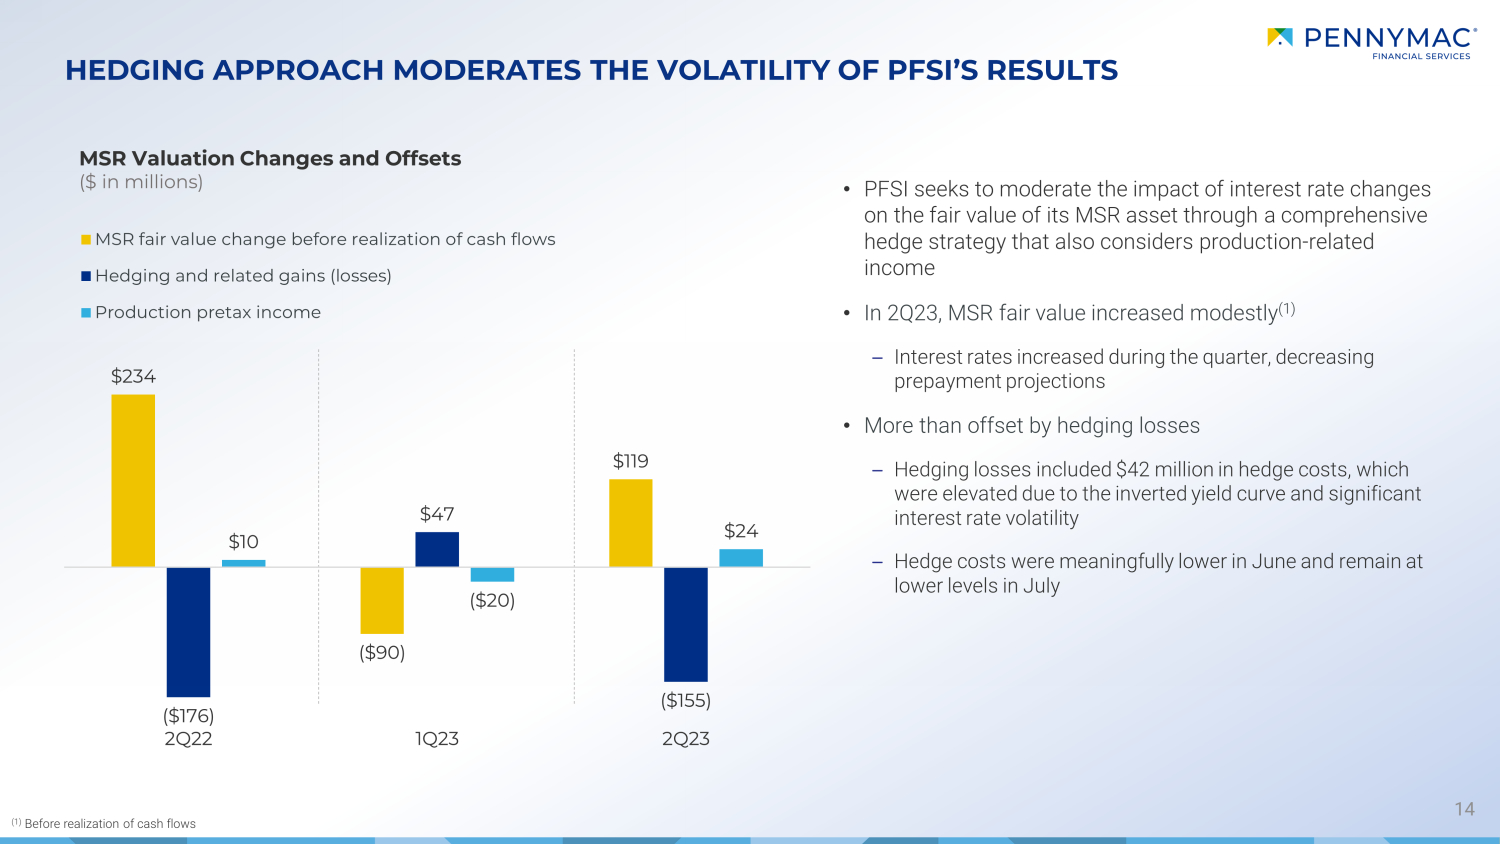
14 HEDGING APPROACH MODERATES THE VOLATILITY OF PFSI’S RESULTS MSR Valuation Changes and Offsets ($ in millions) • PFSI seeks to moderate the impact of interest rate changes on the fair value of its MSR asset through a comprehensive hedge strategy that also considers production - related income • In 2Q23, MSR fair value increased modestly (1) – Interest rates increased during the quarter, decreasing prepayment projections • More than o ffset by hedging losses – Hedging losses included $42 million in hedge costs, which were elevated due to the inverted yield curve and significant interest rate volatility – Hedge costs were meaningfully lower in June and remain at lower levels in July (1) Before realization of cash flows $234 ($90) $119 ($176) $47 ($155) $10 ($20) $24 2Q22 1Q23 2Q23 MSR fair value change before realization of cash flows Hedging and related gains (losses) Production pretax income

$9.7 $9.3 $9.5 2Q22 1Q23 2Q23 Base management fees & other revenue $2.1 $2.0 $1.9 6/30/22 3/31/23 6/30/23 INVESTMENT MANAGEMENT SEGMENT HIGHLIGHTS 15 • Net AUM as of June 30, 2023 were $ 1.9 billion, down 2% from March 31, 2023 and 7 % from June 30, 2022 • Investment Management segment revenues were $9.5 million, up 2 % from 1Q23 and down 2 % from 2Q22 Investment Management AUM ($ in billions) Investment Management Revenues ($ in millions)

APPENDIX
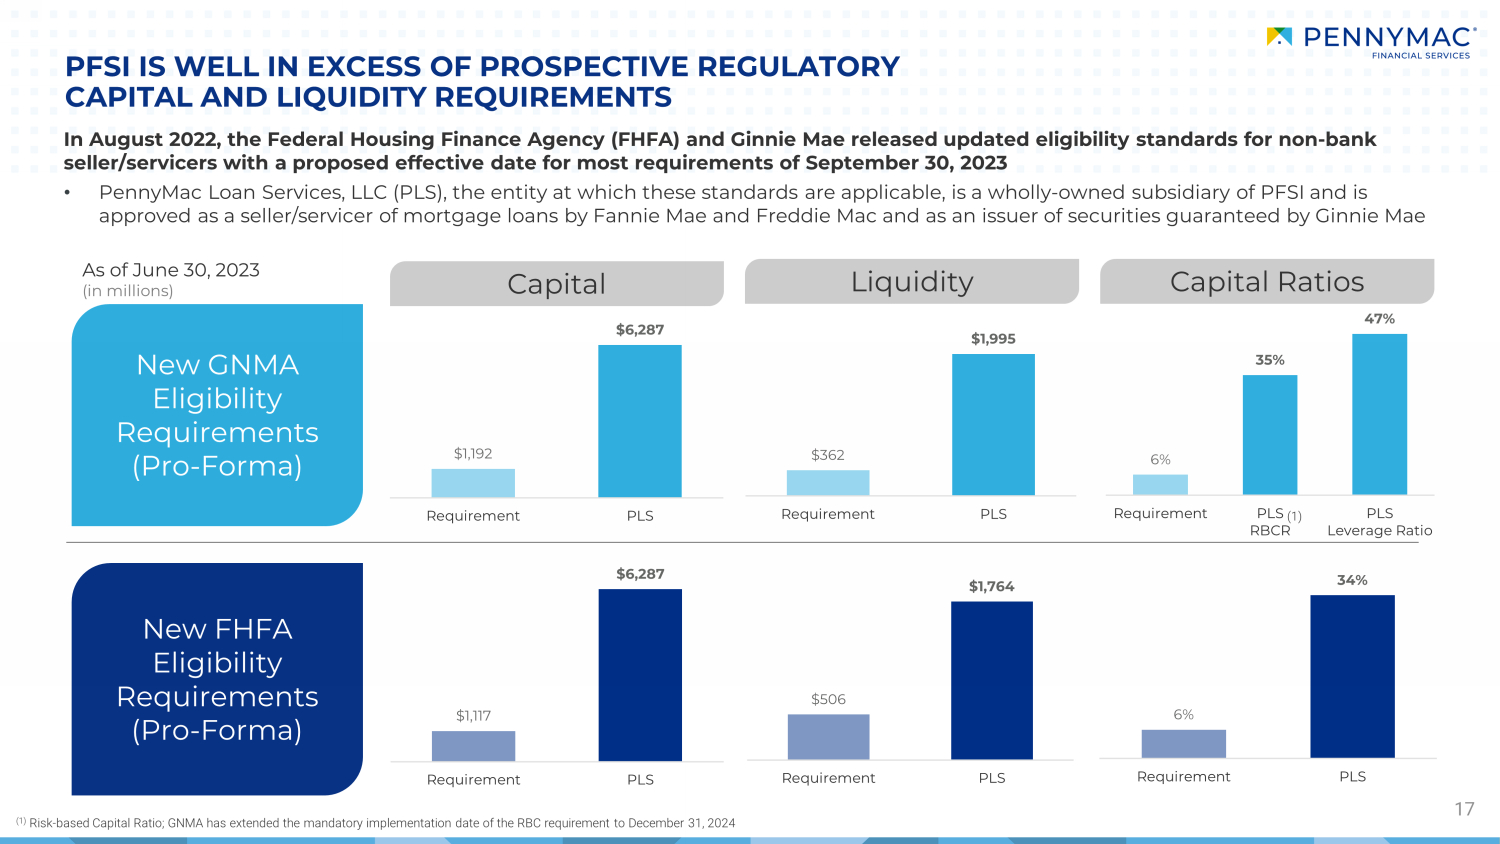
In August 2022, the Federal Housing Finance Agency (FHFA) and Ginnie Mae released updated eligibility standards for non - bank seller/servicers with a proposed effective date for most requirements of September 30, 2023 • PennyMac Loan Services, LLC (PLS), the entity at which these standards are applicable, is a wholly - owned subsidiary of PFSI and is approved as a seller/servicer of mortgage loans by Fannie Mae and Freddie Mac and as an issuer of securities guaranteed by Gi nni e Mae PFSI IS WELL IN EXCESS OF PROSPECTIVE REGULATORY CAPITAL AND LIQUIDITY REQUIREMENTS 17 New GNMA Eligibility Requirements (Pro - Forma) New FHFA Eligibility Requirements (Pro - Forma) Capital Liquidity Capital Ratios (1) Risk - based Capital Ratio; GNMA has extended the mandatory implementation date of the RBC requirement to December 31, 2024 As of June 30, 2023 (in millions) (1) 6% 34% Requirement PLS 6% 35% 47% Requirement PLS RBCR PLS Leverage Ratio $362 $1,995 Requirement PLS $1,117 $6,287 Requirement PLS $1,192 $6,287 Requirement PLS $506 $1,764 Requirement PLS
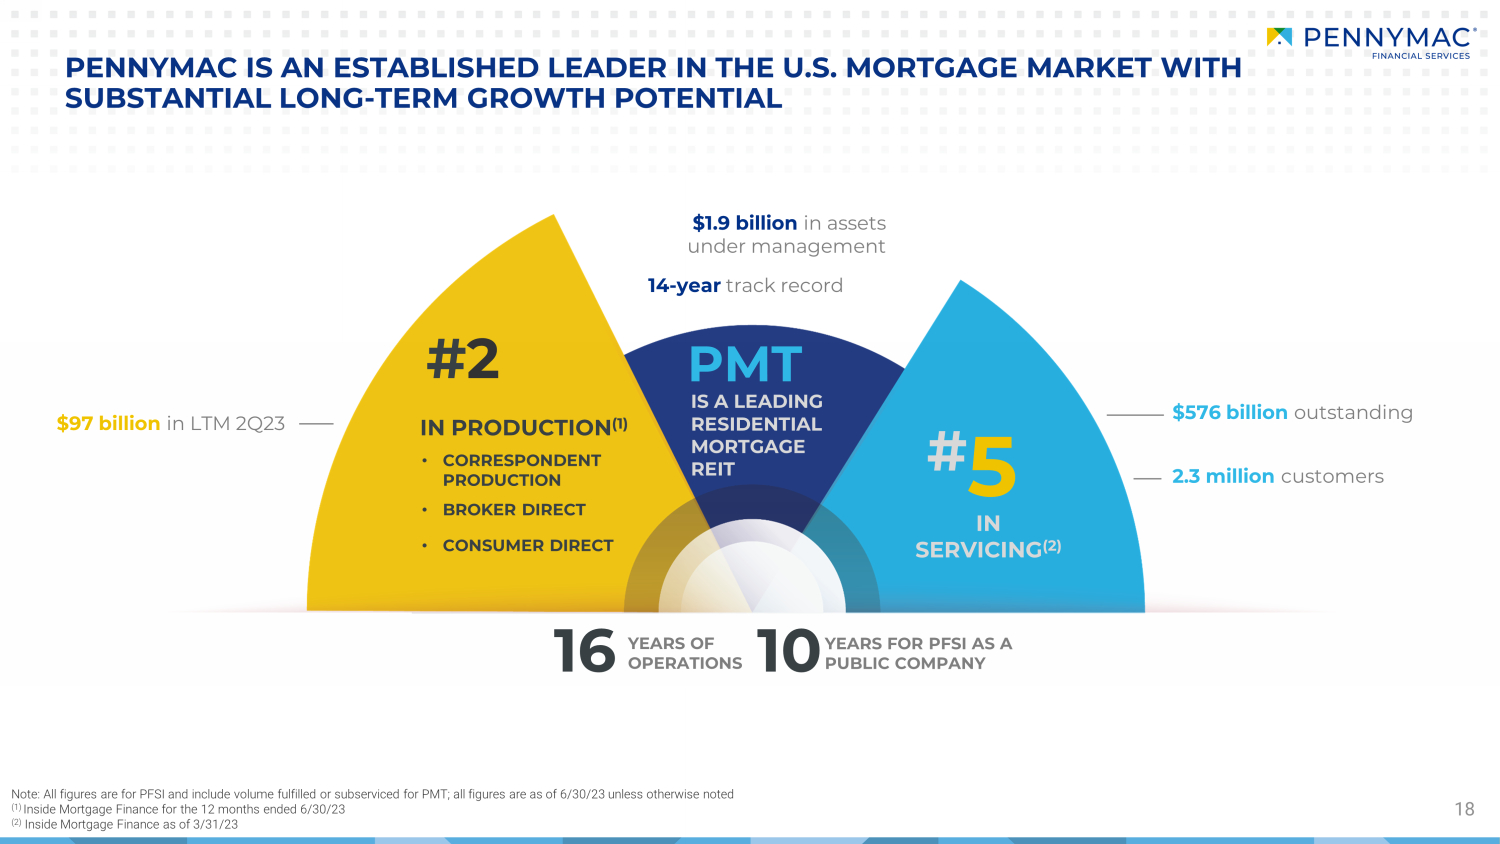
18 PENNYMAC IS AN ESTABLISHED LEADER IN THE U.S. MORTGAGE MARKET WITH SUBSTANTIAL LONG - TERM GROWTH POTENTIAL $576 billion outstanding IN SER VIC ING (2) YEARS FOR PFSI AS A PUBLIC COMPANY 16 YEARS OF OPERATIONS PMT # 2 • CORRESPONDENT PRODUCTION • BROKER DIRECT • CONSUMER DIRECT IN PRODUCTION (1) IS A LEADING RESIDENTIAL MORTGAGE REIT # 5 Note: All figures are for PFSI and include volume fulfilled or subserviced for PMT; all figures are as of 6/30/23 unless othe rwi se noted (1) Inside Mortgage Finance for the 12 months ended 6/30/23 (2) Inside Mortgage Finance as of 3/31/23 $1.9 billion in assets under management 14 - year track record 2.3 million customers $97 billion in LTM 2Q23 10

OVERVIEW OF PENNYMAC FINANCIAL’S BUSINESSES 19 LOAN PRODUCTION Correspondent aggregation of newly originated loans from third - party sellers Fulfillment fees for PMT’s delegated conventional loans PFSI earns gains on all loan production with the exception of loans fulfilled for PMT Broker direct and consumer direct origination of conventional and government - insured loans LOAN SERVICING Servicing for owned MSRs and subservicing for MSRs owned by PMT Major loan servicer for Fannie Mae, Freddie Mac and Ginnie Mae Industry - leading capabilities in special servicing Organic growth results from loan production, supplemented by MSR acquisitions and PMT investment activity INVESTMENT MANAGEMENT External manager of PMT, which invests in mortgage - related assets: GSE credit risk transfer investments MSR investments Investments in prime non - agency MBS and asset - backed securities Synergistic partnership with PMT Complex and highly regulated mortgage industry requires effective governance, compliance and operating systems Operating platform has been developed organically and is highly scalable Commitment to strong corporate governance, compliance and risk management since inception PFSI is well - positioned to navigate the current market and regulatory environment
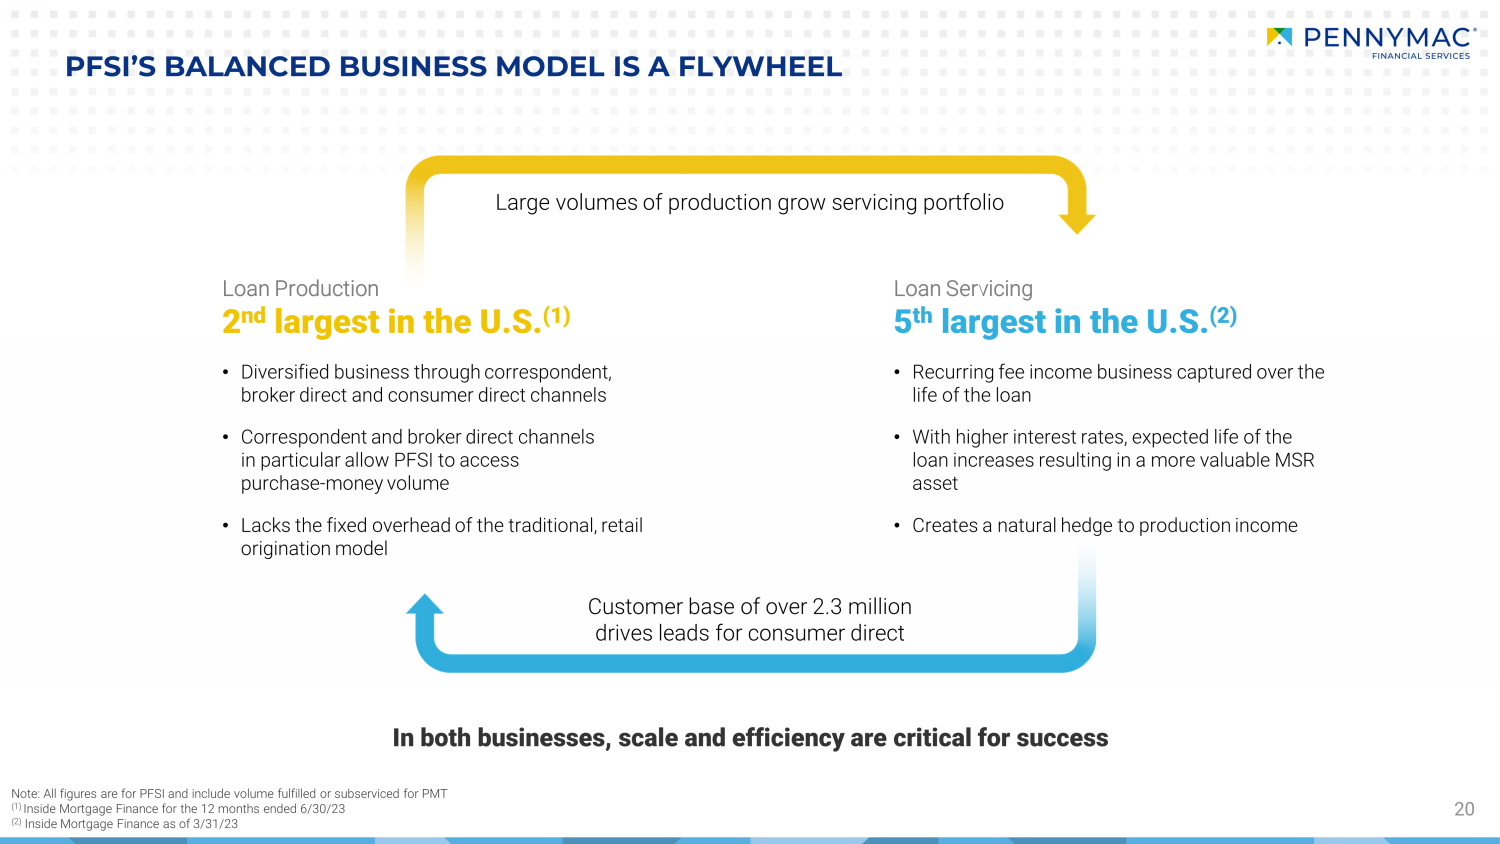
20 PFSI’S BALANCED BUSINESS MODEL IS A FLYWHEEL • Diversified business through correspondent, broker direct and consumer direct channels • Correspondent and broker direct channels in particular allow PFSI to access purchase - money volume • Lacks the fixed overhead of the traditional, retail origination model • Recurring fee income business captured over the life of the loan • With higher interest rates, expected life of the loan increases resulting in a more valuable MSR asset • Creates a natural hedge to production income Customer base of over 2.3 million drives leads for consumer direct Large volumes of production grow servicing portfolio Loan Production 2 nd largest in the U.S. (1) Loan Servicing 5 th largest in the U.S. (2) In both businesses, scale and efficiency are critical for success Note: All figures are for PFSI and include volume fulfilled or subserviced for PMT (1) Inside Mortgage Finance for the 12 months ended 6/30/23 (2) Inside Mortgage Finance as of 3/31/23
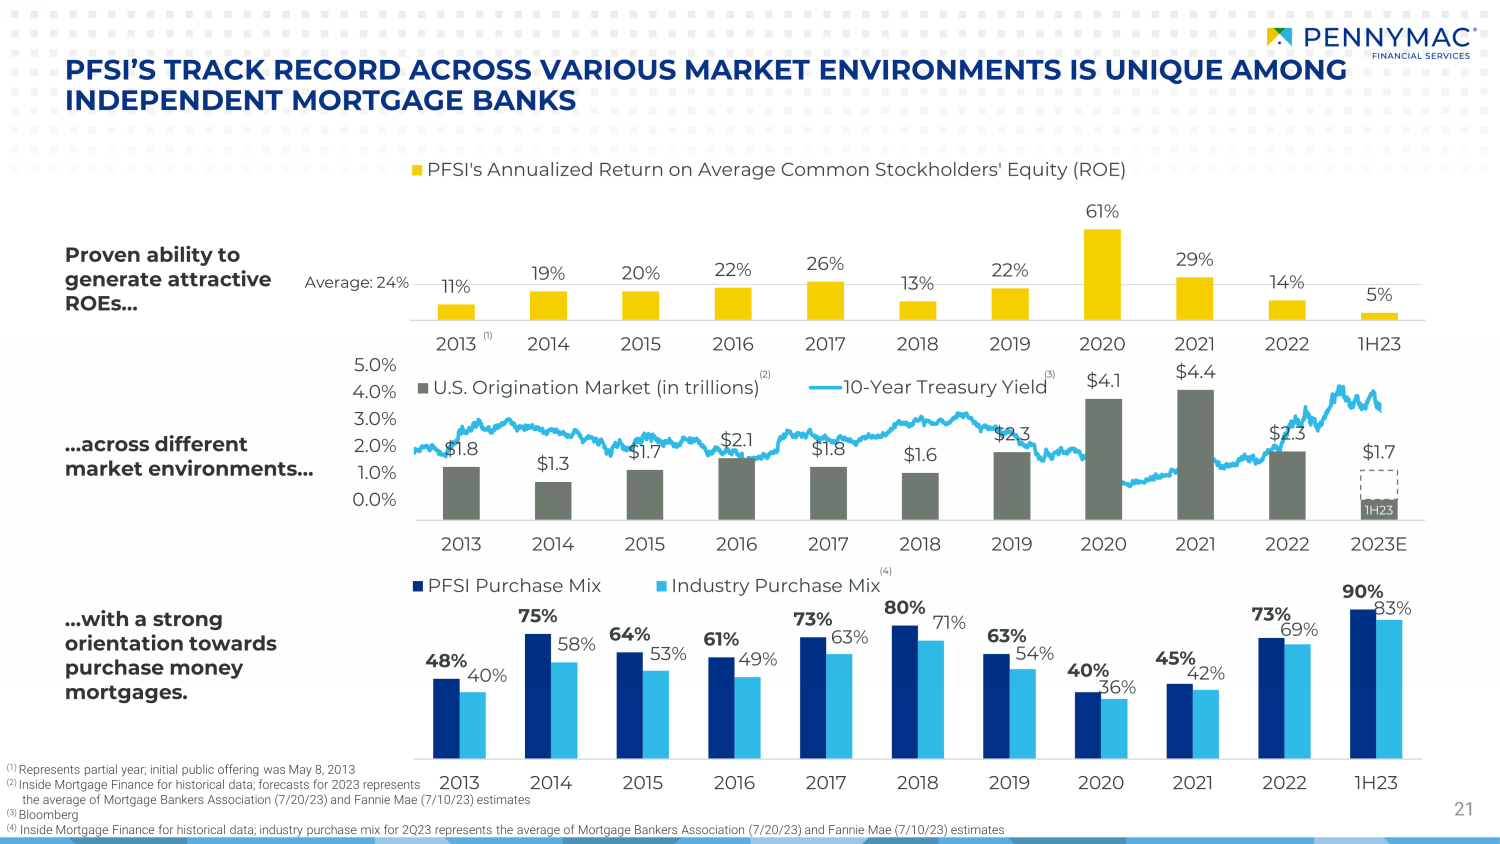
48% 75% 64% 61% 73% 80% 63% 40% 45% 73% 90% 40% 58% 53% 49% 63% 71% 54% 36% 42% 69% 83% 2013 2014 2015 2016 2017 2018 2019 2020 2021 2022 1H23 PFSI Purchase Mix Industry Purchase Mix 0.0% 1.0% 2.0% 3.0% 4.0% 5.0% 10-Year Treasury Yield 1H23 $1.8 $1.3 $1.7 $2.1 $1.8 $1.6 $2.3 $4.1 $4.4 $2.3 $1.7 2013 2014 2015 2016 2017 2018 2019 2020 2021 2022 2023E U.S. Origination Market (in trillions) Proven ability to generate attractive ROEs… 21 PFSI’S TRACK RECORD ACROSS VARIOUS MARKET ENVIRONMENTS IS UNIQUE AMONG INDEPENDENT MORTGAGE BANKS …across different market environments… …with a strong orientation towards purchase money mortgages. (1) Represents partial year ; in itial public o ffering was May 8, 2013 (2) Inside Mortgage Finance for historical data; forecasts for 2023 represents the average of Mortgage Bankers Association (7/20/23) and Fannie Mae (7/10/23) estimates (3) Bloomberg (4) Inside Mortgage Finance for historical data; industry purchase mix for 2 Q23 represents the average of Mortgage Bankers Association (7/20/23) and Fannie Mae (7/10/23) estimates (1) (2) (3) (4) Average: 24% 11% 19% 20% 22% 26% 13% 22% 61% 29% 14% 5% 2013 2014 2015 2016 2017 2018 2019 2020 2021 2022 1H23 PFSI's Annualized Return on Average Common Stockholders' Equity (ROE)
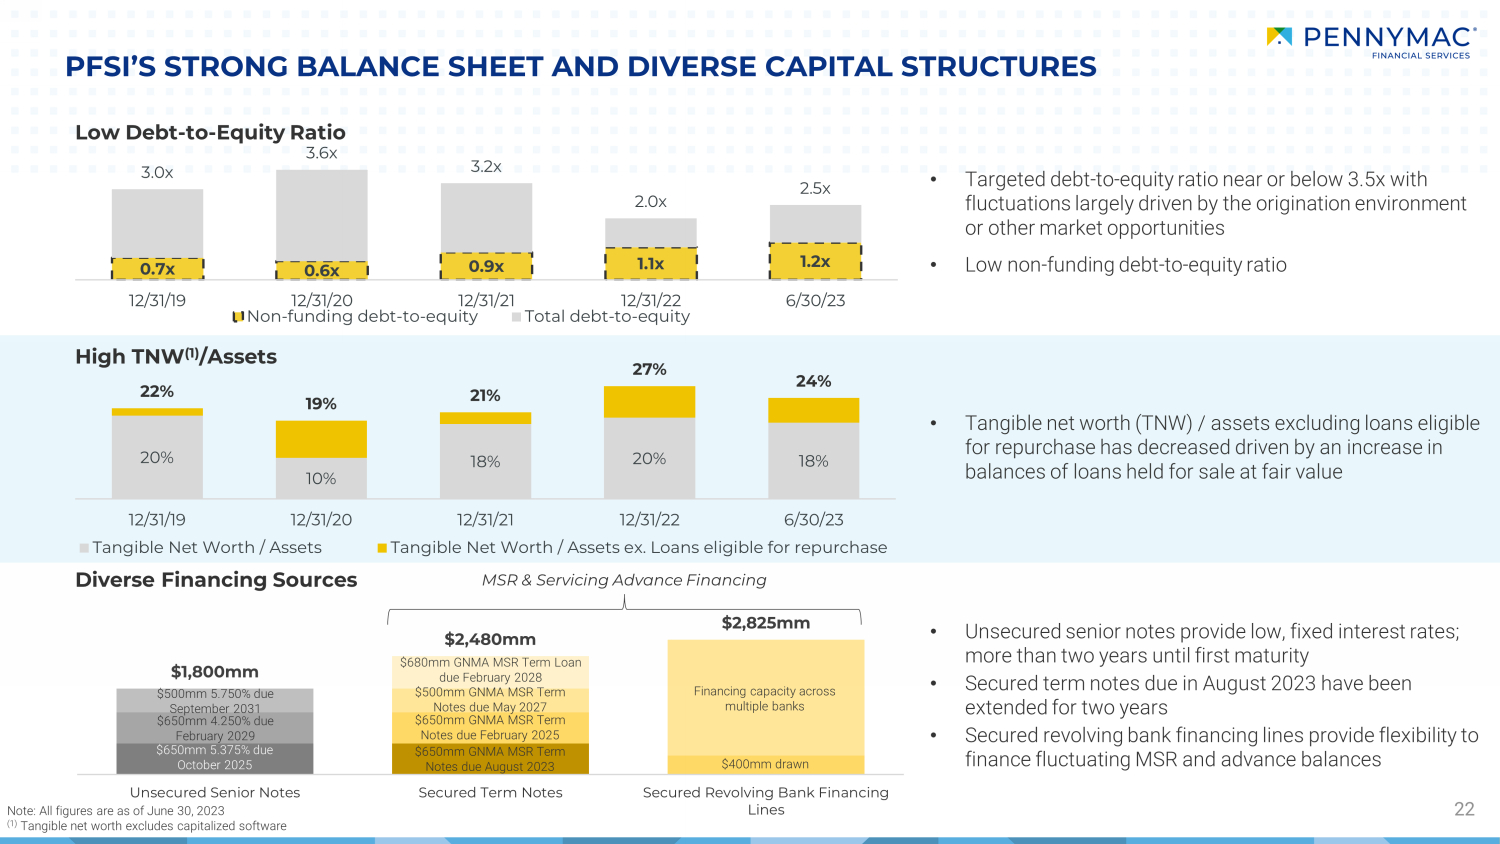
$1,800mm $2,480mm $2,825mm Unsecured Senior Notes Secured Term Notes Secured Revolving Bank Financing Lines PFSI’S STRONG BALANCE SHEET AND DIVERSE CAPITAL STRUCTURES 22 Low Debt - to - Equity Ratio Diverse Financing Sources High TNW (1) /Assets • Tangible net worth (TNW) / assets excluding loans eligible for repurchase has de creased driven by an increase in balances of loans held for sale at fair value $650mm 5.375% due October 2025 • Targeted debt - to - equity ratio near or below 3.5x with fluctuations largely driven by the origination environment or other market opportunities • Low non - funding debt - to - equity ratio • U nsecured senior notes provide low, fixed interest rates; more than two years until first maturity • Secured term notes due in August 2023 have been extended for two years • Secured revolving bank financing lines provide flexibility to finance fluctuating MSR and advance balances MSR & Servicing Advance Financing Note: All figures are as of June 30, 2023 (1) Tangible net worth excludes capitalized software $500mm 5.750% due September 2031 $650mm 4.250% due February 2029 $500mm GNMA MSR Term Notes due May 2027 $650mm GNMA MSR Term Notes due February 2025 $650mm GNMA MSR Term Notes due August 2023 $ 680 mm GNMA MSR Term Loan due February 2028 Financing capacity across multiple banks $ 400 mm drawn 0.7x 0.6x 0.9x 1.1x 1.2x 3.0x 3.6x 3.2x 2.0x 2.5x 12/31/19 12/31/20 12/31/21 12/31/22 6/30/23 Non-funding debt-to-equity Total debt-to-equity 20% 10% 18% 20% 18% 22% 19% 21% 27% 24% 12/31/19 12/31/20 12/31/21 12/31/22 6/30/23 Tangible Net Worth / Assets Tangible Net Worth / Assets ex. Loans eligible for repurchase

PENNYMAC HAS DEVELOPED IN A SUSTAINABLE MANNER FOR LONG - TERM SUCCESS 23 2008 2009 2010 2011 2012 2013 2014 2015 2016 2017 2019 2020 2021 Operations launched; de novo build of legacy - free mortgage servicer Raised $500 million of capital in private opportunity funds PMT formed in an initial public offering raising $320 million Correspondent group established with a focus on operations development and process design Added servicing leadership for prime portfolio and to drive scalable growth Correspondent system launches Expanded infrastructure with flagship operations facility in Moorpark, CA Correspondent leadership team expands Expanded infrastructure in Tampa, FL Became largest non - bank correspondent aggregator PFSI completed initial public offering Expanded infrastructure in Fort Worth, TX Continued organic growth and servicing portfolio UPB reaches $100 billion (1) PFSI stockholders’ equity surpasses $1 billion Substantial growth in PFSI’s consumer direct capacity PFSI issued MSR - backed term notes PFSI launched broker - direct lending channel PFSI completes corporate reorganization Achieved position as the largest correspondent aggregator in the U.S. PFSI launched proprietary, cloud - based Servicing Systems Environment (SSE) Record production volumes across all channels; nearly $200 billion in UPB (1) PFSI issued inaugural $650 million of unsecured Senior Notes PFSI issued an additional $1.15 billion of unsecured Senior Notes Servicing portfolio surpasses 2 million customers (1) (1) All figures are for PFSI and include volume fulfilled or subserviced for PMT • Disciplined growth to address the demands of the GSEs, Agencies, regulators and our financing partners ‒ Since inception, PennyMac has focused on building and testing processes and systems before adding significant transaction vol ume s • Highly experienced management team has created a robust corporate governance system centered on compliance, risk management a nd quality control 2023 PFSI produced double digit ROE despite a severe downturn in the mortgage market driven by a rapid and significant increase in interest rates 2022 2018 Achieved position as largest residential mortgage producer in 1Q23
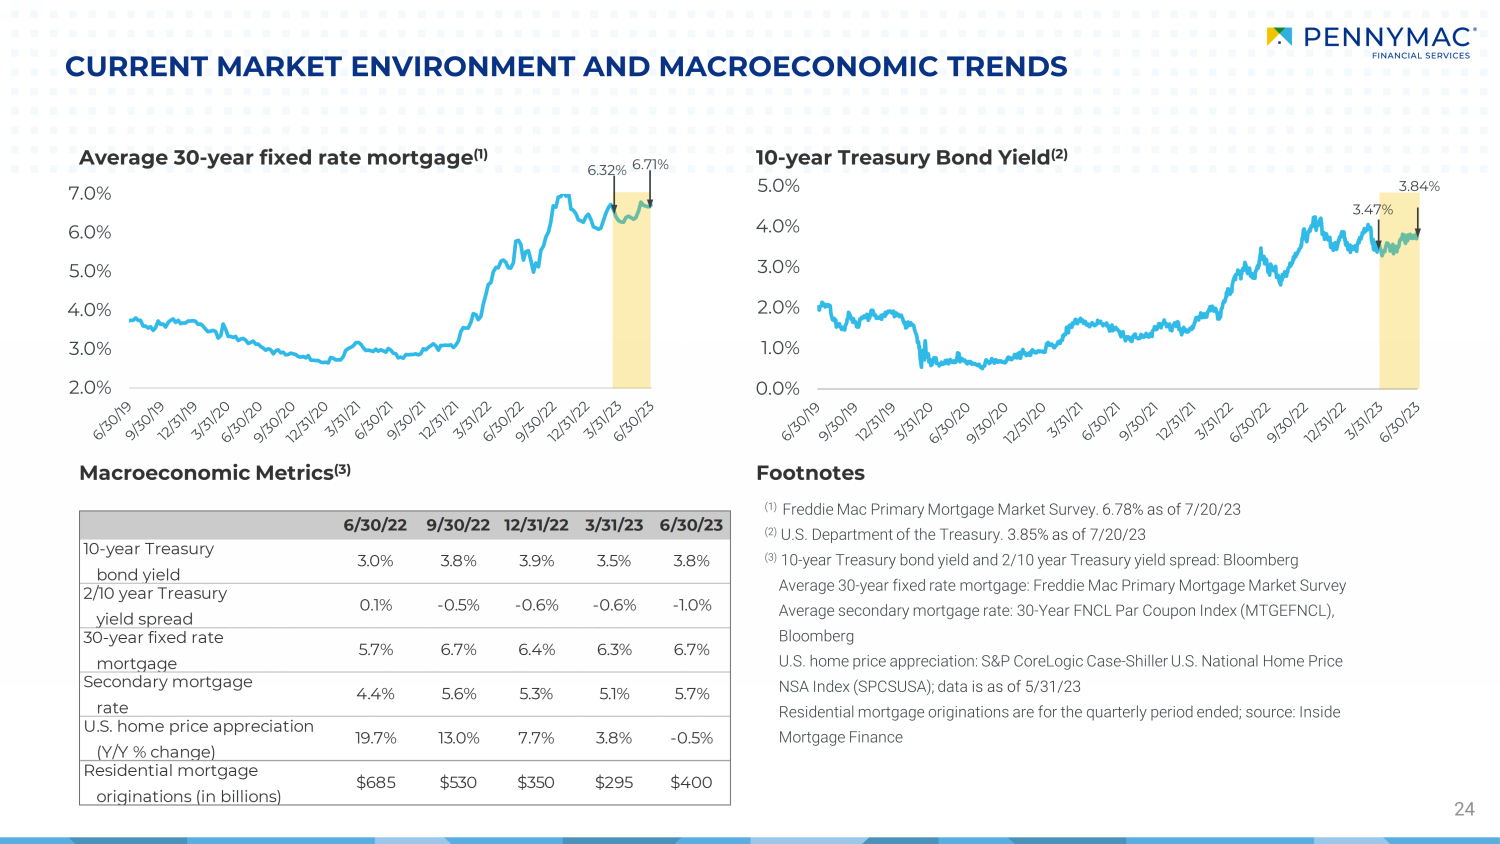
0.0% 1.0% 2.0% 3.0% 4.0% 5.0% 2.0% 3.0% 4.0% 5.0% 6.0% 7.0% Average 30 - year fixed rate mortgage (1) 6.32% 3.47% CURRENT MARKET ENVIRONMENT AND MACROECONOMIC TRENDS 24 Macroeconomic Metrics (3) Footnotes (1) Freddie Mac Primary Mortgage Market Survey . 6.78% as of 7/20/23 (2) U.S. Department of the Treasury. 3.85% as of 7/20/23 (3) 10 - year Treasury bond yield and 2/10 year Treasury yield spread: Bloomberg Average 30 - year fixed rate mortgage: Freddie Mac Primary Mortgage Market Survey Average secondary mortgage rate: 30 - Year FNCL Par Coupon Index (MTGEFNCL), Bloomberg U.S. home price appreciation: S&P CoreLogic Case - Shiller U.S. National Home Price NSA Index (SPCSUSA); data is as of 5/31/23 Residential mortgage originations are for the quarterly period ended; source: Inside Mortgage Finance 10 - year Treasury Bond Yield (2) 3.84% 6.71% 6/30/22 9/30/22 12/31/22 3/31/23 6/30/23 10-year Treasury bond yield 3.0% 3.8% 3.9% 3.5% 3.8% 2/10 year Treasury yield spread 0.1% -0.5% -0.6% -0.6% -1.0% 30-year fixed rate mortgage 5.7% 6.7% 6.4% 6.3% 6.7% Secondary mortgage rate 4.4% 5.6% 5.3% 5.1% 5.7% U.S. home price appreciation (Y/Y % change) 19.7% 13.0% 7.7% 3.8% -0.5% Residential mortgage originations (in billions) $685 $530 $350 $295 $400
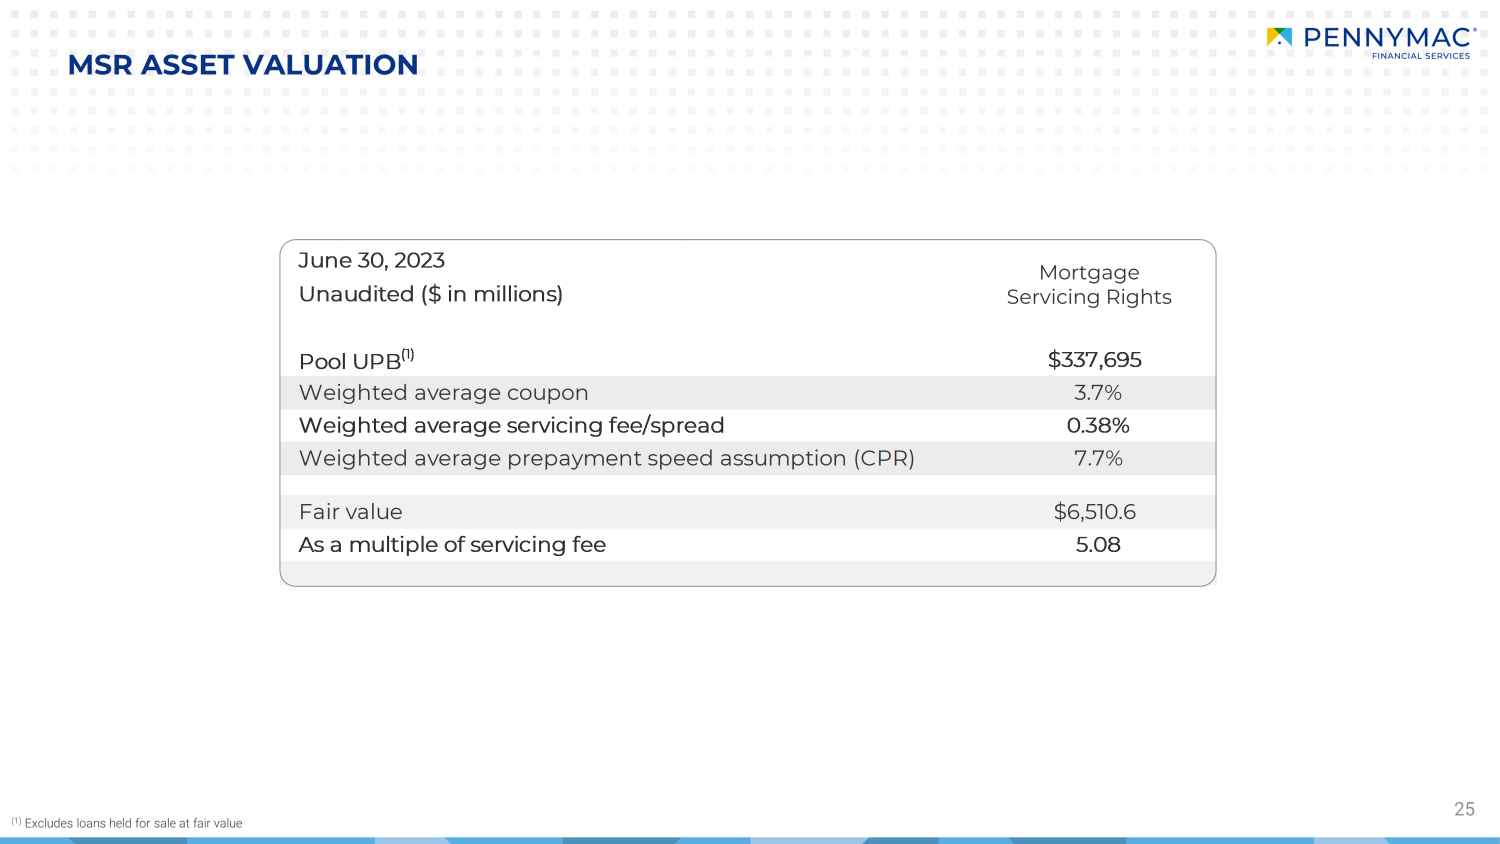
25 MSR ASSET VALUATION (1) Excludes loans held for sale at fair value Mortgage Servicing Rights Pool UPB (1) $337,695 Weighted average coupon 3.7% Weighted average servicing fee/spread 0.38% Weighted average prepayment speed assumption (CPR) 7.7% Fair value $6,510.6 As a multiple of servicing fee 5.08 June 30, 2023 Unaudited ($ in millions)
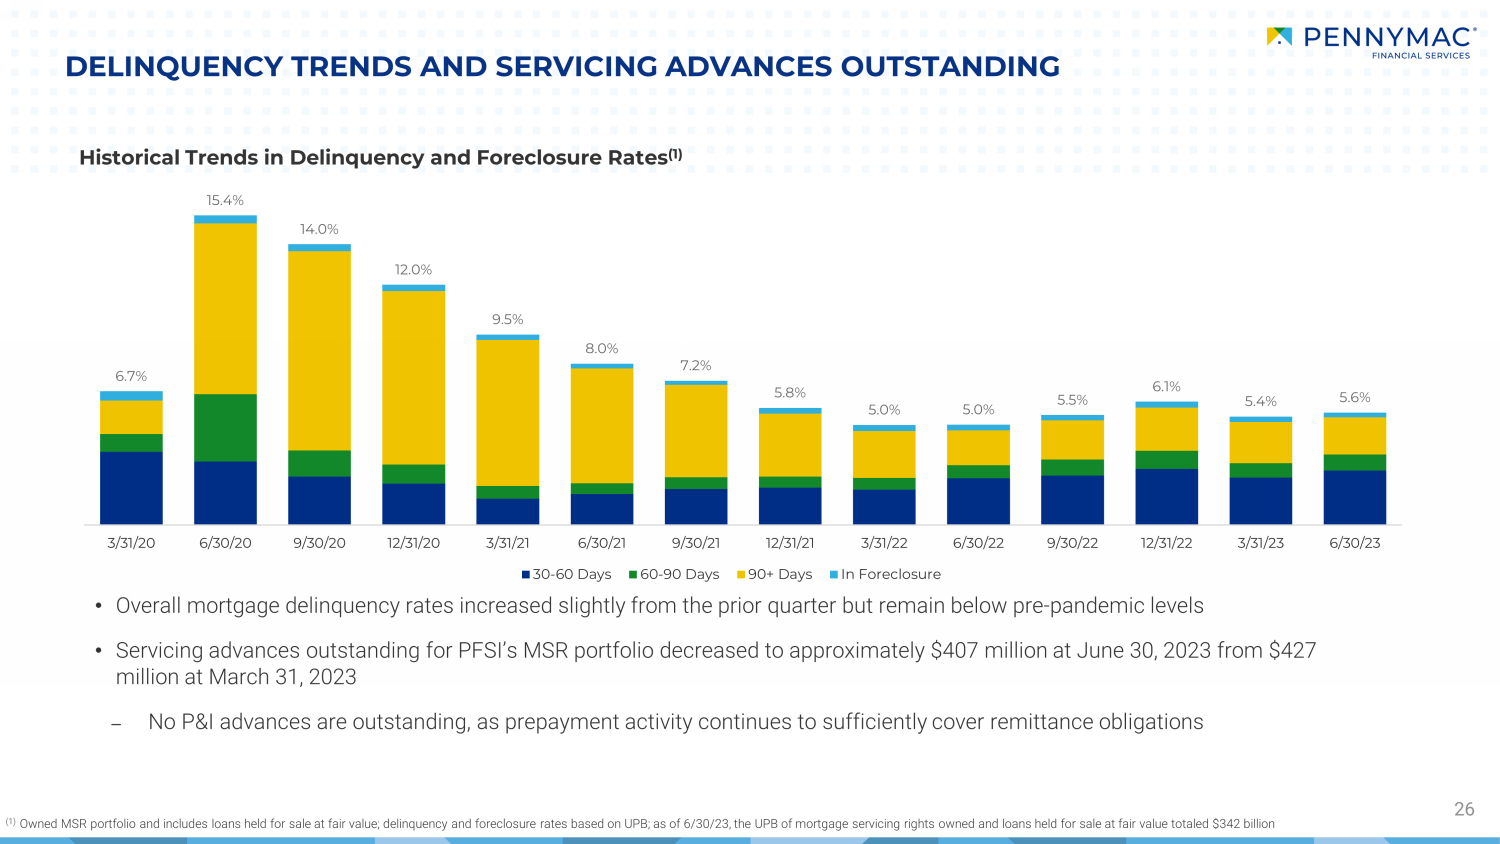
• Overall mortgage delinquency rates increased slightly from the prior quarter but remain below pre - pandemic levels • Servicing advances outstanding for PFSI’s MSR portfolio decreased to approximately $407 million at June 30, 2023 from $427 million at March 31, 2023 – No P&I advances are outstanding, as prepayment activity continues to sufficiently cover remittance obligations DELINQUENCY TRENDS AND SERVICING ADVANCES OUTSTANDING 26 Historical Trends in Delinquency and Foreclosure Rates (1) (1) Owned MSR portfolio and includes loans held for sale at fair value; delinquency and foreclosure rates based on UPB; as of 6/3 0/2 3, the UPB of mortgage servicing rights owned and loans held for sale at fair value totaled $342 billion 6.7% 15.4% 14.0% 12.0% 9.5% 8.0% 7.2% 5.8% 5.0% 5.0% 5.5% 6.1% 5.4% 5.6% 3/31/20 6/30/20 9/30/20 12/31/20 3/31/21 6/30/21 9/30/21 12/31/21 3/31/22 6/30/22 9/30/22 12/31/22 3/31/23 6/30/23 30-60 Days 60-90 Days 90+ Days In Foreclosure

27 PFSI’S OWNED MSR PORTFOLIO CHARACTERISTICS Note: Figures may not sum due to rounding (1) Government loans include loans securitized in Ginnie Mae pools as well as loans sold to private investors (2) Other represents MSRs collateralized by conventional loans sold to private investors (3) Excludes loans held for sale at fair value Segment UPB ($ in billions) (3) % of Total UPB Loan count (in thousands) Note rate Seasoning (months) Remaining maturity (months) Loan size ($ in thousands) FICO credit score at origination Original LTV Current LTV 60+ Delinquency (by UPB) Government (1) FHA $124.2 36.8% 633 3.9% 43 320 $196 675 93% 67% 4.9% VA $119.3 35.3% 439 3.4% 29 330 $272 726 90% 71% 2.0% USDA $21.2 6.3% 143 3.7% 47 316 $148 698 98% 67% 4.7% GSE FNMA $34.2 10.1% 120 3.8% 25 310 $285 760 71% 58% 0.4% FHLMC $37.8 11.2% 130 3.9% 18 319 $290 754 73% 62% 0.4% Other (2) Other $0.9 0.3% 3 4.7% 15 337 $323 766 67% 61% 0.2% Closed-End Seconds Closed-End Seconds $0.1 0.0% 1 10.0% 4 270 $73 749 16% 16% 0.0% Grand Total $337.7 100.0% 1,470 3.7% 34 322 $230 712 88% 67% 2.9%

ACQUISITIONS AND ORIGINATIONS BY PRODUCT 28 Acquisitions/Originations Note: Figures may not sum due to rounding Unaudited ($ in millions) 2Q22 3Q22 4Q22 1Q23 2Q23 Correspondent Acquisitions Conventional Conforming - for PMT 10,320$ 10,225$ 6,771$ 6,629$ 3,029$ Conventional Conforming - for PFSI - - 3,912 4,063 7,018 Government 10,649 12,161 10,081 9,461 11,139 Jumbo 3 2 - - - Total 20,973$ 22,387$ 20,764$ 20,153$ 21,186$ Broker Direct Originations Conventional Conforming 1,556$ 909$ 758$ 1,097$ 1,436$ Government 396 384 362 441 685 Jumbo 24 5 7 28 19 Total 1,976$ 1,298$ 1,126$ 1,565$ 2,140$ Consumer Direct Originations Conventional Conforming 2,246$ 1,198$ 489$ 365$ 400$ Government 1,492 1,130 572 610 1,028 Jumbo 5 2 4 1 4 Closed-end second liens - 1 45 81 122 Total 3,744$ 2,330$ 1,110$ 1,057$ 1,553$ Total acquisitions/originations 26,693$ 26,016$ 23,000$ 22,775$ 24,879$ UPB of loans fulfilled for PMT (included in correspondent acquisitions) 10,324$ 10,227$ 6,771$ 6,629$ 3,029$
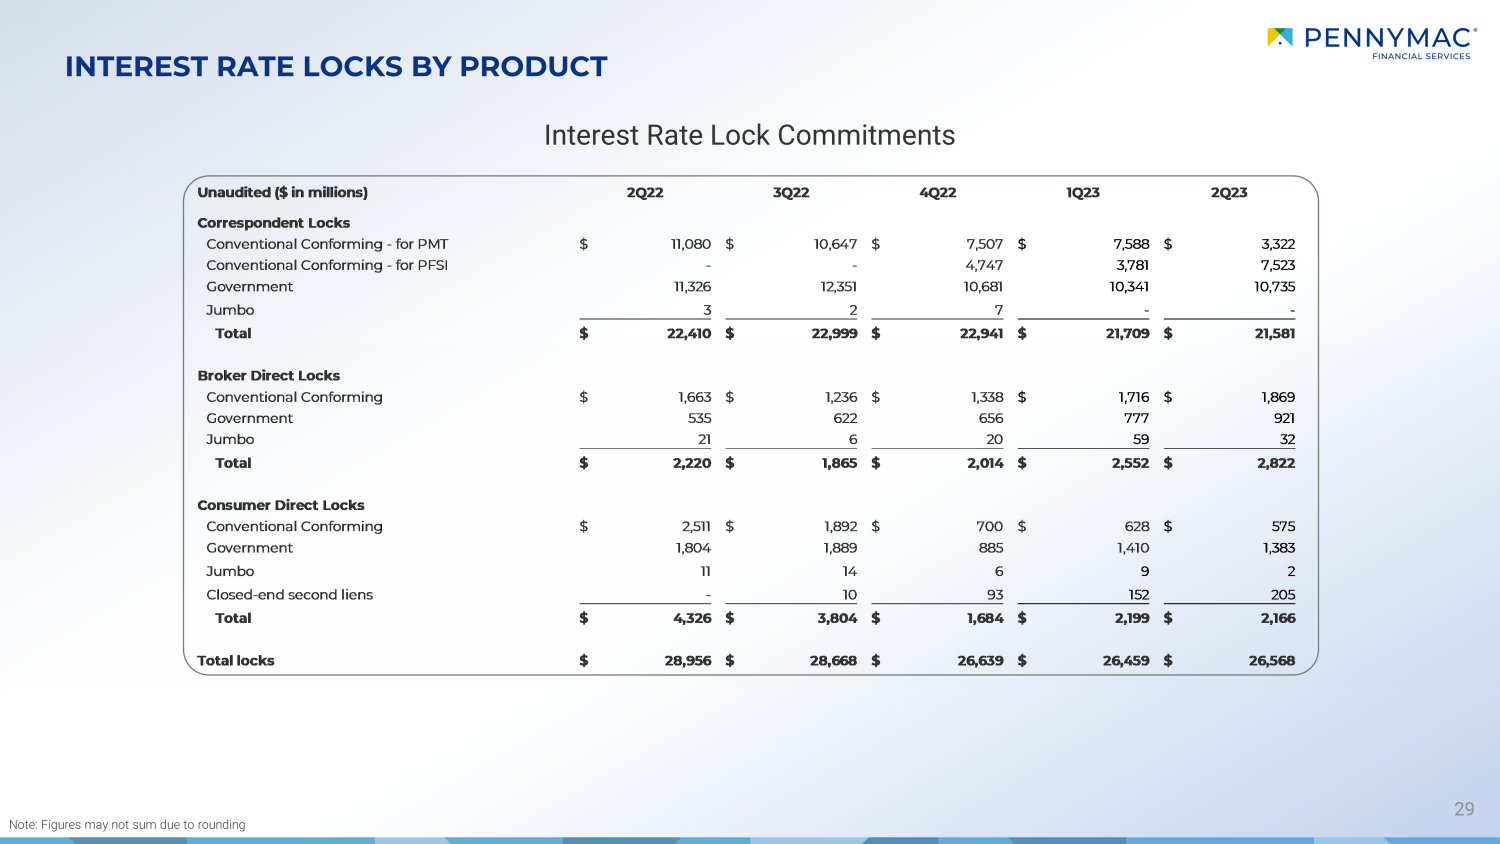
INTEREST RATE LOCKS BY PRODUCT 29 Note: Figures may not sum due to rounding Interest Rate Lock Commitments Unaudited ($ in millions) 2Q22 3Q22 4Q22 1Q23 2Q23 Correspondent Locks Conventional Conforming - for PMT 11,080$ 10,647$ 7,507$ 7,588$ 3,322$ Conventional Conforming - for PFSI - - 4,747 3,781 7,523 Government 11,326 12,351 10,681 10,341 10,735 Jumbo 3 2 7 - - Total 22,410$ 22,999$ 22,941$ 21,709$ 21,581$ Broker Direct Locks Conventional Conforming 1,663$ 1,236$ 1,338$ 1,716$ 1,869$ Government 535 622 656 777 921 Jumbo 21 6 20 59 32 Total 2,220$ 1,865$ 2,014$ 2,552$ 2,822$ Consumer Direct Locks Conventional Conforming 2,511$ 1,892$ 700$ 628$ 575$ Government 1,804 1,889 885 1,410 1,383 Jumbo 11 14 6 9 2 Closed-end second liens - 10 93 152 205 Total 4,326$ 3,804$ 1,684$ 2,199$ 2,166$ Total locks 28,956$ 28,668$ 26,639$ 26,459$ 26,568$
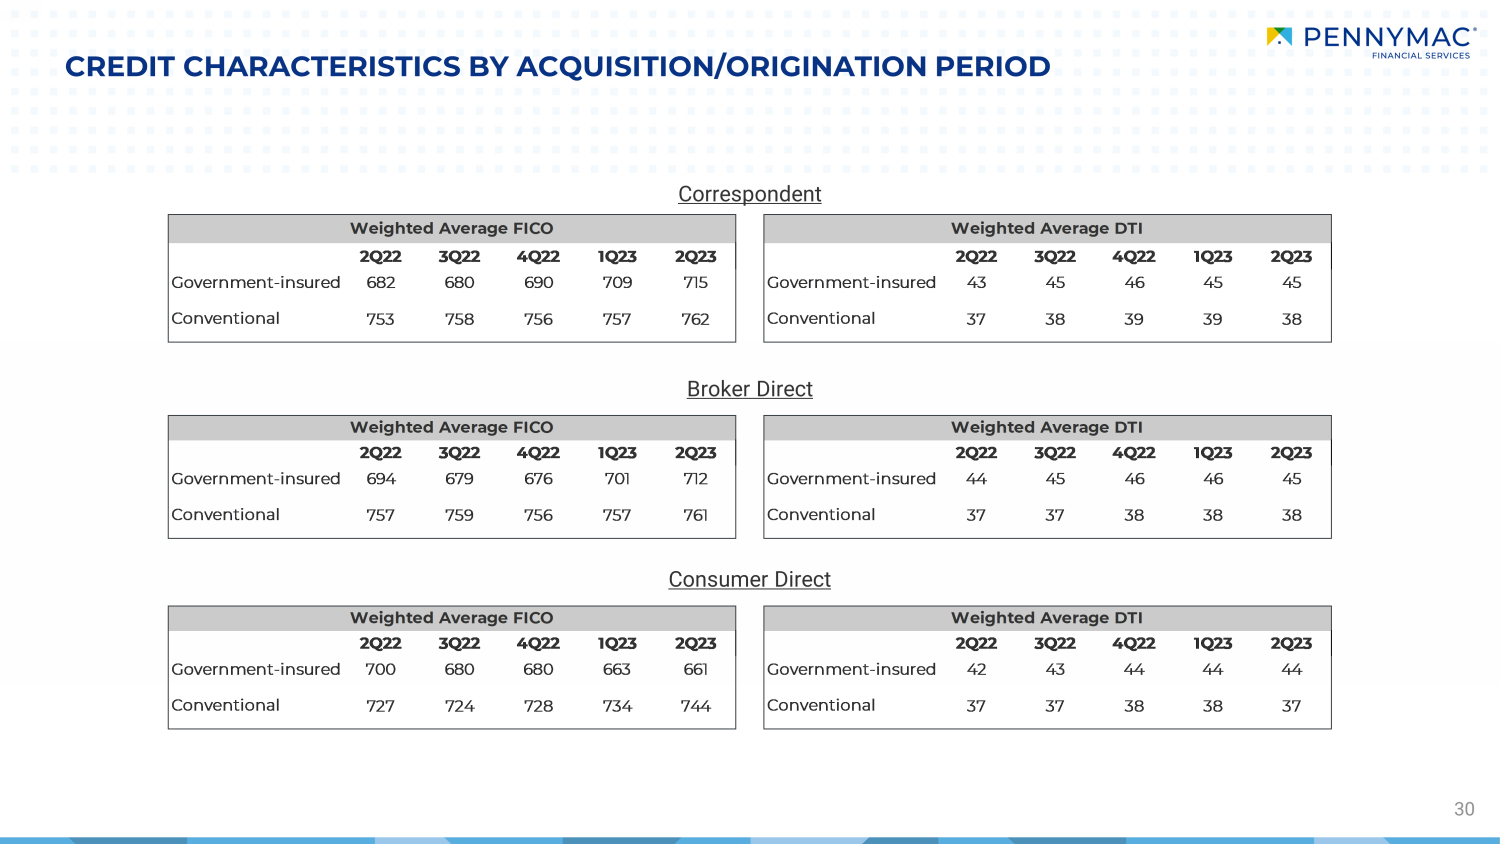
CREDIT CHARACTERISTICS BY ACQUISITION/ORIGINATION PERIOD 30 Correspondent Broker Direct Consumer Direct 2Q22 3Q22 4Q22 1Q23 2Q23 2Q22 3Q22 4Q22 1Q23 2Q23 Government-insured 682 680 690 709 715 Government-insured 43 45 46 45 45 Conventional 753 758 756 757 762 Conventional 37 38 39 39 38 2Q22 3Q22 4Q22 1Q23 2Q23 2Q22 3Q22 4Q22 1Q23 2Q23 Government-insured 694 679 676 701 712 Government-insured 44 45 46 46 45 Conventional 757 759 756 757 761 Conventional 37 37 38 38 38 2Q22 3Q22 4Q22 1Q23 2Q23 2Q22 3Q22 4Q22 1Q23 2Q23 Government-insured 700 680 680 663 661 Government-insured 42 43 44 44 44 Conventional 727 724 728 734 744 Conventional 37 37 38 38 37 Weighted Average FICO Weighted Average DTI Weighted Average FICO Weighted Average DTI Weighted Average FICO Weighted Average DTI
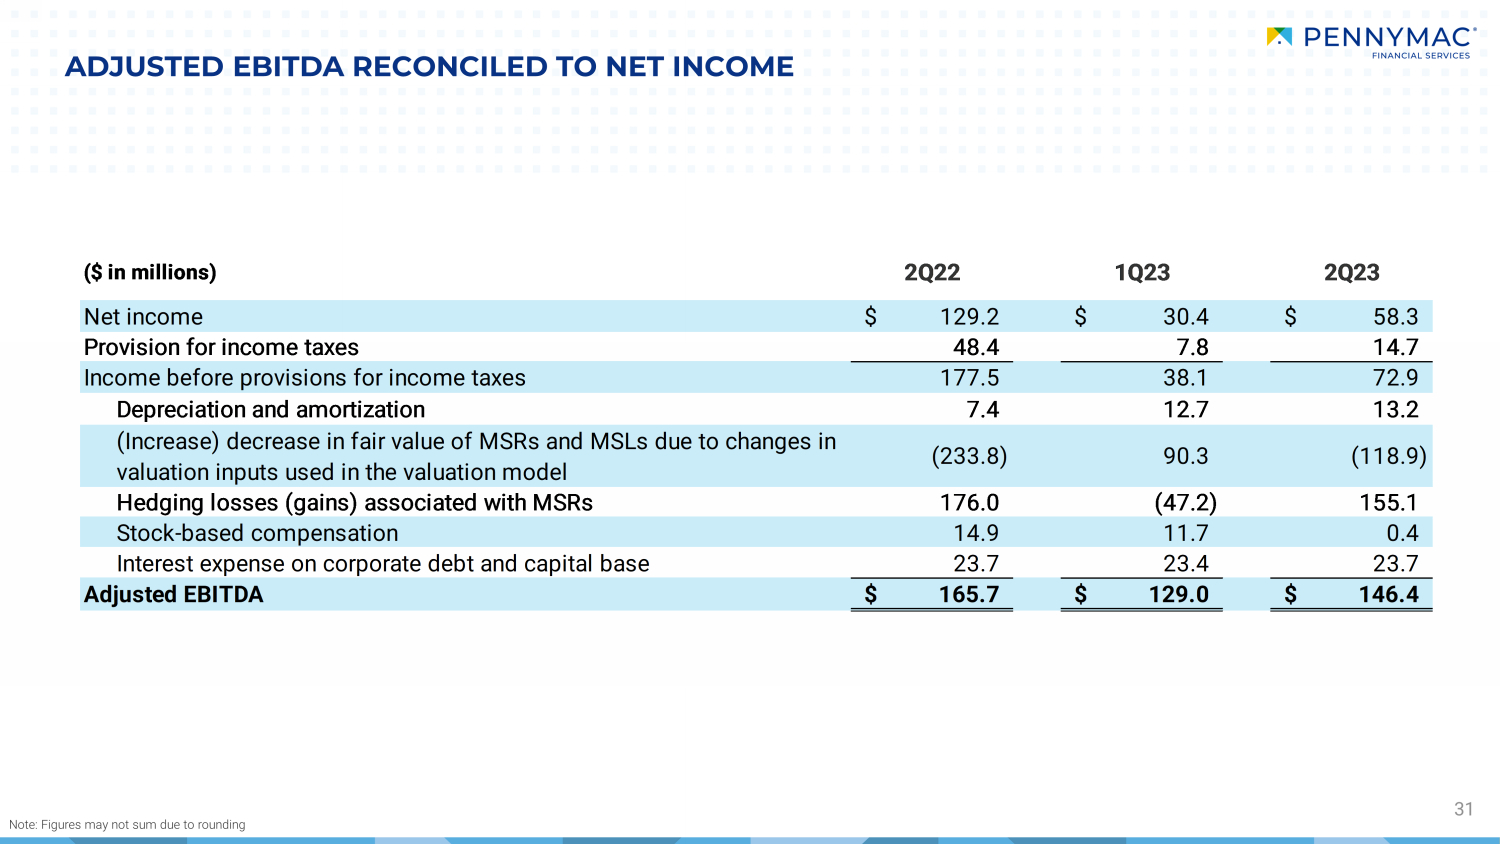
ADJUSTED EBITDA RECONCILED TO NET INCOME 31 ($ in millions) 2Q22 1Q23 2Q23 Net income 129.2$ 30.4$ 58.3$ Provision for income taxes 48.4 7.8 14.7 Income before provisions for income taxes 177.5 38.1 72.9 Depreciation and amortization 7.4 12.7 13.2 (Increase) decrease in fair value of MSRs and MSLs due to changes in valuation inputs used in the valuation model (233.8) 90.3 (118.9) Hedging losses (gains) associated with MSRs 176.0 (47.2) 155.1 Stock-based compensation 14.9 11.7 0.4 Interest expense on corporate debt and capital base 23.7 23.4 23.7 Adjusted EBITDA 165.7$ 129.0$ 146.4$ Note: Figures may not sum due to rounding

v3.23.2
| X |
- DefinitionBoolean flag that is true when the XBRL content amends previously-filed or accepted submission.
| Name: |
dei_AmendmentFlag |
| Namespace Prefix: |
dei_ |
| Data Type: |
xbrli:booleanItemType |
| Balance Type: |
na |
| Period Type: |
duration |
|
| X |
- DefinitionFor the EDGAR submission types of Form 8-K: the date of the report, the date of the earliest event reported; for the EDGAR submission types of Form N-1A: the filing date; for all other submission types: the end of the reporting or transition period. The format of the date is YYYY-MM-DD.
| Name: |
dei_DocumentPeriodEndDate |
| Namespace Prefix: |
dei_ |
| Data Type: |
xbrli:dateItemType |
| Balance Type: |
na |
| Period Type: |
duration |
|
| X |
- DefinitionThe type of document being provided (such as 10-K, 10-Q, 485BPOS, etc). The document type is limited to the same value as the supporting SEC submission type, or the word 'Other'.
| Name: |
dei_DocumentType |
| Namespace Prefix: |
dei_ |
| Data Type: |
dei:submissionTypeItemType |
| Balance Type: |
na |
| Period Type: |
duration |
|
| X |
- DefinitionAddress Line 1 such as Attn, Building Name, Street Name
| Name: |
dei_EntityAddressAddressLine1 |
| Namespace Prefix: |
dei_ |
| Data Type: |
xbrli:normalizedStringItemType |
| Balance Type: |
na |
| Period Type: |
duration |
|
| X |
- Definition
+ References
+ Details
| Name: |
dei_EntityAddressCityOrTown |
| Namespace Prefix: |
dei_ |
| Data Type: |
xbrli:normalizedStringItemType |
| Balance Type: |
na |
| Period Type: |
duration |
|
| X |
- DefinitionCode for the postal or zip code
| Name: |
dei_EntityAddressPostalZipCode |
| Namespace Prefix: |
dei_ |
| Data Type: |
xbrli:normalizedStringItemType |
| Balance Type: |
na |
| Period Type: |
duration |
|
| X |
- DefinitionName of the state or province.
| Name: |
dei_EntityAddressStateOrProvince |
| Namespace Prefix: |
dei_ |
| Data Type: |
dei:stateOrProvinceItemType |
| Balance Type: |
na |
| Period Type: |
duration |
|
| X |
- DefinitionA unique 10-digit SEC-issued value to identify entities that have filed disclosures with the SEC. It is commonly abbreviated as CIK. Reference 1: http://www.xbrl.org/2003/role/presentationRef
-Publisher SEC
-Name Exchange Act
-Number 240
-Section 12
-Subsection b-2
| Name: |
dei_EntityCentralIndexKey |
| Namespace Prefix: |
dei_ |
| Data Type: |
dei:centralIndexKeyItemType |
| Balance Type: |
na |
| Period Type: |
duration |
|
| X |
- DefinitionIndicate if registrant meets the emerging growth company criteria. Reference 1: http://www.xbrl.org/2003/role/presentationRef
-Publisher SEC
-Name Exchange Act
-Number 240
-Section 12
-Subsection b-2
| Name: |
dei_EntityEmergingGrowthCompany |
| Namespace Prefix: |
dei_ |
| Data Type: |
xbrli:booleanItemType |
| Balance Type: |
na |
| Period Type: |
duration |
|
| X |
- DefinitionCommission file number. The field allows up to 17 characters. The prefix may contain 1-3 digits, the sequence number may contain 1-8 digits, the optional suffix may contain 1-4 characters, and the fields are separated with a hyphen.
| Name: |
dei_EntityFileNumber |
| Namespace Prefix: |
dei_ |
| Data Type: |
dei:fileNumberItemType |
| Balance Type: |
na |
| Period Type: |
duration |
|
| X |
- DefinitionTwo-character EDGAR code representing the state or country of incorporation.
| Name: |
dei_EntityIncorporationStateCountryCode |
| Namespace Prefix: |
dei_ |
| Data Type: |
dei:edgarStateCountryItemType |
| Balance Type: |
na |
| Period Type: |
duration |
|
| X |
- DefinitionThe exact name of the entity filing the report as specified in its charter, which is required by forms filed with the SEC. Reference 1: http://www.xbrl.org/2003/role/presentationRef
-Publisher SEC
-Name Exchange Act
-Number 240
-Section 12
-Subsection b-2
| Name: |
dei_EntityRegistrantName |
| Namespace Prefix: |
dei_ |
| Data Type: |
xbrli:normalizedStringItemType |
| Balance Type: |
na |
| Period Type: |
duration |
|
| X |
- DefinitionThe Tax Identification Number (TIN), also known as an Employer Identification Number (EIN), is a unique 9-digit value assigned by the IRS. Reference 1: http://www.xbrl.org/2003/role/presentationRef
-Publisher SEC
-Name Exchange Act
-Number 240
-Section 12
-Subsection b-2
| Name: |
dei_EntityTaxIdentificationNumber |
| Namespace Prefix: |
dei_ |
| Data Type: |
dei:employerIdItemType |
| Balance Type: |
na |
| Period Type: |
duration |
|
| X |
- DefinitionLocal phone number for entity.
| Name: |
dei_LocalPhoneNumber |
| Namespace Prefix: |
dei_ |
| Data Type: |
xbrli:normalizedStringItemType |
| Balance Type: |
na |
| Period Type: |
duration |
|
| X |
- DefinitionBoolean flag that is true when the Form 8-K filing is intended to satisfy the filing obligation of the registrant as pre-commencement communications pursuant to Rule 13e-4(c) under the Exchange Act. Reference 1: http://www.xbrl.org/2003/role/presentationRef
-Publisher SEC
-Name Exchange Act
-Number 240
-Section 13e
-Subsection 4c
| Name: |
dei_PreCommencementIssuerTenderOffer |
| Namespace Prefix: |
dei_ |
| Data Type: |
xbrli:booleanItemType |
| Balance Type: |
na |
| Period Type: |
duration |
|
| X |
- DefinitionBoolean flag that is true when the Form 8-K filing is intended to satisfy the filing obligation of the registrant as pre-commencement communications pursuant to Rule 14d-2(b) under the Exchange Act. Reference 1: http://www.xbrl.org/2003/role/presentationRef
-Publisher SEC
-Name Exchange Act
-Number 240
-Section 14d
-Subsection 2b
| Name: |
dei_PreCommencementTenderOffer |
| Namespace Prefix: |
dei_ |
| Data Type: |
xbrli:booleanItemType |
| Balance Type: |
na |
| Period Type: |
duration |
|
| X |
- DefinitionTitle of a 12(b) registered security. Reference 1: http://www.xbrl.org/2003/role/presentationRef
-Publisher SEC
-Name Exchange Act
-Number 240
-Section 12
-Subsection b
| Name: |
dei_Security12bTitle |
| Namespace Prefix: |
dei_ |
| Data Type: |
dei:securityTitleItemType |
| Balance Type: |
na |
| Period Type: |
duration |
|
| X |
- DefinitionName of the Exchange on which a security is registered. Reference 1: http://www.xbrl.org/2003/role/presentationRef
-Publisher SEC
-Name Exchange Act
-Number 240
-Section 12
-Subsection d1-1
| Name: |
dei_SecurityExchangeName |
| Namespace Prefix: |
dei_ |
| Data Type: |
dei:edgarExchangeCodeItemType |
| Balance Type: |
na |
| Period Type: |
duration |
|
| X |
- DefinitionBoolean flag that is true when the Form 8-K filing is intended to satisfy the filing obligation of the registrant as soliciting material pursuant to Rule 14a-12 under the Exchange Act. Reference 1: http://www.xbrl.org/2003/role/presentationRef
-Publisher SEC
-Name Exchange Act
-Section 14a
-Number 240
-Subsection 12
| Name: |
dei_SolicitingMaterial |
| Namespace Prefix: |
dei_ |
| Data Type: |
xbrli:booleanItemType |
| Balance Type: |
na |
| Period Type: |
duration |
|
| X |
- DefinitionTrading symbol of an instrument as listed on an exchange.
| Name: |
dei_TradingSymbol |
| Namespace Prefix: |
dei_ |
| Data Type: |
dei:tradingSymbolItemType |
| Balance Type: |
na |
| Period Type: |
duration |
|
| X |
- DefinitionBoolean flag that is true when the Form 8-K filing is intended to satisfy the filing obligation of the registrant as written communications pursuant to Rule 425 under the Securities Act. Reference 1: http://www.xbrl.org/2003/role/presentationRef
-Publisher SEC
-Name Securities Act
-Number 230
-Section 425
| Name: |
dei_WrittenCommunications |
| Namespace Prefix: |
dei_ |
| Data Type: |
xbrli:booleanItemType |
| Balance Type: |
na |
| Period Type: |
duration |
|
PennyMac Financial Servi... (NYSE:PFSI)
과거 데이터 주식 차트
부터 4월(4) 2024 으로 5월(5) 2024

PennyMac Financial Servi... (NYSE:PFSI)
과거 데이터 주식 차트
부터 5월(5) 2023 으로 5월(5) 2024
