0001059556false00010595562025-02-132025-02-130001059556us-gaap:CommonStockMember2025-02-132025-02-130001059556mco:TwoThousandAndFifteenSeniorNotesDueTwoThousandAndTwentySevenMember2025-02-132025-02-130001059556mco:A950SeniorNotesDueTwoThousandAndThirtyMember2025-02-132025-02-13
UNITED STATES
SECURITIES AND EXCHANGE COMMISSION
Washington, DC 20549
__________
FORM 8-K
CURRENT REPORT
PURSUANT TO SECTION 13 OR 15(d) OF
THE SECURITIES EXCHANGE ACT OF 1934
Date of Report (Date of earliest event reported): February 13, 2025
MOODY’S CORPORATION
(Exact Name of Registrant as Specified in Charter)
| | | | | | | | |
| Delaware | 1-14037 | 13-3998945 |
| (State or Other Jurisdiction of Incorporation) | (Commission File Number) | (IRS Employer Identification No.) |
7 World Trade Center at 250 Greenwich Street
New York, New York 10007
(Address of Principal Executive Offices) (Zip Code)
Registrant’s telephone number, including area code: (212) 553-0300
Check the appropriate box below if the Form 8-K filing is intended to simultaneously satisfy the filing obligation of the registrant under any of the following provisions:
| | | | | | | | |
| ☐ | | Written communications pursuant to Rule 425 under the Securities Act (17 CFR 230.425) |
| | |
| ☐ | | Soliciting material pursuant to Rule 14a-12 under the Exchange Act (17 CFR 240.14a-12) |
| | |
| ☐ | | Pre-commencement communications pursuant to Rule 14d-2(b) under the Exchange Act (17 CFR 240.14d-2(b)) |
| | |
| ☐ | | Pre-commencement communications pursuant to Rule 13e-4(c) under the Exchange Act (17 CFR 240.13e-4(c)) |
Securities registered pursuant to Section 12(b) of the Act:
| | | | | | | | | | | | | | |
| Title of each class | | Trading Symbol(s) | | Name of each exchange on which registered |
| Common Stock, par value $0.01 per share | | MCO | | New York Stock Exchange |
| 1.75% Senior Notes Due 2027 | | MCO 27 | | New York Stock Exchange |
| 0.950% Senior Notes Due 2030 | | MCO 30 | | New York Stock Exchange |
Indicate by check mark whether the registrant is an emerging growth company as defined in Rule 405 of the Securities Act of 1933 (§230.405 of this chapter) or Rule 12b-2 of the Securities Exchange Act of 1934 (§240.12b-2 of this chapter).
| | | | | |
If an emerging growth company, indicate by check mark if the registrant has elected not to use the extended transition period for complying with any new or revised financial accounting standards provided pursuant to Section 13(a) of the Exchange Act. | ☐ |
TABLE OF CONTENTS
| | | | | | | | |
ITEM 2.02 | RESULTS OF OPERATIONS AND FINANCIAL CONDITION | 3 |
| | |
| ITEM 7.01 | REGULATION FD DISCLOSURE | 3 |
| | |
| ITEM 9.01 | FINANCIAL STATEMENTS AND EXHIBITS | 3 |
| | |
| SIGNATURES | | 4 |
| | |
| EXHIBIT 99.1 | | |
Item 2.02, "Results of Operations and Financial Condition"
On February 13, 2025, Moody's Corporation (the "Registrant") announced its financial results for the fourth quarter and full year ended December 31, 2024, as well as its outlook for 2025. A copy of the press release containing the announcement is included as Exhibit 99.1.
The information contained in this Current Report, including the exhibit hereto, is being furnished and shall not be deemed "filed" for the purpose of Section 18 of the Securities Exchange Act of 1934, as amended (the “Exchange Act”) or otherwise subject to the liabilities of that Section. The information in this Current Report shall not be incorporated by reference into future filings under the Securities Act of 1933, as amended, or the Exchange Act, unless it is specifically incorporated by reference therein.
Item 7.01, "Regulation FD Disclosure"
The information set forth under Item 2.02, "Results of Operations and Financial Condition" is incorporated herein by reference.
Item 9.01, "Financial Statements and Exhibits"
(d) Exhibits
| | | | | |
| |
| |
| 104 | The cover page from this Current Report on Form 8-K, formatted in Inline XBRL. |
SIGNATURES
Pursuant to the requirements of the Securities Exchange Act of 1934, the Registrant has duly caused this report to be signed on its behalf by the undersigned hereunto duly authorized.
| | | | | |
| MOODY'S CORPORATION |
| |
| By: | /s/ Elizabeth M. McCarroll |
| Elizabeth M. McCarroll |
| Corporate Secretary and Associate General Counsel |
Date: February 13, 2025
MOODY'S CORPORATION REPORTS RESULTS FOR FOURTH QUARTER AND FULL YEAR 2024; SETS OUTLOOK FOR 2025
NEW YORK, NY - February 13, 2025 - Moody's Corporation (NYSE: MCO) today announced results for the fourth quarter and full year 2024, provided its outlook for full year 2025 and updated medium-term guidance2.
| | | | | | | | | | | | | | |
FOURTH QUARTER AND FULL YEAR SUMMARY FINANCIALS |
| | | | |
Moody’s Corporation
(MCO) Revenue | | Moody’s Analytics
(MA) Revenue | | Moody’s Investors Service
(MIS) Revenue |
4Q 2024 | | 4Q 2024 | | 4Q 2024 |
$1.7 billion ⇑ 13% | | $863 million ⇑ 8% | | $809 million ⇑ 18% |
| FY 2024 | | FY 2024 | | FY 2024 |
$7.1 billion ⇑ 20% | | $3.3 billion ⇑ 8% | | $3.8 billion ⇑ 33% |
| | | | |
| MCO Diluted EPS | | MCO Adjusted Diluted EPS1 | | MCO FY 2025 Projected2 |
4Q 2024 | | 4Q 2024 | | Diluted EPS |
$2.17 ⇑ 17% | | $2.62 ⇑ 20% | | $12.75 to $13.25 |
| FY 2024 | | FY 2024 | | Adjusted Diluted EPS1 |
$11.26 ⇑ 29% | | $12.47 ⇑ 26% | | $14.00 to $14.50 |
| | | | |
| | | | |
| | | | |
| | | | |
| | | | | |
“Moody’s delivered a strong finish in Q4, capping a year of incredible achievements with full year revenue growth of 20%. We sit at the intersection of deep currents that are transforming the way companies do business and markets function. The investments we’ve made in our platform, data and product innovation, paired with disciplined execution, put us in a position to capitalize on these durable demand drivers for both businesses.” |
Rob Fauber
President and Chief Executive Officer |
|
“We delivered exceptional results in 2024. MIS transactional revenue grew 54%, outpacing issuance growth of 42% with our world-class analysts rating over $6 trillion of debt. MA achieved 9% ARR growth on strong demand for our workflow solutions. For 2025, we are forecasting MCO revenue growth in the high-single-digit percent range and Adjusted Diluted EPS1 in the range of $14.00 to $14.50, growing low-to-mid-teens on the back of 26% growth in full year 2024. Heading into the third year of our medium-term targets, we have assessed our performance and are excited to provide an update, including a raise of our Adjusted Diluted EPS growth rate to a range of low-to-mid-teens percent.”2,3 |
Noémie Heuland
Chief Financial Officer |
| | | | | |
1 Refer to the tables at the end of this press release for reconciliations of adjusted measures to U.S. GAAP. 2 Guidance as of February 13, 2025. Refer to Table 12 - “2025 Outlook” for table of all items for which the Company provides guidance and page 10 for disclosure regarding the assumptions used by the Company with respect to its guidance. Medium-term targets refer to a time period within 5 years from the base year 2022. Growth refers to the average annualized growth over the period. 3 Moody’s does not provide medium-term diluted EPS on a U.S. GAAP basis because the items that the Company excludes to derive Adjusted Diluted EPS cannot be reasonably predicted or assumed, for example the amount of amortization associated with acquired intangible assets from future M&A activity. Accordingly, the Company does not forecast these items over the medium-term. The occurrence, timing and amount of any of the items excluded from net income to derive Adjusted Diluted EPS could significantly impact the Company’s medium-term U.S. GAAP results. |
| | |
| Moody’s Corporation (MCO) |
| | | | | | | | |
Fourth Quarter 2024 | | Full Year 2024 |
•Revenue increased 13% from the prior-year period. •Foreign currency translation had an immaterial impact on MCO revenue. | | •Revenue increased 20% from the prior-year period. •Foreign currency translation had an immaterial impact on MCO revenue. |


| | | | | | | | |
Fourth Quarter 2024 | | Full Year 2024 |
•Revenue grew 8% versus the prior-year period, driven by 11% growth in Decision Solutions with notable contributions from Banking (11%), Insurance (9%) and Know Your Customer (15%). •Recurring revenue, comprising 95% of total MA revenue, grew 10%. Recurring revenue growth was led by Decision Solutions. •Recurring revenue for Banking increased 16%, while both Insurance and KYC recurring revenue increased 14%. •Transaction revenue, most prominent in Banking, declined by 13%. •Foreign currency translation had an immaterial impact on MA revenue. | | •Revenue grew 8% versus the prior-year period. •Recurring revenue grew 9% and transaction revenue declined 14%. •ARR4 of $3.3 billion increased by $282 million or 9% from $3.0 billion as of December 31, 2023. •Decision Solutions ARR4 grew 12%, including 9% in Banking, 12% in Insurance and 17% in KYC. Research & Insights and Data & Information grew 6% and 8%, respectively. •Foreign currency translation had an immaterial impact on MA revenue. |
| | | | | |
4 Refer to Table 10 at the end of this press release for the definition of and further information on the Annualized Recurring Revenue (ARR) metric. |
| | |
| Moody’s Investors Service (MIS) |


| | | | | | | | | | |
Fourth Quarter 2024 | | Full Year 2024 | | |
•Revenue increased 18% compared to the prior-year period, achieving the second highest fourth quarter on record and reaching the highest fourth quarter issuance in decades. •Transactional revenue grew 29% from the prior-year period, reflecting continued activity across all lines of business. •Revenue growth within Corporate Finance is primarily attributed to leveraged finance issuance, with a significant contribution from repricing activity in bank loans. •Financial Institutions growth was underpinned by continued strength in infrequent issuer activity in the Banking and Insurance sectors. •Structured Finance revenue growth was driven by the strongest quarter for rated CLOs since 2021, and heightened CMBS issuance. •Foreign currency translation unfavorably impacted MIS revenue by 1%. | | •Revenue increased 33% compared to the prior-year period. •Market conditions remained favorable throughout the year, with tight spreads, declining interest rates and strong investor demand. •Within Corporate Finance, leveraged finance issuance was the main driver of growth due to elevated refinancing, repricing and improving M&A activity. •Revenue increase in Financial Institutions was driven by sustained activity from infrequent Banking and Insurance issuers. •Structured Finance revenue growth benefitted from CLO issuance, particularly from refinancing and a recovery in the CMBS market. •Foreign currency translation had an immaterial impact on MIS revenue. | | |
| | |
| OPERATING EXPENSES AND MARGIN |


| | | | | | | | |
Full Year 2024 | | Full Year 2025 Forecast2 |
•Operating expenses grew 11% compared to the prior-year period. The increase included 5% from investments and operational costs (which included a charge related to a previously disclosed regulatory matter) and 4% related to higher incentive and stock-based compensation. Foreign currency translation had an immaterial impact on operating expenses. •Recorded $45 million in charges related to the Strategic and Operational Efficiency Restructuring Program. This program aims to realign the business toward high priority growth areas and to consolidate certain functions to simplify the organizational structure, with the goals of enabling efficiency and improving operating leverage. |
| •Operating expenses projected to increase in the low-to-mid-single-digit percent range in 2025. •Growth in operating expenses to be driven by higher operating growth, including annual compensation increases, ongoing organic investments and M&A, partially offset by the reset of incentive compensation accruals and savings associated with cost efficiencies. •Projecting $80 million to $100 million in restructuring charges in 2025, with cumulative charges estimated to be approximately $200 million to $250 million by the end of 2026. The program upon completion is expected to generate $250 million to $300 million in annualized savings. |
| | | | | |
5 Refer to Table 5 - “Financial Information by Segment (Unaudited)” for more information regarding the “Charges Related to Asset Abandonment” category. |
| | |
Operating Margin and Adjusted Operating Margin1 |


| | | | | | | | | | |
Fourth Quarter 2024 | | Full Year 2024 | | |
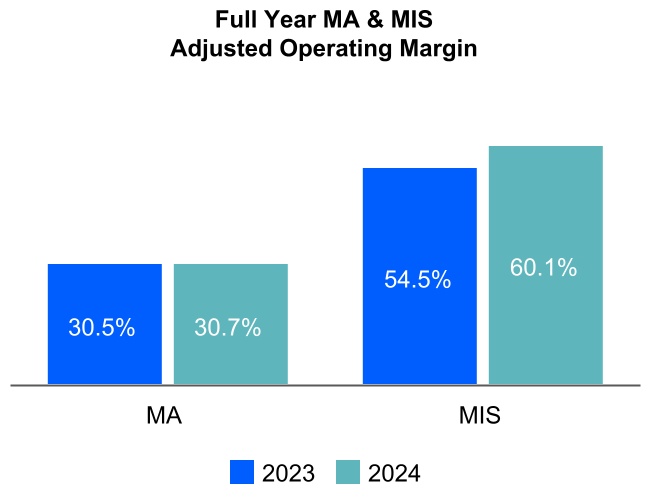
•MCO’s operating margin was 33.6%. MCO’s adjusted operating margin1 was 43.8%, up 120 basis points from the prior-year period. •MA’s adjusted operating margin rose by 240 basis points to 33.8%.This improvement demonstrates the company's successful execution of cost discipline measures, further amplified by top-line growth. •MIS’s adjusted operating margin of 51.3% reflects strong revenue growth derived from a heightened issuance environment, partially offset by higher incentive compensation. •Foreign currency translation had an immaterial impact on both operating and adjusted operating margins1. | | •MCO’s operating margin was 40.6%. MCO’s adjusted operating margin1 was 48.1%, up 420 basis points from the prior-year period. •MA’s adjusted operating margin of 30.7% reflects ongoing efforts to balance strategic investments with operational efficiency. •MIS’s adjusted operating margin increased 560 basis points to 60.1% from the prior-year period, demonstrating the operational leverage of the business and a disciplined approach to expense management. •Foreign currency translation had an immaterial impact on both operating and adjusted operating margins1. | | |
| | |
Diluted EPS and Adjusted Diluted EPS1 |
| | | | | | | | | | |
Fourth Quarter 2024 | | Full Year 2024 | | |
•Diluted EPS and Adjusted Diluted EPS1 grew 17% and 20%, respectively, from the prior-year period which primarily reflects the robust revenue performance during the quarter. •The Effective Tax Rate (ETR) of 24.8% was in line with the 24.4% from the prior-year period. | | •The increase in both Diluted EPS and Adjusted Diluted EPS1 is associated with an increase in net income supported by strong revenue growth from both segments, particularly in MIS. •The ETR was 23.7%, higher than the 16.9% reported in the prior-year period, primarily due to the favorable resolutions of uncertain tax positions within U.S. domestic and foreign tax jurisdictions in Q1 2023. | | |
| | |
| CAPITAL ALLOCATION AND LIQUIDITY |
| | |
Capital Returned to Shareholders & Free Cash Flow1 |
| | |
•Cash flow from operations was $2,838 million and free cash flow1 was $2,521 million. •The increase in both operating cash flow and free cash flow1 was primarily driven by higher net income due to strong revenue growth from both segments. •On February 12, 2025, the Board of Directors declared a regular quarterly dividend of $0.94 per share of MCO Common Stock, an 11% increase from the prior quarterly dividend of $0.85 per share. The dividend will be payable on March 14, 2025, to stockholders of record at the close of business on February 25, 2025. •During the fourth quarter of 2024, Moody’s repurchased 1.0 million shares at an average cost of $477.15 per share and issued net 0.1 million shares as part of its employee stock-based compensation programs. The net amount included shares withheld for employee payroll taxes. •As of December 31, 2024, Moody’s had 180.3 million shares outstanding, with approximately $1.6 billion of share repurchase authority remaining. There is no established expiration date for the remaining authorizations. •As of December 31, 2024, Moody's had $7.4 billion of outstanding debt and an undrawn $1.25 billion revolving credit facility. |
Moody’s updated outlook for full year 2025, as of February 13, 2025, reflects assumptions about numerous factors that could affect its business and is based on currently available information reviewed by management through, and as of, today’s date. These assumptions include, but are not limited to, the effects of current economic conditions, including the effects of interest rates, inflation, foreign currency exchange rates, capital markets’ liquidity, trade tariffs and policy and activity in different sectors of the debt markets. This outlook also reflects assumptions about global GDP growth, and the impacts resulting from changes in international conditions, including as a result of the Russia-Ukraine military conflict and the military conflict in the Middle East. Actual full year 2025 results could differ materially from Moody’s current outlook.
This outlook incorporates various specific macroeconomic assumptions, including:
| | | | | | |
| Forecasted Item | | Current Assumption |
U.S. GDP (1) growth | | 1.5% - 2.5% |
Euro area GDP (1) growth | | 0.5% - 1.5% |
Global GDP (1) growth | | 2.0% - 3.0% |
| Global policy rates | | To continue to normalize throughout 2025, including two cuts by the U.S. Fed |
| U.S. high yield spreads | | To widen to around 430 bps by year-end, below historical average of around 500 bps |
| U.S. inflation rate | | To average around 2.0% - 2.5% |
| Euro area inflation rate | | To average around 2.0% through 2025 |
| U.S. unemployment rate | | To average around 4.2% - 4.5% over the next 12 months |
| Global high yield default rate | | To decline below 3.0% in 2025 |
Global MIS rated issuance | | Increase in the low-single-digit percent range |
| GBP/USD exchange rate | | $1.25 for the full year |
| EUR/USD exchange rate | | $1.04 for the full year |
Note: All current assumptions are as of February 13, 2025. (1) GDP growth represents real GDP. |
A full summary of Moody's full year 2025 guidance as of February 13, 2025, is included in Table 12 – “2025 Outlook” at the end of this press release.
| | | | | | | | |
| Date and Time | February 13, 2025, at 11:30 a.m. Eastern Time (ET). |
| Webcast | The webcast and its replay can be accessed through Moody’s Investor Relations website, ir.moodys.com, within “Events & Presentations.” |
| Dial In | U.S. and Canada | ‘+1-888-596-4144 |
Other callers | ‘+1-646-968-2525 |
| Passcode | 515 6491 |
| Dial In Replay | A replay will be available immediately after the call on February 13, 2025 and until February 20, 2025. |
U.S. and Canada | ‘+1-800-770-2030 |
Other callers | ‘+1-609-800-9909 |
| Passcode | 515 6491 |
| | |
| ABOUT MOODY’S CORPORATION |
In a world shaped by increasingly interconnected risks, Moody’s (NYSE:MCO) data, insights, and innovative technologies help customers develop a holistic view of their world and unlock opportunities. With a rich history of experience in global markets and a diverse workforce of approximately 16,000 across more than 40 countries, Moody’s gives customers the comprehensive perspective needed to act with confidence and thrive. Learn more at moodys.com.
| | |
| “SAFE HARBOR” STATEMENT UNDER THE PRIVATE SECURITIES LITIGATION REFORM ACT OF 1995 |
Certain statements contained in this document are forward-looking statements and are based on future expectations, plans and prospects for Moody’s business and operations that involve a number of risks and uncertainties. Such statements involve estimates, projections, goals, forecasts, assumptions and uncertainties that could cause actual results or outcomes to differ materially from those contemplated, expressed, projected, anticipated or implied in the forward-looking statements. Stockholders and investors are cautioned not to place undue reliance on these forward-looking statements. The forward-looking statements and other information in this document are made as of the date hereof, and Moody’s undertakes no obligation (nor does it intend) to publicly supplement, update or revise such statements on a going-forward basis, whether as a result of subsequent developments, changed expectations or otherwise, except as required by applicable law or regulation. In connection with the “safe harbor” provisions of the Private Securities Litigation Reform Act of 1995, Moody’s is identifying certain factors that could cause actual results to differ, perhaps materially, from those indicated by these forward-looking statements. These factors, risks and uncertainties include, but are not limited to: the impact of general economic conditions (including significant government debt and deficit levels, and inflation and related monetary policy actions by governments in response to inflation) on worldwide credit markets and on economic activity, including on the volume of mergers and acquisitions, and their effects on the volume of debt and other securities issued in domestic and/or global capital markets; the uncertain effectiveness and possible collateral consequences of U.S. and foreign government initiatives and monetary policy to respond to the current economic climate, including instability of financial institutions, credit quality concerns, and other potential impacts of volatility in financial and credit markets; the global impacts of the Russia - Ukraine military conflict and the military conflict in the Middle East on volatility in world financial markets, on general economic conditions and GDP in the U.S. and worldwide, on global relations and on the Company's own operations and personnel; other matters that could affect the volume of debt and other securities issued in domestic and/or global capital markets, including regulation, increased utilization of technologies that have the potential to intensify competition and accelerate disruption and disintermediation in the financial services industry, as well as the number of issuances of securities without ratings or securities which are rated or evaluated by non-traditional parties; the level of merger and acquisition activity in the U.S. and abroad; the uncertain effectiveness and possible collateral consequences of U.S. and foreign government actions affecting credit markets, international trade and economic policy, including those related to tariffs, tax agreements and trade barriers; the impact of MIS’s withdrawal of its credit ratings on countries or entities within countries and of Moody’s no longer conducting commercial operations in countries where political instability warrants such actions; concerns in the marketplace affecting our credibility or otherwise affecting market perceptions of the integrity or utility of independent credit agency ratings; the introduction or development of competing and/or emerging technologies and products; pricing pressure from competitors and/or customers; the level of success of new product development and global expansion; the impact of regulation as an NRSRO, the potential for new U.S., state and local legislation and regulations; the potential for increased competition and regulation in the jurisdictions in which we operate, including the EU; exposure to litigation related to our rating opinions, as well as any other litigation, government and regulatory proceedings, investigations and inquiries to which Moody’s may be subject from time to time; provisions in U.S. legislation modifying the pleading standards and EU regulations modifying the liability standards applicable to credit rating agencies in a manner adverse to credit rating agencies; provisions of EU regulations imposing additional procedural and substantive requirements on the pricing of services and the expansion of supervisory remit to include non-EU ratings used for regulatory purposes; uncertainty regarding the future relationship between the U.S. and China; the possible loss of key employees and the impact of the global labor environment; failures or malfunctions of our operations and infrastructure; any vulnerabilities to cyber threats or other cybersecurity concerns; the timing and effectiveness of any restructuring programs; currency and foreign exchange volatility; the outcome of any review by tax authorities of Moody’s global tax planning initiatives; exposure to potential criminal sanctions or civil remedies if Moody’s fails to comply with foreign and U.S. laws and regulations that are applicable in the jurisdictions in which Moody’s operates, including data protection and privacy laws, sanctions laws, anti-corruption laws, and local laws prohibiting corrupt payments to government officials; the impact of mergers, acquisitions or other business combinations and the ability of Moody’s to successfully integrate acquired businesses; the level of future cash flows; the levels of capital investments; and a decline in the demand for credit risk management tools by financial institutions. These factors, risks and uncertainties as well as other risks and uncertainties that could cause Moody’s actual results to differ materially from those contemplated, expressed, projected, anticipated or implied in the forward-looking statements are described in greater detail under “Risk Factors” in Part I, Item 1A of Moody’s annual report on Form 10-K for the year ended December 31, 2023, and in other filings made by the Company from time to time with the SEC or in materials incorporated herein or therein. Stockholders and investors are cautioned that the occurrence of any of these factors, risks and uncertainties may cause the Company’s actual results to differ materially from those contemplated, expressed, projected, anticipated or implied in the forward-looking statements, which could have a material and adverse effect on the Company’s business, results of operations and financial condition. New factors may emerge from time to time, and it is not possible for the Company to predict new factors, nor can the Company assess the potential effect of any new factors on it. Forward-looking and other statements in this document may also address our corporate responsibility progress, plans, and goals (including sustainability and environmental matters), and the inclusion of such statements is not an indication that these contents are necessarily material to investors or required to be disclosed in the Company’s filings with the Securities and Exchange Commission. In addition, historical, current, and forward-looking sustainability-related statements may be based on standards for measuring progress that are still developing, internal controls and processes that continue to evolve, and assumptions that are subject to change in the future.
Table 1 - Consolidated Statements of Operations (Unaudited)
| | | | | | | | | | | | | | | | | | | | | | | |
| Three Months Ended December 31, | | Year Ended
December 31, |
| Amounts in millions, except per share amounts | 2024 | | 2023 | | 2024 | | 2023 |
| | | | | | | |
| Revenue | $ | 1,672 | | | $ | 1,480 | | | $ | 7,088 | | | $ | 5,916 | |
| | | | | | | |
| Expenses: | | | | | | | |
| Operating | 497 | | | 421 | | | 1,945 | | | 1,687 | |
Selling, general and administrative | 442 | | | 428 | | | 1,735 | | | 1,632 | |
| Depreciation and amortization | 113 | | | 97 | | | 431 | | | 373 | |
| Restructuring | 46 | | | 36 | | | 59 | | | 87 | |
| Charges related to asset abandonment | 13 | | | — | | | 43 | | | — | |
| Total expenses | 1,111 | | | 982 | | | 4,213 | | | 3,779 | |
| | | | | | | |
| Operating income | 561 | | | 498 | | | 2,875 | | | 2,137 | |
| Non-operating (expense) income, net | | | | | | | |
| Interest expense, net | (52) | | | (66) | | | (237) | | | (251) | |
Other non-operating income, net | 16 | | | 18 | | | 61 | | | 49 | |
| | | | | | | |
| Total non-operating (expense) income, net | (36) | | | (48) | | | (176) | | | (202) | |
| Income before provision for income taxes | 525 | | | 450 | | | 2,699 | | | 1,935 | |
| Provision for income taxes | 130 | | | 110 | | | 640 | | | 327 | |
| Net income | 395 | | | 340 | | | 2,059 | | | 1,608 | |
Less: Net income attributable to noncontrolling interests | — | | | — | | | 1 | | | 1 | |
Net income attributable to Moody's | $ | 395 | | | $ | 340 | | | $ | 2,058 | | | $ | 1,607 | |
| | | | | | | |
| Earnings per share attributable to Moody's common shareholders |
| Basic | $ | 2.18 | | | $ | 1.86 | | | $ | 11.32 | | | $ | 8.77 | |
| Diluted | $ | 2.17 | | | $ | 1.85 | | | $ | 11.26 | | | $ | 8.73 | |
| | | | | | | |
| Weighted average number of shares outstanding |
| Basic | 180.8 | | | 182.7 | | | 181.8 | | | 183.2 | |
| Diluted | 181.7 | | | 183.6 | | | 182.7 | | | 184.0 | |
Table 2 - Condensed Consolidated Balance Sheet Data (Unaudited)
| | | | | | | | | | | |
| Amounts in millions | December 31, 2024 | | December 31, 2023 |
| ASSETS | | | |
| Current assets: | | | |
| Cash and cash equivalents | $ | 2,408 | | | $ | 2,130 | |
| Short-term investments | 566 | | | 63 | |
Accounts receivable, net of allowance for credit losses of $32 in 2024 and $35 in 2023 | 1,801 | | | 1,659 | |
| Other current assets | 515 | | | 489 | |
| | | |
| Total current assets | 5,290 | | | 4,341 | |
Property and equipment, net of accumulated depreciation of $1,453 in 2024 and $1,272 in 2023 | 656 | | | 603 | |
| Operating lease right-of-use assets | 216 | | | 277 | |
| Goodwill | 5,994 | | | 5,956 | |
| Intangible assets, net | 1,890 | | | 2,049 | |
| Deferred tax assets, net | 293 | | | 258 | |
| Other assets | 1,166 | | | 1,138 | |
| Total assets | $ | 15,505 | | | $ | 14,622 | |
| LIABILITIES AND SHAREHOLDERS' EQUITY |
| Current liabilities: | | | |
| Accounts payable and accrued liabilities | $ | 1,344 | | | $ | 1,076 | |
| Current portion of operating lease liabilities | 102 | | | 108 | |
| | | |
| Current portion of long-term debt | 697 | | | — | |
| Deferred revenue | 1,454 | | | 1,316 | |
| | | |
| Total current liabilities | 3,597 | | | 2,500 | |
| Non-current portion of deferred revenue | 57 | | | 65 | |
| Long-term debt | 6,731 | | | 7,001 | |
| Deferred tax liabilities, net | 449 | | | 402 | |
| Uncertain tax positions | 211 | | | 196 | |
| Operating lease liabilities | 216 | | | 306 | |
| Other liabilities | 517 | | | 676 | |
| Total liabilities | 11,778 | | | 11,146 | |
| | | |
|
| | | |
| | | |
| | | |
| | | |
| | | |
| | | |
| | | |
| | | |
| Total Moody's shareholders' equity | 3,565 | | | 3,318 | |
| Noncontrolling interests | 162 | | | 158 | |
| Total shareholders' equity | 3,727 | | | 3,476 | |
Total liabilities, noncontrolling interests and shareholders' equity | $ | 15,505 | | | $ | 14,622 | |
Table 3 - Condensed Consolidated Statements of Cash Flows (Unaudited)
| | | | | | | | | | | | | | | |
| Year Ended
December 31, | | | | |
| Amounts in millions | 2024 | | 2023 | | | | |
Cash flows from operating activities | | | | | | | |
| Net income | $ | 2,059 | | | $ | 1,608 | | | | | |
Reconciliation of net income to net cash provided by operating activities: | | | | | | | |
| Depreciation and amortization | 431 | | | 373 | | | | | |
| Stock-based compensation | 220 | | | 193 | | | | | |
| Deferred income taxes | (62) | | | (38) | | | | | |
| Non-cash restructuring and asset impairment/abandonment-related charges | 32 | | | 35 | | | | | |
Provision for credit losses on accounts receivable | 15 | | | 22 | | | | | |
| | | | | | | |
| | | | | | | |
Gain on previously held/sold investments in non-consolidated affiliates | (7) | | | (4) | | | | | |
Net changes in other operating assets and liabilities | 150 | | | (38) | | | | | |
| Net cash provided by operating activities | 2,838 | | | 2,151 | | | | | |
| | | | | | | |
Cash flows from investing activities | | | | | | | |
| Capital additions | (317) | | | (271) | | | | | |
| Purchases of investments | (651) | | | (143) | | | | | |
| Sales and maturities of investments | 135 | | | 162 | | | | | |
Purchases of investments in non-consolidated affiliates | (4) | | | (5) | | | | | |
Sales of/distributions from investments in non-consolidated affiliates | 2 | | | 13 | | | | | |
| Cash paid for acquisitions, net of cash acquired | (221) | | | (3) | | | | | |
| | | | | | | |
| Net cash used in investing activities | (1,056) | | | (247) | | | | | |
| | | | | | | |
Cash flows from financing activities | | | | | | | |
| Issuance of notes | 496 | | | — | | | | | |
| Repayment of notes | — | | | (500) | | | | | |
Proceeds from stock-based compensation plans | 73 | | | 50 | | | | | |
Repurchase of shares related to stock-based compensation | (91) | | | (71) | | | | | |
Treasury shares | (1,292) | | | (490) | | | | | |
Dividends | (620) | | | (564) | | | | | |
| Dividends to noncontrolling interests | (7) | | | (9) | | | | | |
Debt issuance costs and related fees | (5) | | | — | | | | | |
| Net cash used in financing activities | (1,446) | | | (1,584) | | | | | |
Effect of exchange rate changes on cash and cash equivalents | (58) | | | 41 | | | | | |
| Increase in cash and cash equivalents | 278 | | | 361 | | | | | |
Cash and cash equivalents, beginning of period | 2,130 | | | 1,769 | | | | | |
Cash and cash equivalents, end of period | $ | 2,408 | | | $ | 2,130 | | | | | |
| | | | | | | |
| | | | | | | |
| | | | | | | |
Table 4 - Non-Operating (Expense) Income, Net (Unaudited)
| | | | | | | | | | | | | | | | | | | | | | | |
| Three Months Ended December 31, | | Year Ended
December 31, |
| Amounts in millions | 2024 | | 2023 | | 2024 | | 2023 |
| Interest: | | | | | | | |
| Income | $ | 29 | | | $ | 19 | | | $ | 102 | | | $ | 63 | |
| Expense on borrowings | (73) | | | (76) | | | (300) | | | (296) | |
(Expense) income on UTPs and other tax related liabilities(1) | (1) | | | (2) | | | (13) | | | 8 | |
| Net periodic pension costs - interest component | (7) | | | (7) | | | (26) | | | (26) | |
Interest expense, net | $ | (52) | | | $ | (66) | | | $ | (237) | | | $ | (251) | |
Other non-operating income, net: | | | | | | | |
FX gain (loss) | $ | 7 | | | $ | (1) | | | $ | — | | | $ | (30) | |
| Net periodic pension income - non-service and non-interest cost components | 5 | | | 9 | | | 30 | | | 35 | |
Income/gain from investments in non-consolidated affiliates | 5 | | | 7 | | | 15 | | | 19 | |
Gain on previously held equity method investments(2) | — | | | — | | | 7 | | | — | |
| Gain on investments | 1 | | | 3 | | | 13 | | | 14 | |
Other | (2) | | | — | | | (4) | | | 11 | |
Other non-operating income, net | $ | 16 | | | $ | 18 | | | $ | 61 | | | $ | 49 | |
| | | | | | | |
| Total non-operating (expense) income, net | $ | (36) | | | $ | (48) | | | $ | (176) | | | $ | (202) | |
| | |
|
(1) The amount for the year ended December 31, 2023 includes a $22 million reduction of tax-related interest expense primarily related to the resolutions of tax matters. |
|
(2) The amount for the year ended December 31, 2024 reflects non-cash gains relating to the step-acquisitions of Praedicat and GCR. |
|
|
|
|
Table 5 - Financial Information by Segment (Unaudited)
The table below shows revenue and Adjusted Operating Income by reportable segment. Adjusted Operating Income is a financial metric utilized by the Company’s chief operating decision maker to assess the profitability of each reportable segment. | | | | | | | | | | | | | | | | | | | | | | | | | | | | | | | | | | | | | | | | | | | | | | | |
| Three Months Ended December 31, |
| 2024 |
| 2023 |
| Amounts in millions | MA | | MIS | | Eliminations | | Consolidated | | MA | | MIS | | Eliminations | | Consolidated |
| Total external revenue | $ | 863 | |
| $ | 809 | |
| $ | — | |
| $ | 1,672 | |
| $ | 796 | | | $ | 684 | |
| $ | — | |
| $ | 1,480 | |
| Intersegment revenue | 3 | | | 49 | | | (52) | | | — | | | 3 | | | 48 | | | (51) | | | — | |
| Total revenue | 866 | | | 858 | | | (52) | | | 1,672 | | | 799 | | | 732 | | | (51) | | | 1,480 | |
Compensation expense | 347 | | | 302 | | | — | | | 649 | | | 317 | | | 251 | | | — | | | 568 | |
Non-compensation expense | 177 | | | 113 | | | — | | | 290 | | | 183 | | | 98 | | | — | | | 281 | |
Intersegment expense | 49 | | | 3 | | | (52) | | | — | | | 48 | | | 3 | | | (51) | | | — | |
| Operating, SG&A | 573 | | | 418 | | | (52) | | | 939 | | | 548 | | | 352 | | | (51) | |
| 849 | |
| Adjusted Operating Income | $ | 293 | | | $ | 440 | | | $ | — | | | $ | 733 | | | $ | 251 | | | $ | 380 | | | $ | — | | | $ | 631 | |
| Adjusted Operating Margin | 33.8 | % | | 51.3 | % | | | | 43.8 | % | | 31.4 | % | | 51.9 | % | | | | 42.6 | % |
| Depreciation and amortization | 93 | |
| 20 | |
| — | |
| 113 | |
| 78 | | | 19 | |
| — | |
| 97 | |
| Restructuring | 35 | | | 11 | | | — | | | 46 | | | 21 | | | 15 | | | — | | | 36 | |
Charges related to asset abandonment | 13 | | | — | | | — | | | 13 | | | — | | | — | | | — | | | — | |
| Operating income | | | | | | | $ | 561 | | | | | | | | | $ | 498 | |
| Operating margin | | | | | | | 33.6 | % | | | | | | | | 33.6 | % |
| | | | | | | | | | | | | | | |
| | | | | | | | | | | | | | | |
| | | | | | | | | | | | | | | |
| | | | | | | | | | | | | | | |
| | | | | | | | | | | | | | | |
| | | | | | | | | | | | | | | |
| | | | | | | | | | | | | | | |
| | | | | | | | | | | | | | | |
| | | | | | | | | | | | | | | |
| | | | | | | | | | | | | | | |
| | | | | | | | | | | | | | | |
| | | | | | | | | | | | | | | |
| | | | | | | | | | | | | | | |
| | | | | | | | | | | | | | | |
| | | | | | | | | | | | | | | |
| | | | | | | | | | | | | | | |
| | | | | | | | | | | | | | | |
| | | | | | | | | | | | | | | |
| | | | | | | | | | | | | | | |
| | | | | | | | | | | | | | | |
| | | | | | | | | | | | | | | |
| | | | | | | | | | | | | | | |
| | | | | | | | | | | | | | | | | | | | | | | | | | | | | | | | | | | | | | | | | | | | | | | |
| Year Ended December 31, |
| 2024 | | 2023 |
| Amounts in millions | MA | | MIS | | Eliminations | | Consolidated | | MA | | MIS | | Eliminations | | Consolidated |
| Total external revenue | $ | 3,295 | | | $ | 3,793 | | | $ | — | |
| $ | 7,088 | |
| $ | 3,056 | | | $ | 2,860 | | | $ | — | |
| $ | 5,916 | |
| Intersegment revenue | 13 | | | 193 | | | (206) | | | — | | | 13 | | | 186 | | | (199) | | | — | |
| Total revenue | 3,308 | | | 3,986 | | | (206) | | | 7,088 | | | 3,069 | | | 3,046 | | | (199) | | | 5,916 | |
Compensation expense | 1,370 | | | 1,169 | | | — | | | 2,539 | | | 1,238 | | | 1,003 | | | — | | | 2,241 | |
Non-compensation expense | 731 | | | 410 | | | — | | | 1,141 | | | 708 | | | 370 | | | — | | | 1,078 | |
Intersegment expense | 193 | | | 13 | | | (206) | | | — | | | 186 | | | 13 | | | (199) | | | — | |
| Operating, SG&A | 2,294 | | | 1,592 | | | (206) | | | 3,680 | | | 2,132 | | | 1,386 | | | (199) | |
| 3,319 | |
| Adjusted Operating Income | $ | 1,014 | | | $ | 2,394 | | | $ | — | | | $ | 3,408 | | | $ | 937 | | | $ | 1,660 | | | $ | — | | | $ | 2,597 | |
| Adjusted Operating Margin | 30.7 | % | | 60.1 | % | | | | 48.1 | % | | 30.5 | % | | 54.5 | % | | | | 43.9 | % |
| Depreciation and amortization | 353 | | | 78 | |
| — | |
| 431 | |
| 298 | | | 75 | |
| — | | | 373 | |
| Restructuring | 42 | | | 17 | | | — | | | 59 | | | 59 | | | 28 | | | — | | | 87 | |
Charges related to asset abandonment (1) | 43 | | | — | | | — | | | 43 | | | — | | | — | | | — | | | — | |
| Operating income | | | | | | | $ | 2,875 | | | | | | | | | $ | 2,137 | |
| Operating margin | | | | | | | 40.6 | % | | | | | | | | 36.1 | % |
| | | | | | | | | | | | | | | |
| | | | | | | | | | | | | | | |
| | | | | | | | | | | | | | |
(1) During the year ended December 31, 2024, the Company recorded charges related to asset abandonment of $43 million pursuant to the Company's decision to outsource the production of certain sustainability content utilized in our product offerings. These charges consist of: i) $12 million related to severance incurred pursuant to a reduction in staff; and ii) $31 million in incremental amortization expense related to the change in estimated useful lives of certain internally developed software and amortizable intangible assets that are associated with the sustainability content offerings for which production is being outsourced. |
Table 6 - Transaction and Recurring Revenue (Unaudited)
The following tables summarize the split between transaction revenue and recurring revenue. In the MA segment, recurring revenue represents subscription-based revenue and software maintenance revenue. Transaction revenue in MA represents perpetual software license fees and revenue from software implementation services, risk management advisory projects, and training and certification services. In the MIS segment, excluding MIS Other, transaction revenue represents the initial rating of a new debt issuance, as well as other one-time fees, while recurring revenue represents recurring monitoring fees of a rated debt obligation and/or entities that issue such obligations, as well as revenue from programs such as commercial paper, medium-term notes and shelf registrations. In MIS Other, transaction revenue represents revenue from professional services, while recurring revenue represents subscription-based revenue.
| | | | | | | | | | | | | | | | | | | | | | | | | | | | | | | | | | | | |
| | Three Months Ended December 31, |
| | 2024 | | 2023 |
| Amounts in millions | | Transaction | | Recurring | | Total | | Transaction | | Recurring | | Total |
| | | | | | | | | | | | |
Decision Solutions | | | | | | | | | | | | |
Banking | | $ | 29 | | | $ | 117 | | | $ | 146 | | | $ | 30 | | | $ | 101 | | | $ | 131 | |
| | 20 | % | | 80 | % | | 100 | % | | 23 | % | | 77 | % | | 100 | % |
Insurance | | $ | 7 | | | $ | 152 | | | $ | 159 | | | $ | 13 | | | $ | 133 | | | $ | 146 | |
| | 4 | % | | 96 | % | | 100 | % | | 9 | % | | 91 | % | | 100 | % |
KYC | | $ | 1 | | | $ | 96 | | | $ | 97 | | | $ | — | | | $ | 84 | | | $ | 84 | |
| | 1 | % | | 99 | % | | 100 | % | | — | % | | 100 | % | | 100 | % |
Total Decision Solutions | | $ | 37 | | | $ | 365 | | | $ | 402 | | | $ | 43 | | | $ | 318 | | | $ | 361 | |
| | 9 | % | | 91 | % | | 100 | % | | 12 | % | | 88 | % | | 100 | % |
| Research & Insights | | $ | 4 | | | $ | 239 | | | $ | 243 | | | $ | 4 | | | $ | 226 | | | $ | 230 | |
| | 2 | % | | 98 | % | | 100 | % | | 2 | % | | 98 | % | | 100 | % |
| Data & Information | | $ | 1 | | | $ | 217 | | | $ | 218 | | | $ | 1 | | | $ | 204 | | | $ | 205 | |
| | — | % | | 100 | % | | 100 | % | | — | % | | 100 | % | | 100 | % |
| Total MA | | $ | 42 | | | $ | 821 | | | $ | 863 | | | $ | 48 | | | $ | 748 | | | $ | 796 | |
| | 5 | % | | 95 | % | | 100 | % | | 6 | % | | 94 | % | | 100 | % |
| | | | | | | | | | | | |
| Corporate Finance | | $ | 246 | |
| $ | 135 | | | $ | 381 | | | $ | 205 | | | $ | 132 | | | $ | 337 | |
| | 65 | % | | 35 | % | | 100 | % | | 61 | % | | 39 | % | | 100 | % |
| Structured Finance | | $ | 79 | | | $ | 59 | | | $ | 138 | | | $ | 48 | | | $ | 54 | | | $ | 102 | |
| | 57 | % | | 43 | % | | 100 | % | | 47 | % | | 53 | % | | 100 | % |
| Financial Institutions | | $ | 89 | | | $ | 78 | | | $ | 167 | | | $ | 59 | | | $ | 73 | | | $ | 132 | |
| | 53 | % | | 47 | % | | 100 | % | | 45 | % | | 55 | % | | 100 | % |
| Public, Project and Infrastructure Finance | | $ | 69 | | | $ | 46 | | | $ | 115 | | | $ | 61 | | | $ | 44 | | | $ | 105 | |
| | 60 | % | | 40 | % | | 100 | % | | 58 | % | | 42 | % | | 100 | % |
| MIS Other | | $ | 2 | | | $ | 6 | | | $ | 8 | | | $ | 2 | | | $ | 6 | | | $ | 8 | |
| | 25 | % | | 75 | % | | 100 | % | | 25 | % | | 75 | % | | 100 | % |
| Total MIS | | $ | 485 | | | $ | 324 | | | $ | 809 | | | $ | 375 | | | $ | 309 | | | $ | 684 | |
| | 60 | % | | 40 | % | | 100 | % | | 55 | % | | 45 | % | | 100 | % |
| | | | | | | | | | | | |
| Total Moody's Corporation | | $ | 527 | | | $ | 1,145 | | | $ | 1,672 | | | $ | 423 | | | $ | 1,057 | | | $ | 1,480 | |
| | 32 | % | | 68 | % | | 100 | % | | 29 | % | | 71 | % | | 100 | % |
Table 6 - Transaction and Recurring Revenue (Unaudited) Continued
| | | | | | | | | | | | | | | | | | | | | | | | | | | | | | | | | | | | |
| | Year Ended December 31, |
| | 2024 | | 2023 |
| Amounts in millions | | Transaction | | Recurring | | Total | | Transaction | | Recurring | | Total |
Decision Solutions | | | | | | | | | | | | |
Banking | | $ | 117 | | | $ | 434 | | | $ | 551 | | | $ | 130 | | | $ | 391 | | | $ | 521 | |
| | 21 | % | | 79 | % | | 100 | % | | 25 | % | | 75 | % | | 100 | % |
Insurance | | $ | 23 | | | $ | 575 | | | $ | 598 | | | $ | 38 | | | $ | 512 | | | $ | 550 | |
| | 4 | % | | 96 | % | | 100 | % | | 7 | % | | 93 | % | | 100 | % |
KYC | | $ | 2 | | | $ | 365 | | | $ | 367 | | | $ | 1 | | | $ | 311 | | | $ | 312 | |
| | 1 | % | | 99 | % | | 100 | % | | — | % | | 100 | % | | 100 | % |
Total Decision Solutions | | $ | 142 | | | $ | 1,374 | | | $ | 1,516 | | | $ | 169 | | | $ | 1,214 | | | $ | 1,383 | |
| | 9 | % | | 91 | % | | 100 | % | | 12 | % | | 88 | % | | 100 | % |
| Research & Insights | | $ | 15 | | | $ | 911 | | | $ | 926 | | | $ | 16 | | | $ | 868 | | | $ | 884 | |
| | 2 | % | | 98 | % | | 100 | % | | 2 | % | | 98 | % | | 100 | % |
| Data & Information | | $ | 4 | | | $ | 849 | | | $ | 853 | | | $ | 3 | | | $ | 786 | | | $ | 789 | |
| | — | % | | 100 | % | | 100 | % | | — | % | | 100 | % | | 100 | % |
| Total MA | | $ | 161 | |
| $ | 3,134 | | | $ | 3,295 | | | $ | 188 | | | $ | 2,868 | | | $ | 3,056 | |
| | 5 | % | | 95 | % | | 100 | % | | 6 | % | | 94 | % | | 100 | % |
| | | | | | | | | | | | |
| Corporate Finance | | $ | 1,415 | | | $ | 535 | | | $ | 1,950 | | | $ | 887 | | | $ | 517 | | | $ | 1,404 | |
| | 73 | % |
| 27 | % |
| 100 | % |
| 63 | % | | 37 | % | | 100 | % |
| Structured Finance | | $ | 292 | |
| $ | 226 | | | $ | 518 | | | $ | 190 | | | $ | 215 | | | $ | 405 | |
| | 56 | % | | 44 | % | | 100 | % | | 47 | % | | 53 | % | | 100 | % |
| Financial Institutions | | $ | 418 | |
| $ | 309 | | | $ | 727 | | | $ | 254 | | | $ | 291 | | | $ | 545 | |
| | 57 | % | | 43 | % | | 100 | % | | 47 | % | | 53 | % | | 100 | % |
| Public, Project and Infrastructure Finance | | $ | 384 | |
| $ | 180 | | | $ | 564 | | | $ | 301 | | | $ | 175 | | | $ | 476 | |
| | 68 | % | | 32 | % | | 100 | % | | 63 | % | | 37 | % | | 100 | % |
| MIS Other | | $ | 8 | |
| $ | 26 | | | $ | 34 | | | $ | 6 | | | $ | 24 | | | $ | 30 | |
| | 24 | % | | 76 | % | | 100 | % | | 20 | % | | 80 | % | | 100 | % |
| Total MIS | | $ | 2,517 | |
| $ | 1,276 | | | $ | 3,793 | | | $ | 1,638 | | | $ | 1,222 | | | $ | 2,860 | |
| | 66 | % | | 34 | % | | 100 | % | | 57 | % | | 43 | % | | 100 | % |
| | | | | | | | | | | | |
| Total Moody's Corporation | | $ | 2,678 | | | $ | 4,410 | | | $ | 7,088 | | | $ | 1,826 | | | $ | 4,090 | | | $ | 5,916 | |
| | 38 | % | | 62 | % | | 100 | % | | 31 | % | | 69 | % | | 100 | % |
Table 7 - Adjusted Operating Income and Adjusted Operating Margin (Unaudited)
The Company presents Adjusted Operating Income and Adjusted Operating Margin because management deems these metrics to be useful measures to provide additional perspective on Moody's operating performance. Adjusted Operating Income excludes the impact of: i) depreciation and amortization; ii) restructuring charges/adjustments; and iii) charges related to asset abandonment. Depreciation and amortization are excluded because companies utilize productive assets of different estimated useful lives and use different methods of acquiring and depreciating productive assets. Restructuring charges/adjustments and charges related to asset abandonment, which the Company believes are not reflective of its ongoing operating cost structure, are excluded as the frequency and magnitude of these charges may vary widely across periods and companies.
Management believes that the exclusion of the aforementioned items, as detailed in the reconciliation below, allows for an additional perspective on the Company’s operating results from period to period and across companies. The Company defines Adjusted Operating Margin as Adjusted Operating Income divided by revenue.
Below is a reconciliation of these measures to their most directly comparable U.S. GAAP measures:
| | | | | | | | | | | | | | | | | | | | | | | |
| Three Months Ended December 31, | | Year Ended December 31, |
| Amounts in millions | 2024 | | 2023 | | 2024 | | 2023 |
| Operating income | $ | 561 | | | $ | 498 | | | $ | 2,875 | | | $ | 2,137 | |
| Depreciation and amortization | 113 | | | 97 | | | 431 | | | 373 | |
| Restructuring | 46 | | | 36 | | | 59 | | | 87 | |
| Charges related to asset abandonment | 13 | | | — | | | 43 | | | — | |
| Adjusted Operating Income | $ | 733 | | | $ | 631 | | | $ | 3,408 | | | $ | 2,597 | |
| Operating margin | 33.6 | % | | 33.6 | % | | 40.6 | % | | 36.1 | % |
| Adjusted Operating Margin | 43.8 | % | | 42.6 | % | | 48.1 | % | | 43.9 | % |
Table 8 - Free Cash Flow (Unaudited)
The Company defines Free Cash Flow as net cash provided by operating activities minus cash paid for capital additions. Management believes that Free Cash Flow is a useful metric in assessing the Company’s cash flows to service debt, pay dividends and to fund acquisitions and share repurchases. Management deems capital expenditures essential to the Company’s product and service innovations and maintenance of Moody’s operational capabilities. Accordingly, capital expenditures are deemed to be a recurring use of Moody’s cash flow.
Below is a reconciliation of the Company’s net cash flows from operating activities to Free Cash Flow:
| | | | | | | | | | | |
| Year Ended December 31, |
| Amounts in millions | 2024 | | 2023 |
| Net cash provided by operating activities | $ | 2,838 | | | $ | 2,151 | |
| Capital additions | (317) | | | (271) | |
| Free Cash Flow | $ | 2,521 | | | $ | 1,880 | |
| Net cash used in investing activities | $ | (1,056) | | | $ | (247) | |
| Net cash used in financing activities | $ | (1,446) | | | $ | (1,584) | |
Table 9 - Constant Currency Revenue Growth (Unaudited)
The Company presents constant currency revenue growth (decline) as its non-GAAP measure of revenue growth (decline). Management deems this measure to be useful in providing additional perspective in assessing the Company's revenue growth (decline) excluding the impacts of changes in foreign exchange rates. The Company calculates the dollar impact of foreign exchange as the difference between the translation of its current period non-USD functional currency results using comparative prior period weighted average foreign exchange translation rates and current year reported results.
Below is a reconciliation of the Company's reported revenue and growth (decline) rates to its constant currency revenue growth (decline) measures:
| | | | | | | | | | | | | | | | | | | | | | | | | | | | | | | | | | | | | | | | | | | | | | | | | | |
| | Three Months Ended December 31, | | Year Ended December 31, |
| Amounts in millions | | 2024 | | 2023 | | Change | | Growth | | 2024 | | 2023 | | Change | | Growth |
| MCO revenue | | $ | 1,672 | | | $ | 1,480 | | | $ | 192 | | | 13% | | $ | 7,088 | | | $ | 5,916 | | | $ | 1,172 | | | 20% |
| FX impact | | 4 | | | — | | | 4 | | | | | (1) | | | — | | | (1) | | | |
| | | | | | | | | | | | | | | | |
Constant currency MCO revenue | | $ | 1,676 | | | $ | 1,480 | | | $ | 196 | | | 13% | | $ | 7,087 | | | $ | 5,916 | | | $ | 1,171 | | | 20% |
| | | | | | | | | | | | | | | | |
| MA revenue | | $ | 863 | | | $ | 796 | | | $ | 67 | | | 8% | | $ | 3,295 | | | $ | 3,056 | | | $ | 239 | | | 8% |
| FX impact | | — | | | — | | | — | | | | | (6) | | | — | | | (6) | | | |
| | | | | | | | | | | | | | | | |
Constant currency MA revenue | | $ | 863 | | | $ | 796 | | | $ | 67 | | | 8% | | $ | 3,289 | | | $ | 3,056 | | | $ | 233 | | | 8% |
| | | | | | | | | | | | | | | | |
| Decision Solutions revenue | | $ | 402 | | | $ | 361 | | | $ | 41 | | | 11% | | $ | 1,516 | | | $ | 1,383 | | | $ | 133 | | | 10% |
| FX impact | | — | | | — | | | — | | | | | (2) | | | — | | | (2) | | | |
| | | | | | | | | | | | | | | | |
Constant currency Decision Solutions revenue | | $ | 402 | | | $ | 361 | | | $ | 41 | | | 11% | | $ | 1,514 | | | $ | 1,383 | | | $ | 131 | | | 9% |
| | | | | | | | | | | | | | | | |
| Research and Insights revenue | | $ | 243 | | | $ | 230 | | | $ | 13 | | | 6% | | $ | 926 | | | $ | 884 | | | $ | 42 | | | 5% |
| FX impact | | — | | | — | | | — | | | | | (2) | | | — | | | (2) | | | |
| | | | | | | | | | | | | | | | |
Constant currency Research and Insights revenue | | $ | 243 | | | $ | 230 | | | $ | 13 | | | 6% | | $ | 924 | | | $ | 884 | | | $ | 40 | | | 5% |
| | | | | | | | | | | | | | | | |
| Data and Information revenue | | $ | 218 | | | $ | 205 | | | $ | 13 | | | 6% | | $ | 853 | | | $ | 789 | | | $ | 64 | | | 8% |
| FX impact | | — | | | — | | | — | | | | | (2) | | | — | | | (2) | | | |
| | | | | | | | | | | | | | | | |
Constant currency Data and Information revenue | | $ | 218 | | | $ | 205 | | | $ | 13 | | | 6% | | $ | 851 | | | $ | 789 | | | $ | 62 | | | 8% |
| | | | | | | | | | | | | | | | |
| MA recurring revenue | | $ | 821 | | | $ | 748 | | | $ | 73 | | | 10% | | $ | 3,134 | | | $ | 2,868 | | | $ | 266 | | | 9% |
| FX impact | | (2) | | | — | | | (2) | | | | | (8) | | | — | | | (8) | | | |
| | | | | | | | | | | | | | | | |
Constant currency MA recurring revenue | | $ | 819 | | | $ | 748 | | | $ | 71 | | | 9% | | $ | 3,126 | | | $ | 2,868 | | | $ | 258 | | | 9% |
| | | | | | | | | | | | | | | | |
| MIS revenue | | $ | 809 | | | $ | 684 | | | $ | 125 | | | 18% | | $ | 3,793 | | | $ | 2,860 | | | $ | 933 | | | 33% |
| FX impact | | 4 | | | — | | | 4 | | | | | 5 | | | — | | | 5 | | | |
| | | | | | | | | | | | | | | | |
Constant currency MIS revenue | | $ | 813 | | | $ | 684 | | | $ | 129 | | | 19% | | $ | 3,798 | | | $ | 2,860 | | | $ | 938 | | | 33% |
| | | | | | | | | | | | | | | | |
CFG revenue | | $ | 381 | | | $ | 337 | | | $ | 44 | | | 13% | | $ | 1,950 | | | $ | 1,404 | | | $ | 546 | | | 39% |
| FX impact | | 1 | | | — | | | 1 | | | | | 1 | | | — | | | 1 | | | |
| | | | | | | | | | | | | | | | |
Constant currency CFG revenue | | $ | 382 | | | $ | 337 | | | $ | 45 | | | 13% | | $ | 1,951 | | | $ | 1,404 | | | $ | 547 | | | 39% |
| | | | | | | | | | | | | | | | |
SFG revenue | | $ | 138 | | | $ | 102 | | | $ | 36 | | | 35% | | $ | 518 | | | $ | 405 | | | $ | 113 | | | 28% |
| FX impact | | 1 | | | — | | | 1 | | | | | 2 | | | — | | | 2 | | | |
| | | | | | | | | | | | | | | | |
Constant currency SFG revenue | | $ | 139 | | | $ | 102 | | | $ | 37 | | | 36% | | $ | 520 | | | $ | 405 | | | $ | 115 | | | 28% |
| | | | | | | | | | | | | | | | |
| FIG revenue | | $ | 167 | | | $ | 132 | | | $ | 35 | | | 27% | | $ | 727 | | | $ | 545 | | | $ | 182 | | | 33% |
| FX impact | | 1 | | | — | | | 1 | | | | | 1 | | | — | | | 1 | | | |
| | | | | | | | | | | | | | | | |
| Constant currency FIG revenue | | $ | 168 | | | $ | 132 | | | $ | 36 | | | 27% | | $ | 728 | | | $ | 545 | | | $ | 183 | | | 34% |
| | | | | | | | | | | | | | | | |
PPIF revenue | | $ | 115 | | | $ | 105 | | | $ | 10 | | | 10% | | $ | 564 | | | $ | 476 | | | $ | 88 | | | 18% |
| FX impact | | 1 | | | — | | | 1 | | | | | — | | | — | | | — | | | |
| | | | | | | | | | | | | | | | |
Constant currency PPIF revenue | | $ | 116 | | | $ | 105 | | | $ | 11 | | | 10% | | $ | 564 | | | $ | 476 | | | $ | 88 | | | 18% |
| | | | | | | | | | | | | | | | |
| | | | | | | | | | |
| | | | | | | | | | | | | | | | |
| | | | | | | | | | | | | | | | |
| | | | | | | | | | | | | | | | |
| | | | | | | | | | | | | | | | |
| | | | | | | | | | | | | | | | |
| | | | | | | | | | | | | | | | |
| | | | | | | | | | |
| | | | | | | | | | | | | | | | |
| | | | | | | | | | | | | | | | |
| | | | | | | | | | | | | | | | |
| | | | | | | | | | | | | | | | |
| | | | | | | | | | | | | | | | |
| | | | | | | | | | | | | | | | |
| | | | |
| | | | | | | | | | | | | | | | |
| | | | | | | | | | | | | | | | |
| | | | | | | | | | | | | | | | |
| | | | | | | | | | | | | | | | |
| | | | | | | | | | | | | | | | |
| | | | | | | | | | | | | | | | |
| | | | | | | | | | | | | | | | |
| | | | | | | | | | | | | | | | |
| | | | | | | | | | | | | | | | |
Table 10 - Key Performance Metrics - Annualized Recurring Revenue (Unaudited)
The Company presents Annualized Recurring Revenue (“ARR”) on a constant currency organic basis for its MA business as a supplemental performance metric to provide additional insight on the estimated value of MA's recurring revenue contracts at a given point in time. The Company uses ARR to manage and monitor performance of its MA operating segment and believes that this metric is a key indicator of the trajectory of MA's recurring revenue base.
The Company calculates ARR by taking the total recurring contract value for each active renewable contract as of the reporting date, divided by the number of days in the contract and multiplied by 365 days to create an annualized value. The Company defines renewable contracts as subscriptions, term licenses, maintenance and renewable services. ARR excludes transaction sales including one-time training, services and perpetual licenses. In order to compare period-over-period ARR excluding the effects of foreign currency translation, the Company bases the calculation on currency rates utilized in its current year operating budget and holds these FX rates constant for the duration of all current and prior periods being reported. Additionally, ARR excludes contracts related to acquisitions to provide additional perspective in assessing growth excluding the impacts from certain acquisition activity.
The Company’s definition of ARR may differ from definitions utilized by other companies reporting similarly named measures, and this metric should be viewed in addition to, and not as a substitute for, financial measures presented in accordance with U.S. GAAP.
| | | | | | | | | | | | | | | | | | | | | | | |
| Amounts in millions | December 31, 2024 | | December 31, 2023 | | Change | | Growth |
| MA ARR | | | | | | | |
| Decision Solutions | | | | | | | |
| Banking | $ | 457 | | | $ | 420 | | | $ | 37 | | | 9% |
| Insurance | 601 | | | 536 | | | 65 | | | 12% |
| KYC | 390 | | | 334 | | | 56 | | | 17% |
Total Decision Solutions | $ | 1,448 | | | $ | 1,290 | | | $ | 158 | | | 12% |
| Research and Insights | 942 | | | 885 | | | 57 | | | 6% |
| Data and Information | 888 | | | 821 | | | 67 | | | 8% |
| Total MA ARR | $ | 3,278 | | | $ | 2,996 | | | $ | 282 | | | 9% |
| | | | | | | |
Table 11 - Adjusted Net Income and Adjusted Diluted EPS Attributable to Moody's Common Shareholders (Unaudited)
The Company presents Adjusted Net Income and Adjusted Diluted EPS because management deems these metrics to be useful measures to provide additional perspective on Moody’s operating performance. Adjusted Net Income and Adjusted Diluted EPS exclude the impact of: i) amortization of acquired intangible assets; ii) restructuring charges/adjustments; iii) charges related to asset abandonment; and iv) gains on previously held equity method investments.
The Company excludes the impact of amortization of acquired intangible assets as companies utilize intangible assets with different estimated useful lives and have different methods of acquiring and amortizing intangible assets. These intangible assets were recorded as part of acquisition accounting and contribute to revenue generation. The amortization of intangible assets related to acquisitions will recur in future periods until such intangible assets have been fully amortized. Furthermore, the timing and magnitude of business combination transactions are not predictable and the purchase price allocated to amortizable intangible assets and the related amortization period are unique to each acquisition and can vary significantly from period to period and across companies. Restructuring charges/adjustments and charges related to asset abandonment, which the Company believes are not reflective of its ongoing operating cost structure, and gains on previously held equity method investments are excluded as the frequency and magnitude of these items may vary widely across periods and companies.
The Company excludes the aforementioned items to provide additional perspective when comparing net income and diluted EPS from period to period and across companies as the frequency and magnitude of similar transactions may vary widely across periods.
Below is a reconciliation of these measures to their most directly comparable U.S. GAAP measures:
| | | | | | | | | | | | | | | | | | | | | | | | | | | | | | | | | | | |
| Three Months Ended December 31, | | Year Ended December 31, |
| Amounts in millions | 2024 | | 2023 | | 2024 | | 2023 |
| Net Income attributable to Moody's common shareholders | | $ | 395 | | | | $ | 340 | | | | $ | 2,058 | | | | $ | 1,607 | |
| Pre-tax Acquisition-Related Intangible Amortization Expenses | $ | 50 | | | | $ | 48 | | | | $ | 198 | | | | $ | 198 | | |
| Tax on Acquisition-Related Intangible Amortization Expenses | (12) | | | | (12) | | | | (48) | | | | (48) | | |
| Net Acquisition-Related Intangible Amortization Expenses | | 38 | | | | 36 | | | | 150 | | | | 150 | |
| Pre-tax restructuring | $ | 46 | | | | $ | 36 | | | | $ | 59 | | | | $ | 87 | | |
| Tax on restructuring | (12) | | | | (10) | | | | (15) | | | | (22) | | |
| Net restructuring | | 34 | | | | 26 | | | | 44 | | | | 65 | |
| | | | | | | | | | | |
| | | | | | | | | | | |
| | | | | | | | | | | |
| | | | | | | | | | | |
| Pre-tax charges related to asset abandonment | $ | 13 | | | | $ | — | | | | $ | 43 | | | | $ | — | | |
| Tax on charges related to asset abandonment | (4) | | | | — | | | | (11) | | | | — | | |
| Net charges related to asset abandonment | | 9 | | | | — | | | | 32 | | | | — | |
| Pre-tax gain on previously held equity method investments | $ | — | | | | $ | — | | | | $ | (7) | | | | $ | — | | |
| Tax on gain on previously held equity method investments | — | | | | — | | | | 2 | | | | — | | |
| Net gain on previously held equity method investments | | — | | | | — | | | | (5) | | | | — | |
| Adjusted Net Income | | $ | 476 | | | | $ | 402 | | | | $ | 2,279 | | | | $ | 1,822 | |
| | | | | | | | | | | |
| | | | | | | | | | | | | | | | | | | | | | | | | | | | | | | | | | | |
| | | | | | | | | | | |
| Three Months Ended December 31, | | Year Ended December 31, |
| 2024 | | 2023 | | 2024 | | 2023 |
| Diluted earnings per share attributable to Moody's common shareholders | | $ | 2.17 | | | | $ | 1.85 | | | | $ | 11.26 | | | | $ | 8.73 | |
| Pre-tax Acquisition-Related Intangible Amortization Expenses | $ | 0.28 | | | | $ | 0.26 | | | | $ | 1.08 | | | | $ | 1.08 | | |
| Tax on Acquisition-Related Intangible Amortization Expenses | (0.07) | | | | (0.06) | | | | (0.26) | | | | (0.26) | | |
| Net Acquisition-Related Intangible Amortization Expenses | | 0.21 | | | | 0.20 | | | | 0.82 | | | | 0.82 | |
| Pre-tax restructuring | $ | 0.25 | | | | $ | 0.20 | | | | $ | 0.32 | | | | $ | 0.47 | | |
| Tax on restructuring | (0.06) | | | | (0.06) | | | | (0.08) | | | | (0.12) | | |
| Net restructuring | | 0.19 | | | | 0.14 | | | | 0.24 | | | | 0.35 | |
| | | | | | | | | | | |
| | | | | | | | | | | |
| | | | | | | | | | | |
| | | | | | | | | | | |
| | | | | | | | | | | |
| | | | | | | | | | | |
| | | | | | | | | | | |
| Pre-tax charges related to asset abandonment | $ | 0.07 | | | | $ | — | | | | $ | 0.24 | | | | $ | — | | |
| Tax on charges related to asset abandonment | (0.02) | | | | — | | | | (0.06) | | | | — | | |
| Net charges related to asset abandonment | | 0.05 | | | | — | | | | 0.18 | | | | — | |
| Pre-tax gain on previously held equity method investments | $ | — | | | | $ | — | | | | $ | (0.04) | | | | $ | — | | |
| Tax on gain on previously held equity method investments | — | | | | — | | | | 0.01 | | | | — | | |
| Net gain on previously held equity method investments | | — | | | | — | | | | (0.03) | | | | — | |
| Adjusted Diluted EPS | | $ | 2.62 | | | | $ | 2.19 | | | | $ | 12.47 | | | | $ | 9.90 | |
| | |
| Note: The tax impacts in the tables above were calculated using tax rates in effect in the jurisdiction for which the item relates. |
Table 12 - 2025 Outlook
Moody’s updated outlook for full year 2025, as of February 13, 2025, reflects assumptions about numerous factors that could affect its business and is based on currently available information reviewed by management through, and as of, today’s date. For a complete list of these assumptions, please refer to “Assumptions and Outlook” on page 10 of this earnings release. | | | | | | |
Full Year 2025 Moody's Corporation Guidance as of February 13, 2025 |
Moody's Corporation (MCO) | | Current Guidance |
| Revenue | | Increase in the high-single-digit percent range |
Operating Expenses | | Increase in the low-to-mid-single-digit percent range |
Operating Margin | | Approximately 43% |
Adjusted Operating Margin (1) | | Approximately 50% |
Interest Expense, Net | | $220 million to $240 million |
Effective Tax Rate | | 23% to 25% |
Diluted EPS | | $12.75 to $13.25 |
Adjusted Diluted EPS (1) | | $14.00 to $14.50 |
Operating Cash Flow | | $2.75 to $2.95 billion |
Free Cash Flow (1) | | $2.40 to $2.60 billion |
Share Repurchases | | At least $1.3 billion (subject to available cash, market conditions, M&A opportunities and other ongoing capital allocation decisions) |
| Moody's Analytics (MA) | | Current Guidance |
MA Revenue | | Increase in the high-single-digit percent range |
ARR (2) | | Increase in the high-single-digit to low-double-digit percent range |
| MA Adjusted Operating Margin | | 32% to 33% |
| Moody's Investors Service (MIS) | | Current Guidance |
MIS Revenue | | Increase in the mid-to-high-single-digit percent range |
| MIS Adjusted Operating Margin | | 62% to 63% |
Note: All current guidance as of February 13, 2025. (1) These metrics are adjusted measures. See below for reconciliation of these measures to their comparable U.S. GAAP measure. (2) Refer to Table 10 within this earnings release for the definition of and further information on the ARR metric. |
The following are reconciliations of the Company's adjusted forward-looking measures to their comparable U.S. GAAP measure:
| | | | | |
| Projected for the Year Ended December 31, 2025 |
| Operating margin guidance | Approximately 43% |
| Depreciation and amortization | Approximately 6% |
| Restructuring | Approximately 1% |
| |
| Adjusted Operating Margin guidance | Approximately 50% |
| |
| Projected for the Year Ended December 31, 2025 |
| Operating cash flow guidance | $2.75 to $2.95 billion |
| Less: Capital expenditures | Approximately $350 million |
| Free Cash Flow guidance | $2.40 to $2.60 billion |
| |
| Projected for the Year Ended December 31, 2025 |
| Diluted EPS guidance | $12.75 to $13.25 |
| Acquisition-Related Intangible Amortization | Approximately $0.90 |
| Restructuring | Approximately $0.35 |
| |
| |
| Adjusted Diluted EPS guidance | $14.00 to $14.50 |
| X |
- DefinitionBoolean flag that is true when the XBRL content amends previously-filed or accepted submission.
| Name: |
dei_AmendmentFlag |
| Namespace Prefix: |
dei_ |
| Data Type: |
xbrli:booleanItemType |
| Balance Type: |
na |
| Period Type: |
duration |
|
| X |
- DefinitionFor the EDGAR submission types of Form 8-K: the date of the report, the date of the earliest event reported; for the EDGAR submission types of Form N-1A: the filing date; for all other submission types: the end of the reporting or transition period. The format of the date is YYYY-MM-DD.
| Name: |
dei_DocumentPeriodEndDate |
| Namespace Prefix: |
dei_ |
| Data Type: |
xbrli:dateItemType |
| Balance Type: |
na |
| Period Type: |
duration |
|
| X |
- DefinitionThe type of document being provided (such as 10-K, 10-Q, 485BPOS, etc). The document type is limited to the same value as the supporting SEC submission type, or the word 'Other'.
| Name: |
dei_DocumentType |
| Namespace Prefix: |
dei_ |
| Data Type: |
dei:submissionTypeItemType |
| Balance Type: |
na |
| Period Type: |
duration |
|
| X |
- DefinitionAddress Line 1 such as Attn, Building Name, Street Name
| Name: |
dei_EntityAddressAddressLine1 |
| Namespace Prefix: |
dei_ |
| Data Type: |
xbrli:normalizedStringItemType |
| Balance Type: |
na |
| Period Type: |
duration |
|
| X |
- Definition
+ References
+ Details
| Name: |
dei_EntityAddressCityOrTown |
| Namespace Prefix: |
dei_ |
| Data Type: |
xbrli:normalizedStringItemType |
| Balance Type: |
na |
| Period Type: |
duration |
|
| X |
- DefinitionCode for the postal or zip code
| Name: |
dei_EntityAddressPostalZipCode |
| Namespace Prefix: |
dei_ |
| Data Type: |
xbrli:normalizedStringItemType |
| Balance Type: |
na |
| Period Type: |
duration |
|
| X |
- DefinitionName of the state or province.
| Name: |
dei_EntityAddressStateOrProvince |
| Namespace Prefix: |
dei_ |
| Data Type: |
dei:stateOrProvinceItemType |
| Balance Type: |
na |
| Period Type: |
duration |
|
| X |
- DefinitionA unique 10-digit SEC-issued value to identify entities that have filed disclosures with the SEC. It is commonly abbreviated as CIK. Reference 1: http://www.xbrl.org/2003/role/presentationRef
-Publisher SEC
-Name Exchange Act
-Number 240
-Section 12
-Subsection b-2
| Name: |
dei_EntityCentralIndexKey |
| Namespace Prefix: |
dei_ |
| Data Type: |
dei:centralIndexKeyItemType |
| Balance Type: |
na |
| Period Type: |
duration |
|
| X |
- DefinitionIndicate if registrant meets the emerging growth company criteria. Reference 1: http://www.xbrl.org/2003/role/presentationRef
-Publisher SEC
-Name Exchange Act
-Number 240
-Section 12
-Subsection b-2
| Name: |
dei_EntityEmergingGrowthCompany |
| Namespace Prefix: |
dei_ |
| Data Type: |
xbrli:booleanItemType |
| Balance Type: |
na |
| Period Type: |
duration |
|
| X |
- DefinitionCommission file number. The field allows up to 17 characters. The prefix may contain 1-3 digits, the sequence number may contain 1-8 digits, the optional suffix may contain 1-4 characters, and the fields are separated with a hyphen.
| Name: |
dei_EntityFileNumber |
| Namespace Prefix: |
dei_ |
| Data Type: |
dei:fileNumberItemType |
| Balance Type: |
na |
| Period Type: |
duration |
|
| X |
- DefinitionTwo-character EDGAR code representing the state or country of incorporation.
| Name: |
dei_EntityIncorporationStateCountryCode |
| Namespace Prefix: |
dei_ |
| Data Type: |
dei:edgarStateCountryItemType |
| Balance Type: |
na |
| Period Type: |
duration |
|
| X |
- DefinitionThe exact name of the entity filing the report as specified in its charter, which is required by forms filed with the SEC. Reference 1: http://www.xbrl.org/2003/role/presentationRef
-Publisher SEC
-Name Exchange Act
-Number 240
-Section 12
-Subsection b-2
| Name: |
dei_EntityRegistrantName |
| Namespace Prefix: |
dei_ |
| Data Type: |
xbrli:normalizedStringItemType |
| Balance Type: |
na |
| Period Type: |
duration |
|
| X |
- DefinitionThe Tax Identification Number (TIN), also known as an Employer Identification Number (EIN), is a unique 9-digit value assigned by the IRS. Reference 1: http://www.xbrl.org/2003/role/presentationRef
-Publisher SEC
-Name Exchange Act
-Number 240
-Section 12
-Subsection b-2
| Name: |
dei_EntityTaxIdentificationNumber |
| Namespace Prefix: |
dei_ |
| Data Type: |
dei:employerIdItemType |
| Balance Type: |
na |
| Period Type: |
duration |
|
| X |
- DefinitionLocal phone number for entity.
| Name: |
dei_LocalPhoneNumber |
| Namespace Prefix: |
dei_ |
| Data Type: |
xbrli:normalizedStringItemType |
| Balance Type: |
na |
| Period Type: |
duration |
|
| X |
- DefinitionBoolean flag that is true when the Form 8-K filing is intended to satisfy the filing obligation of the registrant as pre-commencement communications pursuant to Rule 13e-4(c) under the Exchange Act. Reference 1: http://www.xbrl.org/2003/role/presentationRef
-Publisher SEC
-Name Exchange Act
-Number 240
-Section 13e
-Subsection 4c
| Name: |
dei_PreCommencementIssuerTenderOffer |
| Namespace Prefix: |
dei_ |
| Data Type: |
xbrli:booleanItemType |
| Balance Type: |
na |
| Period Type: |
duration |
|
| X |
- DefinitionBoolean flag that is true when the Form 8-K filing is intended to satisfy the filing obligation of the registrant as pre-commencement communications pursuant to Rule 14d-2(b) under the Exchange Act. Reference 1: http://www.xbrl.org/2003/role/presentationRef
-Publisher SEC
-Name Exchange Act
-Number 240
-Section 14d
-Subsection 2b
| Name: |
dei_PreCommencementTenderOffer |
| Namespace Prefix: |
dei_ |
| Data Type: |
xbrli:booleanItemType |
| Balance Type: |
na |
| Period Type: |
duration |
|
| X |
- DefinitionTitle of a 12(b) registered security. Reference 1: http://www.xbrl.org/2003/role/presentationRef
-Publisher SEC
-Name Exchange Act
-Number 240
-Section 12
-Subsection b
| Name: |
dei_Security12bTitle |
| Namespace Prefix: |
dei_ |
| Data Type: |
dei:securityTitleItemType |
| Balance Type: |
na |
| Period Type: |
duration |
|
| X |
- DefinitionName of the Exchange on which a security is registered. Reference 1: http://www.xbrl.org/2003/role/presentationRef
-Publisher SEC
-Name Exchange Act
-Number 240
-Section 12
-Subsection d1-1
| Name: |
dei_SecurityExchangeName |
| Namespace Prefix: |
dei_ |
| Data Type: |
dei:edgarExchangeCodeItemType |
| Balance Type: |
na |
| Period Type: |
duration |
|
| X |
- DefinitionBoolean flag that is true when the Form 8-K filing is intended to satisfy the filing obligation of the registrant as soliciting material pursuant to Rule 14a-12 under the Exchange Act. Reference 1: http://www.xbrl.org/2003/role/presentationRef
-Publisher SEC
-Name Exchange Act
-Number 240
-Section 14a
-Subsection 12
| Name: |
dei_SolicitingMaterial |
| Namespace Prefix: |
dei_ |
| Data Type: |
xbrli:booleanItemType |
| Balance Type: |
na |
| Period Type: |
duration |
|
| X |
- DefinitionTrading symbol of an instrument as listed on an exchange.
| Name: |
dei_TradingSymbol |
| Namespace Prefix: |
dei_ |
| Data Type: |
dei:tradingSymbolItemType |
| Balance Type: |
na |
| Period Type: |
duration |
|
| X |
- DefinitionBoolean flag that is true when the Form 8-K filing is intended to satisfy the filing obligation of the registrant as written communications pursuant to Rule 425 under the Securities Act. Reference 1: http://www.xbrl.org/2003/role/presentationRef
-Publisher SEC
-Name Securities Act
-Number 230
-Section 425
| Name: |
dei_WrittenCommunications |
| Namespace Prefix: |
dei_ |
| Data Type: |
xbrli:booleanItemType |
| Balance Type: |
na |
| Period Type: |
duration |
|
| X |
- Details
| Name: |
us-gaap_StatementClassOfStockAxis=us-gaap_CommonStockMember |
| Namespace Prefix: |
|
| Data Type: |
na |
| Balance Type: |
|
| Period Type: |
|
|
| X |
- Details
| Name: |
us-gaap_StatementClassOfStockAxis=mco_TwoThousandAndFifteenSeniorNotesDueTwoThousandAndTwentySevenMember |
| Namespace Prefix: |
|
| Data Type: |
na |
| Balance Type: |
|
| Period Type: |
|
|
| X |
- Details
| Name: |
us-gaap_StatementClassOfStockAxis=mco_A950SeniorNotesDueTwoThousandAndThirtyMember |
| Namespace Prefix: |
|
| Data Type: |
na |
| Balance Type: |
|
| Period Type: |
|
|
Moodys (NYSE:MCO)
과거 데이터 주식 차트
부터 1월(1) 2025 으로 2월(2) 2025

Moodys (NYSE:MCO)
과거 데이터 주식 차트
부터 2월(2) 2024 으로 2월(2) 2025

