Form DEFA14A - Additional definitive proxy soliciting materials and Rule 14(a)(12) material
15 7월 2023 - 5:34AM
Edgar (US Regulatory)
UNITED STATES
SECURITIES AND EXCHANGE COMMISSION
Washington, D.C. 20549
SCHEDULE 14A INFORMATION
Proxy Statement Pursuant to Section 14(a) of the
Securities Exchange Act of 1934
|
|
|
| Filed by the Registrant ☒ |
|
|
| Filed by a Party other than the Registrant ☐ |
| Check the appropriate box: |
|
|
| ☐ Preliminary Proxy
Statement |
|
☐ Confidential, for Use
of the Commission Only (as permitted by Rule 14a-6(e)(2)) |
| ☐ Definitive Proxy
Statement |
| ☒ Definitive Additional
Materials |
| ☐ Soliciting Material
Pursuant to § 240.14a-12 |
BLACKROCK ESG CAPITAL ALLOCATION TERM TRUST
(Name of Registrant as Specified In Its Charter)
(Name of Person(s) Filing Proxy
Statement, if Other than the Registrant)
Payment of Filing Fee (Check the appropriate box):
|
|
|
| ☒ |
|
No fee required. |
|
|
| ☐ |
|
Fee paid previously with preliminary materials. |
|
|
| ☐ |
|
Fee computed on table in exhibit required by Item 25(b) per Exchange Act Rules 14a-6(i)(1) and 0-11. |
Response to Institutional Shareholder Services July 2023 BlackRock ESG Capital Allocation Term Trust (ECAT) IPO Date: September
2021
Executive Summary We respectfully disagree with Institutional Shareholders Services’ (“ISS”) conclusion that change is
warranted for BlackRock ESG Capital Allocation Term Trust (“ECAT” or the “Fund”) as the facts show that ECAT has outperformed its Morningstar Tactical Allocation1 peers on all five factors that ISS examines to analyze closed-end fund (“CEF”) performance 1) Total Shareholder Return – ECAT has outperformed peers by approximately 7% since inception 2) NAV Discount – ECAT trades at a narrower discount than its
peer group, driven by strong performance and proactive measures implemented by the Fund’s Board of Trustees 3) Distributions – ECAT’s distribution rate has increased 25% since inception while the peer group has decreased by -25% over the same time period. Since inception, 52% of ECAT’s distributions have been comprised of income or net capital gains2. Additionally, tax characteristics of distributions don’t reflect unrealized
gains or realized capital gains that were offset by realized capital losses which are classified as return of capital from a tax perspective 4) Expense Ratio – ECAT has the lowest expense ratio in its peer group 5) Corporate Governance –
the Board of Trustees has created significant shareholder value by implementing a built-in NAV liquidity event, open market share repurchases and a management fee reduction (via contractual fee waiver) that
led to ECAT being purchased by the largest ETF of CEFs, driving incremental demand We also believe ISS should consider NAV returns when analyzing relative performance • Market value is driven by factors outside of Board control and therefore
NAV return should be given at least equal consideration • ECAT has outperformed peers by more than 9% since inception on NAV, including outperforming peers by more than 3% from inception to the unaffected date on NAV • Since the unaffected
date, ECAT has outperformed peers by 8% on NAV, supporting a narrowing of the Fund’s discount on an absolute basis and relative to peers (1) The Morningstar Tactical Allocation peer group consists of 10 funds. (2) Reflects actual tax
characteristics from ECAT’s 1099 statements for the 2021 and 2022 calendar years, not Section 19 notices which are only estimates and subject to change.
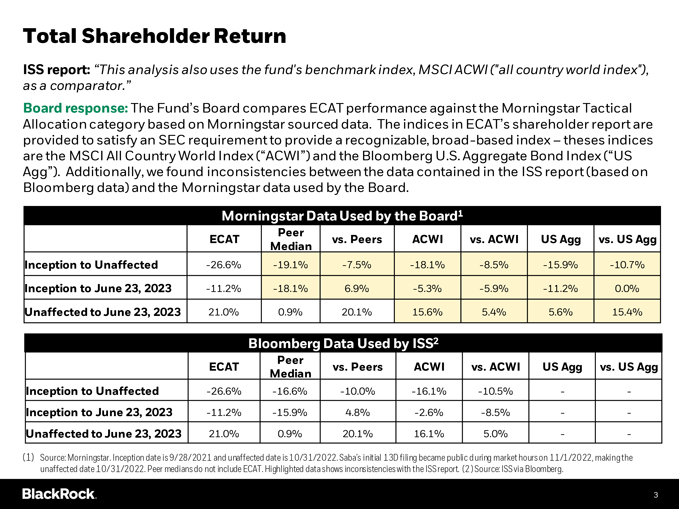
Total Shareholder Return ISS report: “This analysis also uses the fund’s benchmark index, MSCI ACWI (“all country world
index”), as a comparator.” Board response: The Fund’s Board compares ECAT performance against the Morningstar Tactical Allocation category based on Morningstar sourced data. The indices in ECAT’s shareholder report are provided
to satisfy an SEC requirement to provide a recognizable, broad-based index – theses indices are the MSCI All Country World Index (“ACWI”) and the Bloomberg U.S. Aggregate Bond Index (“US Agg”). Additionally, we found
inconsistencies between the data contained in the ISS report (based on Bloomberg data) and the Morningstar data used by the Board. Morningstar Data Used by the Board1 Peer ECAT vs. Peers ACWI vs. ACWI US Agg vs. US Agg Median Inception to Unaffected
-26.6% -19.1% -7.5% -18.1% -8.5% -15.9% -10.7% Inception to June 23, 2023 -11.2% -18.1% 6.9%
-5.3% -5.9% -11.2% 0.0% Unaffected to June 23, 2023 21.0% 0.9% 20.1% 15.6% 5.4% 5.6% 15.4% Bloomberg Data Used by ISS2 Peer
ECAT vs. Peers ACWI vs. ACWI US Agg vs. US Agg Median Inception to Unaffected -26.6% -16.6% -10.0%
-16.1% -10.5% —Inception to June 23, 2023 -11.2% -15.9% 4.8% -2.6% -8.5% —Unaffected to June 23, 2023 21.0% 0.9% 20.1% 16.1% 5.0% — (1) Source: Morningstar. Inception date is 9/28/2021 and unaffected date is 10/31/2022.
Saba’s initial 13D filing became public during market hours on 11/1/2022, making the unaffected date 10/31/2022. Peer medians do not include ECAT. Highlighted data shows inconsistencies with the ISS report. (2) Source: ISS via
Bloomberg.
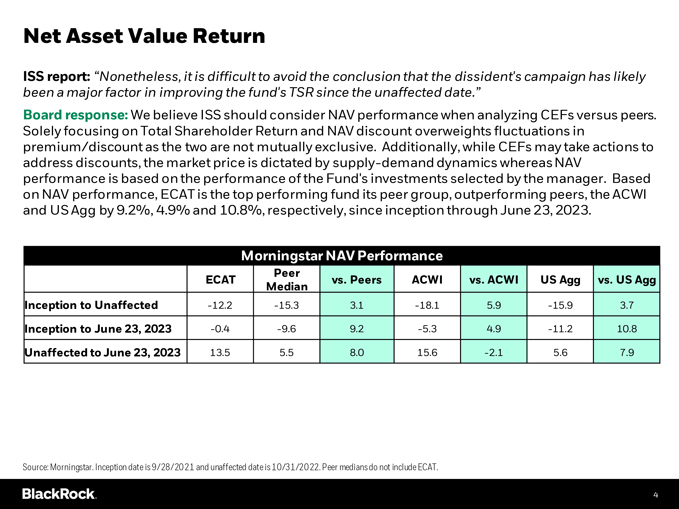
Net Asset Value Return ISS report: “Nonetheless, it is difficult to avoid the conclusion that the dissident’s campaign has
likely been a major factor in improving the fund’s TSR since the unaffected date.” Board response: We believe ISS should consider NAV performance when analyzing CEFs versus peers. Solely focusing on Total Shareholder Return and NAV
discount overweights fluctuations in premium/discount as the two are not mutually exclusive. Additionally, while CEFs may take actions to address discounts, the market price is dictated by supply-demand dynamics whereas NAV performance is based on
the performance of the Fund’s investments selected by the manager. Based on NAV performance, ECAT is the top performing fund its peer group, outperforming peers, the ACWI and US Agg by 9.2%, 4.9% and 10.8%, respectively, since inception through
June 23, 2023. Morningstar NAV Performance Peer ECAT vs. Peers ACWI vs. ACWI US Agg vs. US Agg Median Inception to Unaffected -12.2 -15.3 3.1 -18.1 5.9 -15.9 3.7 Inception to June 23, 2023 -0.4 -9.6 9.2 -5.3 4.9 -11.2 10.8 Unaffected to June 23, 2023 13.5 5.5 8.0 15.6 -2.1 5.6 7.9 Source: Morningstar. Inception date is 9/28/2021
and unaffected date is 10/31/2022. Peer medians do not include ECAT.
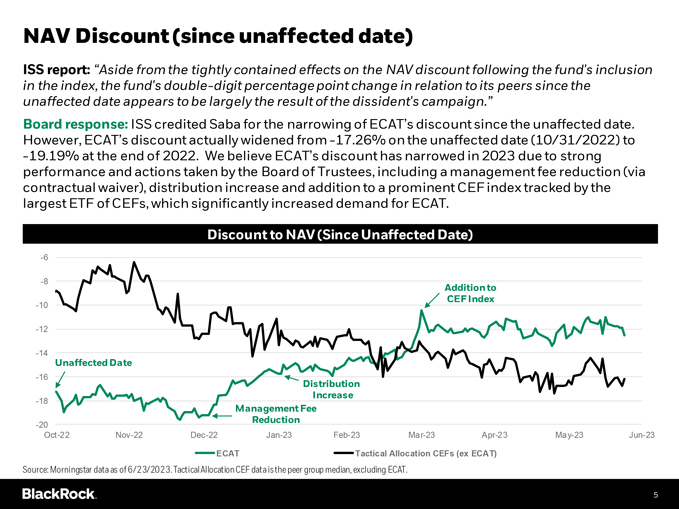
NAV Discount (since unaffected date) ISS report: “Aside from the tightly contained effects on the NAV discount following the
fund’s inclusion in the index, the fund’s double-digit percentage point change in relation to its peers since the unaffected date appears to be largely the result of the dissident’s campaign.” Board response: ISS credited Saba
for the narrowing of ECAT’s discount since the unaffected date. However, ECAT’s discount actually widened from -17.26% on the unaffected date (10/31/2022)
to -19.19% at the end of 2022. We believe ECAT’s discount has narrowed in 2023 due to strong performance and
actions taken by the Board of Trustees, including a management fee reduction (via contractual waiver), distribution increase and addition to a prominent CEF index tracked by the largest ETF of CEFs, which significantly increased demand for ECAT.
Discount to NAV (Since Unaffected Date) -6 -8 Addition to CEF Index -10 -12 -14 Unaffected Date -16 Distribution Increase -18 Management Fee Reduction -20 Oct-22 Nov-22 Dec-22 Jan-23 Feb-23 Mar-23 Apr-23 May-23 Jun-23 ECAT Tactical Allocation CEFs (ex ECAT) Source: Morningstar data as
of 6/23/2023. Tactical Allocation CEF data is the peer group median, excluding ECAT.
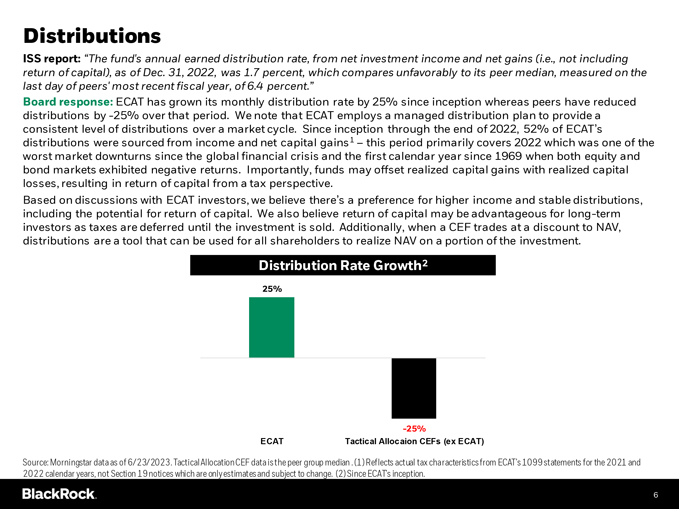
Distributions ISS report: “The fund’s annual earned distribution rate, from net investment income and net gains (i.e., not
including return of capital), as of Dec. 31, 2022, was 1.7 percent, which compares unfavorably to its peer median, measured on the last day of peers’ most recent fiscal year, of 6.4 percent.” Board response: ECAT has grown its
monthly distribution rate by 25% since inception whereas peers have reduced distributions by -25% over that period. We note that ECAT employs a managed distribution plan to provide a consistent level of
distributions over a market cycle. Since inception through the end of 2022, 52% of ECAT’s distributions were sourced from income and net capital gains1 – this period primarily covers 2022 which was one of the worst market downturns since
the global financial crisis and the first calendar year since 1969 when both equity and bond markets exhibited negative returns. Importantly, funds may offset realized capital gains with realized capital losses, resulting in return of capital from a
tax perspective. Based on discussions with ECAT investors, we believe there’s a preference for higher income and stable distributions, including the potential for return of capital. We also believe return of capital may
be advantageous for long-term investors as taxes are deferred until the investment is sold. Additionally, when a CEF trades at a discount to NAV, distributions are a tool that can be used for all shareholders to realize NAV on a portion of the
investment. Distribution Rate Growth2 25% -25% ECAT Tactical Allocaion CEFs (ex ECAT) Source: Morningstar data as of 6/23/2023. Tactical Allocation CEF data is the peer group median . (1) Reflects actual tax
characteristics from ECAT’s 1099 statements for the 2021 and 2022 calendar years, not Section 19 notices which are only estimates and subject to change. (2) Since ECAT’s inception.
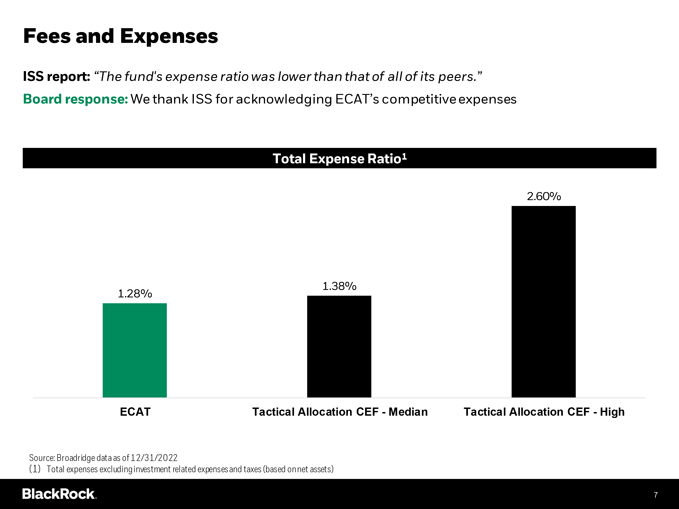
Fees and Expenses ISS report: “The fund’s expense ratio was lower than that of all of its peers.” Board response: We
thank ISS for acknowledging ECAT’s competitive expenses Total Expense Ratio1 2.60% 1.38% 1.28% ECAT Tactical Allocation CEF—Median Tactical Allocation CEF—High Source: Broadridge data as of 12/31/2022 (1) Total expenses excluding
investment related expenses and taxes (based on net assets)
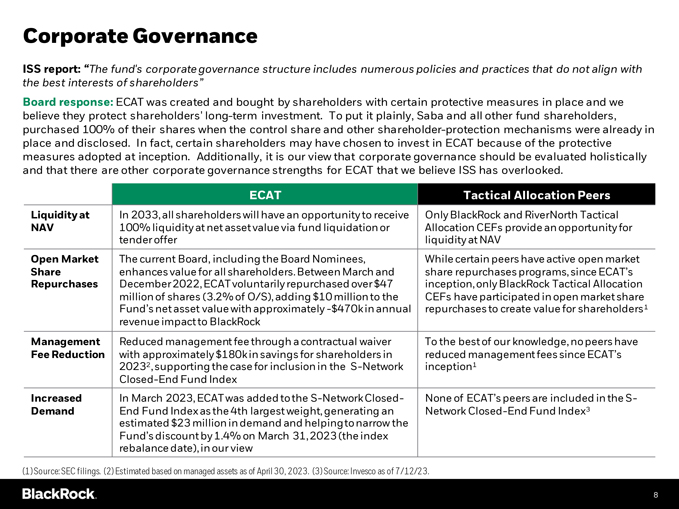
Corporate Governance ISS report: “The fund’s corporate governance structure includes numerous policies and practices that do
not align with the best interests of shareholders” Board response: ECAT was created and bought by shareholders with certain protective measures in place and we believe they protect shareholders’ long-term investment. To put it plainly,
Saba and all other fund shareholders, purchased 100% of their shares when the control share and other shareholder-protection mechanisms were already in place and disclosed. In fact, certain shareholders may have chosen to invest in ECAT because of
the protective measures adopted at inception. Additionally, it is our view that corporate governance should be evaluated holistically and that there are other corporate governance strengths for ECAT that we believe ISS has overlooked. ECAT Tactical
Allocation Peers Liquidity at In 2033, all shareholders will have an opportunity to receive Only BlackRock and RiverNorth Tactical NAV 100% liquidity at net asset value via fund liquidation or Allocation CEFs provide an opportunity for tender offer
liquidity at NAV Open Market The current Board, including the Board Nominees, While certain peers have active open market Share enhances value for all shareholders. Between March and share repurchases programs, since ECAT’s Repurchases December
2022, ECAT voluntarily repurchased over $47 inception, only BlackRock Tactical Allocation million of shares (3.2% of O/S), adding $10 million to the CEFs have participated in open market share Fund’s net asset value with approximately
-$470k in annual repurchases to create value for shareholders1 revenue impact to BlackRock Management Reduced management fee through a contractual waiver To the best of our knowledge, no peers have Fee Reduction with approximately $180k in savings
for shareholders in reduced management fees since ECAT’s 20232, supporting the case for inclusion in the S-Network inception1 Closed-End Fund Index Increased In
March 2023, ECAT was added to the S-Network Closed- None of ECAT’s peers are included in the S-Demand End Fund Index as the 4th largest weight, generating an
Network Closed-End Fund Index3 estimated $23 million in demand and helping to narrow the Fund’s discount by 1.4% on March 31, 2023 (the index rebalance date), in our view (1) Source: SEC
filings. (2) Estimated based on managed assets as of April 30, 2023. (3) Source: Invesco as of 7/12/23.
BlackRock ESG Capital Al... (NYSE:ECAT)
과거 데이터 주식 차트
부터 4월(4) 2024 으로 5월(5) 2024

BlackRock ESG Capital Al... (NYSE:ECAT)
과거 데이터 주식 차트
부터 5월(5) 2023 으로 5월(5) 2024
