CARPENTER TECHNOLOGY CORP false 0000017843 0000017843 2023-10-26 2023-10-26
UNITED STATES
SECURITIES AND EXCHANGE COMMISSION
Washington, D.C. 20549
Form 8-K
CURRENT REPORT
PURSUANT TO SECTION 13 OR 15(d)
OF THE SECURITIES EXCHANGE ACT OF 1934
Date of Report: October 26, 2023
CARPENTER TECHNOLOGY CORPORATION
(Exact name of registrant as specified in its charter)
|
|
|
|
|
| Delaware |
|
1-5828 |
|
23-0458500 |
(State of or other jurisdiction
of incorporation) |
|
(Commission File Number) |
|
(IRS Employer I.D. No.) |
|
|
|
| 1735 Market Street Philadelphia, Pennsylvania |
|
19103 |
| (Address of principal executive offices) |
|
(Zip Code) |
(610) 208-2000
Registrant’s telephone number, including area code
Check the appropriate box below if the Form 8-K filing is intended to simultaneously satisfy the filing obligation of the registrant under any of the following provisions:
| ☐ |
Written communications pursuant to Rule 425 under the Securities Act (17 CFR 230.425) |
| ☐ |
Soliciting material pursuant to Rule 14a-12 under the Exchange Act (17 CFR 240.14a-12) |
| ☐ |
Pre-commencement communications pursuant to Rule 14d-2(b) under the Exchange Act (17 CFR 240.14d-2(b)) |
| ☐ |
Pre-commencement communications pursuant to Rule 13e-4(c) under the Exchange Act (17 CFR 240.13e-4(c)) |
Securities registered or required to be registered pursuant to Section 12(b) of the Act:
|
|
|
|
|
| Title of each class |
|
Trading
Symbol |
|
Name of each exchange on which registered |
| Common Stock, $5 Par Value |
|
CRS |
|
New York Stock Exchange |
Indicate by check mark whether the registrant is an emerging growth company as defined in Rule 405 of the Securities Act of 1933 (§230.405 of this chapter) or Rule 12b-2 of the Securities Exchange Act of 1934 (§240.12b.2 of this chapter).
Emerging growth company ☐
If an emerging growth company, indicate by check mark if the registrant has elected not to use the extended transition period for complying with any new or revised financial accounting standards provided pursuant to Section 13(a) of the Exchange Act. ☐
Item 2.02 - Results of Operations and Financial Condition.
On October 26, 2023, Carpenter Technology Corporation held its first quarter fiscal year 2024 earnings call, broadcast live by webcast. A copy of the slides presented during the call are furnished as Exhibit 99.1 to this Form 8-K and shall not be deemed to be “filed” for any purpose.
Item 9.01 - Financial Statements and Exhibits
(d) Exhibits
Pursuant to the requirements of the Securities Exchange Act of 1934, the registrant has duly caused this report to be signed on its behalf by the undersigned hereunto duly authorized.
|
|
|
| CARPENTER TECHNOLOGY CORPORATION |
|
|
| By |
|
/s/ Timothy Lain |
|
|
Timothy Lain |
|
|
Senior Vice President and Chief Financial Officer |
Date: October 31, 2023

Exhibit 99.1 O c t o b e r 2 6 , 202 3 CARPENTER TECHNOLOGY CORPORATION
st 1 Quarter Fiscal Year 2024 Earnings Call
Cautionary Statement Forward-looking statements This presentation
contains forward-looking statements within the meaning of the Private Securities Litigation Act of 1995. These forward-looking statements are subject to risks and uncertainties that could cause actual results to differ from those projected,
anticipated or implied. The most significant of these uncertainties are described in Carpenter Technology’s filings with the Securities and Exchange Commission, including its report on Form 10-K for the fiscal year ended June 30, 2023, and the
exhibits attached to that filing. They include but are not limited to: (1) the cyclical nature of the specialty materials business and certain end-use markets, including aerospace, defense, medical, transportation, energy, industrial and consumer,
or other influences on Carpenter Technology's business such as new competitors, the consolidation of competitors, customers, and suppliers or the transfer of manufacturing capacity from the United States to foreign countries; (2) the ability of
Carpenter Technology to achieve cash generation, growth, earnings, profitability, operating income, cost savings and reductions, qualifications, productivity improvements or process changes; (3) the ability to recoup increases in the cost of energy,
raw materials, freight or other factors; (4) domestic and foreign excess manufacturing capacity for certain metals; (5) fluctuations in currency exchange and interest rates; (6) the effect of government trade actions; (7) the valuation of the assets
and liabilities in Carpenter Technology's pension trusts and the accounting for pension plans; (8) possible labor disputes or work stoppages; (9) the potential that our customers may substitute alternate materials or adopt different manufacturing
practices that replace or limit the suitability of our products; (10) the ability to successfully acquire and integrate acquisitions; (11) the availability of credit facilities to Carpenter Technology, its customers or other members of the supply
chain; (12) the ability to obtain energy or raw materials, especially from suppliers located in countries that may be subject to unstable political or economic conditions; (13) Carpenter Technology's manufacturing processes are dependent upon highly
specialized equipment located primarily in facilities in Reading and Latrobe, Pennsylvania and Athens, Alabama for which there may be limited alternatives if there are significant equipment failures or a catastrophic event; (14) the ability to hire
and retain a qualified workforce and key personnel, including members of the executive management team, management, metallurgists and other skilled personnel; (15) fluctuations in oil and gas prices and production; (16) the impact of potential cyber
attacks and information technology or data security breaches; (17) the inability of suppliers to meet obligations due to supply chain disruptions or otherwise; (18) the inability to meet increased demand, production targets or commitments; (19) the
ability to manage the impacts of natural disasters, climate change, pandemics and outbreaks of contagious diseases and other adverse public health developments, such as the COVID-19 pandemic; and (20) geopolitical, economic, and regulatory risks
relating to our global business, including geopolitical and diplomatic tensions, instabilities and conflicts, such as the war in Ukraine and the war between Israel and HAMAS, as well as compliance with U.S. and foreign trade and tax laws, sanctions,
embargoes and other regulations. Any of these factors could have an adverse and/or fluctuating effect on Carpenter Technology's results of operations. The forward-looking statements in this document are intended to be subject to the safe harbor
protection provided by Section 27A of the Securities Act of 1933, as amended (the Securities Act ), and Section 21E of the Securities Exchange Act of 1934, as amended. We caution you not to place undue reliance on forward-looking statements, which
speak only as of the date of this presentation or as of the dates otherwise indicated in such forward- looking statements. Carpenter Technology undertakes no obligation to update or revise any forward-looking statements. Non-GAAP and other financial
measures Financial information included in this presentation is unaudited. Some of the information included in this presentation is derived from Carpenter Technology's consolidated financial information but is not presented in Carpenter Technology's
financial statements prepared in accordance with U.S. Generally Accepted Accounting Principles (GAAP). Certain of these data are considered “non-GAAP financial measures” under SEC rules. These non-GAAP financial measures supplement our
GAAP disclosures and should not be considered an alternative to the GAAP measure. Reconciliations to the most directly comparable GAAP financial measures and management’s rationale for the use of the non-GAAP financial measures can be found in
the Appendix to this presentation. © 2023 CRS Holdings, LLC. All rights reserved. 2
st 1 QUARTER FISCAL YEAR 2024 Tony Thene | President and Chief Executive
Officer 3
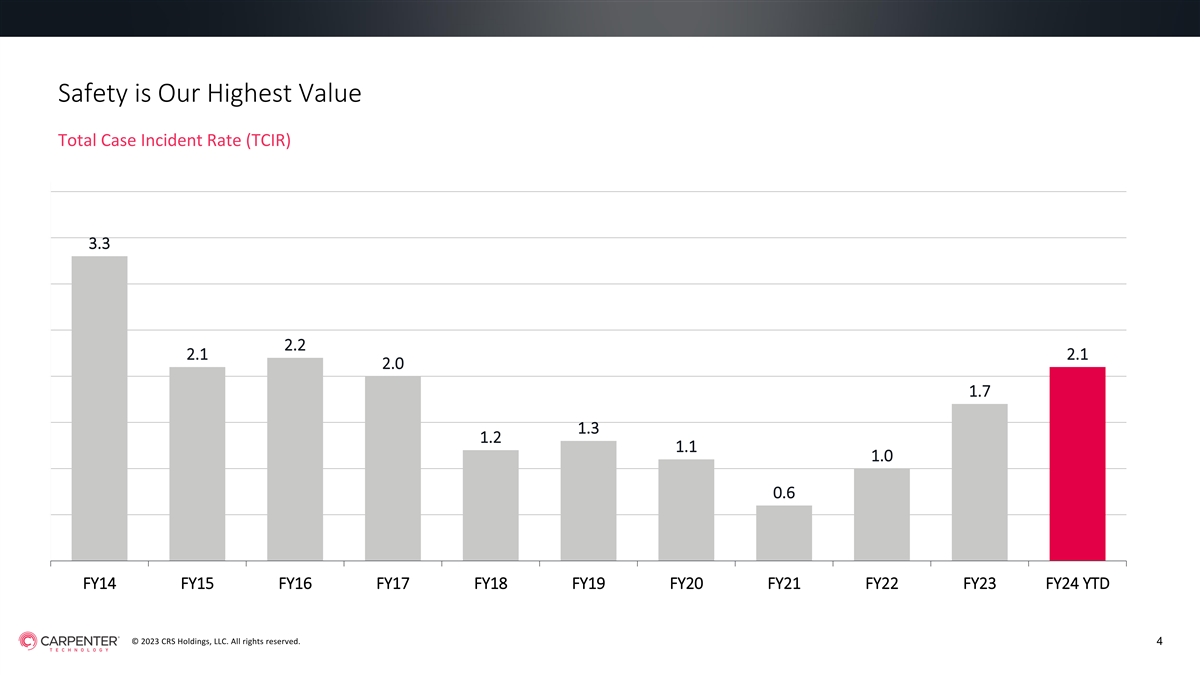
Safety is Our Highest Value Total Case Incident Rate (TCIR) 4 3.5 3.3 3
2.5 2.2 2.1 2.1 2.0 2 1.7 1.5 1.3 1.2 1.1 1.0 1 0.6 0.5 0 FY14 FY15 FY16 FY17 FY18 FY19 FY20 FY21 FY22 FY23 FY24 YTD © 2023 CRS Holdings, LLC. All rights reserved. 4
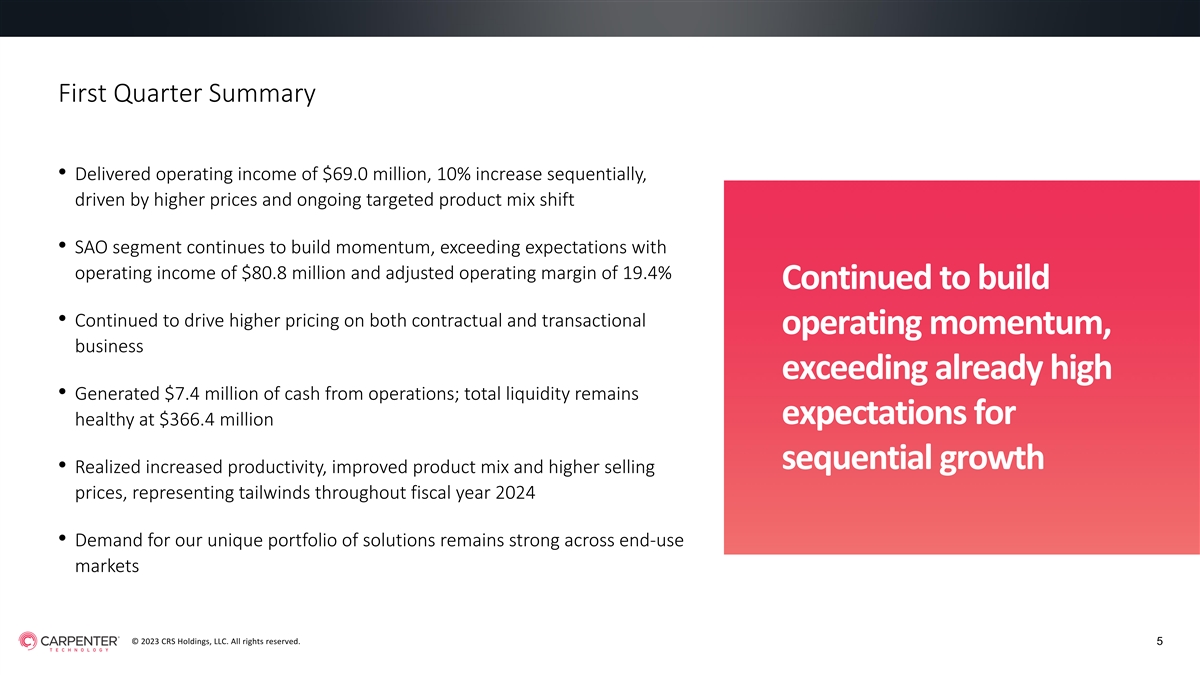
First Quarter Summary • Delivered operating income of $69.0
million, 10% increase sequentially, driven by higher prices and ongoing targeted product mix shift • SAO segment continues to build momentum, exceeding expectations with operating income of $80.8 million and adjusted operating margin of 19.4%
Continued to build • Continued to drive higher pricing on both contractual and transactional operating momentum, business exceeding already high • Generated $7.4 million of cash from operations; total liquidity remains expectations for
healthy at $366.4 million sequential growth • Realized increased productivity, improved product mix and higher selling prices, representing tailwinds throughout fiscal year 2024 • Demand for our unique portfolio of solutions remains
strong across end-use markets © 2023 CRS Holdings, LLC. All rights reserved. 5
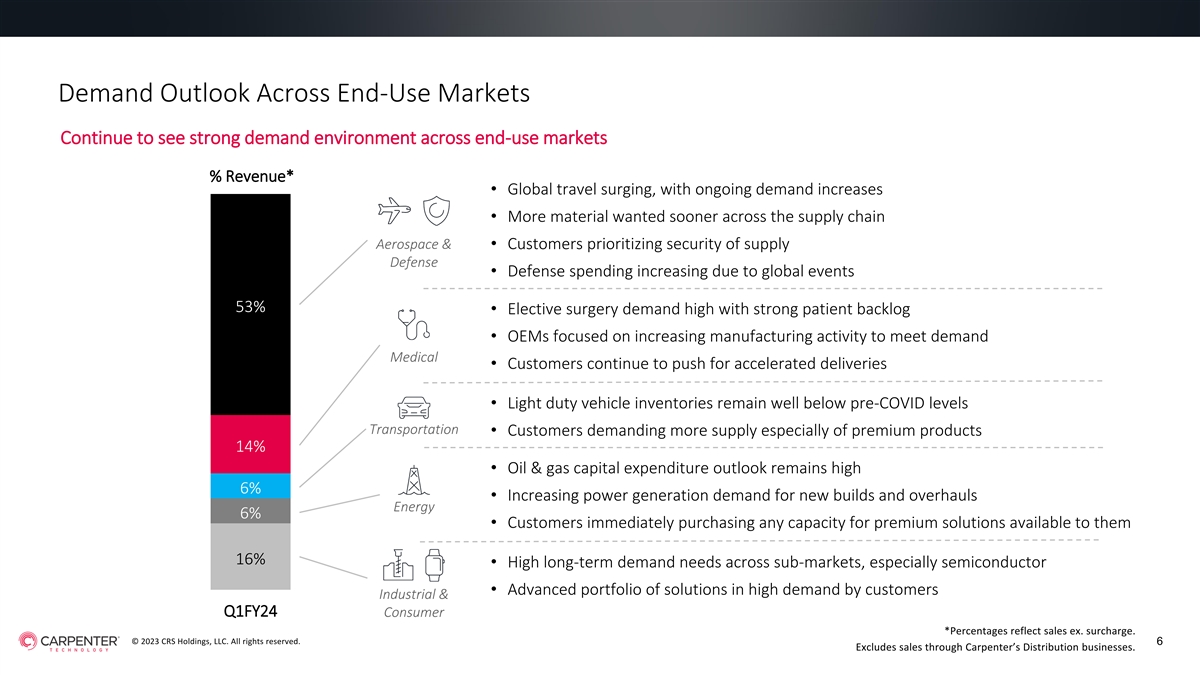
Demand Outlook Across End-Use Markets Continue to see strong demand
environment across end-use markets 100% % Revenue* • Global travel surging, with ongoing demand increases • More material wanted sooner across the supply chain Aerospace & • Customers prioritizing security of supply Defense
• Defense spending increasing due to global events 53% • Elective surgery demand high with strong patient backlog • OEMs focused on increasing manufacturing activity to meet demand Medical • Customers continue to push for
accelerated deliveries • Light duty vehicle inventories remain well below pre-COVID levels Transportation • Customers demanding more supply especially of premium products 14% • Oil & gas capital expenditure outlook remains high
6% • Increasing power generation demand for new builds and overhauls Energy 6% • Customers immediately purchasing any capacity for premium solutions available to them 16% • High long-term demand needs across sub-markets, especially
semiconductor • Advanced portfolio of solutions in high demand by customers Industrial & Q1FY24 Consumer *Percentages reflect sales ex. surcharge. © 2023 CRS Holdings, LLC. All rights reserved. 6 Excludes sales through
Carpenter’s Distribution businesses.
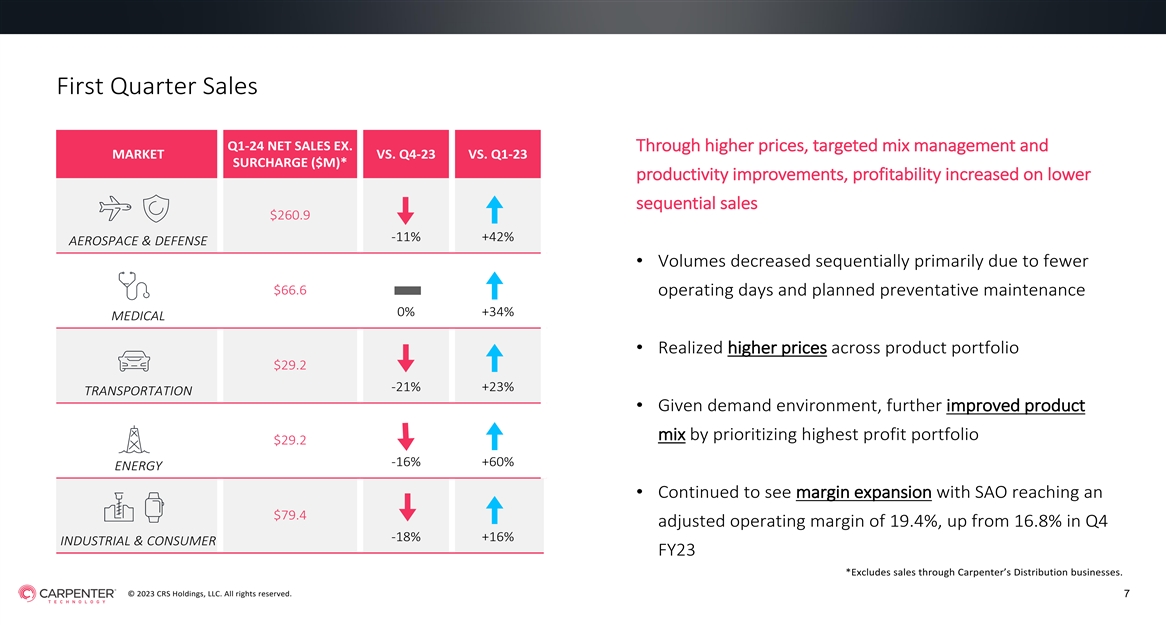
First Quarter Sales Q1-24 NET SALES EX. Through higher prices, targeted
mix management and MARKET VS. Q4-23 VS. Q1-23 SURCHARGE ($M)* productivity improvements, profitability increased on lower sequential sales $260.9 -11% +42% AEROSPACE & DEFENSE • Volumes decreased sequentially primarily due to fewer $66.6
operating days and planned preventative maintenance 0% +34% MEDICAL • Realized higher prices across product portfolio $29.2 -21% +23% TRANSPORTATION • Given demand environment, further improved product mix by prioritizing highest profit
portfolio $29.2 -16% +60% ENERGY • Continued to see margin expansion with SAO reaching an $79.4 adjusted operating margin of 19.4%, up from 16.8% in Q4 -18% +16% INDUSTRIAL & CONSUMER FY23 *Excludes sales through Carpenter’s
Distribution businesses. © 2023 CRS Holdings, LLC. All rights reserved. 7
st 1 QUARTER FISCAL YEAR 2024 FINANCIAL OVERVIEW AND BUSINESS UPDATE Tim
Lain | Senior Vice President and Chief Financial Officer 8
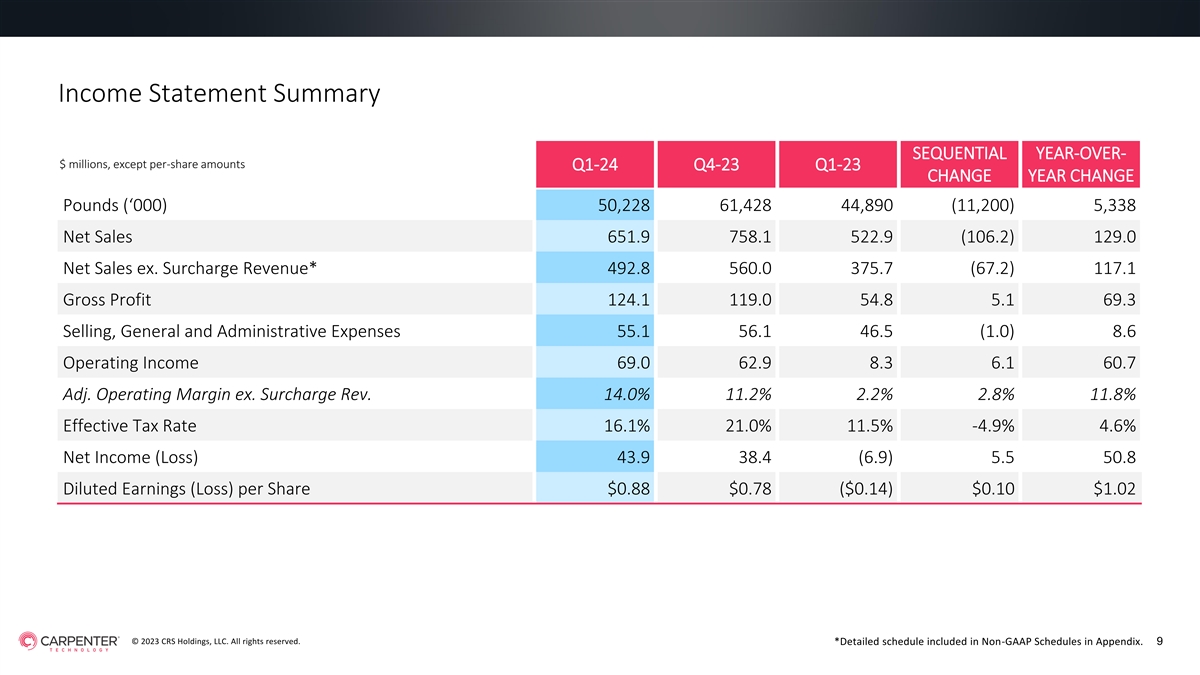
Income Statement Summary SEQUENTIAL YEAR-OVER- $ millions, except
per-share amounts Q1-24 Q4-23 Q1-23 CHANGE YEAR CHANGE Pounds (‘000) 50,228 61,428 44,890 (11,200) 5,338 Net Sales 651.9 758.1 522.9 (106.2) 129.0 Net Sales ex. Surcharge Revenue* 492.8 560.0 375.7 (67.2) 117.1 Gross Profit 124.1 119.0 54.8
5.1 69.3 Selling, General and Administrative Expenses 55.1 56.1 46.5 (1.0) 8.6 Operating Income 69.0 62.9 8.3 6.1 60.7 Adj. Operating Margin ex. Surcharge Rev. 14.0% 11.2% 2.2% 2.8% 11.8% Effective Tax Rate 16.1% 21.0% 11.5% -4.9% 4.6% Net Income
(Loss) 43.9 38.4 (6.9) 5.5 50.8 Diluted Earnings (Loss) per Share $0.88 $0.78 ($0.14) $0.10 $1.02 © 2023 CRS Holdings, LLC. All rights reserved. *Detailed schedule included in Non-GAAP Schedules in Appendix. 9
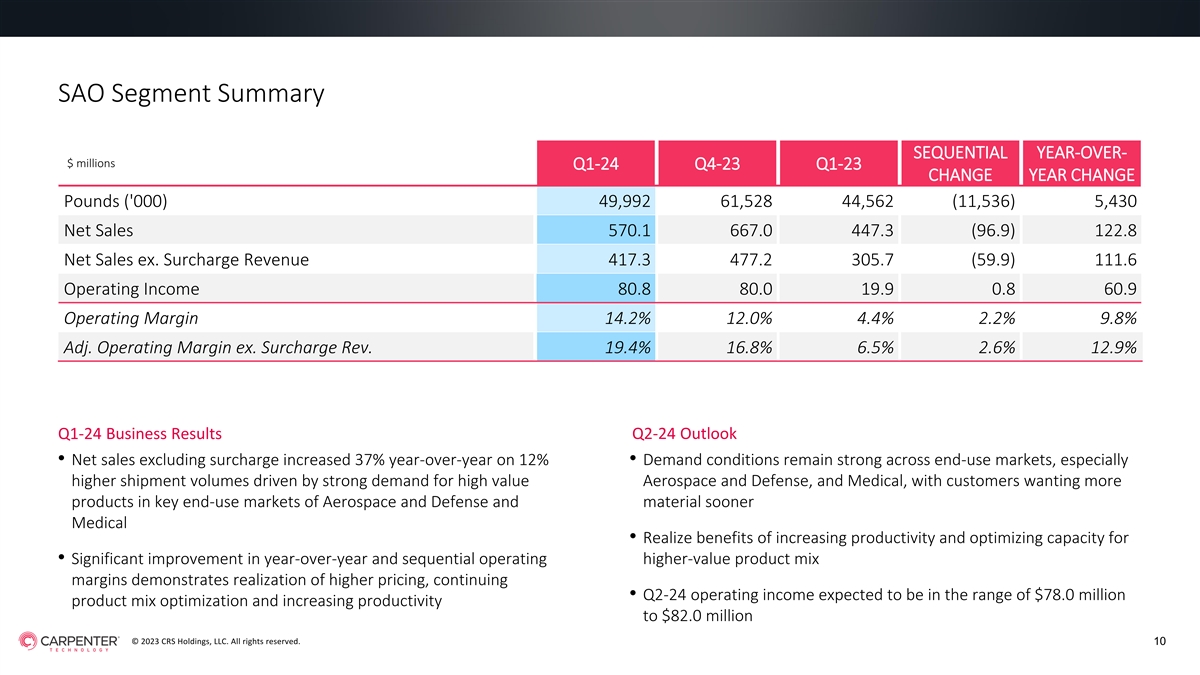
SAO Segment Summary SEQUENTIAL YEAR-OVER- $ millions Q1-24 Q4-23 Q1-23
CHANGE YEAR CHANGE Pounds ('000) 49,992 61,528 44,562 (11,536) 5,430 Net Sales 570.1 667.0 447.3 (96.9) 122.8 Net Sales ex. Surcharge Revenue 417.3 477.2 305.7 (59.9) 111.6 Operating Income 80.8 80.0 19.9 0.8 60.9 Operating Margin 14.2% 12.0% 4.4%
2.2% 9.8% Adj. Operating Margin ex. Surcharge Rev. 19.4% 16.8% 6.5% 2.6% 12.9% Q1-24 Business Results Q2-24 Outlook • Net sales excluding surcharge increased 37% year-over-year on 12% • Demand conditions remain strong across end-use
markets, especially Aerospace and Defense, and Medical, with customers wanting more higher shipment volumes driven by strong demand for high value products in key end-use markets of Aerospace and Defense and material sooner Medical • Realize
benefits of increasing productivity and optimizing capacity for • Significant improvement in year-over-year and sequential operating higher-value product mix margins demonstrates realization of higher pricing, continuing • Q2-24
operating income expected to be in the range of $78.0 million product mix optimization and increasing productivity to $82.0 million © 2023 CRS Holdings, LLC. All rights reserved. 10
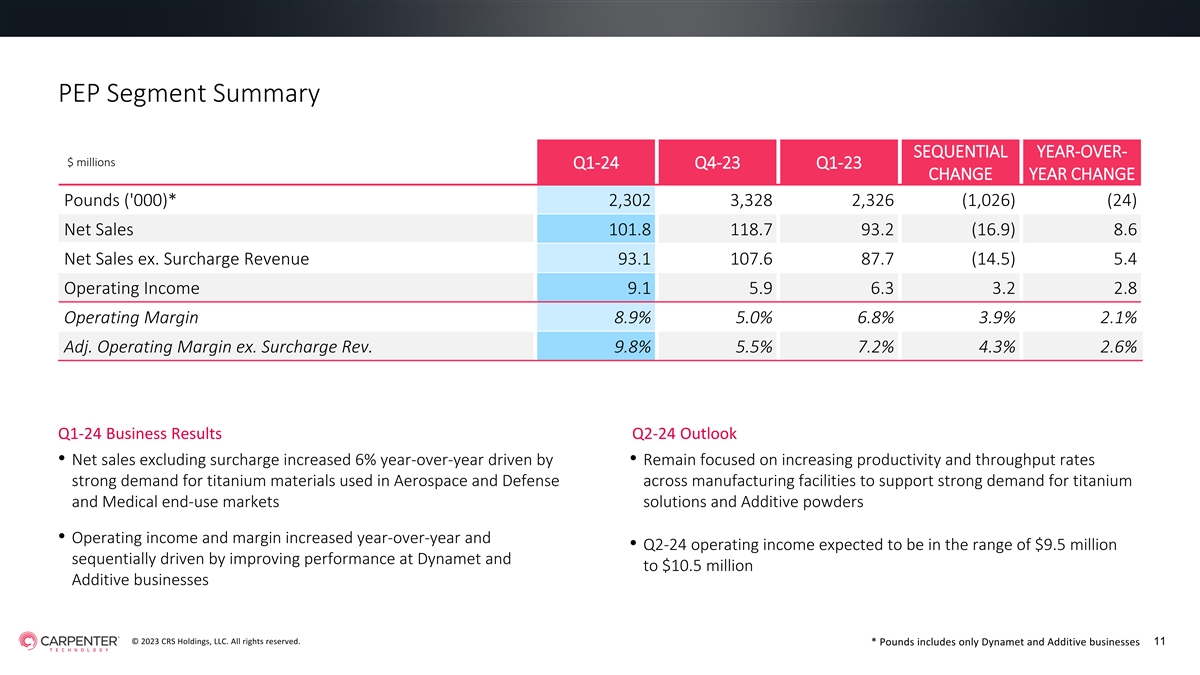
PEP Segment Summary SEQUENTIAL YEAR-OVER- $ millions Q1-24 Q4-23 Q1-23
CHANGE YEAR CHANGE Pounds ('000)* 2,302 3,328 2,326 (1,026) (24) Net Sales 101.8 118.7 93.2 (16.9) 8.6 Net Sales ex. Surcharge Revenue 93.1 107.6 87.7 (14.5) 5.4 Operating Income 9.1 5.9 6.3 3.2 2.8 Operating Margin 8.9% 5.0% 6.8% 3.9% 2.1% Adj.
Operating Margin ex. Surcharge Rev. 9.8% 5.5% 7.2% 4.3% 2.6% Q1-24 Business Results Q2-24 Outlook • Net sales excluding surcharge increased 6% year-over-year driven by • Remain focused on increasing productivity and throughput rates
strong demand for titanium materials used in Aerospace and Defense across manufacturing facilities to support strong demand for titanium and Medical end-use markets solutions and Additive powders • Operating income and margin increased
year-over-year and • Q2-24 operating income expected to be in the range of $9.5 million sequentially driven by improving performance at Dynamet and to $10.5 million Additive businesses © 2023 CRS Holdings, LLC. All rights reserved. *
Pounds includes only Dynamet and Additive businesses 11

Adjusted Free Cash Flow Summary $ millions Q1-24 Q4-23 Q1-23 Net Income
+ Non-Cash Items 90.0 84.2 32.1 Inventory (67.8) 73.2 (121.2) Working Capital / Other (10.2) 17.5 11.1 Total Net Working Capital / Other (78.0) 90.7 (110.1) Pension Plan Contributions (4.6) — — Net Cash Provided from (Used for) Operating
Activities 7.4 174.9 (78.0) Purchases of Property, Plant, Equipment and Software (22.0) (30.8) (13.5) Adjusted Free Cash Flow * (14.6) 144.1 (91.5) Cash 18.1 44.5 52.6 Available Borrowing Under Credit Facility 348.3 348.3 298.2 Total Liquidity 366.4
392.8 350.8 The clerical accuracy of certain amounts may be impacted due to rounding. © 2023 CRS Holdings, LLC. All rights reserved. 12 *Detailed schedule included in Non-GAAP Schedules in Appendix.

st 1 QUARTER FISCAL YEAR 2024 CLOSING COMMENTS Tony Thene | President
and Chief Executive Officer 13
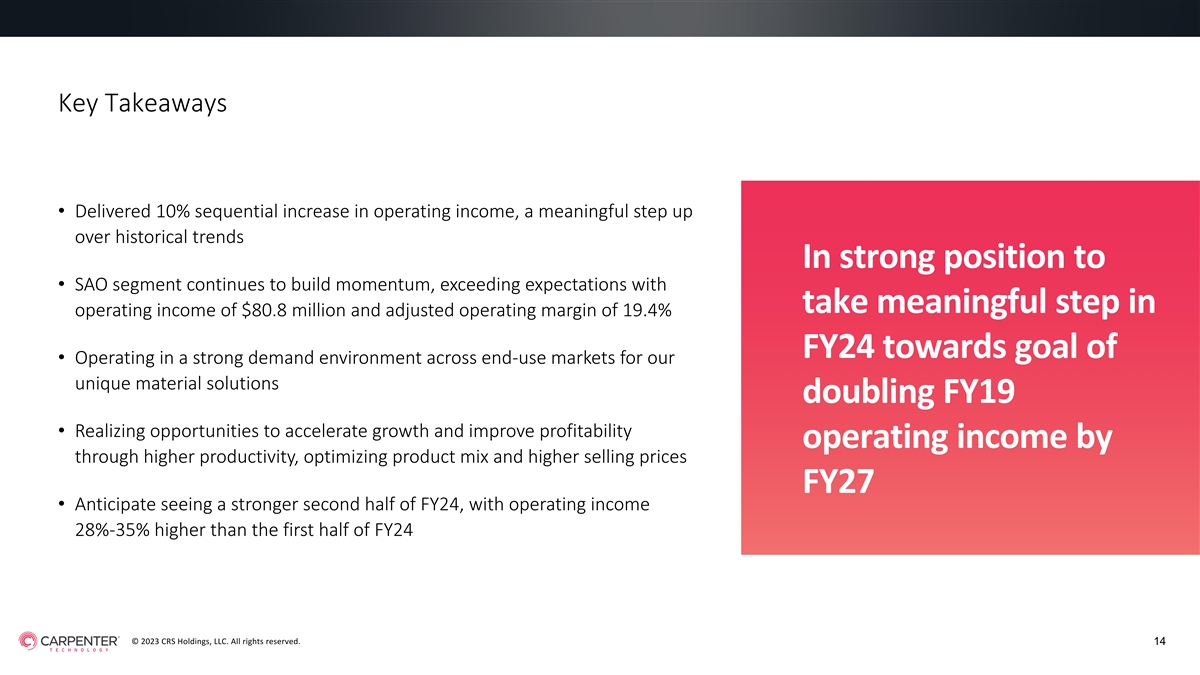
Key Takeaways • Delivered 10% sequential increase in operating
income, a meaningful step up over historical trends In strong position to • SAO segment continues to build momentum, exceeding expectations with take meaningful step in operating income of $80.8 million and adjusted operating margin of 19.4%
FY24 towards goal of • Operating in a strong demand environment across end-use markets for our unique material solutions doubling FY19 • Realizing opportunities to accelerate growth and improve profitability operating income by through
higher productivity, optimizing product mix and higher selling prices FY27 • Anticipate seeing a stronger second half of FY24, with operating income 28%-35% higher than the first half of FY24 © 2023 CRS Holdings, LLC. All rights reserved.
14
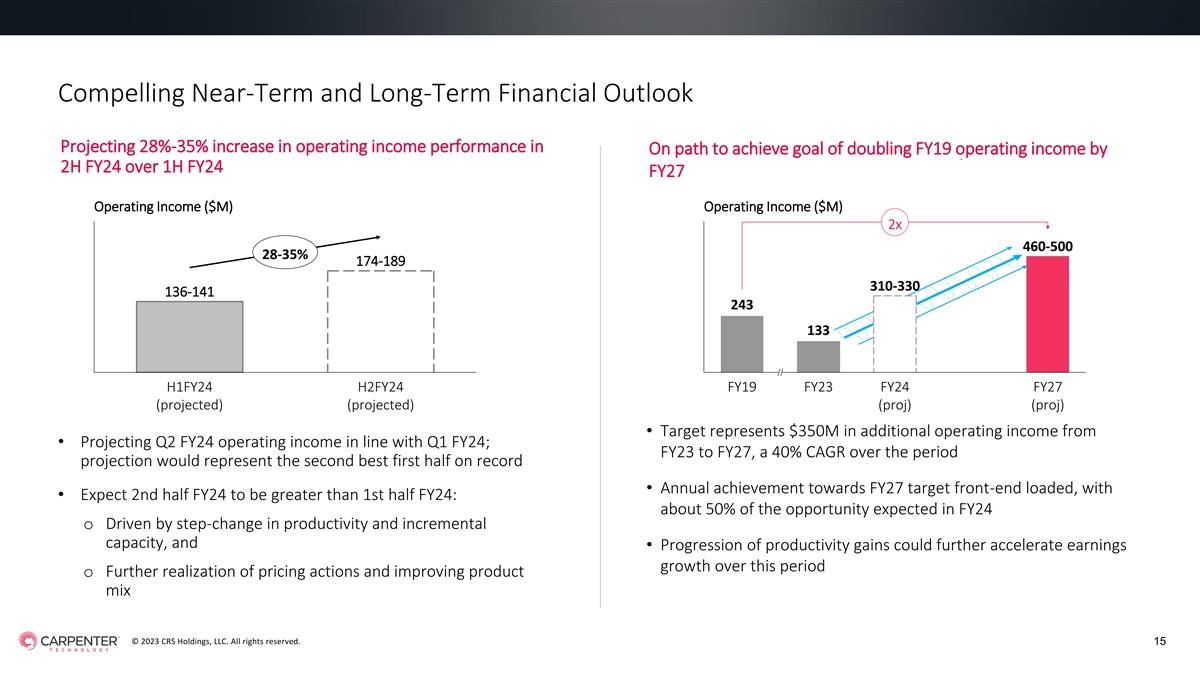
Compelling Near-Term and Long-Term Financial Outlook Projecting 28%-35%
increase in operating income performance in On path to achieve goal of doubling FY19 operating income by 2H FY24 over 1H FY24 FY27 Operating Income ($M) Operating Income ($M) 2x 460-500 28-35% 174-189 310-330 136-141 243 133 H1FY24 H2FY24 FY19 FY23
FY24 FY27 (projected) (projected) (proj) (proj) • Target represents $350M in additional operating income from • Projecting Q2 FY24 operating income in line with Q1 FY24; FY23 to FY27, a 40% CAGR over the period projection would represent
the second best first half on record • Annual achievement towards FY27 target front-end loaded, with • Expect 2nd half FY24 to be greater than 1st half FY24: about 50% of the opportunity expected in FY24 o Driven by step-change in
productivity and incremental capacity, and • Progression of productivity gains could further accelerate earnings growth over this period o Further realization of pricing actions and improving product mix © 2023 CRS Holdings, LLC. All
rights reserved. 15
APPENDIX OF NON-GAAP SCHEDULES 16
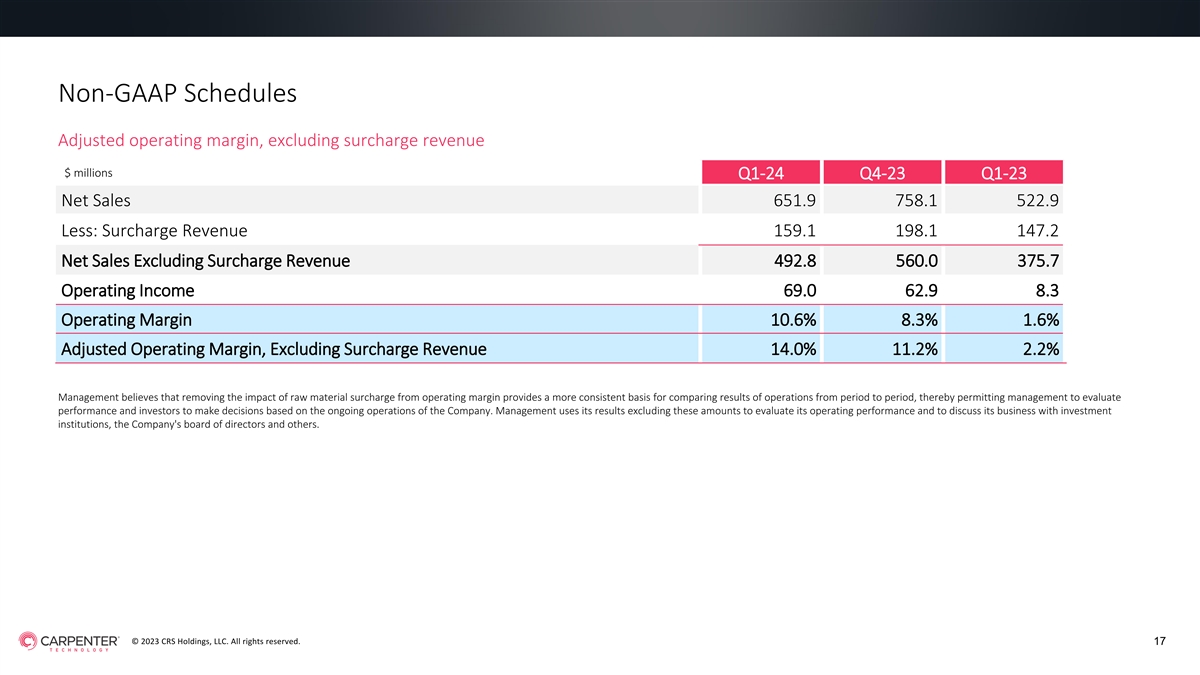
Non-GAAP Schedules Adjusted operating margin, excluding surcharge
revenue $ millions Q1-24 Q4-23 Q1-23 Net Sales 651.9 758.1 522.9 Less: Surcharge Revenue 159.1 198.1 147.2 Net Sales Excluding Surcharge Revenue 492.8 560.0 375.7 Operating Income 69.0 62.9 8.3 Operating Margin 10.6% 8.3% 1.6% Adjusted Operating
Margin, Excluding Surcharge Revenue 14.0% 11.2% 2.2% Management believes that removing the impact of raw material surcharge from operating margin provides a more consistent basis for comparing results of operations from period to period, thereby
permitting management to evaluate performance and investors to make decisions based on the ongoing operations of the Company. Management uses its results excluding these amounts to evaluate its operating performance and to discuss its business with
investment institutions, the Company's board of directors and others. © 2023 CRS Holdings, LLC. All rights reserved. 17

Non-GAAP Schedules Adjusted Free Cash Flow Q1-24 Q4-23 Q1-23 $ millions
Net cash provided from (used for) operating activities 7.4 174.9 (78.0) Purchases of Property, Plant, Equipment and Software (22.0) (30.8) (13.5) Adjusted Free Cash Flow (14.6) 144.1 (91.5) Management believes that the adjusted free cash flow
measure provides useful information to investors regarding the Company’s financial condition because it is a measure of cash generated, which management evaluates for alternative uses. Historically, this non-GAAP financial measure included
cash used for dividends paid on outstanding common stock and participating securities. Management believes that excluding cash dividends paid from adjusted free cash flow will provide a more direct comparison to operating cash flow, a GAAP-defined
financial measure. Fiscal year 2023 has been reclassified to conform to the current presentation. The clerical accuracy of certain amounts may be impacted due to rounding. © 2023 CRS Holdings, LLC. All rights reserved. 18

Your trusted partner in innovation. Carpenter Technology Corporation
(NYSE: CRS) is a global leader in high-performance specialty alloy-based materials and process solutions for critical applications in the aerospace, defense, medical, transportation, energy, industrial and consumer electronics markets. For
additional information, please contact your nearest sales office: info@cartech.com | 610 208 2000 19 carpentertechnology.com
v3.23.3
| X |
- DefinitionBoolean flag that is true when the XBRL content amends previously-filed or accepted submission.
| Name: |
dei_AmendmentFlag |
| Namespace Prefix: |
dei_ |
| Data Type: |
xbrli:booleanItemType |
| Balance Type: |
na |
| Period Type: |
duration |
|
| X |
- DefinitionFor the EDGAR submission types of Form 8-K: the date of the report, the date of the earliest event reported; for the EDGAR submission types of Form N-1A: the filing date; for all other submission types: the end of the reporting or transition period. The format of the date is YYYY-MM-DD.
| Name: |
dei_DocumentPeriodEndDate |
| Namespace Prefix: |
dei_ |
| Data Type: |
xbrli:dateItemType |
| Balance Type: |
na |
| Period Type: |
duration |
|
| X |
- DefinitionThe type of document being provided (such as 10-K, 10-Q, 485BPOS, etc). The document type is limited to the same value as the supporting SEC submission type, or the word 'Other'.
| Name: |
dei_DocumentType |
| Namespace Prefix: |
dei_ |
| Data Type: |
dei:submissionTypeItemType |
| Balance Type: |
na |
| Period Type: |
duration |
|
| X |
- DefinitionAddress Line 1 such as Attn, Building Name, Street Name
| Name: |
dei_EntityAddressAddressLine1 |
| Namespace Prefix: |
dei_ |
| Data Type: |
xbrli:normalizedStringItemType |
| Balance Type: |
na |
| Period Type: |
duration |
|
| X |
- Definition
+ References
+ Details
| Name: |
dei_EntityAddressCityOrTown |
| Namespace Prefix: |
dei_ |
| Data Type: |
xbrli:normalizedStringItemType |
| Balance Type: |
na |
| Period Type: |
duration |
|
| X |
- DefinitionCode for the postal or zip code
| Name: |
dei_EntityAddressPostalZipCode |
| Namespace Prefix: |
dei_ |
| Data Type: |
xbrli:normalizedStringItemType |
| Balance Type: |
na |
| Period Type: |
duration |
|
| X |
- DefinitionName of the state or province.
| Name: |
dei_EntityAddressStateOrProvince |
| Namespace Prefix: |
dei_ |
| Data Type: |
dei:stateOrProvinceItemType |
| Balance Type: |
na |
| Period Type: |
duration |
|
| X |
- DefinitionA unique 10-digit SEC-issued value to identify entities that have filed disclosures with the SEC. It is commonly abbreviated as CIK. Reference 1: http://www.xbrl.org/2003/role/presentationRef
-Publisher SEC
-Name Exchange Act
-Number 240
-Section 12
-Subsection b-2
| Name: |
dei_EntityCentralIndexKey |
| Namespace Prefix: |
dei_ |
| Data Type: |
dei:centralIndexKeyItemType |
| Balance Type: |
na |
| Period Type: |
duration |
|
| X |
- DefinitionIndicate if registrant meets the emerging growth company criteria. Reference 1: http://www.xbrl.org/2003/role/presentationRef
-Publisher SEC
-Name Exchange Act
-Number 240
-Section 12
-Subsection b-2
| Name: |
dei_EntityEmergingGrowthCompany |
| Namespace Prefix: |
dei_ |
| Data Type: |
xbrli:booleanItemType |
| Balance Type: |
na |
| Period Type: |
duration |
|
| X |
- DefinitionCommission file number. The field allows up to 17 characters. The prefix may contain 1-3 digits, the sequence number may contain 1-8 digits, the optional suffix may contain 1-4 characters, and the fields are separated with a hyphen.
| Name: |
dei_EntityFileNumber |
| Namespace Prefix: |
dei_ |
| Data Type: |
dei:fileNumberItemType |
| Balance Type: |
na |
| Period Type: |
duration |
|
| X |
- DefinitionTwo-character EDGAR code representing the state or country of incorporation.
| Name: |
dei_EntityIncorporationStateCountryCode |
| Namespace Prefix: |
dei_ |
| Data Type: |
dei:edgarStateCountryItemType |
| Balance Type: |
na |
| Period Type: |
duration |
|
| X |
- DefinitionThe exact name of the entity filing the report as specified in its charter, which is required by forms filed with the SEC. Reference 1: http://www.xbrl.org/2003/role/presentationRef
-Publisher SEC
-Name Exchange Act
-Number 240
-Section 12
-Subsection b-2
| Name: |
dei_EntityRegistrantName |
| Namespace Prefix: |
dei_ |
| Data Type: |
xbrli:normalizedStringItemType |
| Balance Type: |
na |
| Period Type: |
duration |
|
| X |
- DefinitionThe Tax Identification Number (TIN), also known as an Employer Identification Number (EIN), is a unique 9-digit value assigned by the IRS. Reference 1: http://www.xbrl.org/2003/role/presentationRef
-Publisher SEC
-Name Exchange Act
-Number 240
-Section 12
-Subsection b-2
| Name: |
dei_EntityTaxIdentificationNumber |
| Namespace Prefix: |
dei_ |
| Data Type: |
dei:employerIdItemType |
| Balance Type: |
na |
| Period Type: |
duration |
|
| X |
- DefinitionLocal phone number for entity.
| Name: |
dei_LocalPhoneNumber |
| Namespace Prefix: |
dei_ |
| Data Type: |
xbrli:normalizedStringItemType |
| Balance Type: |
na |
| Period Type: |
duration |
|
| X |
- DefinitionBoolean flag that is true when the Form 8-K filing is intended to satisfy the filing obligation of the registrant as pre-commencement communications pursuant to Rule 13e-4(c) under the Exchange Act. Reference 1: http://www.xbrl.org/2003/role/presentationRef
-Publisher SEC
-Name Exchange Act
-Number 240
-Section 13e
-Subsection 4c
| Name: |
dei_PreCommencementIssuerTenderOffer |
| Namespace Prefix: |
dei_ |
| Data Type: |
xbrli:booleanItemType |
| Balance Type: |
na |
| Period Type: |
duration |
|
| X |
- DefinitionBoolean flag that is true when the Form 8-K filing is intended to satisfy the filing obligation of the registrant as pre-commencement communications pursuant to Rule 14d-2(b) under the Exchange Act. Reference 1: http://www.xbrl.org/2003/role/presentationRef
-Publisher SEC
-Name Exchange Act
-Number 240
-Section 14d
-Subsection 2b
| Name: |
dei_PreCommencementTenderOffer |
| Namespace Prefix: |
dei_ |
| Data Type: |
xbrli:booleanItemType |
| Balance Type: |
na |
| Period Type: |
duration |
|
| X |
- DefinitionTitle of a 12(b) registered security. Reference 1: http://www.xbrl.org/2003/role/presentationRef
-Publisher SEC
-Name Exchange Act
-Number 240
-Section 12
-Subsection b
| Name: |
dei_Security12bTitle |
| Namespace Prefix: |
dei_ |
| Data Type: |
dei:securityTitleItemType |
| Balance Type: |
na |
| Period Type: |
duration |
|
| X |
- DefinitionName of the Exchange on which a security is registered. Reference 1: http://www.xbrl.org/2003/role/presentationRef
-Publisher SEC
-Name Exchange Act
-Number 240
-Section 12
-Subsection d1-1
| Name: |
dei_SecurityExchangeName |
| Namespace Prefix: |
dei_ |
| Data Type: |
dei:edgarExchangeCodeItemType |
| Balance Type: |
na |
| Period Type: |
duration |
|
| X |
- DefinitionBoolean flag that is true when the Form 8-K filing is intended to satisfy the filing obligation of the registrant as soliciting material pursuant to Rule 14a-12 under the Exchange Act. Reference 1: http://www.xbrl.org/2003/role/presentationRef
-Publisher SEC
-Name Exchange Act
-Section 14a
-Number 240
-Subsection 12
| Name: |
dei_SolicitingMaterial |
| Namespace Prefix: |
dei_ |
| Data Type: |
xbrli:booleanItemType |
| Balance Type: |
na |
| Period Type: |
duration |
|
| X |
- DefinitionTrading symbol of an instrument as listed on an exchange.
| Name: |
dei_TradingSymbol |
| Namespace Prefix: |
dei_ |
| Data Type: |
dei:tradingSymbolItemType |
| Balance Type: |
na |
| Period Type: |
duration |
|
| X |
- DefinitionBoolean flag that is true when the Form 8-K filing is intended to satisfy the filing obligation of the registrant as written communications pursuant to Rule 425 under the Securities Act. Reference 1: http://www.xbrl.org/2003/role/presentationRef
-Publisher SEC
-Name Securities Act
-Number 230
-Section 425
| Name: |
dei_WrittenCommunications |
| Namespace Prefix: |
dei_ |
| Data Type: |
xbrli:booleanItemType |
| Balance Type: |
na |
| Period Type: |
duration |
|
Carpenter Technology (NYSE:CRS)
과거 데이터 주식 차트
부터 4월(4) 2024 으로 5월(5) 2024

Carpenter Technology (NYSE:CRS)
과거 데이터 주식 차트
부터 5월(5) 2023 으로 5월(5) 2024
