false
0001157647
0001157647
2024-01-23
2024-01-23
iso4217:USD
xbrli:shares
iso4217:USD
xbrli:shares
UNITED
STATES
SECURITIES
AND EXCHANGE COMMISSION
Washington,
D.C. 20549
FORM
8-K
CURRENT REPORT
Pursuant to Section 13 or 15(d) of the
Securities Exchange Act of 1934
Date of Report (Date of earliest event reported):
January 23, 2024
WESTERN
NEW ENGLAND BANCORP, INC.
(Exact name of registrant as specified in its charter)
| |
Massachusetts |
|
001-16767 |
|
73-1627673 |
|
| |
(State or other jurisdiction of
incorporation) |
|
(Commission
File Number) |
|
(I.R.S. Employer
Identification No.) |
|
| |
|
|
|
|
|
|
| 141 Elm Street |
|
| Westfield, Massachusetts |
01085 |
| (Address of principal executive offices) |
(zip code) |
| |
|
|
|
|
|
|
|
Registrant's telephone number, including area code:
(413) 568-1911
(Former name or former address, if changed since
last report)
Check the appropriate box below if the Form 8-K filing is intended
to simultaneously satisfy the filing obligation of the registrant under any of the following provisions:
| ☐ | Written communications pursuant to Rule 425 under the Securities
Act (17 CFR 230.425) |
| ☐ | Soliciting material pursuant to Rule 14a-12 under the Exchange
Act (17 CFR 240.14a-12) |
| ☐ | Pre-commencement communications pursuant to Rule 14d-2(b) under
the Exchange Act (17 CFR 240.14d-2(b)) |
| ☐ | Pre-commencement communications pursuant to Rule 13e-4(c) under
the Exchange Act (17 CFR 240.13e-4(c)) |
Securities registered pursuant to Section 12(b)
of the Act:
| Title of each class |
Trading Symbol |
Name of each exchange on which registered |
| Common Stock, $0.01 par value per share |
WNEB |
NASDAQ |
Indicate by check mark whether the Registrant is an emerging
growth company as defined in Rule 405 of the Securities Act of 1933 (§230.405 of this chapter) or Rule 12b-2 of the Securities Exchange
Act of 1934 (§240.12b-2 of this chapter).
Emerging growth company ☐
If an emerging growth company, indicate by check mark if the Registrant
has elected not to use the extended transition period for complying with any new or revised financial accounting standards provided pursuant
to Section 13(a) of the Exchange Act. ☐
| Item 2.02. | Results of Operations and Financial Condition. |
On January 23, 2024, Western
New England Bancorp, Inc. (the “Company”) issued a press release announcing its financial results for the quarter and twelve
months ended December 31, 2023. A copy of the press release is furnished as Exhibit 99.1 hereto and is hereby incorporated
by reference into this Item 2.02.
| Item 7.01. | Regulation FD Disclosure. |
On January 23, 2024, the Company made available an investor presentation to be used during investor meetings. The slide show for the investor presentation is attached to this report as Exhibit 99.2.
The information contained
in this Item 7.01 and Exhibits 99.1 and 99.2 attached hereto, is being furnished and shall not be deemed “filed” for purposes
of Section 18 of the Securities Exchange Act of 1934, as amended (the “Exchange Act”), or otherwise subject to the liabilities
of that section, nor will such information or exhibits be deemed incorporated by reference into any filing made by the Company under the
Exchange Act or the Securities Act of 1933, as amended, whether made before or after the date hereof and regardless of any general incorporation
language in such filings, except to the extent expressly set forth by specific reference in such filing. The
furnishing of the information included in Item 7.01 of this Current Report on Form 8-K shall not be deemed an admission as to the materiality
of any information herein that is required to be disclosed solely by reason of Regulation FD.
| Item 9.01. | Financial Statements and Exhibits. |
The exhibits required by this item are set forth on the Exhibit Index
attached hereto.
|
Exhibit
Number |
|
Description |
| |
|
|
| 99.1 |
|
Press Release of Western New England Bancorp, Inc. dated January 23, 2024. |
| 99.2 |
|
Investor Presentation dated January 23, 2024 for Western New England Bancorp, Inc. |
| 104 |
|
Cover Page Interactive Data File (embedded within the Inline XBRL document). |
SIGNATURES
Pursuant to the requirements of the Securities
Exchange Act of 1934, the registrant has duly caused this report to be signed on its behalf by the undersigned hereunto duly authorized.
| |
WESTERN NEW ENGLAND BANCORP, INC. |
| |
|
| |
|
|
| |
By: |
/s/ Guida R. Sajdak |
|
| |
|
Guida R. Sajdak |
| |
|
Chief Financial Officer |
Dated: January 23, 2024
WESTERN
NEW ENGLAND BANCORP, INC. 8-K
Exhibit 99.1
| |
For further information contact:
James C. Hagan, President and CEO
Guida R. Sajdak, Executive Vice President and CFO
Meghan Hibner, First Vice President and Investor Relations Officer
413-568-1911
|
WESTERN NEW ENGLAND BANCORP, INC. REPORTS RESULTS
FOR THREE MONTHS
AND YEAR ENDED DECEMBER 31, 2023 AND DECLARES
QUARTERLY CASH DIVIDEND
Westfield, Massachusetts, January 23, 2024:
Western New England Bancorp, Inc. (the “Company” or “WNEB”) (NasdaqGS: WNEB), the holding company for Westfield
Bank (the “Bank”), announced today the unaudited results of operations for the three and twelve months ended December 31,
2023. For the three months ended December 31, 2023, the Company reported net income of $2.5 million, or $0.12 per diluted share, compared
to net income of $9.0 million, or $0.42 per diluted share, for the three months ended December 31, 2022. On a linked quarter basis, net
income was $2.5 million, or $0.12 per diluted share, as compared to net income of $4.5 million, or $0.21 per diluted share, for the three
months ended September 30, 2023. For the twelve months ended December 31, 2023, net income was $15.1 million, or $0.70 per diluted share,
compared to net income of $25.9 million, or $1.18 per diluted share, for the twelve months ended December 31, 2022.
The Company also announced that the Board of Directors
declared a quarterly cash dividend of $0.07 per share on the Company’s common stock. The dividend will be payable on or about February
21, 2024 to shareholders of record on February 7, 2024.
James C. Hagan, President and Chief Executive
Officer, commented, “We are pleased with our fourth quarter results, showing loan growth with increasing loan yields. Total loans
increased $35.9 million, or 1.8%, since December 31, 2022, while classified assets decreased 38.3% from December 31, 2022. The Company
also maintained a strong liquidity position, covering approximately 146% of uninsured deposits as of December 31, 2023.
Additionally, during the twelve months ended December
31, 2023, we repurchased 649,744 shares of our common stock at an average price per share of $7.20. We believe that share repurchases
represent a prudent use of capital, especially when they are accretive to book value. Management has and will continue to remain focused
on increasing shareholder value through various capital management strategies.”
Hagan concluded, “Our team remains committed
to our community and to our existing and new customers. We continue to be focused on true relationship banking, while providing continued
access to local decision makers in order to meet the financial needs of all our customers. We believe our various growth, customer and
expense initiatives are creating positive impacts to our performance and are positioning the Company for future growth and increased profitability.”
Key Highlights:
Loans and Deposits
At December 31, 2023, total loans of $2.0 billion
increased $35.9 million, or 1.8%, from December 31, 2022. The increase in total loans was due to an increase in commercial real estate
loans of $10.4 million, or 1.0%, and an increase in residential real estate loans, including home equity loans, of $27.1 million, or 3.9%,
partially offset by a decrease in commercial and industrial loans of $2.4 million, or 1.1%.
At December 31, 2023, total deposits were $2.1
billion, a decrease of $85.7 million, or 3.8%, from December 31, 2022. Core deposits, which the Company defines as all deposits except
time deposits, decreased $285.4 million, or 15.7%, from $1.8 billion, or 81.5% of total deposits, at December 31, 2022, to $1.5 billion,
or 71.5% of total deposits at December 31, 2023. The loan to deposit ratio increased from 89.3% at December 31, 2022 to 94.6% at December
31, 2023.
Liquidity
The Company’s liquidity position remains
strong with solid core deposit relationships, cash, unencumbered securities, a diversified deposit base and access to diversified borrowing
sources. At December 31, 2023, the Company had $839.1 million in immediate liquidity compared to $574.9 million in uninsured deposits,
or 26.8% of total deposits, representing a coverage ratio of 146%. Uninsured deposits of the Bank’s customers are eligible for FDIC
pass-through insurance if the customer opens an IntraFi Insured Cash Sweep (ICS) account or a reciprocal time deposit through the Certificate
of Deposit Account Registry System (CDARS). IntraFi allows for up to $250.0 million per customer of pass-through FDIC insurance, which
would more than cover each of the Bank’s deposit customers if such customer desired to have such pass-through insurance.
Allowance for Credit Losses and Credit Quality
At December 31, 2023, the allowance for credit
losses was $20.3 million, or 1.00% of total loans and 315.6% of nonperforming loans compared to $19.9 million, or 1.00% of total loans
and 350.0% of nonperforming loans at December 31, 2022. At December 31, 2023, nonperforming loans totaled $6.4 million, or 0.32% of total
loans, compared to $5.7 million, or 0.29% of total loans, at December 31, 2022. Total delinquent loans increased $1.5 million, or 34.3%,
from $4.5 million, or 0.22% of total loans, at December 31, 2022 to $6.0 million, or 0.30% of total loans, at December 31, 2023. At December
31, 2023 and December 31, 2022, the Company did not have any other real estate owned.
Net Interest Margin
The net interest margin was 2.64% for the three
months ended December 31, 2023 compared to 3.44% for the three months ended December 31, 2022 and 2.70% for the three months ended September
30, 2023. The net interest margin, on a tax-equivalent basis, was 2.66% for the three months ended December 31, 2023, compared to 3.47%
for the three months ended December 31, 2022 and 2.72% for the three months ended September 30, 2023.
Stock Repurchase Program
On July 26, 2022, the Board of Directors authorized
a stock repurchase plan (the “2022 Plan”), pursuant to which the Company is authorized to repurchase up to 1.1 million shares,
representing approximately 5.0% of the Company’s outstanding common stock as of the time the 2022 Plan was announced. During the
three months ended December 31, 2023, the Company repurchased 244,839 shares of common stock under the 2022 Plan, with an average price
per share of $7.09. During the twelve months ended December 31, 2023, the Company repurchased 649,744 shares of common stock under the
2022 Plan, with an average price per share of $7.20. As of December 31, 2023, there were 406,600 shares of common stock available for
repurchase under the 2022 Plan.
The repurchase of shares under the stock
repurchase program is administered through an independent broker. The shares of common stock repurchased under the 2022 Plan are purchased
from time to time at prevailing market prices, through open market or privately negotiated transactions, or otherwise, depending upon
market conditions. There is no guarantee as to the exact number, or value, of shares that will be repurchased by the Company, and the
Company may discontinue repurchases at any time that the Company’s management (“Management”) determines additional repurchases
are not warranted. The timing and amount of additional share repurchases under the 2022 Plan will depend on a number of factors, including
the Company’s stock price performance, ongoing capital planning considerations, general market conditions, and applicable legal
requirements.
Book Value and Tangible Book Value
The Company’s book value per share was $10.96
at December 31, 2023 compared to $10.27 at December 31, 2022, while tangible book value per share, a non-GAAP financial measure, increased
$0.69, or 7.2%, from $9.61 at December 31, 2022 to $10.30 at December 31, 2023. See pages 20-24 for the related tangible book value calculation
and a reconciliation of GAAP to non-GAAP financial measures.
Westfield Bank Defined Benefit Pension Plan
The Board of Directors previously announced the
termination of the Westfield Bank Defined Benefit Plan (the “DB Plan”) on October 31, 2022, subject to required regulatory
approval. At December 31, 2022, the Company reversed $7.3 million in net unrealized losses recorded in accumulated other comprehensive
income attributed to both the DB Plan curtailment resulting from the termination of the DB Plan as well as changes in discount rates.
In addition, during the three months ended December 31, 2022, the Company recorded a gain on curtailment of $2.8 million through non-interest
income. During the twelve months ended December 31, 2023, the Company made an additional cash contribution of $1.3 million in order to
fully fund the DB Plan on a plan termination basis. In addition, for those participants who did not opt for a one-time lump sum payment,
the Company funded $6.3 million to purchase a group annuity contract to transfer its remaining liabilities under the DB Plan. During the
twelve months ended December 31, 2023, the Company recognized the final termination expense of $1.1 million related to the DB Plan termination,
which was recorded through non-interest income.
Net Income for the Three Months Ended December
31, 2023 Compared to the Three Months Ended September 30, 2023
The Company reported net income of $2.5 million,
or $0.12 per diluted share, for the three months ended December 31, 2023, compared to net income of $4.5 million, or $0.21 per diluted
share, for the three months ended September 30, 2023. Net interest income decreased $207,000, or 1.3%, non-interest income decreased $898,000,
or 24.9%, non-interest expense increased $667,000, or 4.7%, and the provision for credit losses increased $132,000, or 37.3%, during the
same period. Return on average assets and return on average equity were 0.39% and 4.31%, respectively, for the three months ended December
31, 2023, compared to 0.70% and 7.60%, respectively, for the three months ended September 30, 2023.
Net Interest Income and Net Interest Margin
On a sequential quarter basis, net interest income,
our primary source of revenues, decreased $207,000, or 1.3%, for the three months ended December 31, 2023, from $16.4 million for the
three months ended September 30, 2023 to $16.2 million. The decrease in net interest income was primarily due to an increase in interest
expense of $1.1 million, or 11.3%, partially offset by an increase in interest and dividend income of $869,000, or 3.4%. The increase
in interest expense was a result of competitive pricing on deposits due to the continued high interest rate environment and the shift
in the deposit mix from low cost core deposits to high cost time deposits.
The net interest margin was 2.64% for the three
months ended December 31, 2023 compared to 2.70% for the three months ended September 30, 2023. The net interest margin, on a tax-equivalent
basis, was 2.66% for the three months ended December 31, 2023, compared to 2.72% for the three months ended September 30, 2023. The decrease
in the net interest margin was primarily due to an increase in the average cost of interest-bearing liabilities, which was partially offset
with an increase in the average yield on interest-earning assets.
The average yield on interest-earning assets,
without the impact of tax-equivalent adjustments, was 4.38% for the three months ended December 31, 2023, compared to 4.28% for the three
months ended September 30, 2023. The average loan yield, without the impact of tax-equivalent adjustments, was 4.71% for the three months
ended December 31, 2023, compared to 4.64% for the three months ended September 30, 2023. During the three months ended December 31, 2023,
average interest-earning assets increased $24.1 million, or 1.0% to $2.4 billion, primarily due to an increase in average short-term investments,
consisting of cash and cash equivalents, of $20.5 million, or 91.6%, and an increase in average loans of $9.8 million, or 0.5%, both partially
offset by a decrease in average securities of $6.1 million, or 1.7%.
The average cost of total funds, including non-interest
bearing accounts and borrowings, increased 17 basis points from 1.64% for the three months ended September 30, 2023 to 1.81% for the three
months ended December 31, 2023. The average cost of core deposits, which the Company defines as all deposits except time deposits, increased
6 basis points to 0.76% for the three months ended December 31, 2023, from 0.70% for the three months ended September 30, 2023. The average
cost of time deposits increased 32 basis points from 3.46% for the three months ended September 30, 2023 to 3.78% for the three months
ended December 31, 2023. The average cost of borrowings, including subordinated debt, increased 2 basis points from 4.81% for the three
months ended September 30, 2023 to 4.83% for the three months ended December 31, 2023. For the three months ended December 31, 2023, average
demand deposits, an interest-free source of funds, decreased $3.2 million, or 0.5%, to $588.7 million, or 27.0% of total average deposits,
from $591.9 million, or 27.5% of total average deposits for the three months ended September 30, 2023.
Provision for Credit Losses
During the three months ended December 31, 2023,
the Company recorded a provision for credit losses of $486,000, compared to a provision for credit losses of $354,000 during the three
months ended September 30, 2023. The provision for credit losses includes a $61,000 provision for unfunded commitments primarily due to
changes in the loss driver analysis for construction loans, offset by the impact of a decrease in unfunded loan commitments. Total unfunded
loan commitments decreased $10.6 million, or 6.1%, to $162.3 million at December 31, 2023 from $172.9 million at September 30, 2023.
The provision for credit losses was determined by a number of factors: the continued strong credit performance of the Company’s
loan portfolio, changes in the loan portfolio mix and management’s consideration of existing economic conditions and the economic
outlook from the Federal Reserve’s actions to control inflation. The Company also increased the qualitative reserve to consider
the potential losses resulting from future recessionary pressures. Management continues to monitor macroeconomic variables related to
increasing interest rates, inflation and the concerns of an economic downturn, and believes it is appropriately reserved for the current
economic environment and supportable forecast period.
During the three months ended December 31, 2023,
the Company recorded net charge-offs of $136,000, compared to net charge-offs of $78,000 for the three months ended September 30, 2023.
Non-Interest Income
On a sequential quarter basis, non-interest income
decreased $898,000, or 24.9%, to $2.7 million for the three months ended December 31, 2023, from $3.6 million for the three months ended
September 30, 2023. Service charges and fees increased $138,000, or 6.4%, from the three months ended September 30, 2023 to $2.3 million
for the three months ended December 31, 2023. Income from bank-owned life insurance (“BOLI”) decreased $22,000, or 4.8%, from
the three months ended September 30, 2023 to $432,000 for the three months ended December 31, 2023.
During the three months ended September 30, 2023,
non-interest income included a non-taxable gain of $778,000 in BOLI death benefits. During the three months ended December 31, 2023, the
Company did not have comparable non-taxable BOLI death benefits. During the three months ended September 30, 2023, the Company reported
a gain on non-marketable equity investments of $238,000. The Company did not have comparable non-interest income during the three months
ended December 31, 2023. During the three months ended September 30, 2023, the Company reported a loss on the disposal of premises and
equipment of $3,000. The Company did not have a comparable loss during the three months ended December 31, 2023. Excluding the BOLI death
benefits of $778,000 and the gain on non-marketable equity investments of $238,000, non-interest income increased $118,000, or 4.5%, from
the three months ended September 30, 2023 to the three months ended December 31, 2023.
Non-Interest Expense
For the three months ended December 31, 2023,
non-interest expense increased $667,000, or 4.7%, from $14.1 million for the three months ended September 30, 2023 to $14.8 million. Other
expenses increased $825,000, or 35.1%, for the three months ended December 31, 2023, as a result of a $510,000 legal settlement accrual.
During the three months ended December 31, 2023, the Company reached an agreement-in-principle to settle purported class action lawsuits
concerning the Company’s deposit products and related disclosures, specifically involving overdraft fees and insufficient funds
fees. This agreement-in-principle reflects our business decision to avoid the costs, uncertainties and distractions of further litigation.
Excluding the legal settlement accrual, non-interest expense increased $157,000, or 1.1%, from the three months ended September 30, 2023
to $14.3 million for the three months ended December 31, 2023.
During the three months ended December 31, 2023,
occupancy expense increased $39,000, or 3.4%, from the three months ended September 30, 2023, professional fees increased $31,000, or
4.8%, advertising expense increased $15,000, or 4.1%, and furniture and equipment expense increased $12,000, or 2.5%. These increases
were partially offset by a decrease in salaries and employee benefits of $216,000, or 2.7%, primarily due to lower incentive compensation
expense, data processing decreased $36,000, or 4.4%, and FDIC insurance expense decreased $3,000, or 0.9%.
For the three months ended December 31, 2023,
the efficiency ratio was 78.3% compared to 70.6% for the three months ended September 30, 2023. For the three months ended December 31,
2023, the adjusted efficiency ratio, a non-GAAP financial measure, was 78.3% compared to 74.4% for the three months ended September 30,
2023. See pages 20-24 for the related efficiency ratio calculations and a reconciliation of GAAP to non-GAAP financial measures.
Income Tax Provision
Income tax expense for the three months ended
December 31, 2023 was $1.1 million with an effective tax rate of 30.6%, compared to income tax expense of $1.0 million with an effective
tax rate of 18.7%, for the three months ended September 30, 2023. The effective tax rate for the three months ended December 31, 2023
was negatively impacted by discrete items totaling $285,000, while the lower effective tax rate for September 30, 2023 was primarily due
to the non-taxable gain of $778,000 in BOLI death benefits.
Net Income for the Three Months Ended December
31, 2023 Compared to the Three Months Ended December 31, 2022
The Company reported net income of $2.5 million,
or $0.12 per diluted share, for the three months ended December 31, 2023, compared to net income of $9.0 million, or $0.42 per diluted
share, for the three months ended December 31, 2022. Net interest income decreased $4.7 million, or 22.4%, non-interest income decreased
$2.9 million, or 52.0%, non-interest expense increased $782,000, or 5.6%, and the provision for credit losses increased $336,000, or 224.0%,
during the same period. Return on average assets and return on average equity were 0.39% and 4.31%, respectively, for the three months
ended December 31, 2023, compared to 1.40% and 16.67%, respectively, for the three months ended December 31, 2022.
Net Interest Income and Net Interest Margin
Net interest income decreased $4.7 million, or
22.4%, to $16.2 million, for the three months ended December 31, 2023, from $20.9 million for the three months ended December 31, 2022.
The decrease in net interest income was due to an increase in interest expense of $7.9 million, partially offset by an increase in interest
and dividend income of $3.2 million, or 13.5%. Interest expense on deposits increased $6.6 million and interest expense on borrowings
increased $1.3 million. The increase in interest expense was a result of competitive pricing on deposits due to the continued higher interest
rate environment and the shift in the deposit mix from low cost core deposits to high cost time deposits.
The net interest margin was 2.64% for the three
months ended December 31, 2023, compared to 3.44% for the three months ended December 31, 2022. The net interest margin, on a tax-equivalent
basis, was 2.66% for the three months ended December 31, 2023, compared to 3.47% for the three months ended December 31, 2022. The decrease
in the net interest margin was primarily due to an increase in the average cost of interest-bearing liabilities, which was partially offset
with an increase in the average yield on interest-earning assets.
The average yield on interest-earning assets,
without the impact of tax-equivalent adjustments, increased 48 basis points from 3.90% for the three months ended December 31, 2022 to
4.38% for the three months ended December 31, 2023. During the three months ended December 31, 2023, average interest-earning assets increased
$25.4 million, or 1.1%, to $2.4 billion compared to the three months ended December 31, 2022, primarily due to an increase in average
loans of $22.2 million, or 1.1%, an increase in average short-term investments, consisting of cash and cash equivalents, of $35.2 million,
or 460.9%, and an increase in other average investments of $1.5 million, or 13.9%, partially offset by a decrease in average securities
of $33.5 million, or 8.6%.
The average cost of funds, including non-interest-bearing
demand accounts and borrowings, increased 134 basis points, from 0.47% for the three months ended December 31, 2022 to 1.81% for the three
months ended December 31, 2023.
The average cost of core deposits, which the Company
defines as all deposits except time deposits and which include non-interest-bearing demand accounts, increased 42 basis points, from 0.34%
for the three months ended December 31, 2022 to 0.76% for the three months ended December 31, 2023. The average cost of time deposits
increased 313 basis points from 0.65% for the three months ended December 31, 2022 to 3.78% for the three months ended December 31, 2023.
The average cost of borrowings, including subordinated debt, increased 54 basis points from 4.29% for the three months ended December
31, 2022 to 4.83% for the three months ended December 31, 2023. For the three months ended December 31, 2023, average demand deposits,
an interest-free source of funds, decreased $75.1 million, or 11.3%, to $588.7 million, or 27.0% of total average deposits, from $663.8
million, or 29.4% of total average deposits for the three months ended December 31, 2022.
Provision for Credit Losses
During the three months ended December 31, 2023,
the Company recorded a provision for credit losses of $486,000 under CECL, compared to a provision for credit losses of $150,000 during
the three months ended December 31, 2022 under the incurred loss model. The increase in the provision for credit losses was primarily
due to changes in the economic environment and related adjustments to the quantitative components of the CECL methodology. The provision
for credit losses was determined by a number of factors: the continued strong credit performance of the Company’s loan portfolio,
changes in the loan portfolio mix and management’s consideration of existing economic conditions and the economic outlook from the
Federal Reserve’s actions to control inflation. Management continues to monitor macroeconomic variables related to increasing interest
rates, inflation and the concerns of an economic downturn, and believes it is appropriately provisioned for the current economic environment
and supportable forecast period. The Company recorded net charge-offs of $136,000 for the three months ended December 31, 2023, as compared
to net charge-offs of $426,000 for the three months ended December 31, 2022.
Non-Interest Income
Non-interest income decreased $2.9 million, or
52.0%, to $2.7 million for the three months ended December 31, 2023, from $5.7 million for the three months ended December 31, 2022. During
the three months ended December 31, 2022, the Company recorded a curtailment gain related to the DB Plan termination of $2.8 million through
non-interest income. Excluding the DB Plan termination curtailment gain, non-interest income decreased $132,000, or 4.6%.
During the three months ended December 31, 2023,
service charges and fees on deposits decreased $46,000, or 2.0%, primarily due to changes in the Company’s overdraft program that
were implemented in the first quarter of 2023. Income from BOLI increased $4,000, or 0.9%, from $428,000 for the three months ended December
31, 2022 to $432,000 for the three months ended December 31, 2023. During the three months ended December 31, 2022, the Company reported
a gain on non-marketable equity investments of $70,000. The Company did not have comparable income during the three months ended December
31, 2023. In addition, the Company reported unrealized gains on marketable equity securities of $19,000 during the three months ended
December 31, 2022, compared to unrealized losses on marketable equity securities of $1,000 during the three months ended December 31,
2023. Gains and losses from the investment portfolio vary from quarter to quarter based on market conditions, as well as the related yield
curve and valuation changes.
Non-Interest Expense
For the three months ended December 31, 2023,
non-interest expense increased $782,000, or 5.6%, from $14.0 million for the three months ended December 31, 2022 to $14.8 million. During
the same period, other expenses increased $842,000, or 36.1%, as a result of a $510,000 legal settlement accrual. During the three months
ended December 31, 2023, the Company reached an agreement-in-principle to settle purported class action lawsuits concerning the Company’s
deposit products and related disclosures, specifically involving overdraft fees and insufficient funds fees. This agreement-in-principle
reflects our business decision to avoid the costs, uncertainties and distractions of further litigation. Excluding the legal settlement
accrual, non-interest expense increased $272,000, or 1.9%, from $14.0 million, for the three months ended December 31, 2022 to $14.3 million
for the three months ended December 31, 2023.
For the three months ended December 31, 2023,
compared to the three months ended December 31, 2022, advertising expense increased $199,000, or 111.8%, due to timing of promotions in
2022. FDIC insurance expense increased $83,000, or 32.5%, data processing increased $64,000, or 8.8%, professional fees increased $57,000,
or 9.2%, and furniture and equipment expense increased $15,000, or 3.1%. These increases were partially offset by a decrease in salaries
and employee benefits of $458,000, or 5.6%, primarily due to lower incentive compensation expense, and a decrease in occupancy expense
of $20,000, or 1.6%.
For the three months ended December 31, 2023,
the efficiency ratio was 78.3% compared to 52.8% for the three months ended December 31, 2022, primarily due to a $4.7 million, or 22.4%
decrease in net interest income during the three months ended December 31, 2023. For the three months ended December 31, 2023, the adjusted
efficiency ratio, a non-GAAP financial measure, was 78.3% compared to 59.3% for the three months ended December 31, 2022. See pages 20-24
for the related efficiency ratio calculations and a reconciliation of GAAP to non-GAAP financial measures.
Income Tax Provision
Income tax expense for the three months ended
December 31, 2023 was $1.1 million with an effective tax rate of 30.6%, compared to $3.3 million with an effective tax rate of 26.9% for
three months ended December 31, 2022. The effective tax rate for the three months ended December 31, 2023 was negatively impacted by discrete
items totaling $285,000.
Net Income for the Twelve Months Ended December
31, 2023 Compared to the Twelve Months Ended December 31, 2022
For the twelve months ended December 31, 2023,
the Company reported net income of $15.1 million, or $0.70 per diluted share, compared to $25.9 million, or $1.18 per diluted share, for
the twelve months ended December 31, 2022. Return on average assets and return on average equity were 0.59% and 6.47% for the twelve months
ended December 31, 2023, respectively, compared to 1.02% and 11.85% for the twelve months ended December 31, 2022, respectively.
Net Interest Income and Net Interest Margin
During the twelve months ended December 31, 2023,
net interest income decreased $11.3 million, or 14.3%, to $67.9 million, compared to $79.2 million for the twelve months ended December
31, 2022. The decrease in net interest income was due to an increase in interest expense of $26.5 million, partially offset by an increase
in interest and dividend income of $15.2 million, or 17.7%.
The net interest margin for the twelve months
ended December 31, 2023 was 2.82%, compared to 3.31% during the twelve months ended December 31, 2022. The net interest margin, on a tax-equivalent
basis, was 2.84% for the twelve months ended December 31, 2023, compared to 3.33% for the twelve months ended December 31, 2022.
The average yield on interest-earning assets,
without the impact of tax-equivalent adjustments, increased 62 basis points from 3.58% for the twelve months ended December 31, 2022 to
4.20% for the twelve months ended December 31, 2023. During the twelve months ended December 31, 2023, average interest-earning assets
increased $10.3 million, or 0.4%, to $2.4 billion compared to the twelve months ended December 31, 2022, primarily due to an increase
in average loans of $52.6 million, or 2.7%, and an increase in average other investments of $2.1 million, or 20.8%, partially offset by
a decrease in average securities of $39.2 million, or 9.6%, and a decrease in average short-term investments, consisting of cash and cash
equivalents, of $5.3 million, or 20.4%.
During the twelve months ended December 31, 2023,
the average cost of funds, including non-interest-bearing demand accounts and borrowings, increased 115 basis points from 0.29% for the
twelve months ended December 31, 2022 to 1.44%. For the twelve months ended December 31, 2023, the average cost of core deposits, including
non-interest-bearing demand deposits, increased 45 basis points from 0.20% for the twelve months ended December 31, 2022 to 0.65% for
the twelve months ended December 31, 2023. The average cost of time deposits increased 262 basis points from 0.41% for the twelve months
ended December 31, 2022 to 3.03% during the same period in 2023. The average cost of borrowings, which include Federal Home Loan Bank
(“FHLB”) advances and subordinated debt, increased 58 basis points from 4.26% for the twelve months ended December 31, 2022
to 4.84% for the twelve months ended December 31, 2023.
For the twelve months ended December 31, 2023,
average demand deposits, an interest-free source of funds, decreased $45.3 million, or 7.0%, from $648.0 million, or 28.6% of total average
deposits, for the twelve months ended December 31, 2022, to $602.7 million, or 27.8% of total average deposits.
Provision for Credit Losses
During the twelve months ended December 31, 2023,
the Company recorded a provision for credit losses of $872,000 under the CECL model, compared to a provision for credit losses of $700,000
during the twelve months ended December 31, 2022 under the incurred loss model. The increase in reserves was primarily due to changes
in the economic environment and related adjustments to the quantitative components of the CECL methodology. The Company recorded net charge-offs
of $2.0 million for the twelve months ended December 31, 2023, as compared to net charge-offs of $556,000 for the twelve months ended
December 31, 2022. The charge-offs for the twelve months ended December 31, 2023 were related to one commercial relationship acquired
on October 21, 2016 from Chicopee Bancorp, Inc., which was placed on nonaccrual status during the first quarter of 2023. The Company recorded
a $1.9 million charge-off on the relationship, which represented the non-accretable credit mark that was required to be grossed-up to
the loan’s amortized cost basis with a corresponding increase to the allowance for credit losses under CECL implementation. At December
31, 2023, the Company had charged-off 61% of the total relationship and the remaining exposure of $940,000 is collateralized at this time.
Non-Interest Income
For the twelve months ended December 31, 2023,
non-interest income decreased $2.4 million, or 18.3%, from $13.3 million for the twelve months ended December 31, 2022 to $10.9 million
for the twelve months ended December 31, 2023. During the twelve months ended December 31, 2023, the Company recorded a $1.1 million final
termination expense related to the DB Plan termination, compared to a curtailment gain related to the DB Plan termination of $2.8 million,
during the twelve months ended December 31, 2022. The Company also recorded a non-taxable gain of $778,000 on BOLI death benefits during
the twelve months ended December 31, 2023. The Company did not have comparable income during the twelve months ended December 31, 2022.
Excluding the termination expense and the curtailment gain related to the DB Plan termination and the BOLI death benefit, non-interest
income increased $737,000, or 7.0%.
During the twelve months ended December 31, 2023,
service charges and fees decreased $216,000, or 2.4%, primarily due to changes in the Company’s overdraft program that were implemented
in 2023. Income from BOLI increased $95,000, or 5.5%, from $1.7 million for the twelve months ended December 31, 2022 to $1.8 million
for the twelve months ended December 31, 2023. Other income from loan-level swap fees on commercial loans decreased $25,000 for the twelve
months ended December 31, 2023. During the twelve months ended December 31, 2023, the Company reported a gain of $590,000 on non-marketable
equity investments compared to a gain of $422,000 during the twelve months ended December 31, 2022. During the twelve months ended December
31, 2023, the Company reported a loss on the disposal of premises and equipment of $3,000. The Company did not have comparable activity
during the same period in 2022. During the twelve months ended December 31, 2022, the Company also reported unrealized losses on marketable
equity securities of $717,000, compared to unrealized losses on marketable equity securities of $1,000 during the twelve months ended
December 31, 2023. During the twelve months ended December 31, 2022, the Company reported realized losses on the sale of securities of
$4,000. The Company did not have a comparable gain or loss during the same period in 2023.
Non-Interest Expense
For the twelve months ended December 31, 2023,
non-interest expense increased $1.1 million, or 1.9%, to $58.4 million, compared to $57.2 million for the twelve months ended December
31, 2022. The increase in non-interest expense was primarily due to an increase in other expense of $953,000, or 10.1%, as a result of
a $510,000 legal settlement accrual. During the three months ended December 31, 2023, the Company reached an agreement-in-principle to
settle purported class action lawsuits concerning the Company’s deposit products and related disclosures, specifically involving
overdraft fees and insufficient funds fees. This agreement-in-principle reflects our business decision to avoid the costs, uncertainties
and distractions of further litigation. Excluding the legal settlement accrual, non-interest expense increased $605,000, or 1.1%, from
$57.2 million, for the twelve months ended December 31, 2022 to $57.8 million for the twelve months ended December 31, 2023.
During the same period, FDIC insurance expense
increased $273,000, or 26.0%, data processing increased $272,000, or 9.4%, professional fees, which is comprised of legal fees, audit
and professional fees, increased $161,000, or 5.9%, due to the recent settlement of litigation, and advertising expense increased $87,000,
or 6.2%. These increases were partially offset by a decrease in salaries and employee benefits of $483,000, or 1.5%, due to lower incentive
compensation costs, occupancy expense decreased $76,000, or 1.5%, and furniture and equipment expense decreased $72,000, or 3.6%.
For the twelve months ended December 31, 2023,
the efficiency ratio was 74.0%, compared to 61.8% for the twelve months ended December 31, 2022. For the twelve months ended December
31, 2023, the adjusted efficiency ratio, a non-GAAP financial measure, was 74.3%, compared to 63.6% for the twelve months ended December
31, 2022. See pages 20-24 for the related efficiency ratio calculations and a reconciliation of GAAP to non-GAAP financial measures.
Income Tax Provision
Income tax expense for the twelve months ended
December 31, 2023 was $4.5 million, with an effective tax rate of 23.1%, compared to $8.7 million, with an effective tax rate of 25.2%,
for twelve months ended December 31, 2022. The decrease in income tax expense for the twelve months ended December 31, 2023 compared to
the twelve months December 31, 2022 was due to lower income before income taxes in 2023.
Balance Sheet
At December 31, 2023, total assets were $2.6 billion
and increased $11.4 million, or 0.4%, from December 31, 2022. The increase in total assets was mainly related to an increase in total
loans of $35.9 million, or 1.8%, partially offset by a decrease in investment securities of $22.7 million, or 5.9%, to $360.7 million,
and a decrease in cash and cash equivalents of $1.5 million, or 5.0%, to $28.8 million.
Investments
At December 31, 2023, the available-for-sale (“AFS”)
and held-to-maturity (“HTM”) securities portfolio represented 14.1% of total assets compared to 14.8% at December 31, 2022.
At December 31, 2023, the Company’s AFS securities portfolio, recorded at fair market value, decreased $9.9 million, or 6.7%, from
$147.0 million at December 31, 2022 to $137.1 million. The HTM securities portfolio, recorded at amortized cost, decreased $6.8 million,
or 3.0%, from $230.2 million at December 31, 2022 to $223.4 million at December 31, 2023. The marketable equity securities portfolio decreased
$6.0 million, or 96.9%, from $6.2 million at December 31, 2022 to $196,000 at December 31, 2023. The decrease in the AFS and HTM securities
portfolios was primarily due to amortization and payoffs recorded during the twelve months ended December 31, 2023.
At December 31, 2023, the Company reported unrealized
losses on the AFS securities portfolio of $29.2 million, or 17.5% of the amortized cost basis of the AFS securities portfolio, compared
to unrealized losses of $32.2 million, or 18.0% of the amortized cost basis of the AFS securities at December 31, 2022. At December 31,
2023, the Company reported unrealized losses on the HTM securities portfolio of $35.7 million, or 16.0%, of the amortized cost basis of
the HTM securities portfolio, compared to $39.2 million, or 17.0% of the amortized cost basis of the HTM securities portfolio at December
31, 2022.
The securities in which the Company may invest
are limited by regulation. Federally chartered savings banks have authority to invest in various types of assets, including U.S. Treasury
obligations, securities of various government-sponsored enterprises, mortgage-backed securities, certain certificates of deposit of insured
financial institutions, repurchase agreements, overnight and short-term loans to other banks, corporate debt instruments and marketable
equity securities. The securities, with the exception of $7.0 million in corporate bonds, are issued by the United States government or
government-sponsored enterprises and are therefore either explicitly or implicitly guaranteed as to the timely payment of contractual
principal and interest. These positions are deemed to have no credit impairment, therefore, the disclosed unrealized losses with the securities
portfolio relate primarily to changes in prevailing interest rates. In all cases, price improvement in future periods will be realized
as the issuances approach maturity.
Management regularly reviews the portfolio for
securities in an unrealized loss position. At December 31, 2023 and December 31, 2022, the Company did not record any impairment charges
on its securities portfolio and attributed the unrealized losses primarily due to fluctuations in general interest rates or changes in
expected prepayments and not due to credit quality. The primary objective of the Company’s investment portfolio is to provide liquidity
and to secure municipal deposit accounts while preserving the safety of principal. The Company expects to strategically redeploy available
cash flows from the securities portfolio to fund loan growth and deposit outflows.
Total Loans
At December 31, 2023, total loans increased $35.9
million, or 1.8%, to $2.0 billion from December 31, 2022. Residential real estate loans, including home equity loans, increased $27.1
million, or 3.9%, commercial real estate loans increased $10.4 million, or 1.0%, and commercial and industrial loans decreased $2.4 million,
or 1.1%.
The following table is a summary of our outstanding
loan balances for the periods indicated:
| | |
December 31, | | |
September 30, | | |
June 30, | | |
March 31, | | |
December 31, | |
| | |
2023 | | |
2023 | | |
2023 | | |
2023 | | |
2022 | |
| | |
(Dollars in thousands) | |
| | |
| | |
| | |
| | |
| |
| Commercial real estate loans | |
$ | 1,079,751 | | |
$ | 1,080,361 | | |
$ | 1,075,429 | | |
$ | 1,079,664 | | |
$ | 1,069,323 | |
| | |
| | | |
| | | |
| | | |
| | | |
| | |
| Residential real estate loans: | |
| | | |
| | | |
| | | |
| | | |
| | |
| Residential | |
| 612,315 | | |
| 606,221 | | |
| 597,812 | | |
| 595,097 | | |
| 589,503 | |
| Home equity | |
| 109,839 | | |
| 107,561 | | |
| 107,044 | | |
| 105,801 | | |
| 105,557 | |
| Total residential real estate loans | |
| 722,154 | | |
| 713,782 | | |
| 704,856 | | |
| 700,898 | | |
| 695,060 | |
| Commercial and industrial loans: | |
| | |
| | |
| | |
| | |
| |
| PPP loans | |
| 756 | | |
| 1,415 | | |
| 1,864 | | |
| 2,129 | | |
| 2,274 | |
| Commercial and industrial loans | |
| 216,691 | | |
| 211,162 | | |
| 225,229 | | |
| 215,971 | | |
| 217,574 | |
| Total commercial and industrial loans | |
| 217,447 | | |
| 212,577 | | |
| 227,093 | | |
| 218,100 | | |
| 219,848 | |
| Consumer loans | |
| 5,472 | | |
| 5,768 | | |
| 5,986 | | |
| 5,667 | | |
| 5,045 | |
| Total gross loans | |
| 2,024,824 | | |
| 2,012,488 | | |
| 2,013,364 | | |
| 2,004,329 | | |
| 1,989,276 | |
| Unamortized PPP loan fees | |
| (27 | ) | |
| (70 | ) | |
| (78 | ) | |
| (99 | ) | |
| (109 | ) |
| Unamortized premiums and net deferred loans fees and costs | |
| 2,520 | | |
| 2,402 | | |
| 2,307 | | |
| 2,269 | | |
| 2,233 | |
| Total loans | |
$ | 2,027,317 | | |
$ | 2,014,820 | | |
$ | 2,015,593 | | |
$ | 2,006,499 | | |
$ | 1,991,400 | |
Credit Quality
Credit quality remains sound and our loan portfolio
continues to perform well. Total delinquency was 0.30% of total loans at December 31, 2023, compared to 0.22% of total loans at December
31, 2022. At December 31, 2023, nonperforming loans totaled $6.4 million, or 0.32% of total loans, compared to $5.7 million, or 0.29%
of total loans, at December 31, 2022. At December 31, 2023, there were no loans 90 or more days past due and still accruing interest.
Nonperforming assets to total assets was 0.25% at December 31, 2023 and 0.22% at December 31, 2022. At December 31, 2023 and at December
31, 2022, the Company did not have any other real estate owned. The allowance for credit losses as a percentage of total loans was 1.00%
at December 31, 2023 and at December 31, 2022. At December 31, 2023, the allowance for credit losses as a percentage of nonperforming
loans was 315.6%, compared to 350.0% at December 31, 2022. Total classified loans, defined as special mention and substandard loans, decreased
$24.5 million, or 38.3%, from $64.0 million, or 3.2% of total loans, at December 31, 2022 to $39.5 million, or 1.9%, of total loans at
December 31, 2023. We continue to maintain diversity among property types and within our geographic footprint. More details on the diversification
of the loan portfolio are available in the supplementary earnings presentation. Management will continue to remain attentive to any signs
of deterioration in borrowers’ financial conditions and is proactive in taking the appropriate steps to mitigate risk.
Deposits
Total deposits decreased $85.7 million, or 3.8%,
from December 31, 2022, to $2.1 billion at December 31, 2023, due to industry-wide pressures and a competitive market for deposits. Core
deposits, which the Company defines as all deposits except time deposits, decreased $285.4 million, or 15.7%, from $1.8 billion, or 81.5%
of total deposits, at December 31, 2022, to $1.5 billion, or 71.5% of total deposits, at December 31, 2023. Money market accounts decreased
$166.7 million, or 20.8%, to $634.4 million, non-interest-bearing deposits decreased $65.9 million, or 10.2%, to $579.6 million, savings
accounts decreased $35.0 million, or 15.7%, to $187.4 million and interest-bearing checking accounts decreased $17.7 million, or 11.9%,
to $131.0 million. Time deposits increased $199.7 million, or 48.5%, from $411.7 million at December 31, 2022 to $611.4 million at December
31, 2023. Brokered time deposits, which are included in time deposits, totaled $1.7 million at December 31, 2023. The Company did not
have any brokered deposits at December 31, 2022.
The table below is a summary of our deposit balances
for the periods noted:
| | |
December 31, | | |
September 30, | | |
June 30, | | |
March 31, | | |
December 31, | |
| | |
2023 | | |
2023 | | |
2023 | | |
2023 | | |
2022 | |
| | |
(Dollars in thousands) | |
| Core Deposits: | |
| | | |
| | | |
| | | |
| | | |
| | |
| Demand accounts | |
$ | 579,595 | | |
$ | 593,601 | | |
$ | 584,511 | | |
$ | 625,656 | | |
$ | 645,571 | |
| Interest bearing accounts | |
| 131,031 | | |
| 152,886 | | |
| 162,823 | | |
| 133,727 | | |
| 148,670 | |
| Savings accounts | |
| 187,405 | | |
| 192,321 | | |
| 203,376 | | |
| 218,800 | | |
| 222,436 | |
| Money market accounts | |
| 634,361 | | |
| 654,909 | | |
| 672,483 | | |
| 721,219 | | |
| 801,076 | |
| Total Core Deposits | |
$ | 1,532,392 | | |
$ | 1,593,717 | | |
$ | 1,623,193 | | |
$ | 1,699,402 | | |
$ | 1,817,753 | |
| | |
| | | |
| | | |
| | | |
| | | |
| | |
| Time Deposits: | |
| | | |
| | | |
| | | |
| | | |
| | |
| Time deposits less than $250,000 | |
$ | 412,761 | | |
$ | 384,472 | | |
$ | 338,667 | | |
$ | 300,907 | | |
$ | 279,953 | |
| Time deposits of $250,000 or more | |
| 198,591 | | |
| 198,114 | | |
| 196,114 | | |
| 156,819 | | |
| 131,737 | |
| Total Time Deposits: | |
| 611,352 | | |
| 582,586 | | |
| 534,781 | | |
| 457,726 | | |
| 411,690 | |
| Total Deposits: | |
$ | 2,143,744 | | |
$ | 2,176,303 | | |
$ | 2,157,974 | | |
$ | 2,157,128 | | |
$ | 2,229,443 | |
During the twelve months ended December 31, 2023,
the Company experienced a higher level of competition not only from local competitors but also from money market funds and Treasury notes
that were offering higher returns. In addition, the Company also saw a challenging shift in deposit mix from low cost core deposits to
high cost time deposits as customers migrated to higher yields.
The Company continues to focus on the maintenance,
development, and expansion of its core deposit base to meet funding requirements and liquidity needs, with an emphasis on retaining a
long-term customer relationship base by efficiently competing for and retaining deposits in our local market. At December 31, 2023, the
Bank’s uninsured deposits represented 26.8% of total deposits, compared to 30.8% at December 31, 2022.
Borrowings
At December 31, 2023, total borrowings increased
$94.3 million, or 151.5%, from $62.2 million at December 31, 2022 to $156.5 million. Short-term borrowings decreased $25.3 million, or
61.1%, to $16.1 million, compared to $41.4 million at December 31, 2022. Long-term borrowings increased $119.5 million, from $1.2 million
at December 31, 2022, to $120.6 million at December 31, 2023, to replace deposit attrition. Long-term borrowings consisted of $30.6 million
outstanding with the FHLB and $90.0 million outstanding under the Federal Reserve Bank’s Bank Term Funding Program (“BTFP”).
At December 31, 2023, borrowings also consisted of $19.7 million in fixed-to-floating rate subordinated notes.
Liquidity
The Company’s liquidity position remains
strong with solid core deposit relationships, cash, unencumbered securities, a diversified deposit base and access to diversified borrowing
sources. On March 12, 2023, the Federal Reserve made available the BTFP, which enhances the ability of banks to borrow greater amounts
against certain high-quality, unencumbered investments at par value.
During the twelve months ended December 31, 2023,
the Company participated in the BTFP, which enabled the Company to pay off higher rate FHLB advances. With the BTFP, the Company has the
ability to pay off the BTFP advance prior to maturity without incurring a penalty or termination fee. The Company advanced $90.0 million
under the BTFP during the twelve months ended December 31, 2023 and had $23.6 million in availability under the BTFP as of December 31,
2023.
At December 31, 2023, the Company had available
borrowing capacity with the FHLB of $535.6 million, including its overnight Ideal Way Line of Credit. In addition, at December 31,
2023, the Company had available borrowing capacity of $48.6 million from the Federal Reserve Discount Window, with no outstanding borrowings.
At December 31, 2023, the Company also had available borrowing capacity of $25.0 million from two unsecured credit lines with correspondent
banks, with no outstanding borrowings. At December 31, 2023, the Company has $632.8 million in total available borrowing capacity, excluding
cash and unencumbered securities.
Hedging Program
During the twelve months ended December 31, 2023,
the Company executed a $200 million fair value hedge on fixed-rate assets with maturities up to 18 months, where the Company exchanged,
or swapped, fixed rate payments for floating rate payments. The Company’s hedging program aims to reduce the Company’s sensitivity
to interest rates by locking in a spread.
Capital
At December 31, 2023, shareholders’ equity
was $237.4 million, or 9.3% of total assets, compared to $228.1 million, or 8.9% of total assets, at December 31, 2022. The increase was
primarily attributable to net income of $15.1 million, partially offset by a decrease in accumulated other comprehensive loss of $3.3
million, $5.0 million for the repurchase of common stock and cash dividends paid of $6.1 million. At December 31, 2023, total shares outstanding
were 21,666,807.
The Company’s regulatory capital ratios
continue to be strong and in excess of regulatory minimum requirements to be considered well-capitalized as defined by regulators and
internal Company targets. Total Risk-Based Capital Ratio at December 31, 2023 was 14.7%, compared to 14.2% at December 31, 2022.
The Bank’s Tier 1 Leverage Ratio to adjusted average assets was 9.62% at December 31, 2023 and 9.49% at December 31, 2022. The Bank’s
tangible common equity (“TCE”) to tangible assets ratio, a non-GAAP financial measure, was 8.78% at December 31, 2023, compared
to 8.52% at December 31, 2022. Fluctuations in the TCE ratio were driven by the changes in the unrealized loss on available-for-sale
securities. TCE is a non-GAAP measure. See pages 20-24 for the related TCE to tangible assets ratio calculation and a reconciliation of
GAAP to non-GAAP financial measures.
Dividends
Although the Company has historically paid quarterly
dividends on its common stock and currently intends to continue to pay such dividends, the Company’s ability to pay such dividends
depends on a number of factors, including restrictions under federal laws and regulations on the Company’s ability to pay dividends,
and as a result, there can be no assurance that dividends will continue to be paid in the future.
About Western New England Bancorp, Inc.
Western New England Bancorp, Inc. is a Massachusetts-chartered
stock holding company and the parent company of Westfield Bank, CSB Colts, Inc., Elm Street Securities Corporation, WFD Securities, Inc.
and WB Real Estate Holdings, LLC. Western New England Bancorp, Inc. and its subsidiaries are headquartered in Westfield, Massachusetts
and operate 25 banking offices throughout western Massachusetts and northern Connecticut. To learn more, visit our website at www.westfieldbank.com.
Forward-Looking Statements
This press release contains “forward-looking
statements” within the meaning of Section 27A of the Securities Act of 1933, as amended, and Section 21E of the Securities Exchange
Act of 1934, as amended, with respect to the Company’s financial condition, liquidity, results of operations, future performance,
and business. Forward-looking statements may be identified by the use of such words as “believe,” “expect,” “anticipate,”
“should,” “planned,” “estimated,” and “potential.” Examples of forward-looking statements
include, but are not limited to, estimates with respect to our financial condition, results of operations and business that are subject
to various factors which could cause actual results to differ materially from these estimates. These factors include, but are not
limited to:
| ● | unpredictable
changes in general economic conditions, financial markets, fiscal, monetary and regulatory policies, including actual or potential stress
in the banking industry; |
| ● | the
duration and scope of potential pandemics, including the emergence of new variants and the response thereto; |
| ● | changes
in economic conditions which could materially impact credit quality trends and the ability to generate loans and gather deposits; |
| ● | inflation
and governmental responses to inflation, including recent and potential future increases in interest rates that reduce margins; |
| ● | the
effect on our operations of governmental legislation and regulation, including changes in accounting regulation or standards, the nature
and timing of the adoption and effectiveness of new requirements under the Dodd-Frank Act Wall Street Reform and Consumer Protection
Act of 2010, Basel guidelines, capital requirements and other applicable laws and regulations; |
| ● | significant
changes in accounting, tax or regulatory practices or requirements; |
| ● | new
legal obligations or liabilities or unfavorable resolutions of litigation; |
| ● | disruptive
technologies in payment systems and other services traditionally provided by banks; |
| ● | the
highly competitive industry and market area in which we operate; |
| ● | changes
in business conditions and inflation; |
| ● | operational
risks or risk management failures by us or critical third parties, including without limitation with respect to data processing, information
systems, cybersecurity, technological changes, vendor issues, business interruption, and fraud risks; |
| ● | failure
or circumvention of our internal controls or procedures; |
| ● | changes
in the securities markets which affect investment management revenues; |
| ● | increases
in Federal Deposit Insurance Corporation deposit insurance premiums and assessments; |
| ● | the
soundness of other financial services institutions which may adversely affect our credit risk; |
| ● | certain
of our intangible assets may become impaired in the future; |
| ● | new
lines of business or new products and services, which may subject us to additional risks; |
| ● | changes
in key management personnel which may adversely impact our operations; |
| ● | severe
weather, natural disasters, acts of war or terrorism and other external events which could significantly impact our business; and |
| ● | other
risk factors detailed from time to time in our SEC filings. |
Although we believe that the expectations reflected
in such forward-looking statements are reasonable, actual results may differ materially from the results discussed in these forward-looking
statements. You are cautioned not to place undue reliance on these forward-looking statements, which speak only as of the date hereof.
We do not undertake any obligation to republish revised forward-looking statements to reflect events or circumstances after the date hereof
or to reflect the occurrence of unanticipated events, except to the extent required by law.
WESTERN NEW ENGLAND BANCORP, INC. AND SUBSIDIARIES
Consolidated Statements of Net Income and Other
Data
(Dollars in thousands, except per share data)
(Unaudited)
| | |
Three Months Ended | | |
Twelve Months Ended | |
| | |
December 31, | | |
September 30, | | |
June 30, | | |
March 31, | | |
December 31, | | |
December 31, | |
| | |
2023 | | |
2023 | | |
2023 | | |
2023 | | |
2022 | | |
2023 | | |
2022 | |
| INTEREST AND DIVIDEND INCOME: | |
| | | |
| | | |
| | | |
| | | |
| | | |
| | | |
| | |
| Loans | |
$ | 23,939 | | |
$ | 23,451 | | |
$ | 22,450 | | |
$ | 21,329 | | |
$ | 21,274 | | |
$ | 91,169 | | |
$ | 77,264 | |
| Securities | |
| 2,094 | | |
| 2,033 | | |
| 2,094 | | |
| 2,149 | | |
| 2,174 | | |
| 8,370 | | |
| 8,296 | |
| Other investments | |
| 140 | | |
| 166 | | |
| 146 | | |
| 106 | | |
| 75 | | |
| 558 | | |
| 177 | |
| Short-term investments | |
| 597 | | |
| 251 | | |
| 119 | | |
| 54 | | |
| 62 | | |
| 1,021 | | |
| 191 | |
| Total interest and dividend income | |
| 26,770 | | |
| 25,901 | | |
| 24,809 | | |
| 23,638 | | |
| 23,585 | | |
| 101,118 | | |
| 85,928 | |
| | |
| | | |
| | | |
| | | |
| | | |
| | | |
| | | |
| | |
| INTEREST EXPENSE: | |
| | | |
| | | |
| | | |
| | | |
| | | |
| | | |
| | |
| Deposits | |
| 8,773 | | |
| 7,704 | | |
| 6,069 | | |
| 4,103 | | |
| 2,206 | | |
| 26,649 | | |
| 5,352 | |
| Short-term borrowings | |
| 123 | | |
| 117 | | |
| 646 | | |
| 703 | | |
| 272 | | |
| 1,589 | | |
| 330 | |
| Long-term debt | |
| 1,444 | | |
| 1,444 | | |
| 995 | | |
| 74 | | |
| — | | |
| 3,957 | | |
| — | |
| Subordinated debt | |
| 254 | | |
| 253 | | |
| 253 | | |
| 254 | | |
| 253 | | |
| 1,014 | | |
| 1,014 | |
| Total interest expense | |
| 10,594 | | |
| 9,518 | | |
| 7,963 | | |
| 5,134 | | |
| 2,731 | | |
| 33,209 | | |
| 6,696 | |
| | |
| | | |
| | | |
| | | |
| | | |
| | | |
| | | |
| | |
| Net interest and dividend income | |
| 16,176 | | |
| 16,383 | | |
| 16,846 | | |
| 18,504 | | |
| 20,854 | | |
| 67,909 | | |
| 79,232 | |
| | |
| | | |
| | | |
| | | |
| | | |
| | | |
| | | |
| | |
| PROVISION FOR (REVERSAL OF) CREDIT LOSSES | |
| 486 | | |
| 354 | | |
| 420 | | |
| (388 | ) | |
| 150 | | |
| 872 | | |
| 700 | |
| | |
| | | |
| | | |
| | | |
| | | |
| | | |
| | | |
| | |
| Net interest and dividend income after provision for (reversal of) credit losses | |
| 15,690 | | |
| 16,029 | | |
| 16,426 | | |
| 18,892 | | |
| 20,704 | | |
| 67,037 | | |
| 78,532 | |
| | |
| | | |
| | | |
| | | |
| | | |
| | | |
| | | |
| | |
| NON-INTEREST INCOME: | |
| | | |
| | | |
| | | |
| | | |
| | | |
| | | |
| | |
| Service charges and fees | |
| 2,283 | | |
| 2,145 | | |
| 2,241 | | |
| 2,187 | | |
| 2,329 | | |
| 8,856 | | |
| 9,072 | |
| Income from bank-owned life insurance | |
| 432 | | |
| 454 | | |
| 494 | | |
| 440 | | |
| 428 | | |
| 1,820 | | |
| 1,725 | |
| Loss on sales of securities, net | |
| — | | |
| — | | |
| — | | |
| — | | |
| — | | |
| — | | |
| (4 | ) |
| Unrealized (loss) gain on marketable equity securities | |
| (1 | ) | |
| — | | |
| — | | |
| — | | |
| 19 | | |
| (1 | ) | |
| (717 | ) |
| Loss on disposal of premises and equipment | |
| — | | |
| (3 | ) | |
| — | | |
| — | | |
| — | | |
| (3 | ) | |
| — | |
| Gain on sale of mortgages | |
| — | | |
| — | | |
| — | | |
| — | | |
| — | | |
| — | | |
| 2 | |
| Gain on non-marketable equity investments | |
| — | | |
| 238 | | |
| — | | |
| 352 | | |
| 70 | | |
| 590 | | |
| 422 | |
| (Loss) gain on defined benefit plan termination | |
| — | | |
| — | | |
| (1,143 | ) | |
| — | | |
| 2,807 | | |
| (1,143 | ) | |
| 2,807 | |
| Gain on bank-owned life insurance death benefit | |
| — | | |
| 778 | | |
| — | | |
| — | | |
| — | | |
| 778 | | |
| — | |
| Other income | |
| — | | |
| — | | |
| — | | |
| — | | |
| — | | |
| — | | |
| 25 | |
| Total non-interest income | |
| 2,714 | | |
| 3,612 | | |
| 1,592 | | |
| 2,979 | | |
| 5,653 | | |
| 10,897 | | |
| 13,332 | |
| | |
| | | |
| | | |
| | | |
| | | |
| | | |
| | | |
| | |
| NON-INTEREST EXPENSE: | |
| | | |
| | | |
| | | |
| | | |
| | | |
| | | |
| | |
| Salaries and employee benefits | |
| 7,739 | | |
| 7,955 | | |
| 8,089 | | |
| 8,431 | | |
| 8,197 | | |
| 32,214 | | |
| 32,697 | |
| Occupancy | |
| 1,198 | | |
| 1,159 | | |
| 1,203 | | |
| 1,348 | | |
| 1,218 | | |
| 4,908 | | |
| 4,984 | |
| Furniture and equipment | |
| 494 | | |
| 482 | | |
| 492 | | |
| 486 | | |
| 479 | | |
| 1,954 | | |
| 2,026 | |
| Data processing | |
| 788 | | |
| 824 | | |
| 792 | | |
| 753 | | |
| 724 | | |
| 3,157 | | |
| 2,885 | |
| Professional fees | |
| 674 | | |
| 643 | | |
| 803 | | |
| 757 | | |
| 617 | | |
| 2,877 | | |
| 2,716 | |
| FDIC insurance | |
| 338 | | |
| 341 | | |
| 290 | | |
| 352 | | |
| 255 | | |
| 1,321 | | |
| 1,048 | |
| Advertising | |
| 377 | | |
| 362 | | |
| 339 | | |
| 417 | | |
| 178 | | |
| 1,495 | | |
| 1,408 | |
| Other | |
| 3,177 | | |
| 2,352 | | |
| 2,543 | | |
| 2,352 | | |
| 2,335 | | |
| 10,424 | | |
| 9,471 | |
| Total non-interest expense | |
| 14,785 | | |
| 14,118 | | |
| 14,551 | | |
| 14,896 | | |
| 14,003 | | |
| 58,350 | | |
| 57,235 | |
| | |
| | | |
| | | |
| | | |
| | | |
| | | |
| | | |
| | |
| INCOME BEFORE INCOME TAXES | |
| 3,619 | | |
| 5,523 | | |
| 3,467 | | |
| 6,975 | | |
| 12,354 | | |
| 19,584 | | |
| 34,629 | |
| | |
| | | |
| | | |
| | | |
| | | |
| | | |
| | | |
| | |
| INCOME TAX PROVISION | |
| 1,108 | | |
| 1,033 | | |
| 704 | | |
| 1,671 | | |
| 3,320 | | |
| 4,516 | | |
| 8,742 | |
| NET INCOME | |
$ | 2,511 | | |
$ | 4,490 | | |
$ | 2,763 | | |
$ | 5,304 | | |
$ | 9,034 | | |
$ | 15,068 | | |
$ | 25,887 | |
| | |
| | | |
| | | |
| | | |
| | | |
| | | |
| | | |
| | |
| Basic earnings per share | |
$ | 0.12 | | |
$ | 0.21 | | |
$ | 0.13 | | |
$ | 0.24 | | |
$ | 0.42 | | |
$ | 0.70 | | |
$ | 1.18 | |
| Weighted average shares outstanding | |
| 21,253,452 | | |
| 21,560,940 | | |
| 21,634,683 | | |
| 21,699,042 | | |
| 21,676,892 | | |
| 21,535,888 | | |
| 21,879,657 | |
| Diluted earnings per share | |
$ | 0.12 | | |
$ | 0.21 | | |
$ | 0.13 | | |
$ | 0.24 | | |
$ | 0.42 | | |
$ | 0.70 | | |
$ | 1.18 | |
| Weighted average diluted shares outstanding | |
| 21,400,664 | | |
| 21,680,113 | | |
| 21,648,235 | | |
| 21,716,869 | | |
| 21,751,409 | | |
| 21,610,329 | | |
| 21,938,323 | |
| | |
| | | |
| | | |
| | | |
| | | |
| | | |
| | | |
| | |
| Other Data: | |
| | | |
| | | |
| | | |
| | | |
| | | |
| | | |
| | |
| Return on average assets (1) | |
| 0.39 | % | |
| 0.70 | % | |
| 0.43 | % | |
| 0.84 | % | |
| 1.40 | % | |
| 0.59 | % | |
| 1.02 | % |
| Return on average equity (1) | |
| 4.31 | % | |
| 7.60 | % | |
| 4.72 | % | |
| 9.31 | % | |
| 16.67 | % | |
| 6.47 | % | |
| 11.85 | % |
| Efficiency ratio | |
| 78.27 | % | |
| 70.61 | % | |
| 78.92 | % | |
| 69.34 | % | |
| 52.83 | % | |
| 74.04 | % | |
| 61.83 | % |
| Adjusted efficiency ratio (2) | |
| 78.26 | % | |
| 74.38 | % | |
| 74.31 | % | |
| 70.49 | % | |
| 59.31 | % | |
| 74.25 | % | |
| 63.55 | % |
| Net interest margin | |
| 2.64 | % | |
| 2.70 | % | |
| 2.81 | % | |
| 3.14 | % | |
| 3.44 | % | |
| 2.82 | % | |
| 3.31 | % |
| Net interest margin, on a fully tax-equivalent basis | |
| 2.66 | % | |
| 2.72 | % | |
| 2.83 | % | |
| 3.16 | % | |
| 3.47 | % | |
| 2.84 | % | |
| 3.33 | % |
| (2) | The adjusted efficiency ratio (non-GAAP) represents the ratio
of operating expenses divided by the sum of net interest and dividend income and non-interest income, excluding realized and unrealized
gains and losses on securities, loss on disposal of premises and equipment, gain on non-marketable equity investments, gains and losses
on defined benefit plan termination and gain on bank-owned life insurance death benefit. |
WESTERN NEW ENGLAND BANCORP, INC. AND SUBSIDIARIES
Consolidated Balance Sheets
(Dollars in thousands)
(Unaudited)
| | |
December 31, | | |
September 30, | | |
June 30, | | |
March 31, | | |
December 31, | |
| | |
2023 | | |
2023 | | |
2023 | | |
2023 | | |
2022 | |
| Cash and cash equivalents | |
$ | 28,840 | | |
$ | 62,267 | | |
$ | 31,689 | | |
$ | 23,230 | | |
$ | 30,342 | |
| Available-for-sale securities, at fair value | |
| 137,115 | | |
| 130,709 | | |
| 141,481 | | |
| 146,373 | | |
| 146,997 | |
| Held-to-maturity securities, at amortized cost | |
| 223,370 | | |
| 225,020 | | |
| 222,900 | | |
| 226,996 | | |
| 230,168 | |
| Marketable equity securities, at fair value | |
| 196 | | |
| — | | |
| — | | |
| 6,309 | | |
| 6,237 | |
| Federal Home Loan Bank of Boston and other restricted stock - at cost | |
| 3,707 | | |
| 3,063 | | |
| 3,226 | | |
| 7,173 | | |
| 3,352 | |
| | |
| | | |
| | | |
| | | |
| | | |
| | |
| Loans | |
| 2,027,317 | | |
| 2,014,820 | | |
| 2,015,593 | | |
| 2,006,499 | | |
| 1,991,400 | |
| Allowance for credit losses (1) | |
| (20,267 | ) | |
| (19,978 | ) | |
| (19,647 | ) | |
| (19,031 | ) | |
| (19,931 | ) |
| Net loans | |
| 2,007,050 | | |
| 1,994,842 | | |
| 1,995,946 | | |
| 1,987,468 | | |
| 1,971,469 | |
| | |
| | | |
| | | |
| | | |
| | | |
| | |
| Bank-owned life insurance | |
| 75,145 | | |
| 74,713 | | |
| 75,554 | | |
| 75,060 | | |
| 74,620 | |
| Goodwill | |
| 12,487 | | |
| 12,487 | | |
| 12,487 | | |
| 12,487 | | |
| 12,487 | |
| Core deposit intangible | |
| 1,813 | | |
| 1,906 | | |
| 2,000 | | |
| 2,094 | | |
| 2,188 | |
| Other assets | |
| 74,848 | | |
| 79,998 | | |
| 77,001 | | |
| 74,825 | | |
| 75,290 | |
| TOTAL ASSETS | |
$ | 2,564,571 | | |
$ | 2,585,005 | | |
$ | 2,562,284 | | |
$ | 2,562,015 | | |
$ | 2,553,150 | |
| | |
| | | |
| | | |
| | | |
| | | |
| | |
| Total deposits | |
$ | 2,143,744 | | |
$ | 2,176,303 | | |
$ | 2,157,974 | | |
$ | 2,157,128 | | |
$ | 2,229,443 | |
| Short-term borrowings | |
| 16,100 | | |
| 8,890 | | |
| 7,190 | | |
| 98,990 | | |
| 41,350 | |
| Long-term debt | |
| 120,646 | | |
| 121,178 | | |
| 121,178 | | |
| 31,178 | | |
| 1,178 | |
| Subordinated debt | |
| 19,712 | | |
| 19,702 | | |
| 19,692 | | |
| 19,682 | | |
| 19,673 | |
| Securities pending settlement | |
| 140 | | |
| 2,253 | | |
| — | | |
| — | | |
| 133 | |
| Other liabilities | |
| 26,820 | | |
| 25,765 | | |
| 22,252 | | |
| 21,815 | | |
| 33,230 | |
| TOTAL LIABILITIES | |
| 2,327,162 | | |
| 2,354,091 | | |
| 2,328,286 | | |
| 2,328,793 | | |
| 2,325,007 | |
| | |
| | | |
| | | |
| | | |
| | | |
| | |
| TOTAL SHAREHOLDERS' EQUITY | |
| 237,409 | | |
| 230,914 | | |
| 233,998 | | |
| 233,222 | | |
| 228,143 | |
| TOTAL LIABILITIES AND SHAREHOLDERS' EQUITY | |
$ | 2,564,571 | | |
$ | 2,585,005 | | |
$ | 2,562,284 | | |
$ | 2,562,015 | | |
$ | 2,553,150 | |
| (1) | The Company adopted ASU 2016-13 on January 1, 2023 with a modified
retrospective approach. Accordingly, beginning with March 31, 2023, the allowance for credit losses was determined in accordance with
ASC 326, “Financial Instruments-Credit Losses.” |
WESTERN NEW ENGLAND BANCORP, INC. AND SUBSIDIARIES
Other Data
(Dollars in thousands, except per share data)
(Unaudited)
| | |
Three Months Ended | |
| | |
December 31, | | |
September 30, | | |
June 30, | | |
March 31, | | |
December 31, | |
| | |
2023 | | |
2023 | | |
2023 | | |
2023 | | |
2022 | |
| Shares outstanding at end of period | |
| 21,666,807 | | |
| 21,927,242 | | |
| 22,082,403 | | |
| 22,209,347 | | |
| 22,216,789 | |
| | |
| | | |
| | | |
| | | |
| | | |
| | |
| Operating results: | |
| | | |
| | | |
| | | |
| | | |
| | |
| Net interest income | |
$ | 16,176 | | |
$ | 16,383 | | |
$ | 16,846 | | |
$ | 18,504 | | |
$ | 20,854 | |
| Provision for (reversal of) credit losses | |
| 486 | | |
| 354 | | |
| 420 | | |
| (388 | ) | |
| 150 | |
| Non-interest income | |
| 2,714 | | |
| 3,612 | | |
| 1,592 | | |
| 2,979 | | |
| 5,653 | |
| Non-interest expense | |
| 14,785 | | |
| 14,118 | | |
| 14,551 | | |
| 14,896 | | |
| 14,003 | |
| Income before income provision for income taxes | |
| 3,619 | | |
| 5,523 | | |
| 3,467 | | |
| 6,975 | | |
| 12,354 | |
| Income tax provision | |
| 1,108 | | |
| 1,033 | | |
| 704 | | |
| 1,671 | | |
| 3,320 | |
| Net income | |
| 2,511 | | |
| 4,490 | | |
| 2,763 | | |
| 5,304 | | |
| 9,034 | |
| | |
| | | |
| | | |
| | | |
| | | |
| | |
| Performance Ratios: | |
| | | |
| | | |
| | | |
| | | |
| | |
| Net interest margin, on a fully tax-equivalent basis | |
| 2.66 | % | |
| 2.72 | % | |
| 2.83 | % | |
| 3.16 | % | |
| 3.47 | % |
| Interest rate spread, on a fully tax-equivalent basis | |
| 1.98 | % | |
| 2.09 | % | |
| 2.29 | % | |
| 2.76 | % | |
| 3.26 | % |
| Return on average assets | |
| 0.39 | % | |
| 0.70 | % | |
| 0.43 | % | |
| 0.84 | % | |
| 1.40 | % |
| Return on average equity | |
| 4.31 | % | |
| 7.60 | % | |
| 4.72 | % | |
| 9.31 | % | |
| 16.67 | % |
| Adjusted efficiency ratio (non-GAAP) (1) | |
| 78.26 | % | |
| 74.38 | % | |
| 74.31 | % | |
| 70.49 | % | |
| 59.31 | % |
| | |
| | | |
| | | |
| | | |
| | | |
| | |
| Per Common Share Data: | |
| | | |
| | | |
| | | |
| | | |
| | |
| Basic earnings per share | |
$ | 0.12 | | |
$ | 0.21 | | |
$ | 0.13 | | |
$ | 0.24 | | |
$ | 0.42 | |
| Per diluted share | |
| 0.12 | | |
| 0.21 | | |
| 0.13 | | |
| 0.24 | | |
| 0.42 | |
| Cash dividend declared | |
| 0.07 | | |
| 0.07 | | |
| 0.07 | | |
| 0.07 | | |
| 0.06 | |
| Book value per share | |
| 10.96 | | |
| 10.53 | | |
| 10.60 | | |
| 10.50 | | |
| 10.27 | |
| angible book value per share (non-GAAP) | |
| 10.30 | | |
| 9.87 | | |
| 9.94 | | |
| 9.84 | | |
| 9.61 | |
| | |
| | | |
| | | |
| | | |
| | | |
| | |
| Asset Quality: | |
| | | |
| | | |
| | | |
| | | |
| | |
| 30-89 day delinquent loans | |
$ | 4,605 | | |
$ | 4,097 | | |
$ | 4,092 | | |
$ | 1,669 | | |
$ | 2,578 | |
| 90 days or more delinquent loans | |
| 1,394 | | |
| 1,527 | | |
| 1,324 | | |
| 1,377 | | |
| 1,891 | |
| Total delinquent loans | |
| 5,999 | | |
| 5,624 | | |
| 5,416 | | |
| 3,046 | | |
| 4,469 | |
| Total delinquent loans as a percentage of total loans | |
| 0.30 | % | |
| 0.28 | % | |
| 0.27 | % | |
| 0.15 | % | |
| 0.22 | % |
| Nonperforming loans | |
$ | 6,421 | | |
$ | 6,290 | | |
$ | 5,755 | | |
$ | 5,794 | | |
$ | 5,694 | |
| Nonperforming loans as a percentage of total loans | |
| 0.32 | % | |
| 0.31 | % | |
| 0.29 | % | |
| 0.29 | % | |
| 0.29 | % |
| Nonperforming assets as a percentage of total assets | |
| 0.25 | % | |
| 0.24 | % | |
| 0.22 | % | |
| 0.23 | % | |
| 0.22 | % |
| Allowance for credit losses as a percentage of nonperforming loans | |
| 315,64 | % | |
| 317.62 | % | |
| 341.39 | % | |
| 328.46 | % | |
| 350.04 | % |
| Allowance for credit losses as a percentage of total loans | |
| 1.00 | % | |
| 0.99 | % | |
| 0.97 | % | |
| 0.95 | % | |
| 1.00 | % |
| Net loan charge-offs (recoveries) | |
$ | 136 | | |
$ | 78 | | |
$ | (25 | ) | |
$ | 1,850 | | |
$ | 426 | |
| Net loan charge-offs (recoveries) as a percentage of average loans | |
| 0.01 | % | |
| 0.00 | % | |
| 0.00 | % | |
| 0.09 | % | |
| 0.02 | % |
| (1) | The adjusted efficiency ratio (non-GAAP) represents the ratio
of operating expenses divided by the sum of net interest and dividend income and non-interest income, excluding realized and unrealized
gains and losses on securities, loss on disposal of premises and equipment, gain on non-marketable equity investments, gains and losses
on defined benefit plan termination and gain on bank-owned life insurance death benefit. |
The following table sets forth the information relating to our average
balances and net interest income for the three months ended December 31, 2023, September 30, 2023 and December 31, 2022 and reflects the
average yield on interest-earning assets and average cost of interest-bearing liabilities for the periods indicated.
| | |
Three Months Ended | |
| | |
December 31, 2023 | | |
September 30, 2023 | | |
December 31, 2022 | |
| | |
Average
Balance | | |
Interest | | |
Average Yield/
Cost(8) | | |
Average
Balance | | |
Interest | | |
Average Yield/
Cost(8) | | |
Average
Balance | | |
Interest | | |
Average Yield/
Cost(8) | |
| | |
(Dollars in thousands) | |
| ASSETS: | |
| | |
| | |
| | |
| | |
| | |
| | |
| | |
| | |
| |
| Interest-earning assets | |
| | | |
| | | |
| | | |
| | | |
| | | |
| | | |
| | | |
| | | |
| | |
| Loans(1)(2) | |
$ | 2,017,089 | | |
$ | 24,052 | | |
| 4.73 | % | |
$ | 2,007,267 | | |
$ | 23,568 | | |
| 4.66 | % | |
$ | 1,994,874 | | |
$ | 21,403 | | |
| 4.26 | % |
| Securities(2) | |
| 355,078 | | |
| 2,094 | | |
| 2.34 | | |
| 361,216 | | |
| 2,033 | | |
| 2.23 | | |
| 388,529 | | |
| 2,175 | | |
| 2.22 | |
| Other investments | |
| 12,119 | | |
| 140 | | |
| 4.58 | | |
| 12,155 | | |
| 166 | | |
| 5.42 | | |
| 10,638 | | |
| 75 | | |
| 2.80 | |
| Short-term investments(3) | |
| 42,826 | | |
| 597 | | |
| 5.53 | | |
| 22,349 | | |
| 251 | | |
| 4.46 | | |
| 7,635 | | |
| 62 | | |
| 3.22 | |
| Total interest-earning assets | |
| 2,427,112 | | |
| 26,883 | | |
| 4.39 | | |
| 2,402,987 | | |
| 26,018 | | |
| 4.30 | | |
| 2,401,676 | | |
| 23,715 | | |
| 3.92 | |
| Total non-interest-earning assets | |
| 158,435 | | |
| | | |
| | | |
| 156,503 | | |
| | | |
| | | |
| 159,042 | | |
| | | |
| | |
| Total assets | |
$ | 2,585,547 | | |
| | | |
| | | |
$ | 2,559,490 | | |
| | | |
| | | |
$ | 2,560,718 | | |
| | | |
| | |
| | |
| | | |
| | | |
| | | |
| | | |
| | | |
| | | |
| | | |
| | | |
| | |
| LIABILITIES AND EQUITY: | |
| | | |
| | | |
| | | |
| | | |
| | | |
| | | |
| | | |
| | | |
| | |
| Interest-bearing liabilities | |
| | | |
| | | |
| | | |
| | | |
| | | |
| | | |
| | | |
| | | |
| | |
| Interest-bearing checking accounts | |
$ | 139,894 | | |
| 260 | | |
| 0.74 | | |
$ | 144,792 | | |
| 269 | | |
| 0.74 | | |
$ | 149,928 | | |
| 206 | | |
| 0.55 | |
| Savings accounts | |
| 187,047 | | |
| 39 | | |
| 0.08 | | |
| 195,020 | | |
| 41 | | |
| 0.08 | | |
| 221,964 | | |
| 39 | | |
| 0.07 | |
| Money market accounts | |
| 657,407 | | |
| 2,716 | | |
| 1.64 | | |
| 656,066 | | |
| 2,488 | | |
| 1.50 | | |
| 862,523 | | |
| 1,375 | | |
| 0.63 | |
| Time deposit accounts | |
| 603,860 | | |
| 5,758 | | |
| 3.78 | | |
| 563,135 | | |
| 4,906 | | |
| 3.46 | | |
| 359,555 | | |
| 586 | | |
| 0.65 | |
| Total interest-bearing deposits | |
| 1,588,208 | | |
| 8,773 | | |
| 2.19 | | |
| 1,559,013 | | |
| 7,704 | | |
| 1.96 | | |
| 1,593,970 | | |
| 2,206 | | |
| 0.55 | |
| Borrowings | |
| 149,585 | | |
| 1,821 | | |
| 4.83 | | |
| 149,507 | | |
| 1,814 | | |
| 4.81 | | |
| 48,579 | | |
| 525 | | |
| 4.29 | |
| Interest-bearing liabilities | |
| 1,737,793 | | |
| 10,594 | | |
| 2.42 | | |
| 1,708,520 | | |
| 9,518 | | |
| 2.21 | | |
| 1,642,549 | | |
| 2,731 | | |
| 0.66 | |
| Non-interest-bearing deposits | |
| 588,748 | | |
| | | |
| | | |
| 591,933 | | |
| | | |
| | | |
| 663,814 | | |
| | | |
| | |
| Other non-interest-bearing liabilities | |
| 27,847 | | |
| | | |
| | | |
| 24,504 | | |
| | | |
| | | |
| 39,399 | | |
| | | |
| | |
| Total non-interest-bearing liabilities | |
| 616,595 | | |
| | | |
| | | |
| 616,437 | | |
| | | |
| | | |
| 703,213 | | |
| | | |
| | |
| Total liabilities | |
| 2,354,388 | | |
| | | |
| | | |
| 2,324,957 | | |
| | | |
| | | |
| 2,345,762 | | |
| | | |
| | |
| Total equity | |
| 231,159 | | |
| | | |
| | | |
| 234,533 | | |
| | | |
| | | |
| 214,956 | | |
| | | |
| | |
| Total liabilities and equity | |
$ | 2,585,547 | | |
| | | |
| | | |
$ | 2,559,490 | | |
| | | |
| | | |
$ | 2,560,718 | | |
| | | |
| | |
| Less: Tax-equivalent adjustment(2) | |
| | | |
| (113 | ) | |
| | | |
| | | |
| (117 | ) | |
| | | |
| | | |
| (130 | ) | |
| | |
| Net interest and dividend income | |
| | | |
$ | 16,176 | | |
| | | |
| | | |
$ | 16,383 | | |
| | | |
| | | |
$ | 20,854 | | |
| | |
| Net interest rate spread(4) | |
| | | |
| | | |
| 1.96 | % | |
| | | |
| | | |
| 2.07 | % | |
| | | |
| | | |
| 3.24 | % |
| Net interest rate spread, on a tax-equivalent basis(5) | |
| | | |
| | | |
| 1.98 | % | |
| | | |
| | | |
| 2.09 | % | |
| | | |
| | | |
| 3.26 | % |
| Net interest margin(6) | |
| | | |
| | | |
| 2.64 | % | |
| | | |
| | | |
| 2.70 | % | |
| | | |
| | | |
| 3.44 | % |
| Net interest margin, on a tax-equivalent basis(7) | |
| | | |
| | | |
| 2.66 | % | |
| | | |
| | | |
| 2.72 | % | |
| | | |
| | | |
| 3.47 | % |
| Ratio of average interest-earning assets to average
interest-bearing liabilities | |
| | | |
| | | |
| 139.67 | % | |
| | | |
| | | |
| 140.65 | % | |
| | | |
| | | |
| 146.22 | % |
The following tables set forth the information relating to our average
balances and net interest income for the twelve months ended December 31, 2023 and 2022 and reflect the average yield on interest-earning
assets and average cost of interest-bearing liabilities for the periods indicated.
| | |
Twelve Months Ended December 31, | |
| | |
2023 | | |
2022 | |
| | |
Average
Balance | | |
Interest | | |
Average Yield/
Cost | | |
Average
Balance | | |
Interest | | |
Average Yield/
Cost | |
| | |
(Dollars in thousands) | |
| ASSETS: | |
| | |
| | |
| | |
| | |
| | |
| |
| Interest-earning assets | |
| | | |
| | | |
| | | |
| | | |
| | | |
| | |
| Loans(1)(2) | |
$ | 2,006,166 | | |
$ | 91,640 | | |
| 4.57 | % | |
$ | 1,953,527 | | |
$ | 77,758 | | |
| 3.98 | % |
| Securities(2) | |
| 368,201 | | |
| 8,371 | | |
| 2.27 | | |
| 407,444 | | |
| 8,299 | | |
| 2.04 | |
| Other investments | |
| 12,425 | | |
| 558 | | |
| 4.49 | | |
| 10,289 | | |
| 177 | | |
| 1.72 | |
| Short-term investments(3) | |
| 20,459 | | |
| 1,021 | | |
| 4.99 | | |
| 25,712 | | |
| 191 | | |
| 0.74 | |
| Total interest-earning assets | |
| 2,407,251 | | |
| 101,590 | | |
| 4.22 | | |
| 2,396,972 | | |
| 86,425 | | |
| 3.61 | |
| Total non-interest-earning assets | |
| 155,511 | | |
| | | |
| | | |
| 152,941 | | |
| | | |
| | |
| Total assets | |
$ | 2,562,762 | | |
| | | |
| | | |
$ | 2,549,913 | | |
| | | |
| | |
| | |
| | | |
| | | |
| | | |
| | | |
| | | |
| | |
| LIABILITIES AND EQUITY: | |
| | | |
| | | |
| | | |
| | | |
| | | |
| | |
| Interest-bearing liabilities | |
| | | |
| | | |
| | | |
| | | |
| | | |
| | |
| Interest-bearing checking accounts | |
$ | 142,005 | | |
| 1,041 | | |
| 0.73 | % | |
$ | 139,993 | | |
| 530 | | |
| 0.38 | % |
| Savings accounts | |
| 202,354 | | |
| 181 | | |
| 0.09 | | |
| 222,267 | | |
| 161 | | |
| 0.07 | |
| Money market accounts | |
| 697,621 | | |
| 9,529 | | |
| 1.37 | | |
| 890,763 | | |
| 3,187 | | |
| 0.36 | |
| Time deposit accounts | |
| 524,827 | | |
| 15,898 | | |
| 3.03 | | |
| 363,258 | | |
| 1,474 | | |
| 0.41 | |
| Total interest-bearing deposits | |
| 1,566,807 | | |
| 26,649 | | |
| 1.70 | | |
| 1,616,281 | | |
| 5,352 | | |
| 0.33 | |
| Short-term borrowings and long-term debt | |
| 135,532 | | |
| 6,560 | | |
| 4.84 | | |
| 31,556 | | |
| 1,344 | | |
| 4.26 | |
| Total interest-bearing liabilities | |
| 1,702,339 | | |
| 33,209 | | |
| 1.95 | | |
| 1,647,837 | | |
| 6,696 | | |
| 0.41 | |
| Non-interest-bearing deposits | |
| 602,652 | | |
| | | |
| | | |
| 647,971 | | |
| | | |
| | |
| Other non-interest-bearing liabilities | |
| 24,885 | | |
| | | |
| | | |
| 35,615 | | |
| | | |
| | |
| Total non-interest-bearing liabilities | |
| 627,537 | | |
| | | |
| | | |
| 683,586 | | |
| | | |
| | |
| | |
| | | |
| | | |
| | | |
| | | |
| | | |
| | |
| Total liabilities | |
| 2,329,876 | | |
| | | |
| | | |
| 2,331,423 | | |
| | | |
| | |
| Total equity | |
| 232,886 | | |
| | | |
| | | |
| 218,490 | | |
| | | |
| | |
| Total liabilities and equity | |
$ | 2,562,762 | | |
| | | |
| | | |
$ | 2,549,913 | | |
| | | |
| | |
| Less: Tax-equivalent adjustment (2) | |
| | | |
| (472 | ) | |
| | | |
| | | |
| (497 | ) | |
| | |
| Net interest and dividend income | |
| | | |
$ | 67,909 | | |
| | | |
| | | |
$ | 79,232 | | |
| | |
| Net interest rate spread (4) | |
| | | |
| | | |
| 2.25 | % | |
| | | |
| | | |
| 3.18 | % |
| Net interest rate spread, on a tax-equivalent basis (5) | |
| | | |
| | | |
| 2.27 | % | |
| | | |
| | | |
| 3.20 | % |
| Net interest margin (6) | |
| | | |
| | | |
| 2.82 | % | |
| | | |
| | | |
| 3.31 | % |
| Net interest margin, on a tax-equivalent basis (7) | |
| | | |
| | | |
| 2.84 | % | |
| | | |
| | | |
| 3.33 | % |
| Ratio of average interest-earning assets to average interest-bearing liabilities | |
| | | |
| | | |
| 141.41 | % | |
| | | |
| | | |
| 145.46 | % |
| (1) | Loans, including nonaccrual loans, are net of deferred loan origination costs and unadvanced funds. |
| (2) | Loan and securities income are presented on a tax-equivalent basis using a tax rate of 21%. The tax-equivalent
adjustment is deducted from tax-equivalent net interest and dividend income to agree to the amount reported on the consolidated statements
of net income. |
| (3) | Short-term investments include federal funds sold. |
| (4) | Net interest rate spread represents the difference between the weighted average yield on interest-earning
assets and the weighted average cost of interest-bearing liabilities. |
| (5) | Net interest rate spread, on a tax-equivalent basis, represents the difference between the tax-equivalent
weighted average yield on interest-earning assets and the weighted average cost of interest-bearing liabilities. |
| (6) | Net interest margin represents net interest and dividend income as a percentage of average interest-earning
assets. |
| (7) | Net interest margin, on a tax-equivalent basis, represents tax-equivalent net interest and dividend income
as a percentage of average interest-earning assets. |
Reconciliation of Non-GAAP to GAAP Financial
Measures
The Company believes that certain non-GAAP financial
measures provide information to investors that is useful in understanding its results of operations and financial condition. Because
not all companies use the same calculation, this presentation may not be comparable to other similarly titled measures calculated by other
companies. A reconciliation of these non-GAAP financial measures is provided below.
| | |
For the quarter ended | |
| | |
12/31/2023 | | |
9/30/2023 | | |
6/30/2023 | | |
3/31/2023 | | |
12/31/2022 | |
| | |
(In thousands) | |
| | |
| | | |
| | | |
| | | |
| | | |
| | |
| Loans (no tax adjustment) | |
$ | 23,939 | | |
$ | 23,451 | | |
$ | 22,450 | | |
$ | 21,329 | | |
$ | 21,274 | |
| Tax-equivalent adjustment | |
| 113 | | |
| 117 | | |
| 122 | | |
| 120 | | |
| 129 | |
| Loans (tax-equivalent basis) | |
$ | 24,052 | | |
$ | 23,568 | | |
$ | 22,572 | | |
$ | 21,449 | | |
$ | 21,403 | |
| | |
| | | |
| | | |
| | | |
| | | |
| | |
| Securities (no tax adjustment) | |
$ | 2,094 | | |
$ | 2,033 | | |
$ | 2,094 | | |
$ | 2,149 | | |
$ | 2,174 | |
| Tax-equivalent adjustment | |
| — | | |
| — | | |
| — | | |
| — | | |
| 1 | |
| Securities (tax-equivalent basis) | |
$ | 2,094 | | |
$ | 2,033 | | |
$ | 2,094 | | |
$ | 2,149 | | |
$ | 2,175 | |
| | |
| | | |
| | | |
| | | |
| | | |
| | |
| Net interest income (no tax adjustment) | |
$ | 16,176 | | |
$ | 16,383 | | |
$ | 16,846 | | |
$ | 18,504 | | |
$ | 20,854 | |
| Tax equivalent adjustment | |
| 113 | | |
| 117 | | |
| 122 | | |
| 120 | | |
| 130 | |
| Net interest income (tax-equivalent basis) | |
$ | 16,289 | | |
$ | 16,500 | | |
$ | 16,968 | | |
$ | 18,624 | | |
$ | 20,984 | |
| | |
| | | |
| | | |
| | | |
| | | |
| | |
| Net interest income (no tax adjustment) | |
$ | 16,176 | | |
$ | 16,383 | | |
$ | 16,846 | | |
$ | 18,504 | | |
$ | 20,854 | |
| Less: | |
| | | |
| | | |
| | | |
| | | |
| | |
| Purchase accounting adjustments | |
| 3 | | |
| 4 | | |
| 5 | | |
| (62 | ) | |
| 87 | |
| Prepayment penalties and fees | |
| 7 | | |
| 14 | | |
| 43 | | |
| — | | |
| 134 | |
| PPP Income | |
| 46 | | |
| 12 | | |
| 26 | | |
| 15 | | |
| 18 | |
| Adjusted net interest income (non-GAAP) | |
$ | 16,120 | | |
$ | 16,353 | | |
$ | 16,772 | | |
$ | 18,551 | | |
$ | 20,615 | |
| | |
| | | |
| | | |
| | | |
| | | |
| | |
| Average interest-earning assets | |
$ | 2,427,112 | | |
$ | 2,402,987 | | |
$ | 2,405,077 | | |
$ | 2,393,504 | | |
$ | 2,401,676 | |
| Average interest-earning assets, excluding average PPP loans | |
$ | 2,425,923 | | |
$ | 2,401,460 | | |
$ | 2,403,076 | | |
$ | 2,391,305 | | |
$ | 2,399,297 | |
| Net interest margin (no tax adjustment) | |
| 2.64 | % | |
| 2.70 | % | |
| 2.81 | % | |
| 3.14 | % | |
| 3.44 | % |
| Net interest margin, tax-equivalent | |
| 2.66 | % | |
| 2.72 | % | |
| 2.83 | % | |
| 3.16 | % | |
| 3.47 | % |
| | |
For the quarter ended | |
| | |
12/31/2023 | | |
9/30/2023 | | |
6/30/2023 | | |
3/31/2023 | | |
12/31/2022 | |
| | |
(In thousands) | |
| | |
| | | |
| | | |
| | | |
| | | |
| | |
| Book Value per Share (GAAP) | |
$ | 10.96 | | |
$ | 10.53 | | |
$ | 10.60 | | |
$ | 10.50 | | |
$ | 10.27 | |
| Non-GAAP adjustments: | |
| | | |
| | | |
| | | |
| | | |
| | |
| Goodwill | |
| (0.58 | ) | |
| (0.57 | ) | |
| (0.57 | ) | |
| (0.56 | ) | |
| (0.56 | ) |
| Core deposit intangible | |
| (0.08 | ) | |
| (0.09 | ) | |
| (0.09 | ) | |
| (0.10 | ) | |
| (0.10 | ) |
| Tangible Book Value per Share (non-GAAP) | |
$ | 10.30 | | |
$ | 9.87 | | |
$ | 9.94 | | |
$ | 9.84 | | |
$ | 9.61 | |
| | |
| | | |
| | | |
| | | |
| | | |
| | |
| | |
| | | |
| | | |
| | | |
| | | |
| | |
| Total Bank Equity (GAAP) | |
$ | 242,780 | | |
$ | 234,612 | | |
$ | 240,041 | | |
$ | 238,887 | | |
$ | 233,882 | |
| Non-GAAP adjustments: | |
| | | |
| | | |
| | | |
| | | |
| | |
| Goodwill | |
| (12,487 | ) | |
| (12,487 | ) | |
| (12,487 | ) | |
| (12,487 | ) | |
| (12,487 | ) |
| Core deposit intangible net of associated deferred tax liabilities | |
| (1,303 | ) | |
| (1,370 | ) | |
| (1,438 | ) | |
| (1,505 | ) | |
| (1,573 | ) |
| Tangible Capital (non-GAAP) | |
$ | 228,990 | | |
$ | 220,755 | | |
$ | 226,116 | | |
$ | 224,895 | | |
$ | 219,822 | |
| | |
| | | |
| | | |
| | | |
| | | |
| | |
| Tangible Capital (non-GAAP) | |
$ | 228,990 | | |
$ | 220,755 | | |
$ | 226,116 | | |
$ | 224,895 | | |
$ | 219,822 | |
| Unrealized losses on HTM securities net of tax | |
| (25,649 | ) | |
| (34,622 | ) | |
| (27,286 | ) | |
| (25,825 | ) | |
| (28,194 | ) |
| Adjusted Tangible Capital for Impact of Unrealized Losses on HTM Securities Net of Tax (non-GAAP) | |
$ | 203,341 | | |
$ | 186,133 | | |
$ | 198,830 | | |
$ | 199,070 | | |
$ | 191,628 | |
| | |
| | | |
| | | |
| | | |
| | | |
| | |
| Common Equity Tier (CET) 1 Capital | |
$ | 250,734 | | |
$ | 249,441 | | |
$ | 249,340 | | |
$ | 247,996 | | |
$ | 244,864 | |
| Unrealized losses on HTM securities net of tax | |
| (25,649 | ) | |
| (34,622 | ) | |
| (27,286 | ) | |
| (25,825 | ) | |
| (28,194 | ) |
| Unrealized losses on defined benefit plan net of tax | |
| — | | |
| — | | |
| — | | |
| (1,079 | ) | |
| (1,079 | ) |
| Adjusted CET 1 Capital for Impact of Net AFS Securities Losses (non-GAAP) | |
$ | 225,085 | | |
$ | 214,819 | | |
$ | 222,054 | | |
$ | 221,092 | | |
$ | 215,591 | |
| | |
| | | |
| | | |
| | | |
| | | |
| | |
| Total Assets for Leverage Ratio (non-GAAP) | |
$ | 2,607,260 | | |
$ | 2,574,402 | | |
$ | 2,572,583 | | |
$ | 2,560,973 | | |
$ | 2,579,141 | |
| | |
| | | |
| | | |
| | | |
| | | |
| | |
| Tier 1 Leverage Ratio | |
| 9.62 | % | |
| 9.69 | % | |
| 9.69 | % | |
| 9.68 | % | |
| 9.49 | % |
| | |
| | | |
| | | |
| | | |
| | | |
| | |
| Tangible Common Equity (non-GAAP) = Tangible Capital (non-GAAP)/Total Assets for Leverage Ratio (non-GAAP) | |
| 8.78 | % | |
| 8.58 | % | |
| 8.79 | % | |
| 8.78 | % | |
| 8.52 | % |
| | |
| | | |
| | | |
| | | |
| | | |
| | |
| Adjusted Tangible Common Equity for AFS Impact (non-GAAP) = Adjusted CET 1 Capital for Impact of Net AFS Securities Losses (non-GAAP)/Total Assets for Leverage Ratio (non-GAAP) | |
| 8.63 | % | |
| 8.34 | % | |
| 8.63 | % | |
| 8.63 | % | |
| 8.36 | % |
| | |
| | | |
| | | |
| | | |
| | | |
| | |
| Adjusted Tangible Common Equity for HTM Impact (non-GAAP) = Adjusted Tangible Capital for Impact of Unrealized Losses on HTM Securities Net of Tax (non-GAAP)/Total Assets for Leverage Ratio (non-GAAP) | |
| 7.80 | % | |
| 7.23 | % | |
| 7.73 | % | |
| 7.77 | % | |
| 7.43 | % |
| | |
For the quarter ended | |
| | |
12/31/2023 | | |
9/30/2023 | | |
6/30/2023 | | |
3/31/2023 | | |
12/31/2022 | |
| | |
(In thousands) | |
| | |
| | |
| | |
| | |
| | |
| |
| Income Before Income Taxes (GAAP) | |
$ | 3,619 | | |
$ | 5,523 | | |
$ | 3,467 | | |
$ | 6,975 | | |
$ | 12,354 | |
| | |
| | | |
| | | |
| | | |
| | | |
| | |
| Non-GAAP adjustments: | |
| | | |
| | | |
| | | |
| | | |
| | |
| | |
| | | |
| | | |
| | | |
| | | |
| | |
| Provision for (reversal of) credit losses | |
| 486 | | |
| 354 | | |
| 420 | | |
| (388 | ) | |
| 150 | |
| | |
| | | |
| | | |
| | | |
| | | |
| | |
| PPP Income | |
| (46 | ) | |
| (12 | ) | |
| (26 | ) | |
| (15 | ) | |
| (18 | ) |
| Loss (gain) on defined benefit plan termination | |
| — | | |
| — | | |
| 1,143 | | |
| — | | |
| (2,807 | ) |
| Gain on bank-owned life insurance death benefit | |
| — | | |
| (778 | ) | |
| — | | |
| — | | |
| — | |
| Income Before Taxes, Provision, PPP Income, Defined Benefit Termination and Bank-Owned Life Insurance Death Benefit (non-GAAP) | |
$ | 4,059 | | |
$ | 5,087 | | |
$ | 5,004 | | |
$ | 6,572 | | |
$ | 9,679 | |
| | |
| | | |
| | | |
| | | |
| | | |
| | |
| Efficiency Ratio: | |
| | | |
| | | |
| | | |
| | | |
| | |
| Non-interest Expense (GAAP) | |
$ | 14,785 | | |
$ | 14,118 | | |
$ | 14,551 | | |
$ | 14,896 | | |
$ | 14,003 | |
| Non-interest Expense for Adjusted Efficiency Ratio (non-GAAP) | |
$ | 14,785 | | |
$ | 14,118 | | |
$ | 14,551 | | |
$ | 14,896 | | |
$ | 14,003 | |
| | |
| | | |
| | | |
| | | |
| | | |
| | |
| Net Interest Income (GAAP) | |
$ | 16,176 | | |
$ | 16,383 | | |
$ | 16,846 | | |
$ | 18,504 | | |
$ | 20,854 | |
| | |
| | | |
| | | |
| | | |
| | | |
| | |
| Non-interest Income (GAAP) | |
$ | 2,714 | | |
$ | 3,612 | | |
$ | 1,592 | | |
$ | 2,979 | | |
$ | 5,653 | |
| Non-GAAP adjustments: | |
| | | |
| | | |
| | | |
| | | |
| | |
| Unrealized losses (gains) on marketable equity securities | |
| 1 | | |
| — | | |
| — | | |
| — | | |
| (19 | ) |
| Gain on non-marketable equity investments | |
| — | | |
| (238 | ) | |
| — | | |
| (352 | ) | |
| (70 | ) |
| Loss on disposal of premises and equipment | |
| — | | |
| 3 | | |
| — | | |
| — | | |
| — | |
| Loss (gain) on defined benefit plan termination | |
| — | | |
| — | | |
| 1,143 | | |
| — | | |
| (2,807 | ) |
| Gain on bank-owned life insurance death benefit | |
| — | | |
| (778 | ) | |
| — | | |
| — | | |
| — | |
| Non-interest Income for Adjusted Efficiency Ratio (non-GAAP) | |
$ | 2,715 | | |
$ | 2,599 | | |
$ | 2,735 | | |
$ | 2,627 | | |
$ | 2,757 | |
| | |
| | | |
| | | |
| | | |
| | | |
| | |
| Total Revenue for Adjusted Efficiency Ratio (non-GAAP) | |
$ | 18,891 | | |
$ | 18,982 | | |
$ | 19,581 | | |
$ | 21,131 | | |
$ | 23,611 | |
| | |
| | | |
| | | |
| | | |
| | | |
| | |
| Efficiency Ratio (GAAP) | |
| 78.27 | % | |
| 70.61 | % | |
| 78.92 | % | |
| 69.34 | % | |
| 52.83 | % |
| | |
| | | |
| | | |
| | | |
| | | |
| | |
| Adjusted Efficiency Ratio (Non-interest Expense for Adjusted Efficiency Ratio (non-GAAP)/Total Revenue for Adjusted Efficiency Ratio (non-GAAP)) | |
| 78.26 | % | |
| 74.38 | % | |
| 74.31 | % | |
| 70.49 | % | |
| 59.31 | % |
| | |
For the twelve months ended | |
| | |
12/31/2023 | | |
12/31/2022 | |
| | |
(In thousands) | |
| | |
| | |
| |
| Loans (no tax adjustment) | |
$ | 91,169 | | |
$ | 77,264 | |
| Tax-equivalent adjustment | |
| 471 | | |
| 494 | |
| Loans (tax-equivalent basis) | |
$ | 91,640 | | |
$ | 77,758 | |
| | |
| | | |
| | |
| Securities (no tax adjustment) | |
$ | 8,370 | | |
$ | 8,296 | |
| Tax-equivalent adjustment | |
| 1 | | |
| 3 | |
| Securities (tax-equivalent basis) | |
$ | 8,371 | | |
$ | 8,299 | |
| | |
| | | |
| | |
| Net interest income (no tax adjustment) | |
$ | 67,909 | | |
$ | 79,232 | |
| Tax equivalent adjustment | |
| 472 | | |
| 497 | |
| Net interest income (tax-equivalent basis) | |
$ | 68,381 | | |
$ | 79,729 | |
| | |
| | | |
| | |
| Net interest income (no tax adjustment) | |
$ | 67,909 | | |
$ | 79,232 | |
| Less: | |
| | | |
| | |
| Purchase accounting adjustments | |
| (50 | ) | |
| 175 | |
| Prepayment penalties and fees | |
| 64 | | |
| 281 | |
| PPP Income | |
| 99 | | |
| 728 | |
| Adjusted net interest income (non-GAAP) | |
$ | 67,796 | | |
$ | 78,048 | |
| | |
| | | |
| | |
| Average interest-earning assets | |
$ | 2,407,251 | | |
$ | 2,396,972 | |
| Average interest-earnings asset, excluding average PPP loans | |
$ | 2,405,525 | | |
$ | 2,391,252 | |
| Net interest margin (no tax adjustment) | |
| 2.82 | % | |
| 3.31 | % |
| Net interest margin, tax-equivalent | |
| 2.84 | % | |
| 3.33 | % |
| | |
For the twelve months ended | |
| | |
12/31/2023 | | |
12/31/2022 | |
| | |
(In thousands) | |
| | |
| | |
| |
| Income Before Income Taxes (GAAP) | |
$ | 19,584 | | |
$ | 34,629 | |
| Provision for credit losses | |
| 872 | | |
| 700 | |
| PPP Income | |
| (99 | ) | |
| (728 | ) |
| Gain on bank-owned life insurance death benefit | |
| (778 | ) | |
| — | |
| Loss (gain) on defined benefit plan termination | |
| 1,143 | | |
| (2,807 | ) |
| Income Before Taxes, Provision, PPP Income, Bank-Owned Life Insurance Death Benefit and Defined Benefit Termination (non-GAAP) | |
$ | 20,722 | | |
$ | 31,794 | |
| | |
| | | |
| | |
| Adjusted Efficiency Ratio: | |
| | | |
| | |
| Non-interest Expense (GAAP) | |
$ | 58,350 | | |
$ | 57,235 | |
| Non-interest Expense for Adjusted Efficiency Ratio (non-GAAP) | |
$ | 58,350 | | |
$ | 57,235 | |
| | |
| | | |
| | |
| Net Interest Income (GAAP) | |
$ | 67,909 | | |
$ | 79,232 | |
| | |
| | | |
| | |
| Non-interest Income (GAAP) | |
$ | 10,897 | | |
$ | 13,332 | |
| Non-GAAP adjustments: | |
| | | |
| | |
| Loss on disposal of premises and equipment | |
| 3 | | |
| 4 | |
| Unrealized losses on marketable equity securities | |
| 1 | | |
| 717 | |
| Gain on bank-owned life insurance death benefit | |
| (778 | ) | |
| — | |
| Gain on non-marketable equity investments | |
| (590 | ) | |
| (422 | ) |
| Loss (gain) on defined benefit plan curtailment | |
| 1,143 | | |
| (2,807 | ) |
| Non-interest Income for Adjusted Efficiency Ratio (non-GAAP) | |
$ | 10,676 | | |
$ | 10,824 | |
| | |
| | | |
| | |
| Total Revenue for Adjusted Efficiency Ratio (non-GAAP) | |
$ | 78,585 | | |
$ | 90,056 | |
| | |
| | | |
| | |
| Efficiency Ratio (GAAP) | |
| 74.04 | % | |
| 61.83 | % |
| | |
| | | |
| | |
| Adjusted Efficiency Ratio (Non-interest Expense for Adjusted Efficiency Ratio (non-GAAP)/Total Revenue for Adjusted Efficiency Ratio (non-GAAP)) | |
| 74.25 | % | |
| 63.55 | % |
WESTERN NEW ENGLAND BANCORP, INC. 8-K
Exhibit 99.2

Local banking is better than ever. INVESTOR PRESENTATION FOURTH QUARTER 2023
FORWARD - LOOKING STATEMENTS 2 We may, from time to time, make written or oral “forward - looking statements” within the meaning of the Private Securities Litigation Reform Act of 1995 , including statements contained in our filings with the Securities and Exchange Commission (the “SEC”), our reports to shareholders and in other communications by us . This Investor Presentation contains “forward - looking statements” with respect to the Company’s financial condition, liquidity , results of operations, future performance, and business . Forward - looking statements may be identified by the use of such words as “believe,” “expect,” “anticipate ,” “ should,” “planned,” “estimated,” and “potential . ” Examples of forward - looking statements include, but are not limited to, estimates with respect to our financial condition, results of operations and business that are subject to various factors which could cause actual results to differ materially from these estimates . These factors include, but are not limited to : • unpredictable changes in general economic conditions, financial markets, fiscal, monetary and regulatory policies, including actual or potential stress in the banking industry ; • the duration and scope of potential pandemics, including the emergence of new variants and the response thereto ; • changes in economic conditions which could materially impact credit quality trends and the ability to generate loans and gather deposits ; • inflation and governmental responses to inflation, including recent and potential future increases in interest rates that reduce margins ; • the effect on our operations of governmental legislation and regulation, including changes in accounting regulation or standards, the nature and timing of the adoption and effectiveness of new requirements under the Dodd - Frank Act Wall Street Reform and Consumer Protection Act of 2010 , Basel guidelines, capital requirements and other applicable laws and regulations ; • significant changes in accounting, tax or regulatory practices or requirements ; • new legal obligations or liabilities or unfavorable resolutions of litigation ; • disruptive technologies in payment systems and other services traditionally provided by banks ; • the highly competitive industry and market area in which we operate ;
FORWARD - LOOKING STATEMENTS 3 • changes in business conditions and inflation ; • operational risks or risk management failures by us or critical third parties, including without limitation with respect to data processing, information systems, cybersecurity, technological changes, vendor issues, business interruption, and fraud risks ; • f ailure or circumvention of our internal controls or procedures ; • c hanges in the securities markets which affect investment management revenues ; • i ncreases in Federal Deposit Insurance Corporation deposit insurance premiums and assessments ; • the soundness of other financial services institutions which may adversely affect our credit risk; • certain of our intangible assets may become impaired in the future; • new lines of business or new products and services, which may subject us to additional risks; • changes in key management personnel which may adversely impact our operations; • severe weather, natural disasters, acts of war or terrorism and other external events which could significantly impact our business; an d • other risk factors detailed from time to time in our SEC filings. Although we believe that the expectations reflected in such forward - looking statements are reasonable, actual results may differ materially from the results discussed in these forward - looking statements. You are cautioned not to place undue reliance on these forward - looking s tatements, which speak only as of the date hereof. We do not undertake any obligation to republish revised forward - looking statements to reflect events or circumstances after the date hereof or to reflect the occurrence of unanticipated events, except to the extent required by la w.
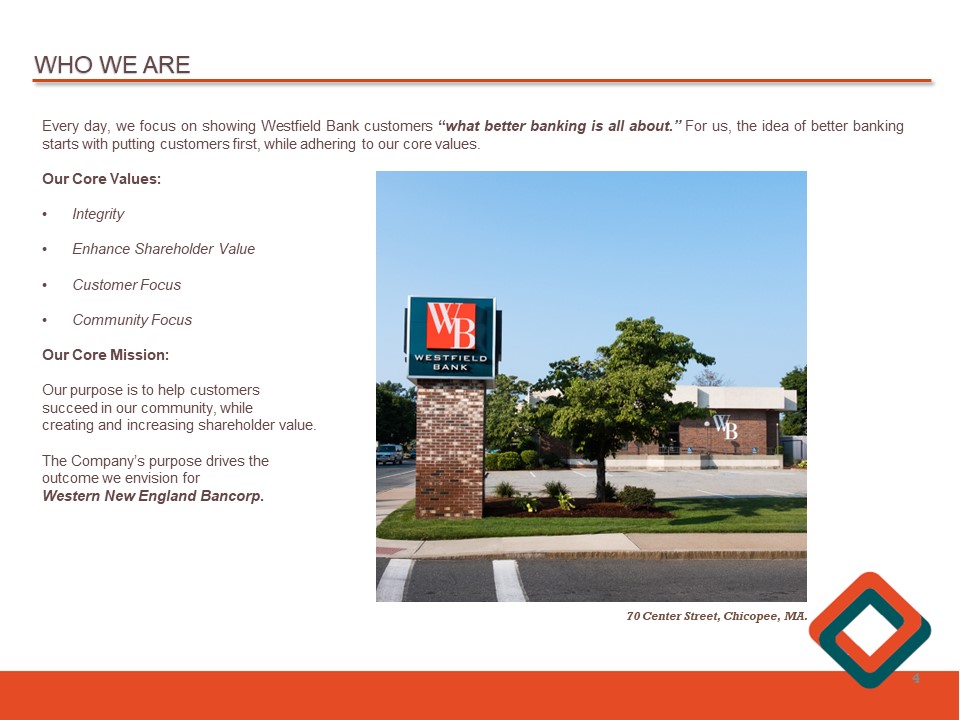
WHO WE ARE Every day, we focus on showing Westfield Bank customers “ what better banking is all about . ” For us, the idea of better banking starts with putting customers first, while adhering to our core values . Our Core Values : • Integrity • Enhance Shareholder Value • Customer Focus • Community Focus Our Core Mission : Our purpose is to help customers succeed in our community, while creating and increasing shareholder value . The Company’s purpose drives the outcome we envision for Western New England Bancorp . 4 70 Center Street, Chicopee, MA.

SENIOR MANAGEMENT TEAM James C . Hagan, President & Chief Executive Officer Guida R . Sajdak, Executive Vice President, Chief Financial Officer & Treasurer Allen J . Miles III, Executive Vice President & Chief Lender Officer Kevin C . O’Connor, Executive Vice President & Chief Banking Officer Daniel A . Marini , Senior Vice President, Retail Banking & Marketing Leo R . Sagan, Jr . , Senior Vice President & Chief Risk Officer Filipe Goncalves, Senior Vice President & Chief Credit Officer Darlene Libiszewski , Senior Vice President & Chief Information Officer John Bonini , Senior Vice President & General Counsel Christine Phillips , Senior Vice President, Human Resources Director 5
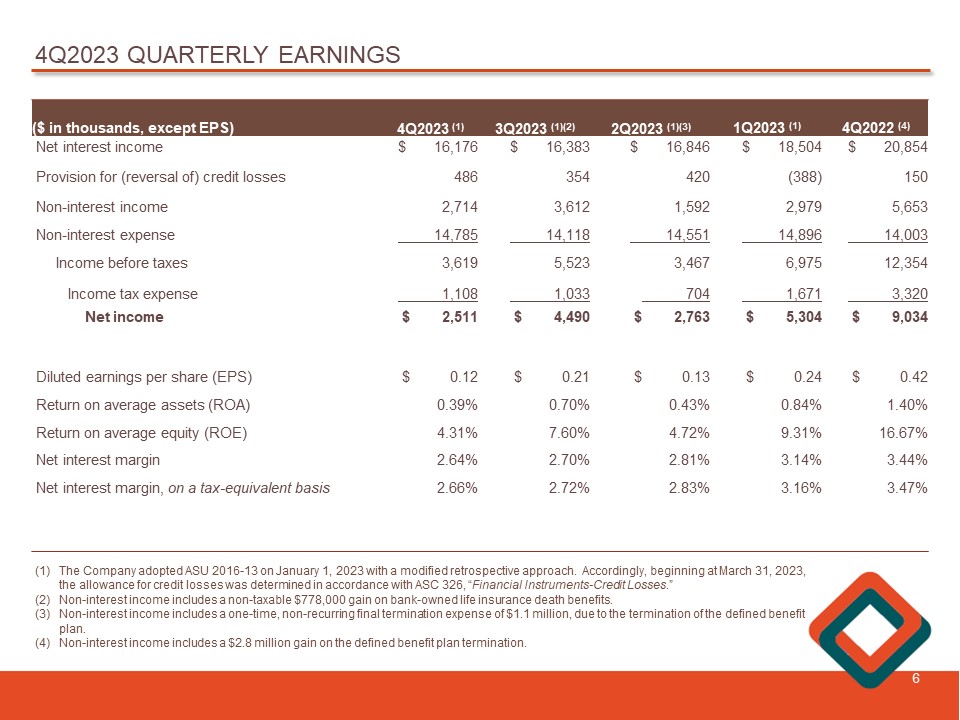
4 Q2023 QUARTERLY EARNINGS 6 4Q2022 (4) 1Q2023 (1) 2Q2023 (1)(3) 3Q2023 (1)(2) 4Q2023 (1) ($ in thousands , except EPS) $ 20,854 $ 18,504 $ 16,846 $ 16,383 $ 16,176 Net interest income 150 (388) 420 354 486 Provision for (reversal of) credit losses 5,653 2,979 1,592 3,612 2,714 Non - interest income 14,003 14,896 14,551 14,118 14,785 Non - interest expense 12,354 6,975 3,467 5,523 3,619 Income before taxes 3,320 1,671 704 1,033 1,108 Income tax expense $ 9,034 $ 5,304 $ 2,763 $ 4,490 $ 2,511 Net income $ 0.42 $ 0.24 $ 0.13 $ 0.21 $ 0.12 Diluted earnings per share (EPS) 1.40% 0.84% 0.43% 0.70% 0.39% Return on average assets (ROA) 16.67% 9.31% 4.72% 7.60% 4.31% Return on average equity (ROE) 3.44% 3.14% 2.81% 2.70% 2.64% Net interest margin 3.47% 3.16% 2.83% 2.72% 2.66% Net interest margin, on a tax - equivalent basis (1) The Company adopted ASU 2016 - 13 on January 1, 2023 with a modified retrospective approach. Accordingly, beginning at March 31, 2023, the allowance for credit losses was determined in accordance with ASC 326, “ Financial Instruments - Credit Losses .” (2) Non - interest income includes a non - taxable $778,000 gain on bank - owned life insurance death benefits. (3) Non - interest income includes a one - time, non - recurring final termination expense of $1.1 million, due to the termination of the defined benefit plan. (4) Non - interest income includes a $2.8 million gain on the defined benefit plan termination.

NET INTEREST INCOME AND NET INTEREST MARGIN 7 $20.9 $18.5 $16.8 $16.4 $16.2 3.44% 3.14% 2.81% 2.70% 2.64% 2.50% 2.60% 2.70% 2.80% 2.90% 3.00% 3.10% 3.20% 3.30% 3.40% 3.50% 4Q2022 1Q2023 2Q2023 3Q2023 4Q2023 $16.0 $17.0 $18.0 $19.0 $20.0 $21.0 $22.0 $23.0 $24.0 $25.0 Net interest income ($) Net interest margin (%) On a sequential quarter basis, net interest income, our primary source of revenues, decreased $ 207 , 000 , or 1 . 3 % , to $ 16 . 2 million for the three months ended December 31 , 2023 , from $ 16 . 4 million for the three months ended September 30 , 2023 . The decrease in net interest income was primarily due to an increase in interest expense of $ 1 . 1 million, or 11 . 3 % , partially offset by an increase in interest income of $ 869 , 000 , or 3 . 4 % . The net interest margin was 2 . 64 % for the three months ended December 31 , 2023 , compared to 2 . 70 % for the three months ended September 30 , 2023 . The decrease in the Company’s net interest margin was primarily due to an increase in the average cost of interest - bearing liabilities, which was partially offset with an increase in the average yield on interest - earning assets . ($ in millions)

TOTAL LOANS 8 $1,995 $1,993 $2,007 $2,007 $2,017 4.23% 4.34% 4.49% 4.66% 4.73% 4.00% 4.20% 4.40% 4.60% 4.80% 5.00% 4Q2022 1Q2023 2Q2023 3Q2023 4Q2023 $1,900 $1,920 $1,940 $1,960 $1,980 $2,000 $2,020 $2,040 Average Loans Outstanding Average Loans Outstanding Average Loan Yield $1,989 $2,004 $2,016 $2,015 $2,027 4Q2022 1Q2023 2Q2023 3Q2023 4Q2023 $1,970 $1,980 $1,990 $2,000 $2,010 $2,020 $2,030 Period - end Loans Outstanding At December 31 , 2023 , total loans increased $ 35 . 9 million , or 1 . 8 % , to $ 2 . 0 billion from December 31 , 2022 . R esidential real estate loans, including home equity loans, increased $ 27 . 1 million, or 3 . 9 % , commercial real estate loans increased $ 10 . 4 million, or 1 . 0 % , while commercial and industrial loans decreased $ 2 . 4 million , or 1 . 1 % . ($ in millions)

COMMERCIAL AND INDUSTRIAL LOANS 9 $220 $218 $227 $213 $217 4Q2022 1Q2023 2Q2023 3Q2023 4Q2023 $205 $210 $215 $220 $225 $230 Total commercial and industrial (“C&I”) loans decreased $ 2 . 4 million, or 1 . 1 % , from $ 219 . 8 million at December 31 , 2022 , to $ 217 . 4 million at December 31 , 2023 . At December 31 , 2023 , total delinquent C&I loans totaled $ 28 , 000 , or 0 . 01 % , of total C&I loans . ($ in millions)
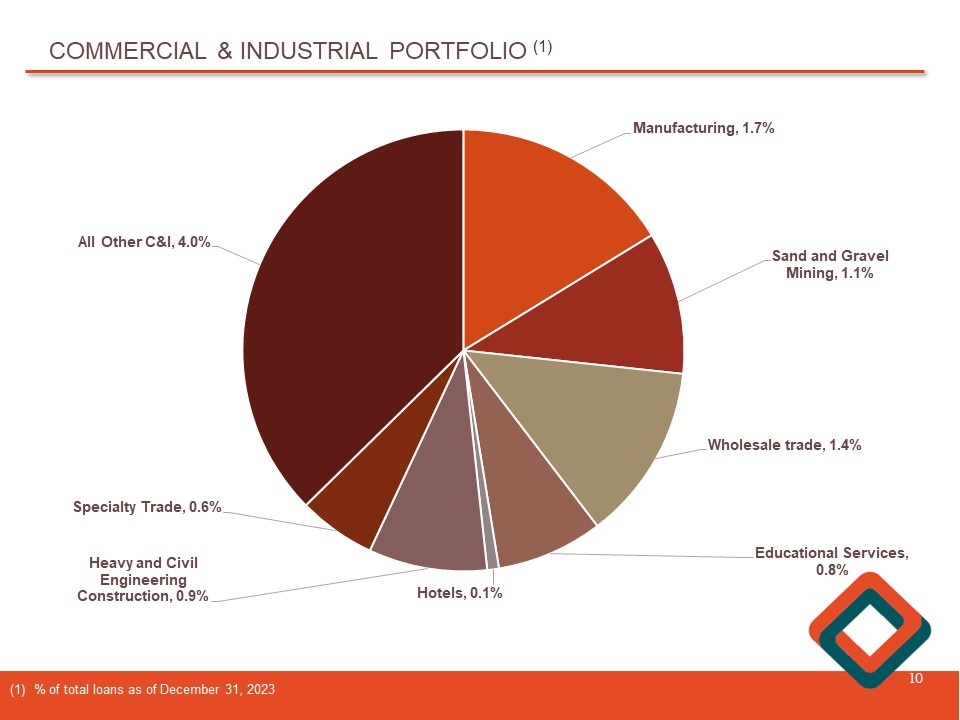
COMMERCIAL & INDUSTRIAL PORTFOLIO (1) 10 (1) % of total loans as of December 31, 2023 Manufacturing , 1.7% Sand and Gravel Mining , 1.1% Wholesale trade , 1.4% Educational Services, 0.8% Hotels , 0.1% Heavy and Civil Engineering Construction, 0.9% Specialty Trade, 0.6% All Other C&I, 4.0%
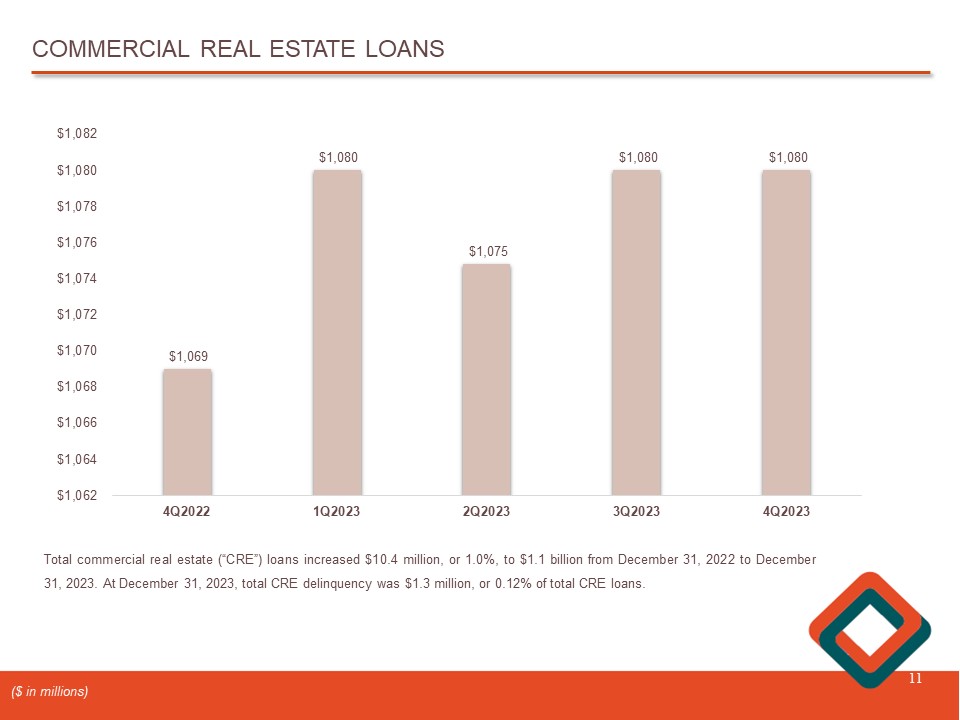
COMMERCIAL REAL ESTATE LOANS 11 $1,069 $1,080 $1,075 $1,080 $1,080 4Q2022 1Q2023 2Q2023 3Q2023 4Q2023 $1,062 $1,064 $1,066 $1,068 $1,070 $1,072 $1,074 $1,076 $1,078 $1,080 $1,082 Total commercial real estate (“CRE”) loans increased $ 10 . 4 million, or 1 . 0 % , to $ 1 . 1 billion from December 31 , 2022 to December 31 , 2023 . At December 31 , 2023 , total CRE delinquency was $ 1 . 3 million, or 0 . 12 % of total CRE loans . ($ in millions)
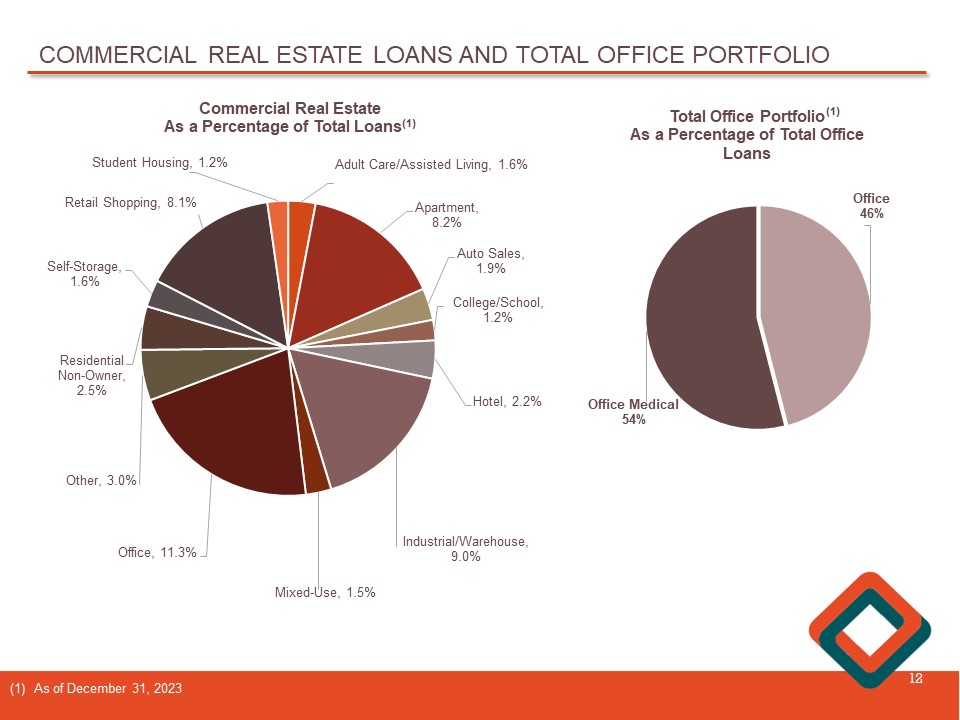
COMMERCIAL REAL ESTATE LOANS AND TOTAL OFFICE PORTFOLIO 12 (1) As of December 31, 2023 Adult Care/Assisted Living, 1.6% Apartment, 8.2% Auto Sales, 1.9% College/School , 1.2% Hotel, 2.2% Industrial/Warehouse , 9.0% Mixed - Use, 1.5% Office, 11.3% Other , 3.0% Residential Non - Owner , 2.5% Self - Storage , 1.6% Retail Shopping, 8.1% Student Housing , 1.2% Commercial Real Estate As a Percentage of Total Loans (1 ) Office 46% Office Medical 54% Total Office Portfolio As a Percentage of Total Office Loans (1)
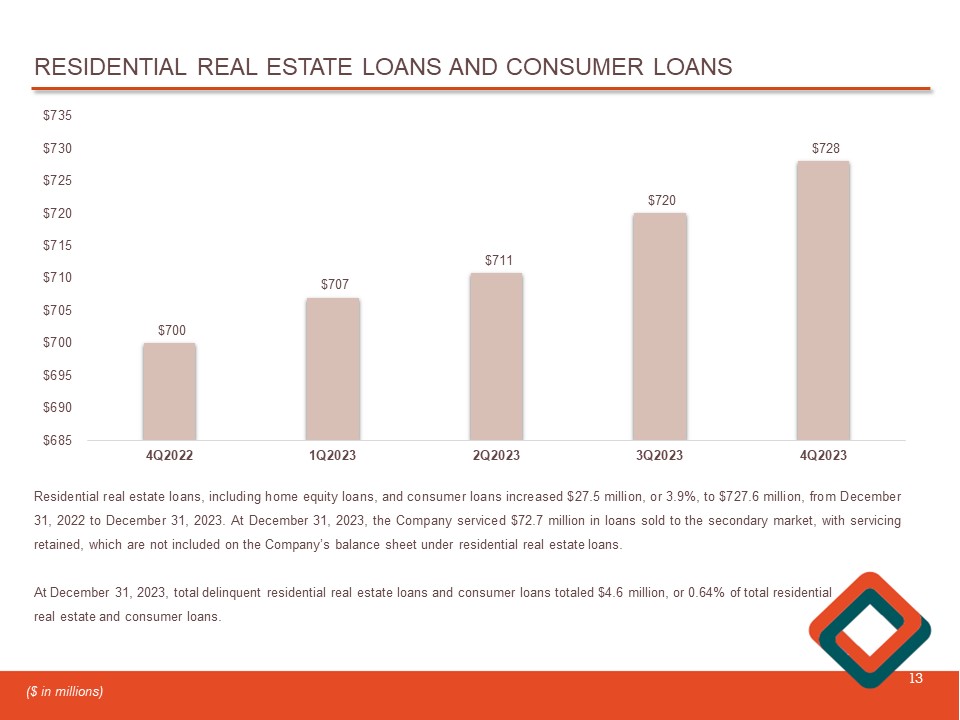
RESIDENTIAL REAL ESTATE LOANS AND CONSUMER LOANS 13 $700 $707 $711 $720 $728 4Q2022 1Q2023 2Q2023 3Q2023 4Q2023 $685 $690 $695 $700 $705 $710 $715 $720 $725 $730 $735 Residential real estate loans , including home equity loans, and consumer loans increased $ 27 . 5 million , or 3 . 9 % , to $ 727 . 6 million, from December 31 , 2022 to December 31 , 2023 . At December 31 , 2023 , the Company serviced $ 72 . 7 million in loans sold to the secondary market, with servicing retained, which are not included on the Company’s balance sheet under residential real estate loans . At December 31 , 2023 , total delinquent residential real estate loans and consumer loans totaled $ 4 . 6 million, or 0 . 64 % of total residential real estate and consumer loans . ($ in millions)
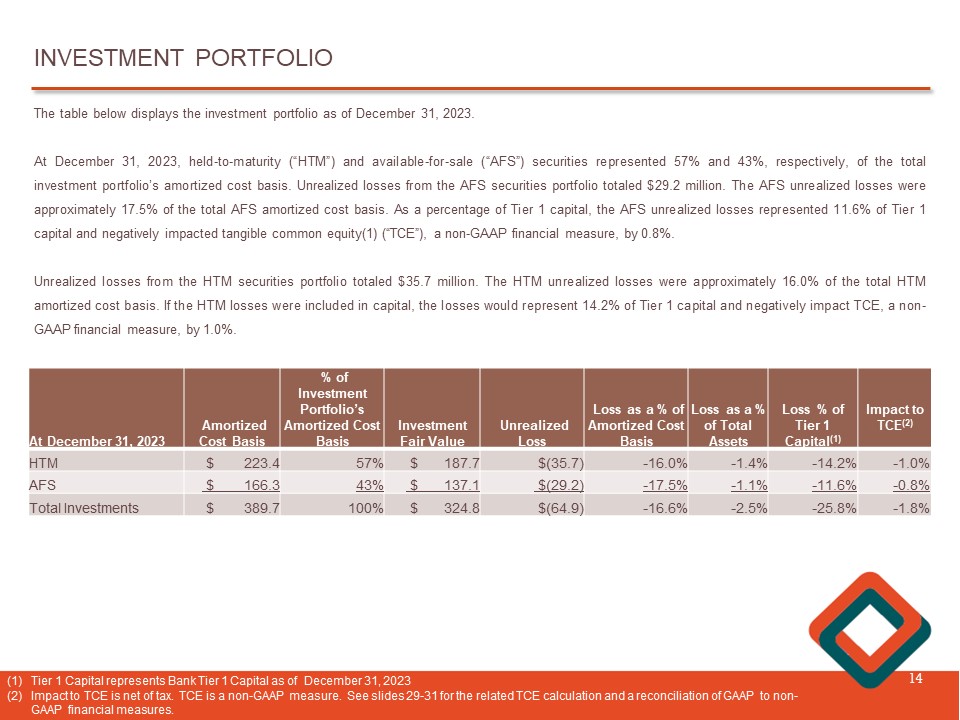
INVESTMENT PORTFOLIO 14 The table below displays the investment portfolio as of December 31 , 2023 . At December 31 , 2023 , held - to - maturity (“HTM”) and available - for - sale (“AFS”) securities represented 57 % and 43 % , respectively, of the total investment portfolio’s amortized cost basis . Unrealized losses from the AFS securities portfolio totaled $ 29 . 2 million . The AFS unrealized losses were approximately 17 . 5 % of the total AFS amortized cost basis . As a percentage of Tier 1 capital, the AFS unrealized losses represented 11 . 6 % of Tier 1 capital and negatively impacted tangible common equity( 1 ) (“TCE”), a non - GAAP financial measure, by 0 . 8 % . Unrealized losses from the HTM securities portfolio totaled $ 35 . 7 million . The HTM unrealized losses were approximately 16 . 0 % of the total HTM amortized cost basis . If the HTM losses were included in capital, the losses would represent 14 . 2 % of Tier 1 capital and negatively impact TCE, a non - GAAP financial measure, by 1 . 0 % . Impact to TCE (2) Loss % of Tier 1 Capital (1) Loss as a % of Total Assets Loss as a % of Amortized Cost Basis Unrealized Loss Investment Fair Value % of Investment Portfolio’s Amortized Cost Basis Amortized Cost Basis At December 31, 2023 - 1.0% - 14.2% - 1.4% - 16.0% $(35.7) $ 187.7 57% $ 223.4 HTM - 0.8% - 11.6% - 1.1% - 17.5% $(29.2) $ 137.1 43% $ 166.3 AFS - 1.8% - 25.8% - 2.5% - 16.6% $(64.9) $ 324.8 100% $ 389.7 Total Investments (1) Tier 1 Capital represents Bank Tier 1 Capital as of December 31, 2023 (2) Impact to TCE is net of tax. TCE is a non - GAAP measure. See slides 29 - 31 for the related TCE calculation and a reconciliation of GAAP to non - GAAP financial measures .

TOTAL DEPOSITS 15 $1,818 $1,699 $1,623 $1,594 $1,532 4Q2022 1Q2023 2Q2023 3Q2023 4Q2023 $1,350 $1,400 $1,450 $1,500 $1,550 $1,600 $1,650 $1,700 $1,750 $1,800 $1,850 PERIOD - END CORE DEPOSITS At December 31 , 2023 , total deposits decreased $ 85 . 7 million, or 3 . 8 % , to $ 2 . 1 billion from December 31 , 2022 . Core deposits, which the Company defines as all deposits except time deposits, decreased $ 285 . 4 million, or 15 . 7 % , from $ 1 . 8 billion, or 81 . 5 % of total deposits, at December 31 , 2022 , to $ 1 . 5 billion, or 71 . 5 % of total deposits, at December 31 , 2023 . Time deposits increased $ 199 . 7 million, or 48 . 5 % , from December 31 , 2022 to December 31 , 2023 . At December 31 , 2023 and December 31 , 2022 , uninsured deposits represented 27 % and 31 % , of total deposits, respectively . $412 $458 $535 $583 $611 4Q2022 1Q2023 2Q2023 3Q2023 4Q2023 $- $100 $200 $300 $400 $500 $600 $700 PERIOD - END TIME DEPOSITS ($ in millions) (1) Includes $1.7 million in brokered deposits at June 30, 2023, September 30, 2023 and December 31, 2023 (1)
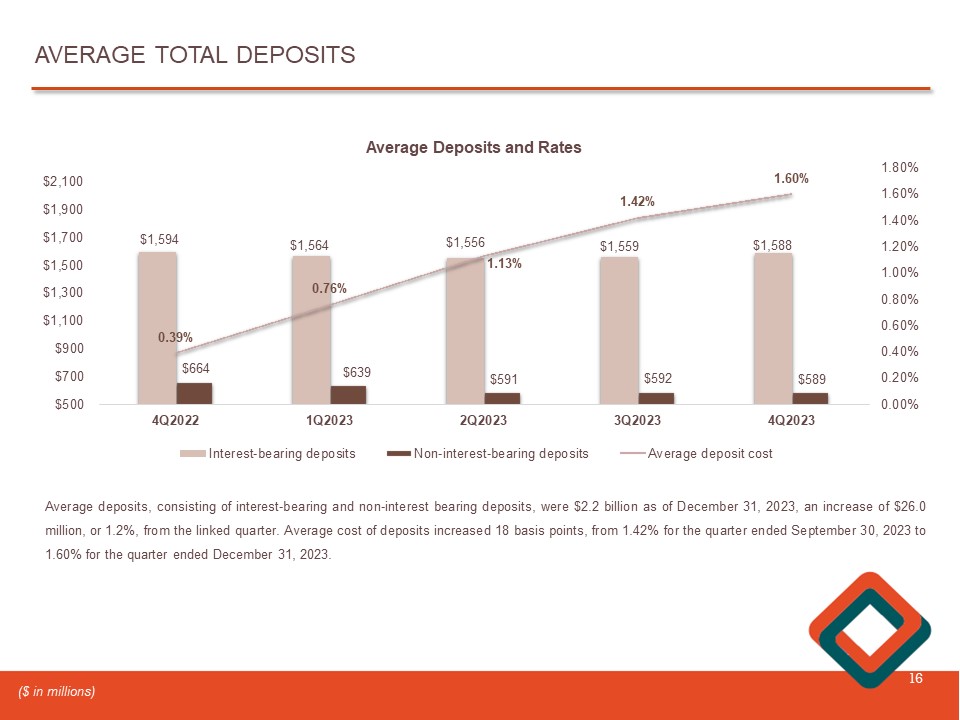
AVERAGE TOTAL DEPOSITS 16 $1,594 $1,564 $1,556 $1,559 $1,588 $664 $639 $591 $592 $589 0.39% 0.76% 1.13% 1.42% 1.60% 0.00% 0.20% 0.40% 0.60% 0.80% 1.00% 1.20% 1.40% 1.60% 1.80% 4Q2022 1Q2023 2Q2023 3Q2023 4Q2023 $500 $700 $900 $1,100 $1,300 $1,500 $1,700 $1,900 $2,100 Average Deposits and Rates Interest-bearing deposits Non-interest-bearing deposits Average deposit cost Average deposits, consisting of interest - bearing and non - interest bearing deposits, were $ 2 . 2 billion as of December 31 , 2023 , an increase of $ 26 . 0 million, or 1 . 2 % , from the linked quarter . Average cost of deposits increased 18 basis points, from 1 . 42 % for the quarter ended September 30 , 2023 to 1 . 60 % for the quarter ended December 31 , 2023 . ($ in millions)
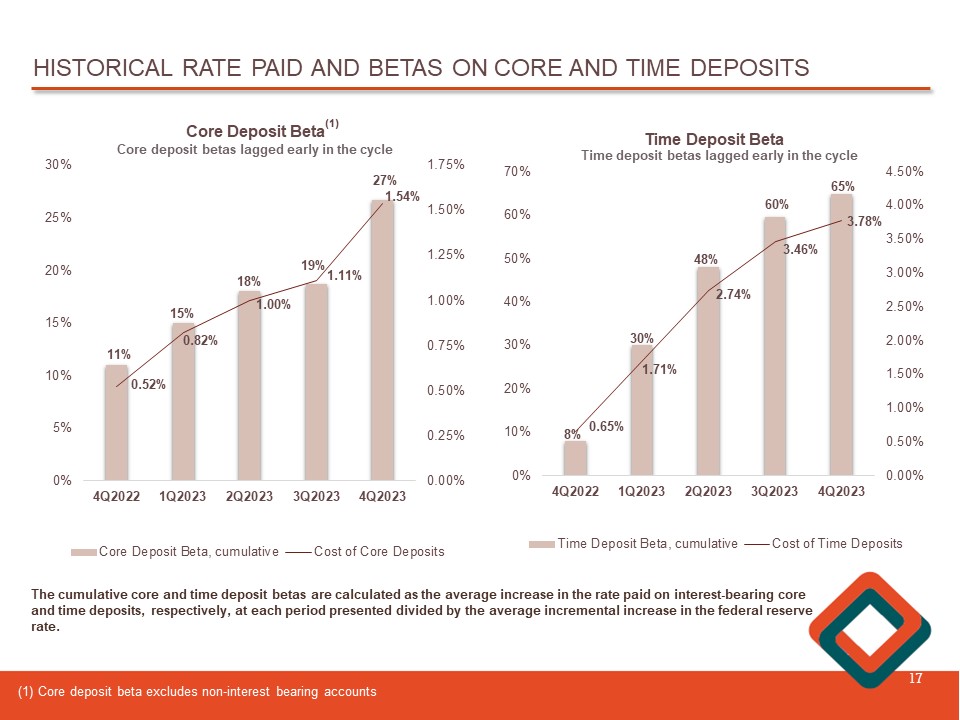
HISTORICAL RATE PAID AND BETAS ON CORE AND TIME DEPOSITS 17 (1) Core deposit beta excludes non - interest bearing accounts 11% 15% 18% 19% 27% 0.52% 0.82% 1.00% 1.11% 1.54% 0.00% 0.25% 0.50% 0.75% 1.00% 1.25% 1.50% 1.75% 4Q2022 1Q2023 2Q2023 3Q2023 4Q2023 0% 5% 10% 15% 20% 25% 30% Core Deposit Beta Core Deposit Beta, cumulative Cost of Core Deposits (1) 8% 30% 48% 60% 65% 0.65% 1.71% 2.74% 3.46% 3.78% 0.00% 0.50% 1.00% 1.50% 2.00% 2.50% 3.00% 3.50% 4.00% 4.50% 4Q2022 1Q2023 2Q2023 3Q2023 4Q2023 0% 10% 20% 30% 40% 50% 60% 70% Time Deposit Beta Time Deposit Beta, cumulative Cost of Time Deposits Time deposit betas lagged early in the cycle The cumulative core and time deposit betas are calculated as the average increase in the rate paid on interest - bearing core and time deposits, respectively, at each period presented divided by the average incremental increase in the federal reserve rate. Core deposit betas lagged early in the cycle
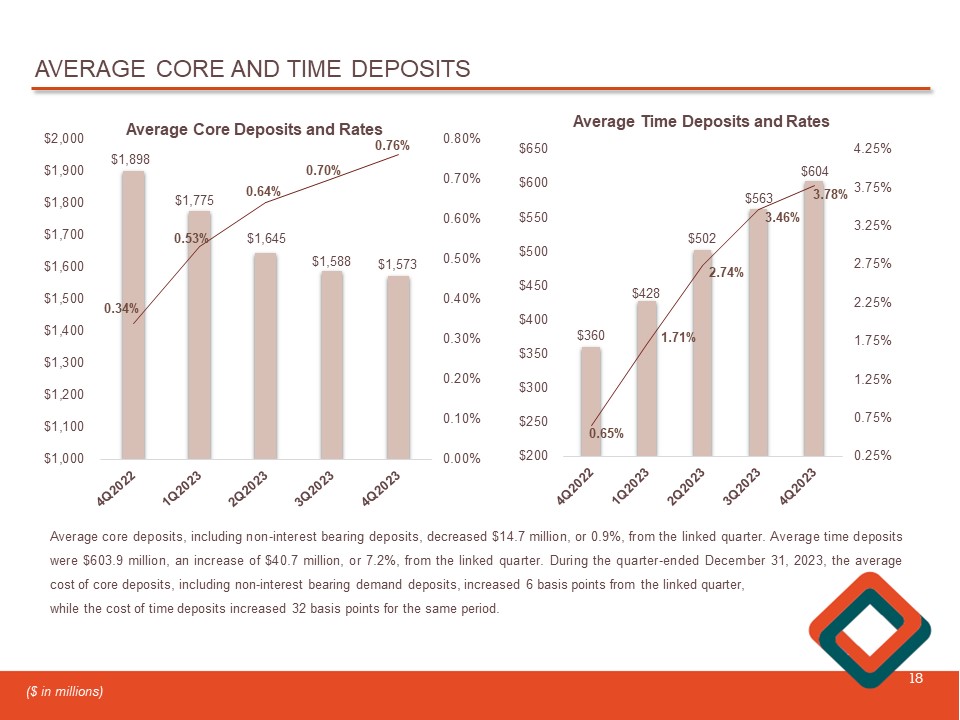
AVERAGE CORE AND TIME DEPOSITS 18 $1,898 $1,775 $1,645 $1,588 $1,573 0.34% 0.53% 0.64% 0.70% 0.76% 0.00% 0.10% 0.20% 0.30% 0.40% 0.50% 0.60% 0.70% 0.80% $1,000 $1,100 $1,200 $1,300 $1,400 $1,500 $1,600 $1,700 $1,800 $1,900 $2,000 Average Core Deposits and Rates Average core deposits, including non - interest bearing deposits, decreased $ 14 . 7 million, or 0 . 9 % , from the linked quarter . Average time deposits were $ 603 . 9 million, an increase of $ 40 . 7 million, or 7 . 2 % , from the linked quarter . During the quarter - ended December 31 , 2023 , the average cost of core deposits, including non - interest bearing demand deposits, increased 6 basis points from the linked quarter, while the cost of time deposits increased 32 basis points for the same period . ($ in millions) $360 $428 $502 $563 $604 0.65% 1.71% 2.74% 3.46% 3.78% 0.25% 0.75% 1.25% 1.75% 2.25% 2.75% 3.25% 3.75% 4.25% $200 $250 $300 $350 $400 $450 $500 $550 $600 $650 Average Time Deposits and Rates
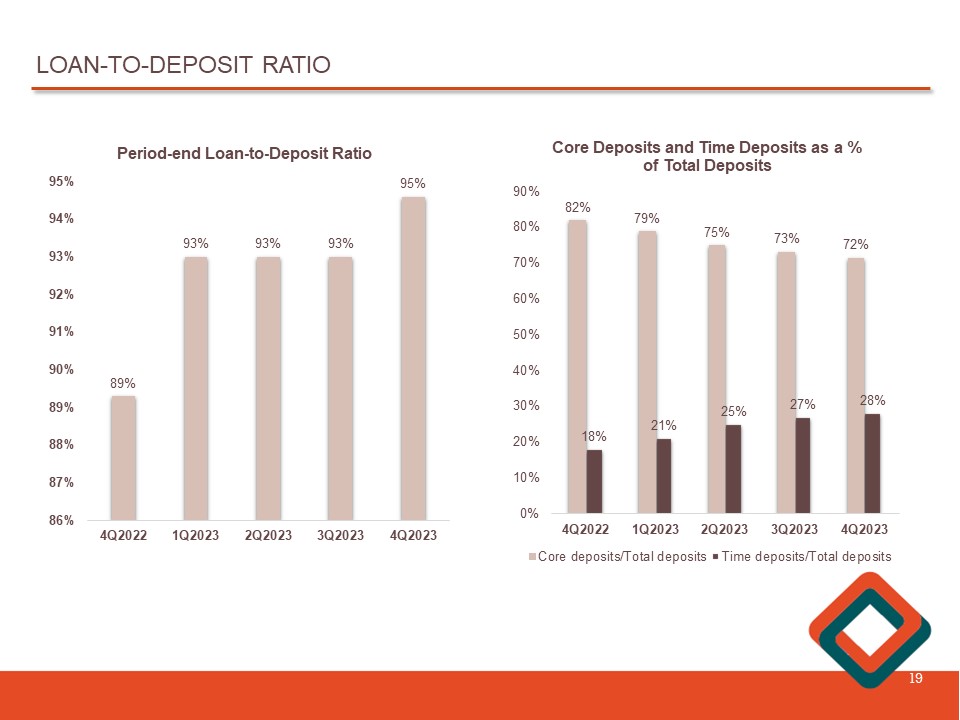
LOAN - TO - DEPOSIT RATIO 19 89% 93% 93% 93% 95% 4Q2022 1Q2023 2Q2023 3Q2023 4Q2023 86% 87% 88% 89% 90% 91% 92% 93% 94% 95% Period - end Loan - to - Deposit Ratio 82% 79% 75% 73% 72% 18% 21% 25% 27% 28% 4Q2022 1Q2023 2Q2023 3Q2023 4Q2023 0% 10% 20% 30% 40% 50% 60% 70% 80% 90% Core Deposits and Time Deposits as a % of Total Deposits Core deposits/Total deposits Time deposits/Total deposits
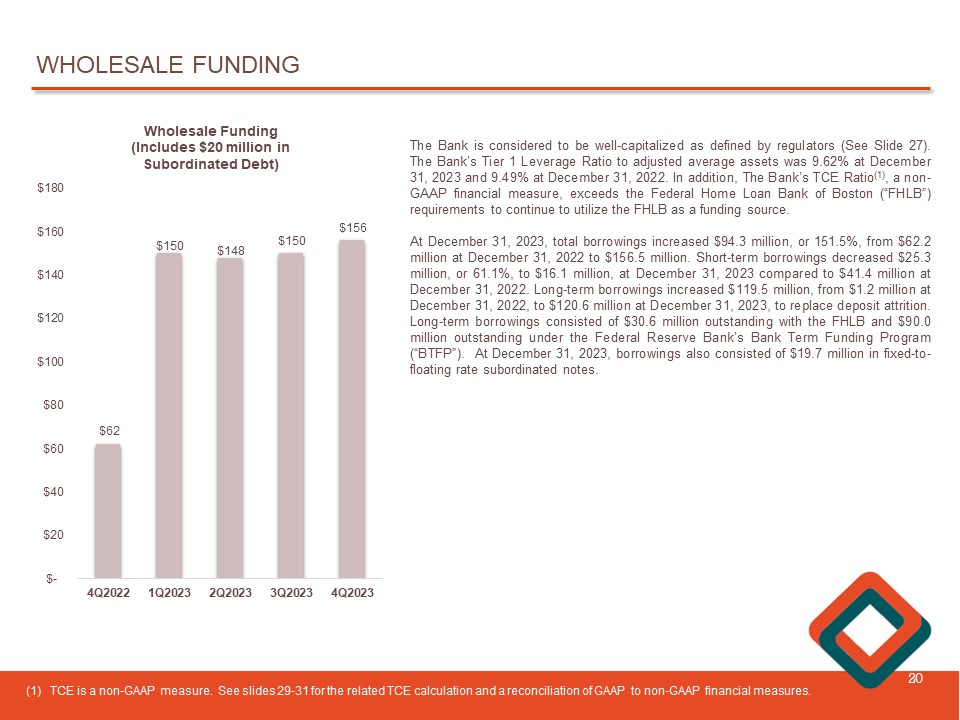
WHOLESALE FUNDING 20 $62 $150 $148 $150 $156 4Q2022 1Q2023 2Q2023 3Q2023 4Q2023 $- $20 $40 $60 $80 $100 $120 $140 $160 $180 Wholesale Funding (Includes $20 million in Subordinated Debt) The Bank is considered to be well - capitalized as defined by regulators (See Slide 27 ) . The Bank’s Tier 1 Leverage Ratio to adjusted average assets was 9 . 62 % at December 31 , 2023 and 9 . 49 % at December 31 , 2022 . In addition , The Bank’s TCE Ratio ( 1 ) , a non - GAAP financial measure, exceeds the Federal Home Loan Bank of Boston (“FHLB”) requirements to continue to utilize the FHLB as a funding source . At December 31 , 2023 , total borrowings increased $ 94 . 3 million, or 151 . 5 % , from $ 62 . 2 million at December 31 , 2022 to $ 156 . 5 million . Short - term borrowings decreased $ 25 . 3 million, or 61 . 1 % , to $ 16 . 1 million , at December 31 , 2023 compared to $ 41 . 4 million at December 31 , 2022 . Long - term borrowings increased $ 119 . 5 million, from $ 1 . 2 million at December 31 , 2022 , to $ 120 . 6 million at December 31 , 2023 , to replace deposit attrition . Long - term borrowings consisted of $ 30 . 6 million outstanding with the FHLB and $ 90 . 0 million outstanding under the Federal Reserve Bank’s Bank Term Funding Program (“BTFP”) . At December 31 , 2023 , borrowings also consisted of $ 19 . 7 million in fixed - to - floating rate subordinated notes . (1) TCE is a non - GAAP measure. See slides 29 - 31 for the related TCE calculation and a reconciliation of GAAP to non - GAAP financial measures .
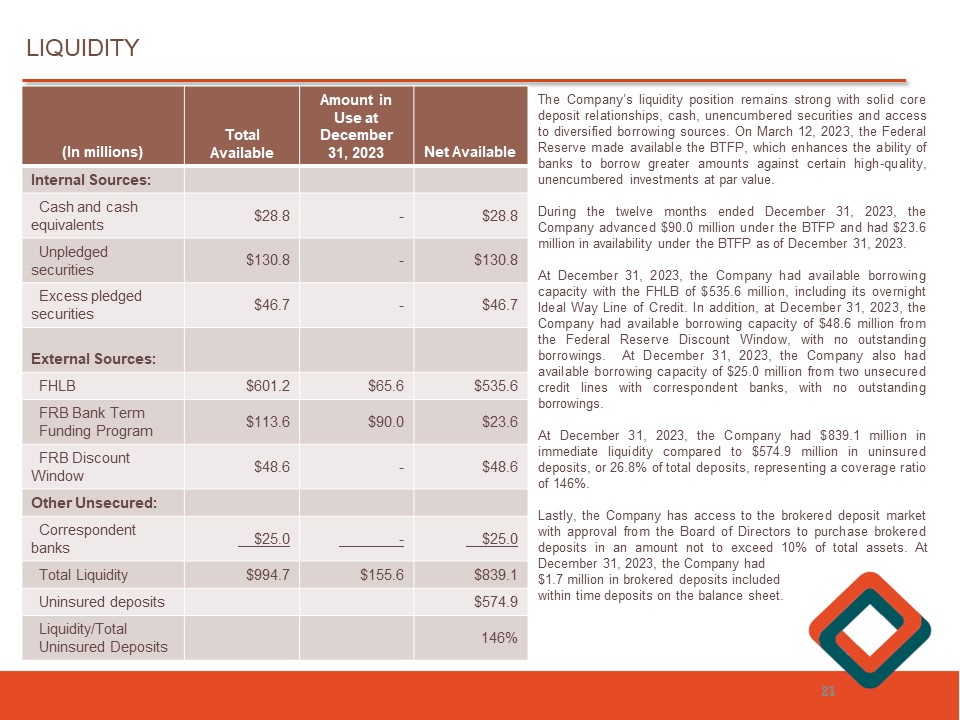
21 Net Available Amount in Use at December 31, 2023 Total Available (In millions) Internal Sources: $28.8 - $28.8 Cash and cash equivalents $130.8 - $130.8 Unpledged securities $46.7 - $46.7 Excess pledged securities External Sources: $535.6 $65.6 $601.2 FHLB $23.6 $90.0 $113.6 FRB Bank Term Funding Program $48.6 - $48.6 FRB Discount Window Other Unsecured: $25.0 - $25.0 Correspondent banks $839.1 $155.6 $994.7 Total Liquidity $574.9 Uninsured deposits 146% Liquidity/Total Uninsured Deposits The Company’s liquidity position remains strong with solid core deposit relationships, cash, unencumbered securities and access to diversified borrowing sources . On March 12 , 2023 , the Federal Reserve made available the BTFP, which enhances the ability of banks to borrow greater amounts against certain high - quality, unencumbered investments at par value . During the twelve months ended December 31 , 2023 , the Company advanced $ 90 . 0 million under the BTFP and had $ 23 . 6 million in availability under the BTFP as of December 31 , 2023 . At December 31 , 2023 , the Company had available borrowing capacity with the FHLB of $ 535 . 6 million, including its overnight Ideal Way Line of Credit . In addition, at December 31 , 2023 , the Company had available borrowing capacity of $ 48 . 6 million from the Federal Reserve Discount Window, with no outstanding borrowings . At December 31 , 2023 , the Company also had available borrowing capacity of $ 25 . 0 million from two unsecured credit lines with correspondent banks, with no outstanding borrowings . At December 31 , 2023 , the Company had $ 839 . 1 million in immediate liquidity compared to $ 574 . 9 million in uninsured deposits, or 26 . 8 % of total deposits, representing a coverage ratio of 146 % . Lastly, the Company has access to the brokered deposit market with approval from the Board of Directors to purchase brokered deposits in an amount not to exceed 10 % of total assets . At December 31 , 2023 , the Company had $ 1 . 7 million in brokered deposits included within time deposits on the balance sheet . LIQUIDITY

________ Source: SNL Financial as of June 30, 2023. Note: Total number of Westfield Bank branches shown includes the Big E seasonal branch and online deposit channel. Three Wes tfi eld branches are located in Hampshire County, MA and four Westfield branches are located in Hartford County, CT outside of Springfield MSA. DEPOSIT MARKET SHARE IN HAMPDEN COUNTY, MA AS OF JUNE 30, 2023 22 Total Deposit Rank 2023 Parent Company Name Deposits in Market ($000) Market Share # of Branches 1 PeoplesBank 2,271,591 16.96% 13 1,762,519 13.1% 20 3 Westfield Bank 1,878,809 14.03% 20 2 TD Bank 2,029,147 15.15 % 16 4 M&T Bank 1,143,383 8.54% 14 5 Berkshire Bank 1,142,092 8.53% 11 6 KeyBank 932,631 6.96% 7 7 Citizens Bank 557,490 4.16% 12 8 Monson Savings Bank 526,226 3.93% 4 9 Country Bank 514,307 3.84% 4 10 New Valley Bank & Trust 256,410 1.91% 3
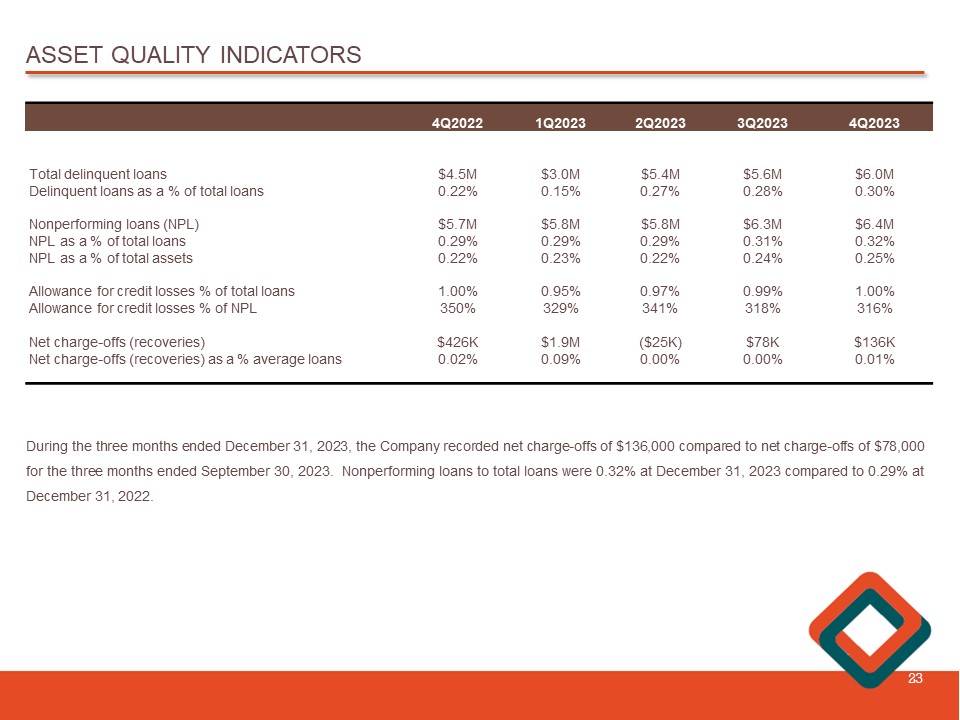
ASSET QUALITY INDICATORS 23 4Q2023 3Q2023 2Q2023 1Q2023 4Q2022 $6.0M $5.6M $5.4M $3.0M $4.5M Total delinquent loans 0.30% 0.28% 0.27% 0.15% 0.22% Delinquent loans as a % of total loans $6.4M $6.3M $5.8M $5.8M $5.7M Nonperforming loans (NPL) 0.32% 0.31% 0.29% 0.29% 0.29% NPL as a % of total loans 0.25% 0.24% 0.22% 0.23% 0.22% NPL as a % of total assets 1.00% 0.99% 0.97% 0.95% 1.00% Allowance for credit losses % of total loans 316% 318% 341% 329% 350% Allowance for credit losses % of NPL $136K $78K ($25K) $1.9M $426K Net charge - offs (recoveries) 0.01% 0.00% 0.00% 0.09% 0.02% Net charge - offs (recoveries) as a % average loans During the three months ended December 31 , 2023 , the Company recorded net charge - offs of $ 136 , 000 compared to net charge - offs of $ 78 , 000 for the three months ended September 30 , 2023 . Nonperforming loans to total loans were 0 . 32 % at December 31 , 2023 compared to 0 . 29 % at December 31 , 2022 .
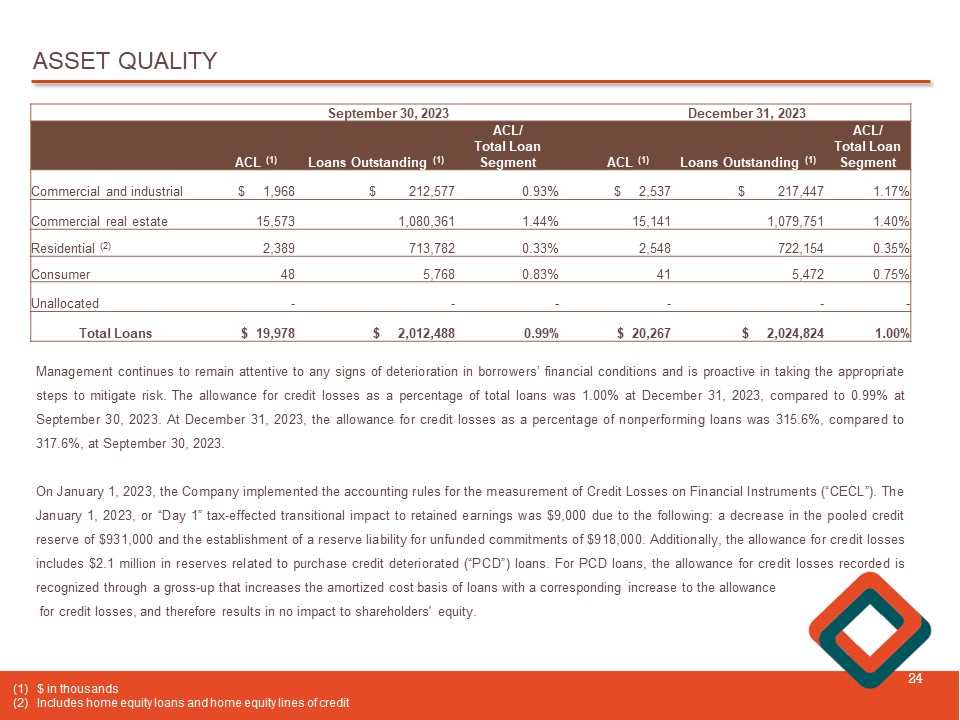
ASSET QUALITY 24 Management continues to remain attentive to any signs of deterioration in borrowers’ financial conditions and is proactive in taking the appropriate steps to mitigate risk . The allowance for credit losses as a percentage of total loans was 1 . 00 % at December 31 , 2023 , compared to 0 . 99 % at September 30 , 2023 . At December 31 , 2023 , the allowance for credit losses as a percentage of nonperforming loans was 315 . 6 % , compared to 317 . 6 % , at September 30 , 2023 . On January 1 , 2023 , the Company implemented the accounting rules for the measurement of Credit Losses on Financial Instruments (“CECL”) . The January 1 , 2023 , or “Day 1 ” tax - effected transitional impact to retained earnings was $ 9 , 000 due to the following : a decrease in the pooled credit reserve of $ 931 , 000 and the establishment of a reserve liability for unfunded commitments of $ 918 , 000 . Additionally, the allowance for credit losses includes $ 2 . 1 million in reserves related to purchase credit deteriorated (“PCD”) loans . For PCD loans, the allowance for credit losses recorded is recognized through a gross - up that increases the amortized cost basis of loans with a corresponding increase to the allowance for credit losses, and therefore results in no impact to shareholders' equity . December 31, 2023 September 30, 2023 ACL / Total Loan Segment Loans Outstanding (1) ACL (1) ACL / Total Loan Segment Loans Outstanding (1) ACL (1) 1.17% $ 217,447 $ 2,537 0.93% $ 212,577 $ 1,968 Commercial and industrial 1.40% 1,079,751 15,141 1.44% 1,080,361 15,573 Commercial real estate 0.35% 722,154 2,548 0.33% 713,782 2,389 Residential (2) 0.75% 5,472 41 0.83% 5,768 48 Consumer - - - - - - Unallocated 1.00% $ 2,024,824 $ 20,267 0.99% $ 2,012,488 $ 19,978 Total Loans (1) $ in thousands (2) Includes home equity loans and home equity lines of credit
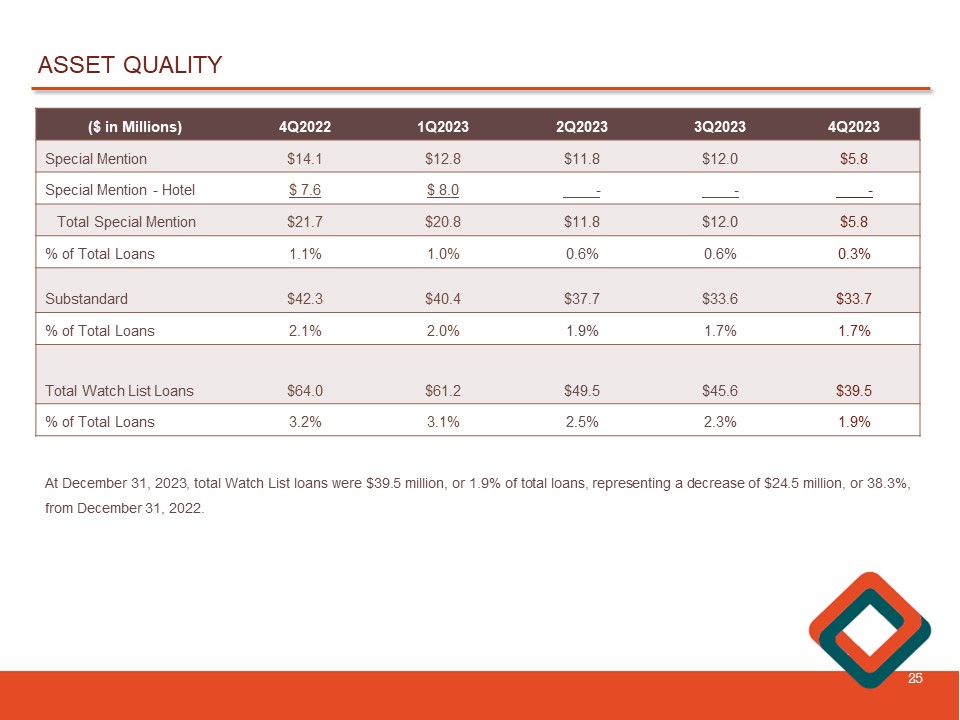
ASSET QUALITY 25 4Q2023 3Q2023 2Q2023 1Q2023 4Q2022 ($ in Millions) $5.8 $12.0 $11.8 $12.8 $14.1 Special Mention - - - $ 8.0 $ 7.6 Special Mention - Hotel $5.8 $12.0 $11.8 $20.8 $21.7 Total Special Mention 0.3% 0.6% 0.6% 1.0% 1.1% % of Total Loans $33.7 $33.6 $37.7 $40.4 $42.3 Substandard 1.7% 1.7% 1.9% 2.0% 2.1% % of Total Loans $39.5 $45.6 $49.5 $61.2 $64.0 Total Watch List Loans 1.9% 2.3% 2.5% 3.1% 3.2% % of Total Loans At December 31 , 2023 , total Watch List loans were $ 39 . 5 million, or 1 . 9 % of total loans, representing a decrease of $ 24 . 5 million , or 38 . 3 % , from December 31 , 2022 .

CAPITAL MANAGEMENT 26 We are well - capitalized with excess capital. Ratio at December 31, 2022 Ratio at December 31, 2023 Consolidated 9.27% 9.40% Leverage Ratio 12.18% 12.59% Common Equity Tier 1 Ratio 12.18% 12.59% Tier 1 Capital Ratio 14.20% 14.67% Total Capital Ratio As of December 31 , 2023 , the Bank’s Tier 1 Leverage Ratio was 9 . 62 % . The Bank’s TCE ratio ( 1 ) , a non - GAAP financial measure, was 8 . 78 % after factoring in $ 21 . 7 million in net AOCI unrealized losses . If the HTM net unrealized losses of $ 25 . 6 million were factored in, the TCE ratio would decrease to 7 . 8 % . x From a regulatory standpoint, we are well - capitalized with excess capital . x We take a prudent approach to capital management . Well Capitalized Ratio at December 31, 2022 Ratio at December 31, 2023 Westfield Bank 5.0% 9.49% 9.62% Leverage Ratio 6.5% 12.48% 12.88% Common Equity Tier 1 Ratio 8.0% 12.48% 12.88% Tier 1 Capital Ratio 10.0% 13.50% 13.94% Total Capital Ratio (1) TCE is a non - GAAP measure. See slides 29 - 31 for the related TCE calculation and a reconciliation of GAAP to non - GAAP financial measures .
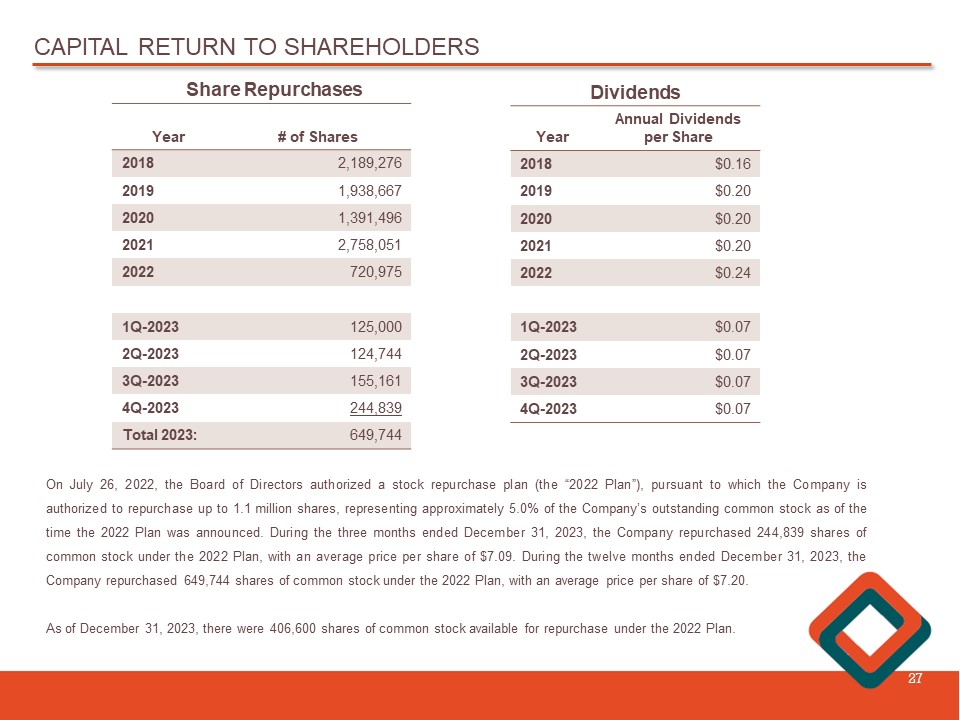
CAPITAL RETURN TO SHAREHOLDERS 27 # of Shares Year 2,189,276 2018 1,938,667 2019 1,391,496 2020 2,758,051 2021 720,975 2022 125,000 1Q - 2023 124,744 2Q - 2023 155,161 3Q - 2023 244,839 4Q - 2023 649,744 Total 2023: Annual Dividends per Share Year $0.16 2018 $0.20 2019 $0.20 2020 $0.20 2021 $0.24 2022 $0.07 1Q - 2023 $0.07 2Q - 2023 $0.07 3Q - 2023 $0.07 4Q - 2023 Share Repurchases Dividends On July 26 , 2022 , the Board of Directors authorized a stock repurchase plan (the “ 2022 Plan ”), pursuant to which the Company is authorized to repurchase up to 1 . 1 million shares, representing approximately 5 . 0 % of the Company’s outstanding common stock as of the time the 2022 Plan was announced . During the three months ended December 31 , 2023 , the Company repurchased 244 , 839 shares of common stock under the 2022 Plan, with an average price per share of $ 7 . 09 . During the twelve months ended December 31 , 2023 , the Company repurchased 649 , 744 shares of common stock under the 2022 Plan, with an average price per share of $ 7 . 20 . As of December 31 , 2023 , there were 406 , 600 shares of common stock available for repurchase under the 2022 Plan .
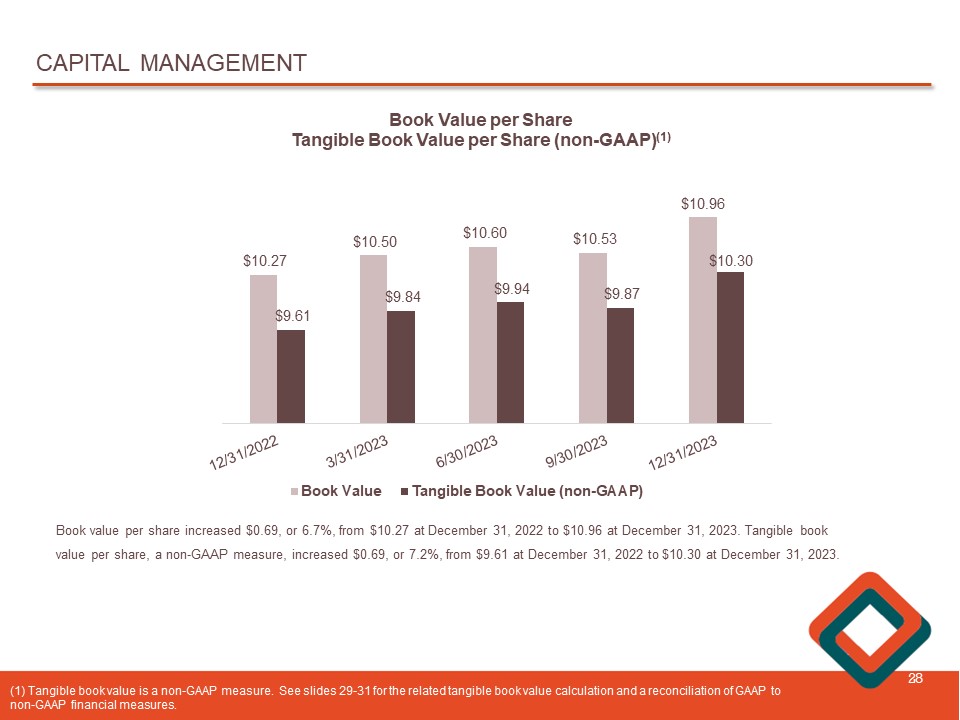
CAPITAL MANAGEMENT 28 $10.27 $10.50 $10.60 $10.53 $10.96 $9.61 $9.84 $9.94 $9.87 $10.30 Book Value per Share Tangible Book Value per Share (non - GAAP) (1) Book Value Tangible Book Value (non-GAAP) Book value per share increased $0.69, or 6.7%, from $10.27 at December 31, 2022 to $10.96 at December 31, 2023. Tangible book value per share, a non - GAAP measure, increased $0.69, or 7.2%, from $9.61 at December 31, 2022 to $10.30 at December 31, 2023. ( 1) Tangible book value is a non - GAAP measure. See slides 29 - 31 for the related tangible book value calculation and a reconcilia tion of GAAP to non - GAAP financial measures.
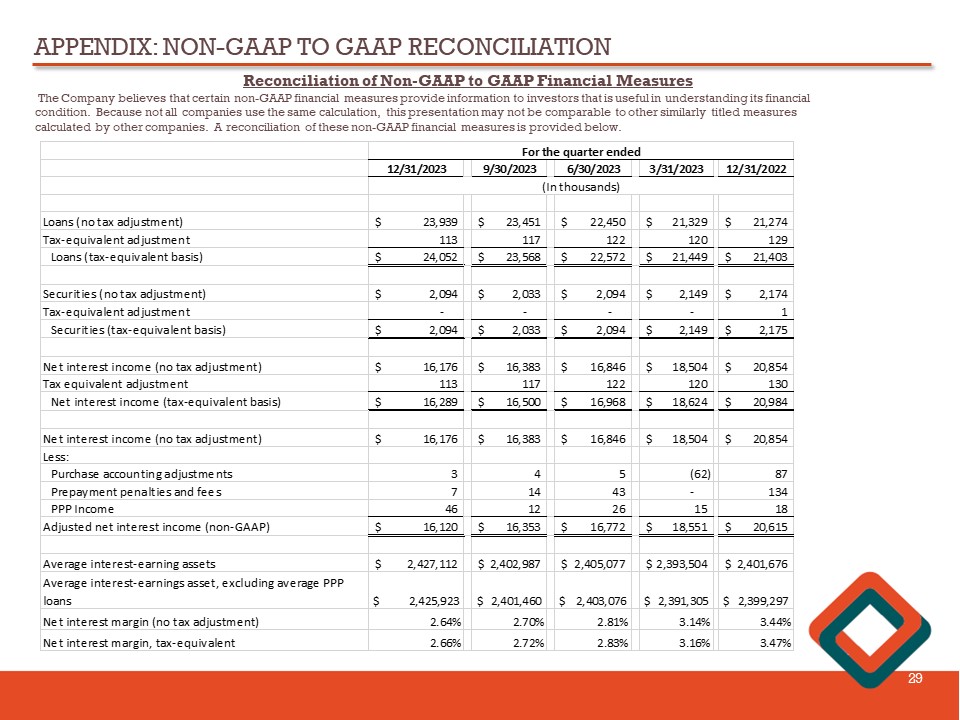
APPENDIX: NON - GAAP TO GAAP RECONCILIATION 29 Reconciliation of Non - GAAP to GAAP Financial Measures The Company believes that certain non - GAAP financial measures provide information to investors that is useful in understanding i ts financial condition. Because not all companies use the same calculation, this presentation may not be comparable to other similarly title d measures calculated by other companies. A reconciliation of these non - GAAP financial measures is provided below. 12/31/2023 9/30/2023 6/30/2023 3/31/2023 12/31/2022 Loans (no tax adjustment) 23,939$ 23,451$ 22,450$ 21,329$ 21,274$ Tax-equivalent adjustment 113 117 122 120 129 Loans (tax-equivalent basis) 24,052$ 23,568$ 22,572$ 21,449$ 21,403$ Securities (no tax adjustment) 2,094$ 2,033$ 2,094$ 2,149$ 2,174$ Tax-equivalent adjustment - - - - 1 Securities (tax-equivalent basis) 2,094$ 2,033$ 2,094$ 2,149$ 2,175$ Net interest income (no tax adjustment) 16,176$ 16,383$ 16,846$ 18,504$ 20,854$ Tax equivalent adjustment 113 117 122 120 130 Net interest income (tax-equivalent basis) 16,289$ 16,500$ 16,968$ 18,624$ 20,984$ Net interest income (no tax adjustment) 16,176$ 16,383$ 16,846$ 18,504$ 20,854$ Less: Purchase accounting adjustments 3 4 5 (62) 87 Prepayment penalties and fees 7 14 43 - 134 PPP Income 46 12 26 15 18 Adjusted net interest income (non-GAAP) 16,120$ 16,353$ 16,772$ 18,551$ 20,615$ Average interest-earning assets 2,427,112$ 2,402,987$ 2,405,077$ 2,393,504$ 2,401,676$ Average interest-earnings asset, excluding average PPP loans $ 2,425,923 $ 2,401,460 $ 2,403,076 $ 2,391,305 $ 2,399,297 Net interest margin (no tax adjustment) 2.64% 2.70% 2.81% 3.14% 3.44% Net interest margin, tax-equivalent 2.66% 2.72% 2.83% 3.16% 3.47% For the quarter ended (In thousands)
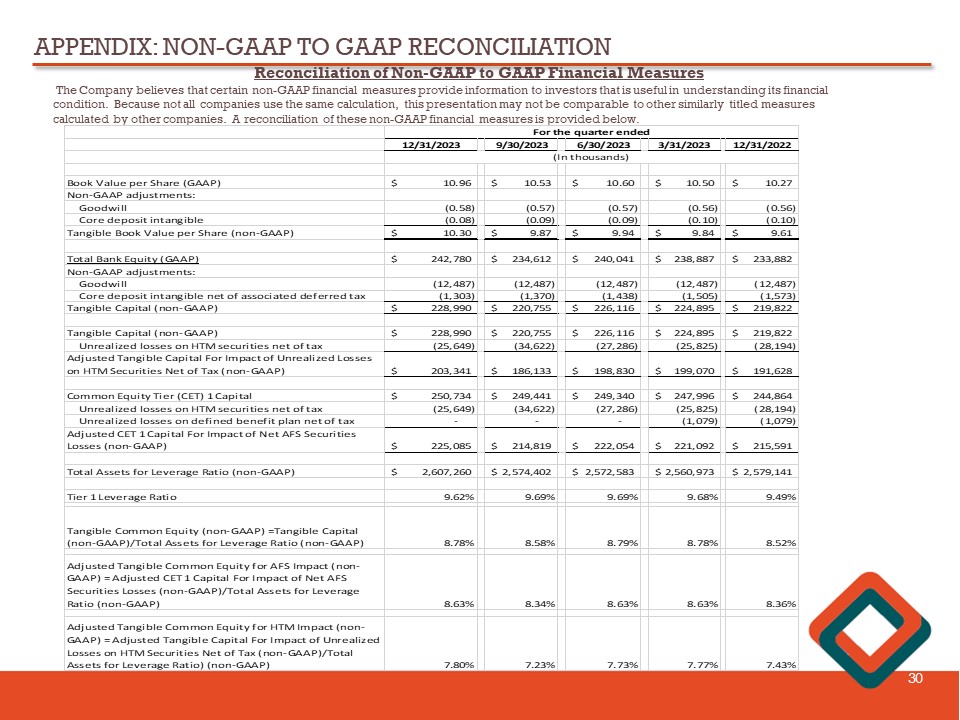
APPENDIX: NON - GAAP TO GAAP RECONCILIATION 30 Reconciliation of Non - GAAP to GAAP Financial Measures The Company believes that certain non - GAAP financial measures provide information to investors that is useful in understanding i ts financial condition. Because not all companies use the same calculation, this presentation may not be comparable to other similarly title d measures calculated by other companies. A reconciliation of these non - GAAP financial measures is provided below. 12/31/2023 9/30/2023 6/30/2023 3/31/2023 12/31/2022 Book Value per Share (GAAP) 10.96$ 10.53$ 10.60$ 10.50$ 10.27$ Non-GAAP adjustments: Goodwill (0.58) (0.57) (0.57) (0.56) (0.56) Core deposit intangible (0.08) (0.09) (0.09) (0.10) (0.10) Tangible Book Value per Share (non-GAAP) 10.30$ 9.87$ 9.94$ 9.84$ 9.61$ Total Bank Equity (GAAP) 242,780$ 234,612$ 240,041$ 238,887$ 233,882$ Non-GAAP adjustments: Goodwill (12,487) (12,487) (12,487) (12,487) (12,487) Core deposit intangible net of associated deferred tax (1,303) (1,370) (1,438) (1,505) (1,573) Tangible Capital (non-GAAP) 228,990$ 220,755$ 226,116$ 224,895$ 219,822$ Tangible Capital (non-GAAP) 228,990$ 220,755$ 226,116$ 224,895$ 219,822$ Unrealized losses on HTM securities net of tax (25,649) (34,622) (27,286) (25,825) (28,194) Adjusted Tangible Capital For Impact of Unrealized Losses on HTM Securities Net of Tax (non-GAAP) 203,341$ 186,133$ 198,830$ 199,070$ 191,628$ Common Equity Tier (CET) 1 Capital 250,734$ 249,441$ 249,340$ 247,996$ 244,864$ Unrealized losses on HTM securities net of tax (25,649) (34,622) (27,286) (25,825) (28,194) Unrealized losses on defined benefit plan net of tax - - - (1,079) (1,079) Adjusted CET 1 Capital For Impact of Net AFS Securities Losses (non-GAAP) 225,085$ 214,819$ 222,054$ 221,092$ 215,591$ Total Assets for Leverage Ratio (non-GAAP) 2,607,260$ 2,574,402$ 2,572,583$ 2,560,973$ 2,579,141$ Tier 1 Leverage Ratio 9.62% 9.69% 9.69% 9.68% 9.49% Tangible Common Equity (non-GAAP) =Tangible Capital (non-GAAP)/Total Assets for Leverage Ratio (non-GAAP) 8.78% 8.58% 8.79% 8.78% 8.52% Adjusted Tangible Common Equity for AFS Impact (non- GAAP) = Adjusted CET 1 Capital For Impact of Net AFS Securities Losses (non-GAAP)/Total Assets for Leverage Ratio (non-GAAP) 8.63% 8.34% 8.63% 8.63% 8.36% Adjusted Tangible Common Equity for HTM Impact (non- GAAP) = Adjusted Tangible Capital For Impact of Unrealized Losses on HTM Securities Net of Tax (non-GAAP)/Total Assets for Leverage Ratio) (non-GAAP) 7.80% 7.23% 7.73% 7.77% 7.43% For the quarter ended (In thousands)
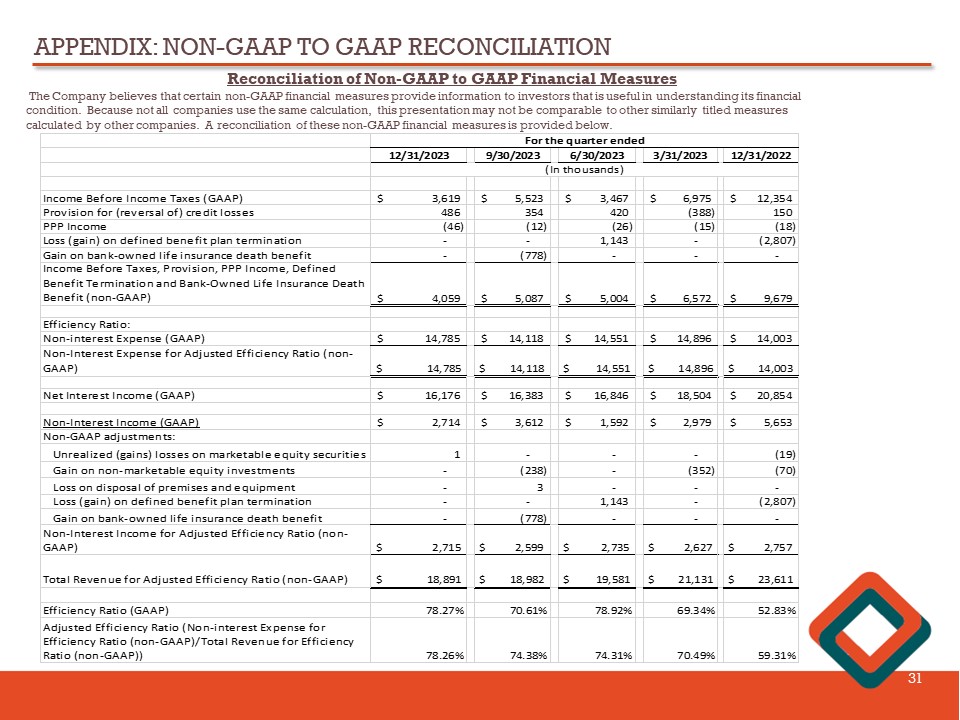
APPENDIX: NON - GAAP TO GAAP RECONCILIATION 31 Reconciliation of Non - GAAP to GAAP Financial Measures The Company believes that certain non - GAAP financial measures provide information to investors that is useful in understanding i ts financial condition. Because not all companies use the same calculation, this presentation may not be comparable to other similarly title d measures calculated by other companies. A reconciliation of these non - GAAP financial measures is provided below. 12/31/2023 9/30/2023 6/30/2023 3/31/2023 12/31/2022 Income Before Income Taxes (GAAP) 3,619$ 5,523$ 3,467$ 6,975$ 12,354$ Provision for (reversal of) credit losses 486 354 420 (388) 150 PPP Income (46) (12) (26) (15) (18) Loss (gain) on defined benefit plan termination - - 1,143 - (2,807) Gain on bank-owned life insurance death benefit - (778) - - - Income Before Taxes, Provision, PPP Income, Defined Benefit Termination and Bank-Owned Life Insurance Death Benefit (non-GAAP) 4,059$ 5,087$ 5,004$ 6,572$ 9,679$ Efficiency Ratio: Non-interest Expense (GAAP) 14,785$ 14,118$ 14,551$ 14,896$ 14,003$ Non-Interest Expense for Adjusted Efficiency Ratio (non- GAAP) $ 14,785 $ 14,118 $ 14,551 $ 14,896 $ 14,003 Net Interest Income (GAAP) 16,176$ 16,383$ 16,846$ 18,504$ 20,854$ Non-Interest Income (GAAP) 2,714$ 3,612$ 1,592$ 2,979$ 5,653$ Non-GAAP adjustments: Unrealized (gains) losses on marketable equity securities 1 - - - (19) Gain on non-marketable equity investments - (238) - (352) (70) Loss on disposal of premises and equipment - 3 - - - Loss (gain) on defined benefit plan termination - - 1,143 - (2,807) Gain on bank-owned life insurance death benefit - (778) - - - Non-Interest Income for Adjusted Efficiency Ratio (non- GAAP) $ 2,715 $ 2,599 $ 2,735 $ 2,627 $ 2,757 Total Revenue for Adjusted Efficiency Ratio (non-GAAP) $ 18,891 $ 18,982 $ 19,581 $ 21,131 $ 23,611 Efficiency Ratio (GAAP) 78.27% 70.61% 78.92% 69.34% 52.83% Adjusted Efficiency Ratio (Non-interest Expense for Efficiency Ratio (non-GAAP)/Total Revenue for Efficiency Ratio (non-GAAP)) 78.26% 74.38% 74.31% 70.49% 59.31% For the quarter ended (In thousands)
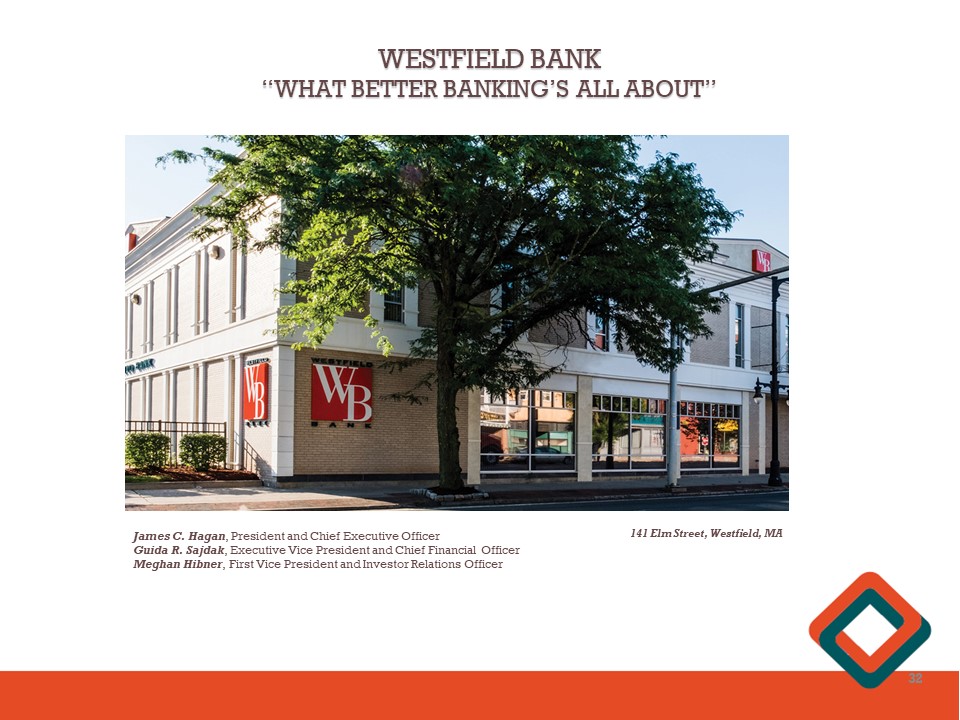
WESTFIELD BANK “WHAT BETTER BANKING’S ALL ABOUT” James C. Hagan , President and Chief Executive Officer Guida R. Sajdak , Executive Vice President and Chief Financial Officer Meghan Hibner , First Vice President and Investor Relations Officer 32 141 Elm Street, Westfield, MA
v3.23.4
| X |
- DefinitionBoolean flag that is true when the XBRL content amends previously-filed or accepted submission.
| Name: |
dei_AmendmentFlag |
| Namespace Prefix: |
dei_ |
| Data Type: |
xbrli:booleanItemType |
| Balance Type: |
na |
| Period Type: |
duration |
|
| X |
- DefinitionFor the EDGAR submission types of Form 8-K: the date of the report, the date of the earliest event reported; for the EDGAR submission types of Form N-1A: the filing date; for all other submission types: the end of the reporting or transition period. The format of the date is YYYY-MM-DD.
| Name: |
dei_DocumentPeriodEndDate |
| Namespace Prefix: |
dei_ |
| Data Type: |
xbrli:dateItemType |
| Balance Type: |
na |
| Period Type: |
duration |
|
| X |
- DefinitionThe type of document being provided (such as 10-K, 10-Q, 485BPOS, etc). The document type is limited to the same value as the supporting SEC submission type, or the word 'Other'.
| Name: |
dei_DocumentType |
| Namespace Prefix: |
dei_ |
| Data Type: |
dei:submissionTypeItemType |
| Balance Type: |
na |
| Period Type: |
duration |
|
| X |
- DefinitionAddress Line 1 such as Attn, Building Name, Street Name
| Name: |
dei_EntityAddressAddressLine1 |
| Namespace Prefix: |
dei_ |
| Data Type: |
xbrli:normalizedStringItemType |
| Balance Type: |
na |
| Period Type: |
duration |
|
| X |
- Definition
+ References
+ Details
| Name: |
dei_EntityAddressCityOrTown |
| Namespace Prefix: |
dei_ |
| Data Type: |
xbrli:normalizedStringItemType |
| Balance Type: |
na |
| Period Type: |
duration |
|
| X |
- DefinitionCode for the postal or zip code
| Name: |
dei_EntityAddressPostalZipCode |
| Namespace Prefix: |
dei_ |
| Data Type: |
xbrli:normalizedStringItemType |
| Balance Type: |
na |
| Period Type: |
duration |
|
| X |
- DefinitionName of the state or province.
| Name: |
dei_EntityAddressStateOrProvince |
| Namespace Prefix: |
dei_ |
| Data Type: |
dei:stateOrProvinceItemType |
| Balance Type: |
na |
| Period Type: |
duration |
|
| X |
- DefinitionA unique 10-digit SEC-issued value to identify entities that have filed disclosures with the SEC. It is commonly abbreviated as CIK. Reference 1: http://www.xbrl.org/2003/role/presentationRef
-Publisher SEC
-Name Exchange Act
-Number 240
-Section 12
-Subsection b-2
| Name: |
dei_EntityCentralIndexKey |
| Namespace Prefix: |
dei_ |
| Data Type: |
dei:centralIndexKeyItemType |
| Balance Type: |
na |
| Period Type: |
duration |
|
| X |
- DefinitionIndicate if registrant meets the emerging growth company criteria. Reference 1: http://www.xbrl.org/2003/role/presentationRef
-Publisher SEC
-Name Exchange Act
-Number 240
-Section 12
-Subsection b-2
| Name: |
dei_EntityEmergingGrowthCompany |
| Namespace Prefix: |
dei_ |
| Data Type: |
xbrli:booleanItemType |
| Balance Type: |
na |
| Period Type: |
duration |
|
| X |
- DefinitionCommission file number. The field allows up to 17 characters. The prefix may contain 1-3 digits, the sequence number may contain 1-8 digits, the optional suffix may contain 1-4 characters, and the fields are separated with a hyphen.
| Name: |
dei_EntityFileNumber |
| Namespace Prefix: |
dei_ |
| Data Type: |
dei:fileNumberItemType |
| Balance Type: |
na |
| Period Type: |
duration |
|
| X |
- DefinitionTwo-character EDGAR code representing the state or country of incorporation.
| Name: |
dei_EntityIncorporationStateCountryCode |
| Namespace Prefix: |
dei_ |
| Data Type: |
dei:edgarStateCountryItemType |
| Balance Type: |
na |
| Period Type: |
duration |
|
| X |
- DefinitionThe exact name of the entity filing the report as specified in its charter, which is required by forms filed with the SEC. Reference 1: http://www.xbrl.org/2003/role/presentationRef
-Publisher SEC
-Name Exchange Act
-Number 240
-Section 12
-Subsection b-2
| Name: |
dei_EntityRegistrantName |
| Namespace Prefix: |
dei_ |
| Data Type: |
xbrli:normalizedStringItemType |
| Balance Type: |
na |
| Period Type: |
duration |
|
| X |
- DefinitionThe Tax Identification Number (TIN), also known as an Employer Identification Number (EIN), is a unique 9-digit value assigned by the IRS. Reference 1: http://www.xbrl.org/2003/role/presentationRef
-Publisher SEC
-Name Exchange Act
-Number 240
-Section 12
-Subsection b-2
| Name: |
dei_EntityTaxIdentificationNumber |
| Namespace Prefix: |
dei_ |
| Data Type: |
dei:employerIdItemType |
| Balance Type: |
na |
| Period Type: |
duration |
|
| X |
- DefinitionLocal phone number for entity.
| Name: |
dei_LocalPhoneNumber |
| Namespace Prefix: |
dei_ |
| Data Type: |
xbrli:normalizedStringItemType |
| Balance Type: |
na |
| Period Type: |
duration |
|
| X |
- DefinitionBoolean flag that is true when the Form 8-K filing is intended to satisfy the filing obligation of the registrant as pre-commencement communications pursuant to Rule 13e-4(c) under the Exchange Act. Reference 1: http://www.xbrl.org/2003/role/presentationRef
-Publisher SEC
-Name Exchange Act
-Number 240
-Section 13e
-Subsection 4c
| Name: |
dei_PreCommencementIssuerTenderOffer |
| Namespace Prefix: |
dei_ |
| Data Type: |
xbrli:booleanItemType |
| Balance Type: |
na |
| Period Type: |
duration |
|
| X |
- DefinitionBoolean flag that is true when the Form 8-K filing is intended to satisfy the filing obligation of the registrant as pre-commencement communications pursuant to Rule 14d-2(b) under the Exchange Act. Reference 1: http://www.xbrl.org/2003/role/presentationRef
-Publisher SEC
-Name Exchange Act
-Number 240
-Section 14d
-Subsection 2b
| Name: |
dei_PreCommencementTenderOffer |
| Namespace Prefix: |
dei_ |
| Data Type: |
xbrli:booleanItemType |
| Balance Type: |
na |
| Period Type: |
duration |
|
| X |
- DefinitionTitle of a 12(b) registered security. Reference 1: http://www.xbrl.org/2003/role/presentationRef
-Publisher SEC
-Name Exchange Act
-Number 240
-Section 12
-Subsection b
| Name: |
dei_Security12bTitle |
| Namespace Prefix: |
dei_ |
| Data Type: |
dei:securityTitleItemType |
| Balance Type: |
na |
| Period Type: |
duration |
|
| X |
- DefinitionName of the Exchange on which a security is registered. Reference 1: http://www.xbrl.org/2003/role/presentationRef
-Publisher SEC
-Name Exchange Act
-Number 240
-Section 12
-Subsection d1-1
| Name: |
dei_SecurityExchangeName |
| Namespace Prefix: |
dei_ |
| Data Type: |
dei:edgarExchangeCodeItemType |
| Balance Type: |
na |
| Period Type: |
duration |
|
| X |
- DefinitionBoolean flag that is true when the Form 8-K filing is intended to satisfy the filing obligation of the registrant as soliciting material pursuant to Rule 14a-12 under the Exchange Act. Reference 1: http://www.xbrl.org/2003/role/presentationRef
-Publisher SEC
-Name Exchange Act
-Section 14a
-Number 240
-Subsection 12
| Name: |
dei_SolicitingMaterial |
| Namespace Prefix: |
dei_ |
| Data Type: |
xbrli:booleanItemType |
| Balance Type: |
na |
| Period Type: |
duration |
|
| X |
- DefinitionTrading symbol of an instrument as listed on an exchange.
| Name: |
dei_TradingSymbol |
| Namespace Prefix: |
dei_ |
| Data Type: |
dei:tradingSymbolItemType |
| Balance Type: |
na |
| Period Type: |
duration |
|
| X |
- DefinitionBoolean flag that is true when the Form 8-K filing is intended to satisfy the filing obligation of the registrant as written communications pursuant to Rule 425 under the Securities Act. Reference 1: http://www.xbrl.org/2003/role/presentationRef
-Publisher SEC
-Name Securities Act
-Number 230
-Section 425
| Name: |
dei_WrittenCommunications |
| Namespace Prefix: |
dei_ |
| Data Type: |
xbrli:booleanItemType |
| Balance Type: |
na |
| Period Type: |
duration |
|
Western New England Banc... (NASDAQ:WNEB)
과거 데이터 주식 차트
부터 4월(4) 2024 으로 5월(5) 2024

Western New England Banc... (NASDAQ:WNEB)
과거 데이터 주식 차트
부터 5월(5) 2023 으로 5월(5) 2024
