STIFEL FINANCIAL CORP false 0000720672 0000720672 2024-01-24 2024-01-24 0000720672 us-gaap:CommonStockMember 2024-01-24 2024-01-24 0000720672 sf:DepositorySharesEachRepresentingOneByThousandthInterestInShareOfSixPointTwoFivePercentageNonCumulativePreferredStockSeriesBMember 2024-01-24 2024-01-24 0000720672 sf:DepositorySharesEachRepresentingOneByThousandthInterestInShareOfSixPointOneTwoFivePercentageNonCumulativePreferredStockSeriesCPreferredStockMember 2024-01-24 2024-01-24 0000720672 sf:DepositorySharesEachRepresentingOneByThousandthInterestInShareOfFourPointFiveZeroPercentageNonCumulativePreferredStockSeriesDPreferredStockMember 2024-01-24 2024-01-24 0000720672 sf:SeniorNotes520Due2047Member 2024-01-24 2024-01-24
UNITED STATES
SECURITIES AND EXCHANGE COMMISSION
Washington, DC 20549
FORM 8-K
CURRENT REPORT
Pursuant To Section 13 OR 15(d) of the
Securities Exchange Act of 1934
Date of Report (Date of earliest event reported): January 24, 2024
STIFEL FINANCIAL CORP.
(Exact name of registrant as specified in its charter)
|
|
|
|
|
| Delaware |
|
001-09305 |
|
43-1273600 |
| (State of incorporation) |
|
(Commission File Number) |
|
(IRS Employer
Identification No.) |
501 N. Broadway, St. Louis, Missouri 63102-2188
(Address of principal executive offices and zip code)
(314) 342-2000
(Registrant’s telephone number, including area code)
Not Applicable
(Former name or former address, if changed since last report)
Securities registered pursuant to Section 12(b) of the Act:
|
|
|
|
|
| Title of Each Class |
|
Trading Symbol(s) |
|
Name of Each Exchange on Which Registered |
| Common Stock, $0.15 par value per share |
|
SF |
|
New York Stock Exchange |
| Depository Shares, each representing 1/1,000th interest in a share of 6.25% Non-Cumulative Preferred Stock, Series B |
|
SF-PB |
|
New York Stock Exchange |
| Depository Shares, each representing 1/1,000th interest in a share of 6.125% Non-Cumulative Preferred Stock, Series C |
|
SF-PC |
|
New York Stock Exchange |
| Depository Shares, each representing 1/1,000th interest in a share of 4.50% Non-Cumulative Preferred Stock, Series D |
|
SF-PD |
|
New York Stock Exchange |
|
|
|
| 5.20% Senior Notes due 2047 |
|
SFB |
|
New York Stock Exchange |
Check the appropriate box below if the Form 8-K filing is intended to simultaneously satisfy the filing obligation of the registrant under any of the following provisions (see General Instruction A.2. below):
| ☐ |
Written communications pursuant to Rule 425 under the Securities Act (17 CFR 230.425) |
| ☐ |
Soliciting material pursuant to Rule 14a-12 under the Exchange Act (17 CFR 240.14a-12) |
| ☐ |
Pre-commencement communications pursuant to Rule 14d-2(b) under the Exchange Act (17 CFR 240.14d-2(b)) |
| ☐ |
Pre-commencement communications pursuant to Rule 13e-4(c) under the Exchange Act (17 CFR 240.13e-4(c)) |
Indicate by check mark whether the registrant is an emerging growth company as defined in Rule 405 of the Securities Act of 1933 (§230.405 of this chapter) or Rule 12b-2 of the Securities Exchange Act of 1934 (§240.12b-2 of this chapter).
Emerging growth company ☐
If an emerging growth company, indicate by check mark if the registrant has elected not to use the extended transition period for complying with any new or revised financial accounting standards provided pursuant to Section 13(a) of the Exchange Act. ☐
Item 2.02 Results of Operations and Financial Condition.
On January 24, 2024, Stifel Financial Corp. (the “Company”) reported its financial results for the quarter and year ended December 31, 2023. A copy of the press release containing this information is attached as Exhibit 99.1 to this Report on Form 8-K.
In addition, a copy of the Company’s Financial Supplement for the quarter and year ended December 31, 2023 is attached as Exhibit 99.2 to this Report on Form 8-K.
On Wednesday, January 24, 2024, at 9:30 a.m. Eastern time, the Company will hold a conference call to discussion its financial results and other related matters. A copy of the presentation for the conference call is attached as Exhibit 99.3 to this Report on Form 8-K.
The exhibits are being furnished pursuant to Item 2.02, and the information contained therein shall not be deemed “filed” for the purposes of Section 18 of the Securities Exchange Act of 1934, as amended (the “Exchange Act”), or otherwise subject to the liabilities of that Section, nor shall it be deemed incorporated by reference into any filing of the Company under the Securities Act of 1933, as amended, or the Exchange Act.
Item 9.01 Financial Statements and Exhibits.
(d) Exhibits.
2
SIGNATURE
Pursuant to the requirements of the Securities Exchange Act of 1934, the registrant has duly caused this report to be signed on its behalf by the undersigned hereunto duly authorized.
|
|
|
|
|
|
|
|
|
|
|
|
|
STIFEL FINANCIAL CORP. |
|
|
|
|
|
|
(Registrant) |
|
|
|
|
| Date: January 24, 2024 |
|
|
|
By: |
|
/s/ James M. Marischen |
|
|
|
|
Name: |
|
James M. Marischen |
|
|
|
|
Title: |
|
Chief Financial Officer |
3
Exhibit 99.1

Stifel Reports Fourth Quarter and Full Year Results
ST. LOUIS, MO, January 24, 2024 – Stifel Financial Corp. (NYSE: SF) today reported net revenues of $1.15 billion for the
three months ended December 31, 2023, compared with $1.12 billion a year ago. Net income available to common shareholders of $153.2 million, or $1.38 per diluted common share, compared with $167.3 million, or $1.43 per diluted
common share for the fourth quarter of 2022. Non-GAAP net income available to common shareholders of $166.6 million, or $1.50 per diluted common share for the fourth quarter of 2023.
Net revenues of $4.35 billion for the year ended December 31, 2023 compared to $4.39 billion a year ago. Net income available to common
shareholders of $485.3 million, or $4.28 per diluted common share, compared with $624.9 million, or $5.32 per diluted common share in 2022. Non-GAAP net income available to common shareholders of
$531.5 million, or $4.68 per diluted common share in 2023.
Ronald J. Kruszewski, Chairman and Chief Executive Officer, said “Stifel’s strong 2023 results underscore the importance of our
diversified business model as the operating environment was less than ideal. Given our position as a premier wealth management firm and middle market investment bank, as well as the increased scale of our business, we see significant opportunities
for top and bottom line growth as market conditions improve.”
Full Year Highlights
| • |
|
The Company reported net revenues of $4.35 billion, the third highest year in its history, as our business navigated an environment that remains challenging. |
| • |
|
Non-GAAP net income available to common shareholders of $4.68. |
| • |
|
Record net interest income, up 28% over 2022. |
| • |
|
Record asset management revenues, up 3% over 2022. |
| • |
|
Recruited 171 financial advisors during the year, including 76 experienced employee advisors and 9 experienced independent advisors. |
| • |
|
Non-GAAP pre-tax margin of 18% was negatively impacted by elevated provisions for legal and regulatory matters. |
| • |
|
Return on average tangible common equity (ROTCE) (5) of 17%. |
Fourth Quarter Highlights
| • |
|
Quarterly net revenues of $1.15 billion. |
| • |
|
Non-GAAP net income available to common shareholders of $1.50. |
| • |
|
Recruited 40 financial advisors during the quarter, including 12 experienced employee advisors and 1 experienced independent advisor. |
| • |
|
Non-GAAP pre-tax margin of 19%. |
| • |
|
Annualized ROTCE (5) of 21%. |
| • |
|
Tangible book value per common share (7) of $31.28, up 2% from prior year. |
Other Highlights
| • |
|
Board of Directors authorized a 17% increase in common stock dividend starting in the first quarter of 2024.
|
|
|
|
|
|
|
|
|
|
|
|
|
|
|
|
|
|
| Financial Summary (Unaudited) |
|
| (000s) |
|
4Q 2023 |
|
|
4Q 2022 |
|
|
FY 2023 |
|
|
FY 2022 |
|
| GAAP Financial Highlights: |
|
| Net revenues |
|
$ |
1,146,379 |
|
|
$ |
1,121,647 |
|
|
$ |
4,348,944 |
|
|
$ |
4,391,439 |
|
| Net income (1) |
|
$ |
153,164 |
|
|
$ |
167,301 |
|
|
$ |
485,255 |
|
|
$ |
624,874 |
|
| Diluted EPS (1) |
|
$ |
1.38 |
|
|
$ |
1.43 |
|
|
$ |
4.28 |
|
|
$ |
5.32 |
|
| Comp. ratio |
|
|
58.8 |
% |
|
|
57.8 |
% |
|
|
58.7 |
% |
|
|
58.9 |
% |
| Non-comp. ratio |
|
|
23.2 |
% |
|
|
21.4 |
% |
|
|
25.1 |
% |
|
|
20.9 |
% |
| Pre-tax margin |
|
|
18.0 |
% |
|
|
20.8 |
% |
|
|
16.2 |
% |
|
|
20.2 |
% |
| Non-GAAP Financial Highlights: |
|
| Net revenues |
|
$ |
1,146,419 |
|
|
$ |
1,121,643 |
|
|
$ |
4,348,958 |
|
|
$ |
4,391,490 |
|
| Net income (1) (2) |
|
$ |
166,587 |
|
|
$ |
184,875 |
|
|
$ |
531,524 |
|
|
$ |
675,071 |
|
| Diluted EPS (1) (2) |
|
$ |
1.50 |
|
|
$ |
1.58 |
|
|
$ |
4.68 |
|
|
$ |
5.74 |
|
| Comp. ratio (2) |
|
|
58.0 |
% |
|
|
56.5 |
% |
|
|
58.0 |
% |
|
|
58.0 |
% |
| Non-comp. ratio (2) |
|
|
22.6 |
% |
|
|
20.6 |
% |
|
|
24.3 |
% |
|
|
20.3 |
% |
| Pre-tax margin (3) |
|
|
19.4 |
% |
|
|
22.9 |
% |
|
|
17.7 |
% |
|
|
21.7 |
% |
| ROCE (4) |
|
|
14.6 |
% |
|
|
16.0 |
% |
|
|
11.5 |
% |
|
|
15.0 |
% |
| ROTCE (5) |
|
|
21.3 |
% |
|
|
22.9 |
% |
|
|
16.6 |
% |
|
|
21.8 |
% |
| Global Wealth
Management (assets and loans in millions) |
|
| Net revenues |
|
$ |
766,028 |
|
|
$ |
744,341 |
|
|
$ |
3,049,962 |
|
|
$ |
2,825,866 |
|
| Pre-tax net income |
|
$ |
301,360 |
|
|
$ |
317,071 |
|
|
$ |
1,215,822 |
|
|
$ |
1,067,571 |
|
| Total client assets |
|
$ |
444,318 |
|
|
$ |
389,818 |
|
|
|
|
|
|
|
|
|
| Fee-based client assets |
|
$ |
165,301 |
|
|
$ |
144,952 |
|
|
|
|
|
|
|
|
|
| Bank loans (6) |
|
$ |
19,730 |
|
|
$ |
20,622 |
|
|
|
|
|
|
|
|
|
| Institutional
Group |
|
| Net revenues |
|
$ |
359,292 |
|
|
$ |
353,882 |
|
|
$ |
1,226,317 |
|
|
$ |
1,536,017 |
|
| Equity |
|
$ |
200,915 |
|
|
$ |
220,033 |
|
|
$ |
709,286 |
|
|
$ |
935,507 |
|
| Fixed Income |
|
$ |
158,377 |
|
|
$ |
133,849 |
|
|
$ |
517,031 |
|
|
$ |
600,510 |
|
| Pre-tax net
income |
|
$ |
7,771 |
|
|
$ |
44,512 |
|
|
$ |
2,100 |
|
|
$ |
254,132 |
|
Media Contact: Neil Shapiro
(212) 271-3447 | Investor Contact: Joel Jeffrey (212) 271- 3610 | www.stifel.com/investor-relations

Global Wealth Management
Fourth Quarter Results
Global Wealth Management reported record net revenues of $766.0 million for the three months ended December 31, 2023 compared with
$744.3 million during the fourth quarter of 2022. Pre-tax net income was $301.4 million compared with $317.1 million in the fourth quarter of 2022.
Highlights
| • |
|
Recruited 40 financial advisors during the quarter, including 12 experienced employee advisors and 1 experienced independent advisor with total trailing 12 month production of $8 million. |
| • |
|
Client assets of $444.3 billion, up 14% over the year-ago quarter. |
| • |
|
Fee-based client assets of $165.3 billion, up 14% over the year-ago quarter. |
Net revenues increased 3% from a year ago:
| • |
|
Transactional revenues increased 2% over the year-ago quarter reflecting an increase in client activity. |
| • |
|
Asset management revenues increased 14% over the year-ago quarter reflecting higher asset values. |
| • |
|
Net interest income decreased 10% from the year-ago quarter driven by changes in deposit mix, partially offset by higher interest rates. |
Total Expenses:
| • |
|
Compensation expense as percent of net revenues increased to 46.9% primarily as a result of higher compensable revenues. |
| • |
|
Provision for credit losses decreased from a year ago as a result of reserve reductions in certain asset classes driven by an improved macroeconomic environment, partially offset by deteriorating conditions in the
commercial real estate sector. |
| • |
|
Non-compensation operating expenses as a percent of net revenues increased to 13.8% primarily as a result of higher litigation-related and insurance expenses, partially offset by
revenue growth and a decrease in the provision for credit losses over the year-ago quarter.
|
|
|
|
|
|
|
|
|
|
| Summary Results of Operations |
|
| (000s) |
|
4Q 2023 |
|
|
4Q 2022 |
|
| Net revenues |
|
$ |
766,028 |
|
|
$ |
744,341 |
|
| Transactional revenues |
|
|
169,471 |
|
|
|
165,557 |
|
| Asset management |
|
|
330,498 |
|
|
|
289,445 |
|
| Net interest income |
|
|
257,920 |
|
|
|
284,998 |
|
| Investment banking |
|
|
4,562 |
|
|
|
4,814 |
|
| Other income |
|
|
3,577 |
|
|
|
(473 |
) |
| Total expenses |
|
$ |
464,668 |
|
|
$ |
427,270 |
|
| Compensation expense |
|
|
359,376 |
|
|
|
328,099 |
|
| Provision for credit losses |
|
|
(37 |
) |
|
|
6,028 |
|
| Non-comp. opex |
|
|
105,329 |
|
|
|
93,143 |
|
| Pre-tax net income |
|
$ |
301,360 |
|
|
$ |
317,071 |
|
| Compensation ratio |
|
|
46.9 |
% |
|
|
44.1 |
% |
| Non-compensation ratio |
|
|
13.8 |
% |
|
|
13.3 |
% |
| Pre-tax
margin |
|
|
39.3 |
% |
|
|
42.6 |
% |
Stifel Financial
Corp. | Page 2

Institutional Group
Fourth Quarter Results
Institutional Group reported net revenues of $359.3 million for the three months ended December 31, 2023 compared with $353.9 million during
the fourth quarter of 2022. Pre-tax net income was $7.8 million compared with $44.5 million in the fourth quarter of 2022.
Highlights
Investment banking revenues decreased 8% from a year ago:
| • |
|
Advisory revenues of $129.4 million decreased 23% from the year-ago quarter driven by lower levels of completed advisory transactions. |
| • |
|
Equity capital raising revenues increased 31% over the year-ago quarter driven by higher volumes. |
| • |
|
Fixed income capital raising revenues increased 45% over the year-ago quarter driven by an increase in our public finance business. |
Fixed income transactional revenues increased 32% from a year ago:
| • |
|
Fixed income transactional revenues increased from the year-ago quarter driven by improved market conditions and increased client activity. |
Equity transactional revenues increased 9% from a year ago:
| • |
|
Equity transactional revenues increased from the year-ago quarter driven by higher trading gains. |
Total Expenses:
| • |
|
Compensation expense as a percent of net revenues increased to 69.3% primarily driven by lower compensable revenues. |
| • |
|
Non-compensation operating expenses as a percent of net revenues increased to 28.5% as a result of higher professional fees, travel-related expenses, and occupancy costs, as well
as continued investments in technology.
|
|
|
|
|
|
|
|
|
|
| Summary Results of Operations |
|
| (000s) |
|
4Q 2023 |
|
|
4Q 2022 |
|
| Net revenues |
|
$ |
359,292 |
|
|
$ |
353,882 |
|
| Investment banking |
|
|
201,102 |
|
|
|
218,891 |
|
| Advisory |
|
|
129,378 |
|
|
|
166,935 |
|
| Equity capital raising |
|
|
31,510 |
|
|
|
24,127 |
|
| Fixed income capital raising |
|
|
40,214 |
|
|
|
27,829 |
|
| Fixed income transactional |
|
|
102,019 |
|
|
|
77,320 |
|
| Equity transactional |
|
|
56,501 |
|
|
|
51,850 |
|
| Other |
|
|
(330 |
) |
|
|
5,821 |
|
| Total expenses |
|
$ |
351,521 |
|
|
$ |
309,370 |
|
| Compensation expense |
|
|
248,970 |
|
|
|
220,730 |
|
| Non-comp. opex. |
|
|
102,551 |
|
|
|
88,640 |
|
| Pre-tax net income |
|
$ |
7,771 |
|
|
$ |
44,512 |
|
| Compensation ratio |
|
|
69.3 |
% |
|
|
62.4 |
% |
| Non-compensation ratio |
|
|
28.5 |
% |
|
|
25.0 |
% |
| Pre-tax
margin |
|
|
2.2 |
% |
|
|
12.6 |
% |
Stifel Financial
Corp. | Page 3
Global Wealth Management
Full Year Results
Global Wealth Management reported record net revenues of $3.0 billion for the year ended December 31, 2023 compared with $2.8 billion in 2022. Pre-tax net income was $1.2 billion compared with $1.1 million in 2022.
Highlights
| • |
|
Recruited 171 financial advisors during the year, including 76 experienced employee advisors and 9 experienced independent advisors with total trailing 12 month production of $69 million. |
| • |
|
Pre-tax margin of 40%, up from 38% in 2022. |
Net revenues increased
8% from prior year:
| • |
|
Transactional revenues decreased 2% from prior year reflecting a decrease in client activity amid uncertainty in the markets. |
| • |
|
Asset management revenues increased 3% from prior year reflecting higher asset values. |
| • |
|
Net interest income increased 24% from prior year primarily driven by higher interest rates. |
Total
Expenses:
| • |
|
Compensation expense as a percent of net revenues decreased to 46.4% primarily as a result of higher net interest income. |
| • |
|
Provision for credit losses was primarily impacted by a slightly better macroeconomic forecast, partially offset by a deterioration in certain asset classes. |
| • |
|
Non-compensation operating expenses as a percent of net revenues decreased to 13.7% primarily as a result of revenue growth and expense discipline.
|
|
|
|
|
|
|
|
|
|
| Summary Results of Operations |
|
| (000s) |
|
FY 2023 |
|
|
FY 2022 |
|
| Net revenues |
|
$ |
3,049,962 |
|
|
$ |
2,825,866 |
|
| Transactional revenues |
|
|
654,231 |
|
|
|
668,912 |
|
| Asset management |
|
|
1,299,361 |
|
|
|
1,262,841 |
|
| Net interest income |
|
|
1,086,628 |
|
|
|
879,780 |
|
| Investment banking |
|
|
16,680 |
|
|
|
19,515 |
|
| Other income |
|
|
(6,938 |
) |
|
|
(5,182 |
) |
| Total expenses |
|
$ |
1,834,140 |
|
|
$ |
1,758,295 |
|
| Compensation expense |
|
|
1,415,210 |
|
|
|
1,368,576 |
|
| Provision for credit losses |
|
|
22,699 |
|
|
|
33,506 |
|
| Non-comp. opex |
|
|
396,231 |
|
|
|
356,213 |
|
| Pre-tax net income |
|
$ |
1,215,822 |
|
|
$ |
1,067,571 |
|
| Compensation ratio |
|
|
46.4 |
% |
|
|
48.4 |
% |
| Non-compensation ratio |
|
|
13.7 |
% |
|
|
13.8 |
% |
| Pre-tax
margin |
|
|
39.9 |
% |
|
|
37.8 |
% |
Stifel Financial
Corp. | Page 4
Institutional Group
Full Year Results
Institutional Group reported net revenues of $1.2 billion for the year ended December 31, 2023 compared with $1.5 billion in 2022. Pre-tax net income was $2.1 million compared with $254.1 million in 2022.
Highlights
Investment banking revenues decreased 25% from prior year:
| • |
|
Advisory revenues of $465.6 million decreased 35% from prior year driven by lower levels of completed advisory transactions. |
| • |
|
Equity capital raising revenues increased 4% from prior year driven by higher volumes. |
| • |
|
Fixed income capital raising revenues increased 6% from prior year driven by an increase in our corporate debt issuance business. |
Fixed income transactional revenues decreased 17% from prior year:
| |
• |
|
Fixed income transactional revenues decreased from prior year driven by declines across most products as a result of lower volumes and lower market volatility compared with elevated levels in the prior year, partially
offset by higher trading gains. |
Equity transactional revenues remained relatively consistent with prior year:
| • |
|
Equity transactional revenues increased slightly from prior year driven by an increase trading gains. |
Total Expenses:
| • |
|
Compensation expense as a percent of net revenues increased to 68.6% primarily as a result of lower compensable revenues. |
| • |
|
Non-compensation operating expenses as a percent of net revenues increased to 31.2% as a result of lower net revenues, higher travel-related expenses, and investments in
technology, partially offset by lower investment banking expenses.
|
|
|
|
|
|
|
|
|
|
| Summary Results of Operations |
|
| (000s) |
|
FY 2023 |
|
|
FY 2022 |
|
| Net revenues |
|
$ |
1,226,317 |
|
|
$ |
1,536,017 |
|
| Investment banking |
|
|
714,575 |
|
|
|
951,970 |
|
| Advisory |
|
|
465,588 |
|
|
|
714,623 |
|
| Equity capital raising |
|
|
107,340 |
|
|
|
103,437 |
|
| Fixed income capital raising |
|
|
141,647 |
|
|
|
133,910 |
|
| Fixed income transactional |
|
|
308,393 |
|
|
|
370,198 |
|
| Equity transactional |
|
|
201,413 |
|
|
|
200,512 |
|
| Other |
|
|
1,936 |
|
|
|
13,337 |
|
| Total expenses |
|
$ |
1,224,217 |
|
|
$ |
1,281,885 |
|
| Compensation expense |
|
|
841,671 |
|
|
|
929,606 |
|
| Non-comp. opex. |
|
|
382,546 |
|
|
|
352,279 |
|
| Pre-tax net income |
|
$ |
2,100 |
|
|
$ |
254,132 |
|
| Compensation ratio |
|
|
68.6 |
% |
|
|
60.5 |
% |
| Non-compensation ratio |
|
|
31.2 |
% |
|
|
23.0 |
% |
| Pre-tax
margin |
|
|
0.2 |
% |
|
|
16.5 |
% |
Stifel Financial
Corp. | Page 5
Other Matters
Highlights
| • |
|
Total assets increased $531.3 million, or 1%, over the year-ago quarter. |
| • |
|
The Board of Directors approved a 17% increase in the quarterly dividend to $0.42 per common share starting in the first quarter of 2024. |
| • |
|
The Company repurchased $141.1 million of its outstanding common stock during the fourth quarter. During 2023, the Company repurchased $441.3 million of its outstanding common stock. |
| • |
|
Weighted average diluted shares outstanding decreased as a result of the increase in share repurchases over the comparable periods. |
| • |
|
The Board of Directors declared a $0.36 quarterly dividend per share payable on December 15, 2023 to common shareholders of record on December 1, 2023. |
| • |
|
The Board of Directors declared a quarterly dividend on the outstanding shares of the Company’s preferred stock payable on December 15, 2023 to shareholders of record on December 1, 2023.
|
|
|
|
|
|
|
|
|
|
|
|
|
|
|
|
|
|
| |
|
4Q 2023 |
|
|
4Q 2022 |
|
|
FY 2023 |
|
|
FY 2022 |
|
| Common stock
repurchases |
|
|
|
|
|
|
|
|
|
|
|
|
|
| Repurchases (000s) (8) |
|
$ |
141,138 |
|
|
$ |
75,164 |
|
|
$ |
441,289 |
|
|
$ |
105,831 |
|
| Number of shares (000s) (8) |
|
|
2,345 |
|
|
|
1,252 |
|
|
|
7,175 |
|
|
|
1,757 |
|
| Average price |
|
$ |
60.18 |
|
|
$ |
60.06 |
|
|
$ |
61.16 |
|
|
$ |
64.50 |
|
| Period end shares (000s) |
|
|
101,062 |
|
|
|
105,348 |
|
|
|
101,062 |
|
|
|
105,348 |
|
| Weighted average diluted shares outstanding (000s) |
|
|
111,330 |
|
|
|
117,223 |
|
|
|
113,453 |
|
|
|
117,540 |
|
| Effective tax rate |
|
|
21.1 |
% |
|
|
24.4 |
% |
|
|
26.1 |
% |
|
|
25.2 |
% |
| Stifel Financial Corp. (9) |
|
|
|
|
|
|
|
|
|
|
|
|
|
| Tier 1 common capital ratio |
|
|
14.2 |
% |
|
|
14.6 |
% |
|
|
|
|
|
|
|
|
| Tier 1 risk based capital ratio |
|
|
17.2 |
% |
|
|
17.6 |
% |
|
|
|
|
|
|
|
|
| Tier 1 leverage capital ratio |
|
|
10.5 |
% |
|
|
11.1 |
% |
|
|
|
|
|
|
|
|
| Tier 1 capital (MM) |
|
$ |
3,916 |
|
|
$ |
4,048 |
|
|
|
|
|
|
|
|
|
| Risk weighted assets (MM) |
|
$ |
22,738 |
|
|
$ |
23,027 |
|
|
|
|
|
|
|
|
|
| Average assets (MM) |
|
$ |
37,451 |
|
|
$ |
36,479 |
|
|
|
|
|
|
|
|
|
| Quarter end assets (MM) |
|
$ |
37,727 |
|
|
$ |
37,196 |
|
|
|
|
|
|
|
|
|
| Agency |
|
|
Rating |
|
|
|
Outlook |
|
|
|
|
|
|
|
|
|
| Fitch Ratings |
|
|
BBB+ |
|
|
|
Stable |
|
|
|
|
|
|
|
|
|
| S&P Global Ratings |
|
|
BBB- |
|
|
|
Positive |
|
|
|
|
|
|
|
|
|
Stifel Financial
Corp. | Page 6
Conference Call Information
Stifel Financial Corp. will host its fourth quarter 2023 financial results conference call on Wednesday, January 24,
2024, at 9:30 a.m. Eastern Time. The conference call may include forward-looking statements.
All interested parties are invited to listen
to Stifel’s Chairman and CEO, Ronald J. Kruszewski, by dialing (866) 409-1555 and referencing conference ID 4717221. A live audio webcast of the call, as well as a presentation highlighting
the Company’s results, will be available through the Company’s web site, www.stifel.com. For those who cannot listen to the live broadcast, a replay of the broadcast will be available through the above-referenced web site beginning
approximately one hour following the completion of the call.
Company Information
Stifel Financial Corp. (NYSE: SF) is a financial services holding company headquartered in St. Louis, Missouri, that conducts its banking, securities, and
financial services business through several wholly owned subsidiaries. Stifel’s broker-dealer clients are served in the United States through Stifel, Nicolaus & Company, Incorporated, including its Eaton Partners and Miller Buckfire
business divisions; Keefe, Bruyette & Woods, Inc.; and Stifel Independent Advisors, LLC; in Canada through Stifel Nicolaus Canada Inc.; and in the United Kingdom and Europe through Stifel Nicolaus Europe Limited. The Company’s
broker-dealer affiliates provide securities brokerage, investment banking, trading, investment advisory, and related financial services to individual investors, professional money managers, businesses, and municipalities. Stifel Bank and Stifel
Bank & Trust offer a full range of consumer and commercial lending solutions. Stifel Trust Company, N.A. and Stifel Trust Company Delaware, N.A. offer trust and related services. To learn more about Stifel, please visit the Company’s
website at www.stifel.com. For global disclosures, please visit www.stifel.com/investor-relations/press-releases.
A financial summary follows. Financial, statistical and business-related information, as well as information regarding business and segment trends, is
included in the financial supplement. Both the earnings release and the financial supplement are available online in the Investor Relations section at www.stifel.com/investor-relations.
The information provided herein and in the financial supplement, including information provided on the Company’s earnings conference calls, may include
certain non-GAAP financial measures. The definition of such measures or reconciliation of such measures to the comparable U.S. GAAP figures are included in this earnings release and the financial supplement,
both of which are available online in the Investor Relations section at www.stifel.com/investor-relations.
Cautionary Note
Regarding Forward-Looking Statements
This earnings release contains certain statements that may be deemed to be “forward-looking
statements” within the meaning of Section 27A of the Securities Act of 1933 and Section 21E of the Securities Exchange Act of 1934. All statements in this earnings release not dealing with historical results are forward-looking and
are based on various assumptions. The forward-looking statements in this earnings release are subject to risks and uncertainties that could cause actual results to differ materially from those expressed in or implied by the statements. Factors that
may cause actual results to differ materially from those contemplated by such forward-looking statements include, among other things, the following possibilities: the ability to successfully integrate acquired companies or the branch offices and
financial advisors; a material adverse change in financial condition; the risk of borrower, depositor, and other customer attrition; a change in general business and economic conditions; changes in the interest rate environment, deposit flows, loan
demand, real estate values, and competition; changes in accounting principles, policies, or guidelines; changes in legislation and regulation; other economic, competitive, governmental, regulatory, geopolitical, and technological factors affecting
the companies’ operations, pricing, and services; and other risk factors referred to from time to time in filings made by Stifel Financial Corp. with the Securities and Exchange Commission. For information about the risks and important factors
that could affect the Company’s future results, financial condition and liquidity, see “Risk Factors” in Part I, Item 1A of the Company’s Annual Report on Form 10-K for the year ended
December 31, 2022. Forward-looking statements speak only as to the date they are made. The Company disclaims any intent or obligation to update forward-looking statements to reflect circumstances or events that occur after the date the
forward-looking statements are made.
Stifel Financial
Corp. | Page 7
Summary Results of Operations (Unaudited)
|
|
|
|
|
|
|
|
|
|
|
|
|
|
|
|
|
|
|
|
|
|
|
|
|
|
|
|
|
|
|
|
|
| |
|
Three Months Ended |
|
|
|
|
|
Year Ended |
|
| (000s, except per share amounts) |
|
12/31/2023 |
|
|
12/31/2022 |
|
|
% Change |
|
|
9/30/2023 |
|
|
% Change |
|
|
12/31/2023 |
|
|
12/31/2022 |
|
|
% Change |
|
| Revenues: |
|
|
|
|
|
|
|
|
|
|
|
|
|
|
|
|
|
|
|
|
|
|
|
|
|
|
|
|
|
|
|
|
| Commissions |
|
$ |
173,614 |
|
|
$ |
168,945 |
|
|
|
2.8 |
|
|
$ |
165,075 |
|
|
|
5.2 |
|
|
$ |
673,597 |
|
|
$ |
710,589 |
|
|
|
(5.2 |
) |
| Principal transactions |
|
|
154,377 |
|
|
|
125,781 |
|
|
|
22.7 |
|
|
|
114,841 |
|
|
|
34.4 |
|
|
|
490,440 |
|
|
|
529,033 |
|
|
|
(7.3 |
) |
| Investment banking |
|
|
205,664 |
|
|
|
223,706 |
|
|
|
(8.1 |
) |
|
|
146,887 |
|
|
|
40.0 |
|
|
|
731,255 |
|
|
|
971,485 |
|
|
|
(24.7 |
) |
| Asset management |
|
|
330,536 |
|
|
|
289,462 |
|
|
|
14.2 |
|
|
|
333,127 |
|
|
|
(0.8 |
) |
|
|
1,299,496 |
|
|
|
1,262,919 |
|
|
|
2.9 |
|
| Other income |
|
|
9,687 |
|
|
|
11,862 |
|
|
|
(18.3 |
) |
|
|
459 |
|
|
|
nm |
|
|
|
8,747 |
|
|
|
19,685 |
|
|
|
(55.6 |
) |
| Operating revenues |
|
|
873,878 |
|
|
|
819,756 |
|
|
|
6.6 |
|
|
|
760,389 |
|
|
|
14.9 |
|
|
|
3,203,535 |
|
|
|
3,493,711 |
|
|
|
(8.3 |
) |
| Interest revenue |
|
|
516,213 |
|
|
|
416,731 |
|
|
|
23.9 |
|
|
|
505,198 |
|
|
|
2.2 |
|
|
|
1,955,745 |
|
|
|
1,099,115 |
|
|
|
77.9 |
|
| Total revenues |
|
|
1,390,091 |
|
|
|
1,236,487 |
|
|
|
12.4 |
|
|
|
1,265,587 |
|
|
|
9.8 |
|
|
|
5,159,280 |
|
|
|
4,592,826 |
|
|
|
12.3 |
|
| Interest expense |
|
|
243,712 |
|
|
|
114,840 |
|
|
|
112.2 |
|
|
|
220,536 |
|
|
|
10.5 |
|
|
|
810,336 |
|
|
|
201,387 |
|
|
|
302.4 |
|
| Net revenues |
|
|
1,146,379 |
|
|
|
1,121,647 |
|
|
|
2.2 |
|
|
|
1,045,051 |
|
|
|
9.7 |
|
|
|
4,348,944 |
|
|
|
4,391,439 |
|
|
|
(1.0 |
) |
| Non-interest expenses: |
|
|
|
|
|
|
|
|
|
|
|
|
|
|
|
|
|
|
|
|
|
|
|
|
|
|
|
|
|
|
|
|
| Compensation and benefits |
|
|
674,437 |
|
|
|
647,962 |
|
|
|
4.1 |
|
|
|
613,287 |
|
|
|
10.0 |
|
|
|
2,554,581 |
|
|
|
2,586,232 |
|
|
|
(1.2 |
) |
| Non-compensation operating expenses |
|
|
265,947 |
|
|
|
239,988 |
|
|
|
10.8 |
|
|
|
322,335 |
|
|
|
(17.5 |
) |
|
|
1,087,671 |
|
|
|
920,091 |
|
|
|
18.2 |
|
| Total non-interest expenses |
|
|
940,384 |
|
|
|
887,950 |
|
|
|
5.9 |
|
|
|
935,622 |
|
|
|
0.5 |
|
|
|
3,642,252 |
|
|
|
3,506,323 |
|
|
|
3.9 |
|
| Income before income taxes |
|
|
205,995 |
|
|
|
233,697 |
|
|
|
(11.9 |
) |
|
|
109,429 |
|
|
|
88.2 |
|
|
|
706,692 |
|
|
|
885,116 |
|
|
|
(20.2 |
) |
| Provision for income taxes |
|
|
43,511 |
|
|
|
57,076 |
|
|
|
(23.8 |
) |
|
|
41,268 |
|
|
|
5.4 |
|
|
|
184,156 |
|
|
|
222,961 |
|
|
|
(17.4 |
) |
| Net income |
|
|
162,484 |
|
|
|
176,621 |
|
|
|
(8.0 |
) |
|
|
68,161 |
|
|
|
138.4 |
|
|
|
522,536 |
|
|
|
662,155 |
|
|
|
(21.1 |
) |
| Preferred dividends |
|
|
9,320 |
|
|
|
9,320 |
|
|
|
0.0 |
|
|
|
9,321 |
|
|
|
(0.0 |
) |
|
|
37,281 |
|
|
|
37,281 |
|
|
|
0.0 |
|
| Net income available to common shareholders |
|
$ |
153,164 |
|
|
$ |
167,301 |
|
|
|
(8.5 |
) |
|
$ |
58,840 |
|
|
|
160.3 |
|
|
$ |
485,255 |
|
|
$ |
624,874 |
|
|
|
(22.3 |
) |
| Earnings per common share: |
|
|
|
|
|
|
|
|
|
|
|
|
|
|
|
|
|
|
|
|
|
|
|
|
|
|
|
|
|
|
|
|
| Basic |
|
$ |
1.47 |
|
|
$ |
1.54 |
|
|
|
(4.5 |
) |
|
$ |
0.55 |
|
|
|
167.3 |
|
|
$ |
4.55 |
|
|
$ |
5.74 |
|
|
|
(20.7 |
) |
| Diluted |
|
$ |
1.38 |
|
|
$ |
1.43 |
|
|
|
(3.5 |
) |
|
$ |
0.52 |
|
|
|
165.4 |
|
|
$ |
4.28 |
|
|
$ |
5.32 |
|
|
|
(19.5 |
) |
| Cash dividends declared per common share |
|
$ |
0.36 |
|
|
$ |
0.30 |
|
|
|
20.0 |
|
|
$ |
0.36 |
|
|
|
— |
|
|
$ |
1.44 |
|
|
$ |
1.20 |
|
|
|
20.0 |
|
| Weighted average number of common shares outstanding: |
|
|
|
|
|
|
|
|
|
|
|
|
|
|
|
|
|
|
|
|
|
| Basic |
|
|
103,934 |
|
|
|
108,344 |
|
|
|
(4.1 |
) |
|
|
106,068 |
|
|
|
(2.0 |
) |
|
|
106,661 |
|
|
|
108,848 |
|
|
|
(2.0 |
) |
| Diluted |
|
|
111,330 |
|
|
|
117,223 |
|
|
|
(5.0 |
) |
|
|
113,195 |
|
|
|
(1.6 |
) |
|
|
113,453 |
|
|
|
117,540 |
|
|
|
(3.5 |
) |
Stifel Financial
Corp. | Page 8
Non-GAAP Financial Measures (10)
|
|
|
|
|
|
|
|
|
|
|
|
|
|
|
|
|
| |
|
Three Months Ended |
|
|
Year Ended |
|
| (000s, except per share amounts) |
|
12/31/2023 |
|
|
12/31/2022 |
|
|
12/31/2023 |
|
|
12/31/2022 |
|
| GAAP net income |
|
$ |
162,484 |
|
|
$ |
176,621 |
|
|
$ |
522,536 |
|
|
$ |
662,155 |
|
| Preferred dividend |
|
|
9,320 |
|
|
|
9,320 |
|
|
|
37,281 |
|
|
|
37,281 |
|
| Net income available to common shareholders |
|
|
153,164 |
|
|
|
167,301 |
|
|
|
485,255 |
|
|
|
624,874 |
|
|
|
|
|
|
| Non-GAAP adjustments: |
|
|
|
|
|
|
|
|
|
|
|
|
|
|
|
|
| Merger-related (11) |
|
|
16,921 |
|
|
|
23,497 |
|
|
|
63,222 |
|
|
|
67,099 |
|
| Provision for income taxes (12) |
|
|
(3,498 |
) |
|
|
(5,923 |
) |
|
|
(16,953 |
) |
|
|
(16,902 |
) |
| Total non-GAAP adjustments |
|
|
13,423 |
|
|
|
17,574 |
|
|
|
46,269 |
|
|
|
50,197 |
|
| Non-GAAP net income available to common
shareholders |
|
$ |
166,587 |
|
|
$ |
184,875 |
|
|
$ |
531,524 |
|
|
$ |
675,071 |
|
| Weighted average diluted shares outstanding |
|
|
111,330 |
|
|
|
117,223 |
|
|
|
113,453 |
|
|
|
117,540 |
|
|
|
|
|
|
| GAAP earnings per diluted common share |
|
$ |
1.46 |
|
|
$ |
1.51 |
|
|
$ |
4.61 |
|
|
$ |
5.63 |
|
| Non-GAAP adjustments |
|
|
0.12 |
|
|
|
0.15 |
|
|
|
0.40 |
|
|
|
0.43 |
|
| Non-GAAP earnings per diluted common share |
|
$ |
1.58 |
|
|
$ |
1.66 |
|
|
$ |
5.01 |
|
|
$ |
6.06 |
|
| GAAP earnings per diluted common share available to common shareholders |
|
$ |
1.38 |
|
|
$ |
1.43 |
|
|
$ |
4.28 |
|
|
$ |
5.32 |
|
| Non-GAAP adjustments |
|
|
0.12 |
|
|
|
0.15 |
|
|
|
0.40 |
|
|
|
0.42 |
|
| Non-GAAP
earnings per diluted common share available to common shareholders |
|
$ |
1.50 |
|
|
$ |
1.58 |
|
|
$ |
4.68 |
|
|
$ |
5.74 |
|
GAAP to Non-GAAP Reconciliation (10)
|
|
|
|
|
|
|
|
|
|
|
|
|
|
|
|
|
| |
|
Three Months Ended |
|
|
Year Ended |
|
| (000s) |
|
12/31/2023 |
|
|
12/31/2022 |
|
|
12/31/2023 |
|
|
12/31/2022 |
|
| GAAP compensation and benefits |
|
$ |
674,437 |
|
|
$ |
647,962 |
|
|
$ |
2,554,581 |
|
|
$ |
2,586,232 |
|
| As a percentage of net revenues |
|
|
58.8 |
% |
|
|
57.8 |
% |
|
|
58.7 |
% |
|
|
58.9 |
% |
| Non-GAAP adjustments: |
|
|
|
|
|
|
|
|
|
|
|
|
|
|
|
|
| Merger-related (11) |
|
|
(9,203 |
) |
|
|
(14,570 |
) |
|
|
(32,150 |
) |
|
|
(39,114 |
) |
| Non-GAAP compensation and benefits |
|
$ |
665,234 |
|
|
$ |
633,392 |
|
|
$ |
2,522,431 |
|
|
$ |
2,547,118 |
|
| As a percentage of non-GAAP net revenues |
|
|
58.0 |
% |
|
|
56.5 |
% |
|
|
58.0 |
% |
|
|
58.0 |
% |
|
|
|
|
|
| GAAP non-compensation expenses |
|
$ |
265,947 |
|
|
$ |
239,988 |
|
|
$ |
1,087,671 |
|
|
$ |
920,091 |
|
| As a percentage of net revenues |
|
|
23.2 |
% |
|
|
21.4 |
% |
|
|
25.1 |
% |
|
|
20.9 |
% |
| Non-GAAP adjustments: |
|
|
|
|
|
|
|
|
|
|
|
|
|
|
|
|
| Merger-related (11) |
|
|
(7,678 |
) |
|
|
(8,931 |
) |
|
|
(31,058 |
) |
|
|
(27,934 |
) |
| Non-GAAP
non-compensation expenses |
|
$ |
258,269 |
|
|
$ |
231,057 |
|
|
$ |
1,056,613 |
|
|
$ |
892,157 |
|
| As a percentage of non-GAAP net revenues |
|
|
22.6 |
% |
|
|
20.6 |
% |
|
|
24.3 |
% |
|
|
20.3 |
% |
| Total merger-related expenses |
|
$ |
16,921 |
|
|
$ |
23,497 |
|
|
$ |
63,222 |
|
|
$ |
67,099 |
|
Stifel Financial
Corp. | Page 9
Footnotes
| (1) |
Represents available to common shareholders. |
| (2) |
Reconciliations of the Company’s GAAP results to these non-GAAP
measures are discussed within and under “Non-GAAP Financial Measures” and “GAAP to Non-GAAP Reconciliation.” |
| (3) |
Non-GAAP pre-tax margin is
calculated by adding total merger-related expenses (non-GAAP adjustments) and dividing it by non-GAAP net revenues. See
“Non-GAAP Financial Measures” and “GAAP to Non-GAAP Reconciliation.” |
| (4) |
Return on average common equity (“ROCE”) is calculated by dividing annualized net income applicable
to common shareholders by average common shareholders’ equity or, in the case of non-GAAP ROCE, calculated by dividing non-GAAP net income applicable to commons
shareholders by average common shareholders’ equity. |
| (5) |
Return on average tangible common equity (“ROTCE”) is calculated by dividing annualized net income
applicable to common shareholders by average tangible shareholders’ equity or, in the case of non-GAAP ROTCE, calculated by dividing non-GAAP net income applicable
to common shareholders by average tangible common equity. Tangible common equity, also a non-GAAP financial measure, equals total common shareholders’ equity less goodwill and identifiable intangible
assets and the deferred taxes on goodwill and intangible assets. Average deferred taxes on goodwill and intangible assets was $71.1 million and $60.4 million as of December 31, 2023 and 2022, respectively. |
| (6) |
Includes loans held for sale. |
| (7) |
Tangible book value per common share represents shareholders’ equity (excluding preferred stock) divided
by period end common shares outstanding. Tangible common shareholders’ equity equals total common shareholders’ equity less goodwill and identifiable intangible assets and the deferred taxes on goodwill and intangible assets.
|
| (8) |
Common stock repurchases for the years ended December 31, 2023 and 2022 exclude $77.0 million
(1.3 million shares) and $86.6 million (1.2 million shares), respectively, of net-share settlements in connection with the Company’s equity compensation plan. |
| (9) |
Capital ratios are estimates as time of the Company’s earnings release, January 24, 2024.
|
| (10) |
The Company prepares its Consolidated Financial Statements using accounting principles generally accepted in
the United States (U.S. GAAP). The Company may disclose certain “non-GAAP financial measures” in the course of its earnings releases, earnings conference calls, financial presentations and otherwise.
The Securities and Exchange Commission defines a “non-GAAP financial measure” as a numerical measure of historical or future financial performance, financial position, or cash flows that is subject
to adjustments that effectively exclude, or include, amounts from the most directly comparable measure calculated and presented in accordance with U.S. GAAP. Non-GAAP financial measures disclosed by the
Company are provided as additional information to analysts, investors and other stakeholders in order to provide them with greater transparency about, or an alternative method for assessing the Company’s financial condition or operating
results. These measures are not in accordance with, or a substitute for U.S. GAAP, and may be different from or inconsistent with non-GAAP financial measures used by other companies. Whenever the Company
refers to a non-GAAP financial measure, it will also define it or present the most directly comparable financial measure calculated and presented in accordance with U.S. GAAP, along with a reconciliation of
the differences between the non-GAAP financial measure it references and such comparable U.S. GAAP financial measure. |
| (11) |
Primarily related to charges attributable to integration-related activities, signing bonuses, amortization of
restricted stock awards, debentures, and promissory notes issued as retention, additional earn-out expense, and amortization of intangible assets acquired. These costs were directly related to acquisitions of
certain businesses and are not representative of the costs of running the Company’s on-going business. |
| (12) |
Primarily represents the Company’s effective tax rate for the period applied to the non-GAAP adjustments. |
Stifel Financial
Corp. | Page 10
Exhibit 99.2

Fourth Quarter and Full Year 2023 Earnings Results
|
|
|
|
|
| Quarterly Financial Supplement |
|
Page |
|
|
|
| Consolidated Financial Highlights |
|
|
2 |
|
|
|
| GAAP Consolidated Results of Operations |
|
|
3 |
|
|
|
| Non-GAAP Consolidated Results of Operations |
|
|
4 |
|
|
|
| Consolidated Financial Summary |
|
|
5 |
|
|
|
| Consolidated Financial Information and Metrics |
|
|
6 |
|
|
|
| Regulatory Capital |
|
|
7 |
|
|
|
| Global Wealth Management - Summary Results of Operations |
|
|
8 |
|
|
|
| Global Wealth Management - Statistical Information |
|
|
9 |
|
|
|
| Institutional Group - Summary Results of Operations |
|
|
10 |
|
|
|
| Stifel Bancorp - Financial Information and Credit Metrics |
|
|
11 |
|
|
|
| Stifel Bancorp - Loan and Investment Portfolio |
|
|
12 |
|
|
|
| Loans and Lending Commitments - Allowance for Credit Losses |
|
|
13 |
|
|
|
| Consolidated Net Interest Income |
|
|
14 |
|
|
|
| Stifel Bancorp Net Interest Income |
|
|
15 |
|
|
|
| GAAP to Core Reconciliation |
|
|
16 |
|
|
|
| Footnotes |
|
|
17 |
|
|
|
| Disclaimer and Legal Notice |
|
|
18 |
|
|
|
|
| Stifel Financial Corp. Quarterly Financial Supplement | Fourth Quarter and Full Year 2023 Earnings Release |
|
Page 1 of 18 |
Consolidated Financial Highlights
|
|
|
|
|
|
|
|
|
|
|
|
|
|
|
|
|
|
|
|
|
|
|
|
|
|
|
|
|
|
|
|
|
| |
|
Three Months Ended |
|
|
Year Ended |
|
(Unaudited, 000s, except per share
information) |
|
12/31/2023 |
|
|
12/31/2022 |
|
|
% Change |
|
|
9/30/2023 |
|
|
% Change |
|
|
12/31/2023 |
|
|
12/31/2022 |
|
|
% Change |
|
| Net revenues |
|
$ |
1,146,379 |
|
|
$ |
1,121,647 |
|
|
|
2.2 |
% |
|
$ |
1,045,051 |
|
|
|
9.7 |
% |
|
$ |
4,348,944 |
|
|
$ |
4,391,439 |
|
|
|
(1.0 |
%) |
| Net income |
|
$ |
162,484 |
|
|
$ |
176,621 |
|
|
|
(8.0 |
%) |
|
$ |
68,161 |
|
|
|
138.4 |
% |
|
$ |
522,536 |
|
|
$ |
662,155 |
|
|
|
(21.1 |
%) |
| Preferred dividends |
|
|
9,320 |
|
|
|
9,320 |
|
|
|
0.0 |
% |
|
|
9,321 |
|
|
|
(0.0 |
%) |
|
|
37,281 |
|
|
|
37,281 |
|
|
|
0.0 |
% |
|
|
|
|
|
|
|
|
|
|
|
|
|
|
|
|
|
|
|
|
|
|
|
|
|
|
|
|
|
|
|
|
|
| Net income available to common shareholders |
|
$ |
153,164 |
|
|
$ |
167,301 |
|
|
|
(8.5 |
%) |
|
$ |
58,840 |
|
|
|
160.3 |
% |
|
$ |
485,255 |
|
|
$ |
624,874 |
|
|
|
(22.3 |
%) |
| Earnings per diluted common share |
|
$ |
1.46 |
|
|
$ |
1.51 |
|
|
|
(3.3 |
%) |
|
$ |
0.60 |
|
|
|
143.3 |
% |
|
$ |
4.61 |
|
|
$ |
5.63 |
|
|
|
(18.1 |
%) |
| Earnings per diluted common share available to common shareholders |
|
$ |
1.38 |
|
|
$ |
1.43 |
|
|
|
(3.5 |
%) |
|
$ |
0.52 |
|
|
|
165.4 |
% |
|
$ |
4.28 |
|
|
$ |
5.32 |
|
|
|
(19.5 |
%) |
| Non-GAAP financial summary (1): |
|
|
|
|
|
|
|
|
|
|
|
|
|
|
|
|
|
|
|
|
|
|
|
|
|
|
|
|
|
|
|
|
| Net revenues |
|
$ |
1,146,419 |
|
|
$ |
1,121,643 |
|
|
|
2.2 |
% |
|
$ |
1,045,028 |
|
|
|
9.7 |
% |
|
$ |
4,348,958 |
|
|
$ |
4,391,490 |
|
|
|
(1.0 |
%) |
| Net income |
|
$ |
175,907 |
|
|
$ |
194,195 |
|
|
|
(9.4 |
%) |
|
$ |
76,734 |
|
|
|
129.2 |
% |
|
$ |
568,805 |
|
|
$ |
712,352 |
|
|
|
(20.2 |
%) |
| Preferred dividends |
|
|
9,320 |
|
|
|
9,320 |
|
|
|
0.0 |
% |
|
|
9,321 |
|
|
|
(0.0 |
%) |
|
|
37,281 |
|
|
|
37,281 |
|
|
|
0.0 |
% |
|
|
|
|
|
|
|
|
|
|
|
|
|
|
|
|
|
|
|
|
|
|
|
|
|
|
|
|
|
|
|
|
|
| Net income available to common shareholders |
|
$ |
166,587 |
|
|
|
184,875 |
|
|
|
(9.9 |
%) |
|
|
67,413 |
|
|
|
147.1 |
% |
|
|
531,524 |
|
|
|
675,071 |
|
|
|
(21.3 |
%) |
| Earnings per diluted common share |
|
$ |
1.58 |
|
|
$ |
1.66 |
|
|
|
(4.8 |
%) |
|
$ |
0.68 |
|
|
|
132.4 |
% |
|
$ |
5.01 |
|
|
$ |
6.06 |
|
|
|
(17.3 |
%) |
| Earnings per diluted common share available to common shareholders |
|
$ |
1.50 |
|
|
$ |
1.58 |
|
|
|
(5.1 |
%) |
|
$ |
0.60 |
|
|
|
150.0 |
% |
|
$ |
4.68 |
|
|
$ |
5.74 |
|
|
|
(18.5 |
%) |
|
|
|
|
|
| Weighted average number of common shares outstanding: |
|
|
|
|
|
|
|
|
|
|
|
|
|
|
|
|
|
| Basic |
|
|
103,934 |
|
|
|
108,344 |
|
|
|
(4.1 |
%) |
|
|
106,068 |
|
|
|
(2.0 |
%) |
|
|
106,661 |
|
|
|
108,848 |
|
|
|
(2.0 |
%) |
| Diluted |
|
|
111,330 |
|
|
|
117,223 |
|
|
|
(5.0 |
%) |
|
|
113,195 |
|
|
|
(1.6 |
%) |
|
|
113,453 |
|
|
|
117,540 |
|
|
|
(3.5 |
%) |
| Period end common shares outstanding |
|
|
101,062 |
|
|
|
105,348 |
|
|
|
(4.1 |
%) |
|
|
103,120 |
|
|
|
(2.0 |
%) |
|
|
101,062 |
|
|
|
105,348 |
|
|
|
(4.1 |
%) |
| Cash dividends declared per common share |
|
$ |
0.36 |
|
|
$ |
0.30 |
|
|
|
20.0 |
% |
|
$ |
0.36 |
|
|
|
0.0 |
% |
|
$ |
1.44 |
|
|
$ |
1.20 |
|
|
|
20.0 |
% |
|
|
|
| Stifel Financial Corp. Quarterly Financial Supplement | Fourth Quarter and Full Year 2023 Earnings Release |
|
Page 2 of 18 |
GAAP Consolidated Results of Operations
|
|
|
|
|
|
|
|
|
|
|
|
|
|
|
|
|
|
|
|
|
|
|
|
|
|
|
|
|
|
|
|
|
| |
|
Three Months Ended |
|
|
Year Ended |
|
(Unaudited, 000s, except per share
information) |
|
12/31/2023 |
|
|
12/31/2022 |
|
|
% Change |
|
|
9/30/2023 |
|
|
% Change |
|
|
12/31/2023 |
|
|
12/31/2022 |
|
|
% Change |
|
| Revenues: |
|
|
|
|
|
|
|
|
|
|
|
|
|
|
|
|
|
|
|
|
|
|
|
|
|
|
|
|
|
|
|
|
| Commissions |
|
$ |
173,614 |
|
|
$ |
168,945 |
|
|
|
2.8 |
% |
|
$ |
165,075 |
|
|
|
5.2 |
% |
|
$ |
673,597 |
|
|
$ |
710,589 |
|
|
|
(5.2 |
%) |
| Principal transactions |
|
|
154,377 |
|
|
|
125,781 |
|
|
|
22.7 |
% |
|
|
114,841 |
|
|
|
34.4 |
% |
|
|
490,440 |
|
|
|
529,033 |
|
|
|
(7.3 |
%) |
|
|
|
|
|
|
|
|
|
|
|
|
|
|
|
|
|
|
|
|
|
|
|
|
|
|
|
|
|
|
|
|
|
| Transactional revenues |
|
|
327,991 |
|
|
|
294,726 |
|
|
|
11.3 |
% |
|
|
279,916 |
|
|
|
17.2 |
% |
|
|
1,164,037 |
|
|
|
1,239,622 |
|
|
|
(6.1 |
%) |
| Capital raising |
|
|
76,286 |
|
|
|
56,771 |
|
|
|
34.4 |
% |
|
|
49,615 |
|
|
|
53.8 |
% |
|
|
265,667 |
|
|
|
256,862 |
|
|
|
3.4 |
% |
| Advisory |
|
|
129,378 |
|
|
|
166,935 |
|
|
|
(22.5 |
%) |
|
|
97,272 |
|
|
|
33.0 |
% |
|
|
465,588 |
|
|
|
714,623 |
|
|
|
(34.8 |
%) |
|
|
|
|
|
|
|
|
|
|
|
|
|
|
|
|
|
|
|
|
|
|
|
|
|
|
|
|
|
|
|
|
|
| Investment banking |
|
|
205,664 |
|
|
|
223,706 |
|
|
|
(8.1 |
%) |
|
|
146,887 |
|
|
|
40.0 |
% |
|
|
731,255 |
|
|
|
971,485 |
|
|
|
(24.7 |
%) |
| Asset management |
|
|
330,536 |
|
|
|
289,462 |
|
|
|
14.2 |
% |
|
|
333,127 |
|
|
|
(0.8 |
%) |
|
|
1,299,496 |
|
|
|
1,262,919 |
|
|
|
2.9 |
% |
| Other income |
|
|
9,687 |
|
|
|
11,862 |
|
|
|
(18.3 |
%) |
|
|
459 |
|
|
|
nm |
|
|
|
8,747 |
|
|
|
19,685 |
|
|
|
(55.6 |
%) |
|
|
|
|
|
|
|
|
|
|
|
|
|
|
|
|
|
|
|
|
|
|
|
|
|
|
|
|
|
|
|
|
|
| Operating revenues |
|
|
873,878 |
|
|
|
819,756 |
|
|
|
6.6 |
% |
|
|
760,389 |
|
|
|
14.9 |
% |
|
|
3,203,535 |
|
|
|
3,493,711 |
|
|
|
(8.3 |
%) |
| Interest revenue |
|
|
516,213 |
|
|
|
416,731 |
|
|
|
23.9 |
% |
|
|
505,198 |
|
|
|
2.2 |
% |
|
|
1,955,745 |
|
|
|
1,099,115 |
|
|
|
77.9 |
% |
|
|
|
|
|
|
|
|
|
|
|
|
|
|
|
|
|
|
|
|
|
|
|
|
|
|
|
|
|
|
|
|
|
| Total revenues |
|
|
1,390,091 |
|
|
|
1,236,487 |
|
|
|
12.4 |
% |
|
|
1,265,587 |
|
|
|
9.8 |
% |
|
|
5,159,280 |
|
|
|
4,592,826 |
|
|
|
12.3 |
% |
| Interest expense |
|
|
243,712 |
|
|
|
114,840 |
|
|
|
112.2 |
% |
|
|
220,536 |
|
|
|
10.5 |
% |
|
|
810,336 |
|
|
|
201,387 |
|
|
|
302.4 |
% |
|
|
|
|
|
|
|
|
|
|
|
|
|
|
|
|
|
|
|
|
|
|
|
|
|
|
|
|
|
|
|
|
|
| Net revenues |
|
|
1,146,379 |
|
|
|
1,121,647 |
|
|
|
2.2 |
% |
|
|
1,045,051 |
|
|
|
9.7 |
% |
|
|
4,348,944 |
|
|
|
4,391,439 |
|
|
|
(1.0 |
%) |
|
|
|
|
|
|
|
|
|
|
|
|
|
|
|
|
|
|
|
|
|
|
|
|
|
|
|
|
|
|
|
|
|
| Non-interest expenses: |
|
|
|
|
|
|
|
|
|
|
|
|
|
|
|
|
|
|
|
|
|
|
|
|
|
|
|
|
|
|
|
|
| Compensation and benefits |
|
|
674,437 |
|
|
|
647,962 |
|
|
|
4.1 |
% |
|
|
613,287 |
|
|
|
10.0 |
% |
|
|
2,554,581 |
|
|
|
2,586,232 |
|
|
|
(1.2 |
%) |
| Occupancy and equipment rental |
|
|
88,182 |
|
|
|
80,740 |
|
|
|
9.2 |
% |
|
|
84,396 |
|
|
|
4.5 |
% |
|
|
339,322 |
|
|
|
313,247 |
|
|
|
8.3 |
% |
| Communication and office supplies |
|
|
47,332 |
|
|
|
45,209 |
|
|
|
4.7 |
% |
|
|
46,215 |
|
|
|
2.4 |
% |
|
|
184,652 |
|
|
|
175,135 |
|
|
|
5.4 |
% |
| Commissions and floor brokerage |
|
|
15,379 |
|
|
|
13,183 |
|
|
|
16.7 |
% |
|
|
14,413 |
|
|
|
6.7 |
% |
|
|
58,344 |
|
|
|
57,752 |
|
|
|
1.0 |
% |
| Provision for credit losses |
|
|
2,263 |
|
|
|
6,028 |
|
|
|
(62.5 |
%) |
|
|
9,992 |
|
|
|
(77.4 |
%) |
|
|
24,999 |
|
|
|
33,506 |
|
|
|
(25.4 |
%) |
| Other operating expenses |
|
|
112,791 |
|
|
|
94,828 |
|
|
|
18.9 |
% |
|
|
167,319 |
|
|
|
(32.6 |
%) |
|
|
480,354 |
|
|
|
340,451 |
|
|
|
41.1 |
% |
|
|
|
|
|
|
|
|
|
|
|
|
|
|
|
|
|
|
|
|
|
|
|
|
|
|
|
|
|
|
|
|
|
| Total non-interest expenses |
|
|
940,384 |
|
|
|
887,950 |
|
|
|
5.9 |
% |
|
|
935,622 |
|
|
|
0.5 |
% |
|
|
3,642,252 |
|
|
|
3,506,323 |
|
|
|
3.9 |
% |
| Income before income taxes |
|
|
205,995 |
|
|
|
233,697 |
|
|
|
(11.9 |
%) |
|
|
109,429 |
|
|
|
88.2 |
% |
|
|
706,692 |
|
|
|
885,116 |
|
|
|
(20.2 |
%) |
| Provision for income taxes |
|
|
43,511 |
|
|
|
57,076 |
|
|
|
(23.8 |
%) |
|
|
41,268 |
|
|
|
5.4 |
% |
|
|
184,156 |
|
|
|
222,961 |
|
|
|
(17.4 |
%) |
|
|
|
|
|
|
|
|
|
|
|
|
|
|
|
|
|
|
|
|
|
|
|
|
|
|
|
|
|
|
|
|
|
| Net income |
|
|
162,484 |
|
|
|
176,621 |
|
|
|
(8.0 |
%) |
|
|
68,161 |
|
|
|
138.4 |
% |
|
|
522,536 |
|
|
|
662,155 |
|
|
|
(21.1 |
%) |
| Preferred dividends |
|
|
9,320 |
|
|
|
9,320 |
|
|
|
0.0 |
% |
|
|
9,321 |
|
|
|
(0.0 |
%) |
|
|
37,281 |
|
|
|
37,281 |
|
|
|
0.0 |
% |
|
|
|
|
|
|
|
|
|
|
|
|
|
|
|
|
|
|
|
|
|
|
|
|
|
|
|
|
|
|
|
|
|
| Net income available to common shareholders |
|
$ |
153,164 |
|
|
$ |
167,301 |
|
|
|
(8.5 |
%) |
|
$ |
58,840 |
|
|
|
160.3 |
% |
|
$ |
485,255 |
|
|
$ |
624,874 |
|
|
|
(22.3 |
%) |
|
|
|
|
|
|
|
|
|
|
|
|
|
|
|
|
|
|
|
|
|
|
|
|
|
|
|
|
|
|
|
|
|
| Earnings per common share: |
|
|
|
|
|
|
|
|
|
|
|
|
|
|
|
|
|
|
|
|
|
|
|
|
|
|
|
|
|
|
|
|
| Basic |
|
$ |
1.47 |
|
|
$ |
1.54 |
|
|
|
(4.5 |
%) |
|
$ |
0.55 |
|
|
|
167.3 |
% |
|
$ |
4.55 |
|
|
$ |
5.74 |
|
|
|
(20.7 |
%) |
| Diluted |
|
$ |
1.38 |
|
|
$ |
1.43 |
|
|
|
(3.5 |
%) |
|
$ |
0.52 |
|
|
|
165.4 |
% |
|
$ |
4.28 |
|
|
$ |
5.32 |
|
|
|
(19.5 |
%) |
| Weighted average number of common shares outstanding: |
|
|
|
|
|
|
|
|
|
|
|
|
|
|
|
|
|
| Basic |
|
|
103,934 |
|
|
|
108,344 |
|
|
|
(4.1 |
%) |
|
|
106,068 |
|
|
|
(2.0 |
%) |
|
|
106,661 |
|
|
|
108,848 |
|
|
|
(2.0 |
%) |
| Diluted |
|
|
111,330 |
|
|
|
117,223 |
|
|
|
(5.0 |
%) |
|
|
113,195 |
|
|
|
(1.6 |
%) |
|
|
113,453 |
|
|
|
117,540 |
|
|
|
(3.5 |
%) |
| Cash dividends declared per common share |
|
$ |
0.36 |
|
|
$ |
0.30 |
|
|
|
20.0 |
% |
|
$ |
0.36 |
|
|
|
0.0 |
% |
|
$ |
1.44 |
|
|
$ |
1.20 |
|
|
|
20.0 |
% |
|
|
|
| Stifel Financial Corp. Quarterly Financial Supplement | Fourth Quarter and Full Year 2023 Earnings Release |
|
Page 3 of 18 |

Non-GAAP Consolidated Results of Operations (1)
|
|
|
|
|
|
|
|
|
|
|
|
|
|
|
|
|
|
|
|
|
|
|
|
|
|
|
|
|
|
|
|
|
| |
|
Three Months Ended |
|
|
Year Ended |
|
(Unaudited, 000s, except per share
information) |
|
12/31/2023 |
|
|
12/31/2022 |
|
|
% Change |
|
|
9/30/2023 |
|
|
% Change |
|
|
12/31/2023 |
|
|
12/31/2022 |
|
|
% Change |
|
| Revenues: |
|
|
|
|
|
|
|
|
|
|
|
|
|
|
|
|
|
|
|
|
|
|
|
|
|
|
|
|
|
|
|
|
| Commissions |
|
$ |
173,614 |
|
|
$ |
168,945 |
|
|
|
2.8 |
% |
|
$ |
165,075 |
|
|
|
5.2 |
% |
|
$ |
673,597 |
|
|
$ |
710,589 |
|
|
|
(5.2 |
%) |
| Principal transactions |
|
|
154,377 |
|
|
|
125,781 |
|
|
|
22.7 |
% |
|
|
114,841 |
|
|
|
34.4 |
% |
|
|
490,440 |
|
|
|
529,033 |
|
|
|
(7.3 |
%) |
|
|
|
|
|
|
|
|
|
|
|
|
|
|
|
|
|
|
|
|
|
|
|
|
|
|
|
|
|
|
|
|
|
| Transactional revenues |
|
|
327,991 |
|
|
|
294,726 |
|
|
|
11.3 |
% |
|
|
279,916 |
|
|
|
17.2 |
% |
|
|
1,164,037 |
|
|
|
1,239,622 |
|
|
|
(6.1 |
%) |
| Capital raising |
|
|
76,286 |
|
|
|
56,771 |
|
|
|
34.4 |
% |
|
|
49,615 |
|
|
|
53.8 |
% |
|
|
265,667 |
|
|
|
256,862 |
|
|
|
3.4 |
% |
| Advisory |
|
|
129,378 |
|
|
|
166,935 |
|
|
|
(22.5 |
%) |
|
|
97,272 |
|
|
|
33.0 |
% |
|
|
465,588 |
|
|
|
714,623 |
|
|
|
(34.8 |
%) |
|
|
|
|
|
|
|
|
|
|
|
|
|
|
|
|
|
|
|
|
|
|
|
|
|
|
|
|
|
|
|
|
|
| Investment banking |
|
|
205,664 |
|
|
|
223,706 |
|
|
|
(8.1 |
%) |
|
|
146,887 |
|
|
|
40.0 |
% |
|
|
731,255 |
|
|
|
971,485 |
|
|
|
(24.7 |
%) |
| Asset management |
|
|
330,536 |
|
|
|
289,462 |
|
|
|
14.2 |
% |
|
|
333,127 |
|
|
|
(0.8 |
%) |
|
|
1,299,496 |
|
|
|
1,262,919 |
|
|
|
2.9 |
% |
| Other income |
|
|
9,726 |
|
|
|
11,857 |
|
|
|
(18.0 |
%) |
|
|
436 |
|
|
|
nm |
|
|
|
8,763 |
|
|
|
19,680 |
|
|
|
(55.5 |
%) |
|
|
|
|
|
|
|
|
|
|
|
|
|
|
|
|
|
|
|
|
|
|
|
|
|
|
|
|
|
|
|
|
|
| Operating revenues |
|
|
873,917 |
|
|
|
819,751 |
|
|
|
6.6 |
% |
|
|
760,366 |
|
|
|
14.9 |
% |
|
|
3,203,551 |
|
|
|
3,493,706 |
|
|
|
(8.3 |
%) |
| Interest revenue |
|
|
516,213 |
|
|
|
416,731 |
|
|
|
23.9 |
% |
|
|
505,198 |
|
|
|
2.2 |
% |
|
|
1,955,745 |
|
|
|
1,099,115 |
|
|
|
77.9 |
% |
|
|
|
|
|
|
|
|
|
|
|
|
|
|
|
|
|
|
|
|
|
|
|
|
|
|
|
|
|
|
|
|
|
| Total revenues |
|
|
1,390,130 |
|
|
|
1,236,482 |
|
|
|
12.4 |
% |
|
|
1,265,564 |
|
|
|
9.8 |
% |
|
|
5,159,296 |
|
|
|
4,592,821 |
|
|
|
12.3 |
% |
| Interest expense |
|
|
243,711 |
|
|
|
114,839 |
|
|
|
112.2 |
% |
|
|
220,536 |
|
|
|
10.5 |
% |
|
|
810,338 |
|
|
|
201,331 |
|
|
|
302.5 |
% |
|
|
|
|
|
|
|
|
|
|
|
|
|
|
|
|
|
|
|
|
|
|
|
|
|
|
|
|
|
|
|
|
|
| Net revenues |
|
|
1,146,419 |
|
|
|
1,121,643 |
|
|
|
2.2 |
% |
|
|
1,045,028 |
|
|
|
9.7 |
% |
|
|
4,348,958 |
|
|
|
4,391,490 |
|
|
|
(1.0 |
%) |
|
|
|
|
|
|
|
|
|
|
|
|
|
|
|
|
|
|
|
|
|
|
|
|
|
|
|
|
|
|
|
|
|
| Non-interest expenses: |
|
|
|
|
|
|
|
|
|
|
|
|
|
|
|
|
|
|
|
|
|
|
|
|
|
|
|
|
|
|
|
|
| Compensation and benefits |
|
|
665,234 |
|
|
|
633,392 |
|
|
|
5.0 |
% |
|
|
606,116 |
|
|
|
9.8 |
% |
|
|
2,522,431 |
|
|
|
2,547,118 |
|
|
|
(1.0 |
%) |
| Occupancy and equipment rental |
|
|
88,127 |
|
|
|
80,555 |
|
|
|
9.4 |
% |
|
|
84,342 |
|
|
|
4.5 |
% |
|
|
339,087 |
|
|
|
312,590 |
|
|
|
8.5 |
% |
| Communication and office supplies |
|
|
47,328 |
|
|
|
45,203 |
|
|
|
4.7 |
% |
|
|
46,215 |
|
|
|
2.4 |
% |
|
|
184,642 |
|
|
|
175,066 |
|
|
|
5.5 |
% |
| Commissions and floor brokerage |
|
|
15,379 |
|
|
|
13,183 |
|
|
|
16.7 |
% |
|
|
14,413 |
|
|
|
6.7 |
% |
|
|
58,344 |
|
|
|
57,752 |
|
|
|
1.0 |
% |
| Provision for credit losses |
|
|
2,263 |
|
|
|
6,028 |
|
|
|
(62.5 |
%) |
|
|
9,992 |
|
|
|
(77.4 |
%) |
|
|
24,999 |
|
|
|
33,506 |
|
|
|
(25.4 |
%) |
| Other operating expenses |
|
|
105,172 |
|
|
|
86,088 |
|
|
|
22.2 |
% |
|
|
160,750 |
|
|
|
(34.6 |
%) |
|
|
449,541 |
|
|
|
313,243 |
|
|
|
43.5 |
% |
|
|
|
|
|
|
|
|
|
|
|
|
|
|
|
|
|
|
|
|
|
|
|
|
|
|
|
|
|
|
|
|
|
| Total non-interest expenses |
|
|
923,503 |
|
|
|
864,449 |
|
|
|
6.8 |
% |
|
|
921,828 |
|
|
|
0.2 |
% |
|
|
3,579,044 |
|
|
|
3,439,275 |
|
|
|
4.1 |
% |
| Income before income taxes |
|
|
222,916 |
|
|
|
257,194 |
|
|
|
(13.3 |
%) |
|
|
123,200 |
|
|
|
80.9 |
% |
|
|
769,914 |
|
|
|
952,215 |
|
|
|
(19.1 |
%) |
| Provision for income taxes |
|
|
47,009 |
|
|
|
62,999 |
|
|
|
(25.4 |
%) |
|
|
46,466 |
|
|
|
1.2 |
% |
|
|
201,109 |
|
|
|
239,863 |
|
|
|
(16.2 |
%) |
|
|
|
|
|
|
|
|
|
|
|
|
|
|
|
|
|
|
|
|
|
|
|
|
|
|
|
|
|
|
|
|
|
| Net income |
|
|
175,907 |
|
|
|
194,195 |
|
|
|
(9.4 |
%) |
|
|
76,734 |
|
|
|
129.2 |
% |
|
|
568,805 |
|
|
|
712,352 |
|
|
|
(20.2 |
%) |
| Preferred dividends |
|
|
9,320 |
|
|
|
9,320 |
|
|
|
0.0 |
% |
|
|
9,321 |
|
|
|
(0.0 |
%) |
|
|
37,281 |
|
|
|
37,281 |
|
|
|
0.0 |
% |
|
|
|
|
|
|
|
|
|
|
|
|
|
|
|
|
|
|
|
|
|
|
|
|
|
|
|
|
|
|
|
|
|
| Net income available to common shareholders |
|
$ |
166,587 |
|
|
$ |
184,875 |
|
|
|
(9.9 |
%) |
|
$ |
67,413 |
|
|
|
147.1 |
% |
|
$ |
531,524 |
|
|
$ |
675,071 |
|
|
|
(21.3 |
%) |
|
|
|
|
|
|
|
|
|
|
|
|
|
|
|
|
|
|
|
|
|
|
|
|
|
|
|
|
|
|
|
|
|
| Earnings per common share: |
|
|
|
|
|
|
|
|
|
|
|
|
|
|
|
|
|
|
|
|
|
|
|
|
|
|
|
|
|
|
|
|
| Basic |
|
$ |
1.60 |
|
|
$ |
1.71 |
|
|
|
(6.4 |
%) |
|
$ |
0.64 |
|
|
|
150.0 |
% |
|
$ |
4.98 |
|
|
$ |
6.20 |
|
|
|
(19.7 |
%) |
| Diluted |
|
$ |
1.50 |
|
|
$ |
1.58 |
|
|
|
(5.1 |
%) |
|
$ |
0.60 |
|
|
|
150.0 |
% |
|
$ |
4.68 |
|
|
$ |
5.74 |
|
|
|
(18.5 |
%) |
| Weighted average number of common shares outstanding: |
|
|
|
|
|
|
|
|
|
|
|
|
|
|
|
|
|
| Basic |
|
|
103,934 |
|
|
|
108,344 |
|
|
|
(4.1 |
%) |
|
|
106,068 |
|
|
|
(2.0 |
%) |
|
|
106,661 |
|
|
|
108,848 |
|
|
|
(2.0 |
%) |
| Diluted |
|
|
111,330 |
|
|
|
117,223 |
|
|
|
(5.0 |
%) |
|
|
113,195 |
|
|
|
(1.6 |
%) |
|
|
113,453 |
|
|
|
117,540 |
|
|
|
(3.5 |
%) |
| Cash dividends declared per common share |
|
$ |
0.36 |
|
|
$ |
0.30 |
|
|
|
20.0 |
% |
|
$ |
0.36 |
|
|
|
0.0 |
% |
|
$ |
1.44 |
|
|
$ |
1.20 |
|
|
|
20.0 |
% |
|
|
|
| Stifel Financial Corp. Quarterly Financial Supplement | Fourth Quarter and Full Year 2023 Earnings Release |
|
Page 4 of 18 |
Consolidated Financial Summary
|
|
|
|
|
|
|
|
|
|
|
|
|
|
|
|
|
|
|
|
|
|
|
|
|
|
|
|
|
|
|
|
|
| |
|
Three Months Ended |
|
|
Year Ended |
|
| (Unaudited, 000s) |
|
12/31/2023 |
|
|
12/31/2022 |
|
|
% Change |
|
|
9/30/2023 |
|
|
% Change |
|
|
12/31/2023 |
|
|
12/31/2022 |
|
|
% Change |
|
| Net revenues: |
|
|
|
|
|
|
|
|
|
|
|
|
|
|
|
|
|
|
|
|
|
|
|
|
|
|
|
|
|
|
|
|
| Global Wealth Management |
|
$ |
766,028 |
|
|
$ |
744,341 |
|
|
|
2.9 |
% |
|
$ |
768,558 |
|
|
|
(0.3 |
%) |
|
$ |
3,049,962 |
|
|
$ |
2,825,866 |
|
|
|
7.9 |
% |
| Institutional Group |
|
|
359,292 |
|
|
|
353,882 |
|
|
|
1.5 |
% |
|
|
256,888 |
|
|
|
39.9 |
% |
|
|
1,226,317 |
|
|
|
1,536,017 |
|
|
|
(20.2 |
%) |
| Other |
|
|
21,059 |
|
|
|
23,424 |
|
|
|
(10.1 |
%) |
|
|
19,605 |
|
|
|
7.4 |
% |
|
|
72,665 |
|
|
|
29,556 |
|
|
|
145.9 |
% |
|
|
|
|
|
|
|
|
|
|
|
|
|
|
|
|
|
|
|
|
|
|
|
|
|
|
|
|
|
|
|
|
|
| Total net revenues |
|
$ |
1,146,379 |
|
|
$ |
1,121,647 |
|
|
|
2.2 |
% |
|
$ |
1,045,051 |
|
|
|
9.7 |
% |
|
$ |
4,348,944 |
|
|
$ |
4,391,439 |
|
|
|
(1.0 |
%) |
| Operating expenses: |
|
|
|
|
|
|
|
|
|
|
|
|
|
|
|
|
|
|
|
|
|
|
|
|
|
|
|
|
|
|
|
|
| Global Wealth Management |
|
$ |
464,668 |
|
|
$ |
427,270 |
|
|
|
8.8 |
% |
|
$ |
470,109 |
|
|
|
(1.2 |
%) |
|
$ |
1,834,140 |
|
|
$ |
1,758,295 |
|
|
|
4.3 |
% |
| Institutional Group |
|
|
351,521 |
|
|
|
309,370 |
|
|
|
13.6 |
% |
|
|
284,692 |
|
|
|
23.5 |
% |
|
|
1,224,217 |
|
|
|
1,281,885 |
|
|
|
(4.5 |
%) |
| Other |
|
|
124,195 |
|
|
|
151,310 |
|
|
|
(17.9 |
%) |
|
|
180,821 |
|
|
|
(31.3 |
%) |
|
|
583,895 |
|
|
|
466,143 |
|
|
|
25.3 |
% |
|
|
|
|
|
|
|
|
|
|
|
|
|
|
|
|
|
|
|
|
|
|
|
|
|
|
|
|
|
|
|
|
|
| Total operating expenses |
|
$ |
940,384 |
|
|
$ |
887,950 |
|
|
|
5.9 |
% |
|
$ |
935,622 |
|
|
|
0.5 |
% |
|
$ |
3,642,252 |
|
|
$ |
3,506,323 |
|
|
|
3.9 |
% |
| Operating contribution: |
|
|
|
|
|
|
|
|
|
|
|
|
|
|
|
|
|
|
|
|
|
|
|
|
|
|
|
|
|
|
|
|
| Global Wealth Management |
|
$ |
301,360 |
|
|
$ |
317,071 |
|
|
|
(5.0 |
%) |
|
$ |
298,449 |
|
|
|
1.0 |
% |
|
$ |
1,215,822 |
|
|
$ |
1,067,571 |
|
|
|
13.9 |
% |
| Institutional Group |
|
|
7,771 |
|
|
|
44,512 |
|
|
|
(82.5 |
%) |
|
|
(27,804 |
) |
|
|
(127.9 |
%) |
|
|
2,100 |
|
|
|
254,132 |
|
|
|
(99.2 |
%) |
| Other |
|
|
(103,136 |
) |
|
|
(127,886 |
) |
|
|
(19.4 |
%) |
|
|
(161,216 |
) |
|
|
(36.0 |
%) |
|
|
(511,230 |
) |
|
|
(436,587 |
) |
|
|
17.1 |
% |
|
|
|
|
|
|
|
|
|
|
|
|
|
|
|
|
|
|
|
|
|
|
|
|
|
|
|
|
|
|
|
|
|
| Income before income taxes |
|
$ |
205,995 |
|
|
$ |
233,697 |
|
|
|
(11.9 |
%) |
|
$ |
109,429 |
|
|
|
88.2 |
% |
|
$ |
706,692 |
|
|
$ |
885,116 |
|
|
|
(20.2 |
%) |
| Financial ratios: |
|
|
|
|
|
|
|
|
|
|
|
|
|
|
|
|
|
|
|
|
|
|
|
|
|
|
|
|
|
|
|
|
| Compensation and benefits |
|
|
58.8 |
% |
|
|
57.8 |
% |
|
|
100 |
|
|
|
58.7 |
% |
|
|
10 |
|
|
|
58.7 |
% |
|
|
58.9 |
% |
|
|
(20 |
) |
| Non-compensation operating expenses |
|
|
23.2 |
% |
|
|
21.4 |
% |
|
|
180 |
|
|
|
30.8 |
% |
|
|
(760 |
) |
|
|
25.1 |
% |
|
|
20.9 |
% |
|
|
420 |
|
| Income before income taxes |
|
|
18.0 |
% |
|
|
20.8 |
% |
|
|
(280 |
) |
|
|
10.5 |
% |
|
|
750 |
|
|
|
16.2 |
% |
|
|
20.2 |
% |
|
|
(400 |
) |
| Effective tax rate |
|
|
21.1 |
% |
|
|
24.4 |
% |
|
|
(330 |
) |
|
|
37.7 |
% |
|
|
(1,660 |
) |
|
|
26.1 |
% |
|
|
25.2 |
% |
|
|
90 |
|
|
|
|
| Stifel Financial Corp. Quarterly Financial Supplement | Fourth Quarter and Full Year 2023 Earnings Release |
|
Page 5 of 18 |

Consolidated Financial Information and Metrics
|
|
|
|
|
|
|
|
|
|
|
|
|
|
|
|
|
|
|
|
|
| |
|
As of and for the Three Months Ended |
|
| (Unaudited, 000s, except per share data) |
|
12/31/2023 |
|
|
12/31/2022 |
|
|
% Change |
|
|
9/30/2023 |
|
|
% Change |
|
| Financial Information: |
|
|
|
|
|
|
|
|
|
|
|
|
|
|
|
|
|
|
|
|
| Total assets |
|
$ |
37,727,460 |
|
|
$ |
37,196,124 |
|
|
|
1.4 |
% |
|
$ |
37,877,577 |
|
|
|
(0.4 |
%) |
| Total shareholders’ equity |
|
$ |
5,294,431 |
|
|
$ |
5,328,471 |
|
|
|
(0.6 |
%) |
|
$ |
5,242,594 |
|
|
|
1.0 |
% |
| Total common equity |
|
$ |
4,609,431 |
|
|
$ |
4,643,471 |
|
|
|
(0.7 |
%) |
|
$ |
4,557,594 |
|
|
|
1.1 |
% |
| Goodwill and intangible assets |
|
$ |
(1,521,522 |
) |
|
$ |
(1,457,137 |
) |
|
|
4.4 |
% |
|
$ |
(1,526,572 |
) |
|
|
(0.3 |
%) |
| DTL on goodwill and intangible assets |
|
$ |
72,927 |
|
|
$ |
61,225 |
|
|
|
19.1 |
% |
|
$ |
69,187 |
|
|
|
5.4 |
% |
|
|
|
|
|
|
|
|
|
|
|
|
|
|
|
|
|
|
|
|
|
| Tangible common equity |
|
$ |
3,160,836 |
|
|
$ |
3,247,559 |
|
|
|
(2.7 |
%) |
|
$ |
3,100,209 |
|
|
|
2.0 |
% |
| Preferred equity |
|
$ |
685,000 |
|
|
$ |
685,000 |
|
|
|
0.0 |
% |
|
$ |
685,000 |
|
|
|
0.0 |
% |
| Financial Metrics: |
|
|
|
|
|
|
|
|
|
|
|
|
|
|
|
|
|
|
|
|
| Book value per common share (2) |
|
$ |
45.61 |
|
|
$ |
44.08 |
|
|
|
3.5 |
% |
|
$ |
44.20 |
|
|
|
3.2 |
% |
| Tangible book value per common share (2) |
|
$ |
31.28 |
|
|
$ |
30.83 |
|
|
|
1.5 |
% |
|
$ |
30.06 |
|
|
|
4.1 |
% |
| Return on common equity (3) |
|
|
13.4 |
% |
|
|
14.5 |
% |
|
|
|
|
|
|
5.1 |
% |
|
|
|
|
| Non-GAAP return on common equity (1)(3) |
|
|
14.6 |
% |
|
|
16.0 |
% |
|
|
|
|
|
|
5.8 |
% |
|
|
|
|
| Return on tangible common equity (4) |
|
|
19.6 |
% |
|
|
20.7 |
% |
|
|
|
|
|
|
7.4 |
% |
|
|
|
|
| Non-GAAP return on tangible common equity
(1)(4) |
|
|
21.3 |
% |
|
|
22.9 |
% |
|
|
|
|
|
|
8.5 |
% |
|
|
|
|
| Pre-tax margin on net revenues |
|
|
18.0 |
% |
|
|
20.8 |
% |
|
|
|
|
|
|
10.5 |
% |
|
|
|
|
| Non-GAAP
pre-tax margin on net revenues (1) |
|
|
19.4 |
% |
|
|
22.9 |
% |
|
|
|
|
|
|
11.8 |
% |
|
|
|
|
| Effective tax rate |
|
|
21.1 |
% |
|
|
24.4 |
% |
|
|
|
|
|
|
37.7 |
% |
|
|
|
|
| Non-GAAP effective tax rate (1) |
|
|
21.1 |
% |
|
|
24.5 |
% |
|
|
|
|
|
|
37.7 |
% |
|
|
|
|
|
|
|
| Stifel Financial Corp. Quarterly Financial Supplement | Fourth Quarter and Full Year 2023 Earnings Release |
|
Page 6 of 18 |
Regulatory Capital
|
|
|
|
|
|
|
|
|
|
|
|
|
|
|
|
|
|
|
|
|
| |
|
As of and for the Three Months Ended |
|
| (Unaudited, 000s) |
|
12/31/2023 |
|
|
12/31/2022 |
|
|
% Change |
|
|
9/30/2023 |
|
|
% Change |
|
| SF Regulatory Capital (5): |
|
|
|
|
|
|
|
|
|
|
|
|
|
|
|
|
|
|
|
|
| Common equity tier 1 capital |
|
$ |
3,230,965 |
|
|
$ |
3,363,138 |
|
|
|
(3.9 |
%) |
|
$ |
3,228,952 |
|
|
|
0.1 |
% |
| Tier 1 capital |
|
$ |
3,915,965 |
|
|
$ |
4,048,138 |
|
|
|
(3.3 |
%) |
|
$ |
3,913,952 |
|
|
|
0.1 |
% |
| Risk-weighted assets |
|
$ |
22,737,914 |
|
|
$ |
23,026,900 |
|
|
|
(1.3 |
%) |
|
$ |
23,218,858 |
|
|
|
(2.1 |
%) |
| Common equity tier 1 capital ratio |
|
|
14.2 |
% |
|
|
14.6 |
% |
|
|
|
|
|
|
13.9 |
% |
|
|
|
|
| Tier 1 risk based capital ratio |
|
|
17.2 |
% |
|
|
17.6 |
% |
|
|
|
|
|
|
16.9 |
% |
|
|
|
|
| Tier 1 leverage capital ratio |
|
|
10.5 |
% |
|
|
11.1 |
% |
|
|
|
|
|
|
10.8 |
% |
|
|
|
|
| Stifel Bank & Trust Regulatory Capital (5): |
|
|
|
|
|
|
|
|
|
|
|
|
|
|
|
|
|
|
|
|
| Common equity tier 1 capital |
|
$ |
1,344,589 |
|
|
$ |
1,620,995 |
|
|
|
(17.1 |
%) |
|
$ |
1,489,819 |
|
|
|
(9.7 |
%) |
| Tier 1 capital |
|
$ |
1,344,589 |
|
|
$ |
1,620,995 |
|
|
|
(17.1 |
%) |
|
$ |
1,489,819 |
|
|
|
(9.7 |
%) |
| Risk-weighted assets |
|
$ |
11,349,836 |
|
|
$ |
14,680,996 |
|
|
|
(22.7 |
%) |
|
$ |
13,782,746 |
|
|
|
(17.7 |
%) |
| Common equity tier 1 capital ratio |
|
|
11.8 |
% |
|
|
11.0 |
% |
|
|
|
|
|
|
10.8 |
% |
|
|
|
|
| Tier 1 risk based capital ratio |
|
|
11.8 |
% |
|
|
11.0 |
% |
|
|
|
|
|
|
10.8 |
% |
|
|
|
|
| Tier 1 leverage capital ratio |
|
|
7.3 |
% |
|
|
7.2 |
% |
|
|
|
|
|
|
7.7 |
% |
|
|
|
|
| Stifel Bank Regulatory Capital (5): |
|
|
|
|
|
|
|
|
|
|
|
|
|
|
|
|
|
|
|
|
| Common equity tier 1 capital |
|
$ |
788,811 |
|
|
$ |
468,437 |
|
|
|
68.4 |
% |
|
$ |
690,456 |
|
|
|
14.2 |
% |
| Tier 1 capital |
|
$ |
788,811 |
|
|
$ |
468,437 |
|
|
|
68.4 |
% |
|
$ |
690,456 |
|
|
|
14.2 |
% |
| Risk-weighted assets |
|
$ |
6,622,892 |
|
|
$ |
4,229,316 |
|
|
|
56.6 |
% |
|
$ |
4,724,176 |
|
|
|
40.2 |
% |
| Common equity tier 1 capital ratio |
|
|
11.9 |
% |
|
|
11.1 |
% |
|
|
|
|
|
|
14.6 |
% |
|
|
|
|
| Tier 1 risk based capital ratio |
|
|
11.9 |
% |
|
|
11.1 |
% |
|
|
|
|
|
|
14.6 |
% |
|
|
|
|
| Tier 1 leverage capital ratio |
|
|
7.2 |
% |
|
|
7.1 |
% |
|
|
|
|
|
|
7.1 |
% |
|
|
|
|
| Stifel Net Capital (5): |
|
|
|
|
|
|
|
|
|
|
|
|
|
|
|
|
|
|
|
|
| Net capital |
|
$ |
457,900 |
|
|
$ |
538,600 |
|
|
|
(15.0 |
%) |
|
$ |
395,400 |
|
|
|
15.8 |
% |
| Excess net capital |
|
$ |
435,900 |
|
|
$ |
516,300 |
|
|
|
(15.6 |
%) |
|
$ |
373,800 |
|
|
|
16.6 |
% |
|
|
|
| Stifel Financial Corp. Quarterly Financial Supplement | Fourth Quarter and Full Year 2023 Earnings Release |
|
Page 7 of 18 |
Global Wealth Management - Summary Results of Operations
|
|
|
|
|
|
|
|
|
|
|
|
|
|
|
|
|
|
|
|
|
|
|
|
|
|
|
|
|
|
|
|
|
| |
|
Three Months Ended |
|
|
Year Ended |
|
| (Unaudited, 000s) |
|
12/31/2023 |
|
|
12/31/2022 |
|
|
% Change |
|
|
9/30/2023 |
|
|
% Change |
|
|
12/31/2023 |
|
|
12/31/2022 |
|
|
% Change |
|
| Revenues: |
|
|
|
|
|
|
|
|
|
|
|
|
|
|
|
|
|
|
|
|
|
|
|
|
|
|
|
|
|
|
|
|
| Commissions |
|
$ |
112,622 |
|
|
$ |
112,644 |
|
|
|
(0.0 |
%) |
|
$ |
112,300 |
|
|
|
0.3 |
% |
|
$ |
444,949 |
|
|
$ |
473,638 |
|
|
|
(6.1 |
%) |
| Principal transactions |
|
|
56,849 |
|
|
|
52,913 |
|
|
|
7.4 |
% |
|
|
53,247 |
|
|
|
6.8 |
% |
|
|
209,282 |
|
|
|
195,274 |
|
|
|
7.2 |
% |
|
|
|
|
|
|
|
|
|
|
|
|
|
|
|
|
|
|
|
|
|
|
|
|
|
|
|
|
|
|
|
|
|
| Transactional revenues |
|
|
169,471 |
|
|
|
165,557 |
|
|
|
2.4 |
% |
|
|
165,547 |
|
|
|
2.4 |
% |
|
|
654,231 |
|
|
|
668,912 |
|
|
|
(2.2 |
%) |
| Asset management |
|
|
330,498 |
|
|
|
289,445 |
|
|
|
14.2 |
% |
|
|
333,088 |
|
|
|
(0.8 |
%) |
|
|
1,299,361 |
|
|
|
1,262,841 |
|
|
|
2.9 |
% |
| Net interest |
|
|
257,920 |
|
|
|
284,998 |
|
|
|
(9.5 |
%) |
|
|
269,431 |
|
|
|
(4.3 |
%) |
|
|
1,086,628 |
|
|
|
879,780 |
|
|
|
23.5 |
% |
| Investment banking (6) |
|
|
4,562 |
|
|
|
4,814 |
|
|
|
(5.2 |
%) |
|
|
3,895 |
|
|
|
17.1 |
% |
|
|
16,680 |
|
|
|
19,515 |
|
|
|
(14.5 |
%) |
| Other income |
|
|
3,577 |
|
|
|
(473 |
) |
|
|
856.2 |
% |
|
|
(3,403 |
) |
|
|
205.1 |
% |
|
|
(6,938 |
) |
|
|
(5,182 |
) |
|
|
(33.9 |
%) |
|
|
|
|
|
|
|
|
|
|
|
|
|
|
|
|
|
|
|
|
|
|
|
|
|
|
|
|
|
|
|
|
|
| Net revenues |
|
|
766,028 |
|
|
|
744,341 |
|
|
|
2.9 |
% |
|
|
768,558 |
|
|
|
(0.3 |
%) |
|
|
3,049,962 |
|
|
|
2,825,866 |
|
|
|
7.9 |
% |
| Non-interest expenses: |
|
|
|
|
|
|
|
|
|
|
|
|
|
|
|
|
|
|
|
|
|
|
|
|
|
|
|
|
|
|
|
|
| Compensation and benefits |
|
|
359,376 |
|
|
|
328,099 |
|
|
|
9.5 |
% |
|
|
359,325 |
|
|
|
0.0 |
% |
|
|
1,415,210 |
|
|
|
1,368,576 |
|
|
|
3.4 |
% |
| Non-compensation operating expenses |
|
|
105,292 |
|
|
|
99,171 |
|
|
|
6.2 |
% |
|
|
110,784 |
|
|
|
(5.0 |
%) |
|
|
418,930 |
|
|
|
389,719 |
|
|
|
7.5 |
% |
|
|
|
|
|
|
|
|
|
|
|
|
|
|
|
|
|
|
|
|
|
|
|
|
|
|
|
|
|
|
|
|
|
| Total non-interest expenses |
|
|
464,668 |
|
|
|
427,270 |
|
|
|
8.8 |
% |
|
|
470,109 |
|
|
|
(1.2 |
%) |
|
|
1,834,140 |
|
|
|
1,758,295 |
|
|
|
4.3 |
% |
|
|
|
|
|
|
|
|
|
|
|
|
|
|
|
|
|
|
|
|
|
|
|
|
|
|
|
|
|
|
|
|
|
| Income before income taxes |
|
$ |
301,360 |
|
|
$ |
317,071 |
|
|
|
(5.0 |
%) |
|
$ |
298,449 |
|
|
|
1.0 |
% |
|
$ |
1,215,822 |
|
|
$ |
1,067,571 |
|
|
|
13.9 |
% |
|
|
|
|
|
|
|
|
|
|
|
|
|
|
|
|
|
|
|
|
|
|
|
|
|
|
|
|
|
|
|
|
|
| As a percentage of net revenues: |
|
|
|
|
|
|
|
|
|
|
|
|
|
|
|
|
|
|
|
|
|
|
|
|
|
|
|
|
|
|
|
|
| Compensation and benefits |
|
|
46.9 |
% |
|
|
44.1 |
% |
|
|
280 |
|
|
|
46.8 |
% |
|
|
10 |
|
|
|
46.4 |
% |
|
|
48.4 |
% |
|
|
(200 |
) |
| Non-compensation operating expenses |
|
|
13.8 |
% |
|
|
13.3 |
% |
|
|
50 |
|
|
|
14.4 |
% |
|
|
(60 |
) |
|
|
13.7 |
% |
|
|
13.8 |
% |
|
|
(10 |
) |
| Income before income taxes |
|
|
39.3 |
% |
|
|
42.6 |
% |
|
|
(330 |
) |
|
|
38.8 |
% |
|
|
50 |
|
|
|
39.9 |
% |
|
|
37.8 |
% |
|
|
210 |
|
|
|
|
| Stifel Financial Corp. Quarterly Financial Supplement | Fourth Quarter and Full Year 2023 Earnings Release |
|
Page 8 of 18 |
Global Wealth Management - Statistical Information
|
|
|
|
|
|
|
|
|
|
|
|
|
|
|
|
|
|
|
|
|
| |
|
As of and for the Three Months Ended |
|
| (Unaudited, 000s, except financial advisors) |
|
12/31/2023 |
|
|
12/31/2022 |
|
|
% Change |
|
|
9/30/2023 |
|
|
% Change |
|
| Financial advisors (including independent contractors) (7) |
|
|
2,386 |
|
|
|
2,344 |
|
|
|
1.8 |
% |
|
|
2,374 |
|
|
|
0.5 |
% |
| Total client assets |
|
$ |
444,318,000 |
|
|
$ |
389,818,000 |
|
|
|
14.0 |
% |
|
$ |
412,458,000 |
|
|
|
7.7 |
% |
| Fee-based client assets |
|
$ |
165,301,000 |
|
|
$ |
144,952,000 |
|
|
|
14.0 |
% |
|
$ |
150,982,000 |
|
|
|
9.5 |
% |
| Transactional assets |
|
$ |
279,017,000 |
|
|
$ |
244,866,000 |
|
|
|
13.9 |
% |
|
$ |
261,476,000 |
|
|
|
6.7 |
% |
| Secured client lending (8) |
|
$ |
3,064,000 |
|
|
$ |
3,576,000 |
|
|
|
(14.3 |
%) |
|
$ |
3,083,000 |
|
|
|
(0.6 |
%) |
| Asset Management Revenue (000s): |
|
|
|
|
|
|
|
|
|
|
|
|
|
|
|
|
|
|
|
|
| Private Client Group (9) |
|
$ |
275,405 |
|
|
$ |
240,446 |
|
|
|
14.5 |
% |
|
$ |
279,807 |
|
|
|
(1.6 |
%) |
| Asset Management |
|
|
33,938 |
|
|
|
30,690 |
|
|
|
10.6 |
% |
|
|
33,211 |
|
|
|
2.2 |
% |
| Third-party Bank Sweep Program |
|
|
8,821 |
|
|
|
5,522 |
|
|
|
59.7 |
% |
|
|
7,023 |
|
|
|
25.6 |
% |
| Other (10) |
|
|
12,372 |
|
|
|
12,804 |
|
|
|
(3.4 |
%) |
|
|
13,086 |
|
|
|
(5.5 |
%) |
|
|
|
|
|
|
|
|
|
|
|
|
|
|
|
|
|
|
|
|
|
| Total asset management revenues |
|
$ |
330,536 |
|
|
$ |
289,462 |
|
|
|
14.2 |
% |
|
$ |
333,127 |
|
|
|
(0.8 |
%) |
| Fee-based Assets (millions): |
|
|
|
|
|
|
|
|
|
|
|
|
|
|
|
|
|
|
|
|
| Private Client Group (9) |
|
$ |
145,513 |
|
|
$ |
126,043 |
|
|
|
15.4 |
% |
|
$ |
132,712 |
|
|
|
9.6 |
% |
| Asset Management |
|
|
36,085 |
|
|
|
32,233 |
|
|
|
12.0 |
% |
|
|
33,519 |
|
|
|
7.7 |
% |
| Elimination (11) |
|
|
(16,297 |
) |
|
|
(13,324 |
) |
|
|
22.3 |
% |
|
|
(15,249 |
) |
|
|
6.9 |
% |
|
|
|
|
|
|
|
|
|
|
|
|
|
|
|
|
|
|
|
|
|
| Total fee-based assets |
|
$ |
165,301 |
|
|
$ |
144,952 |
|
|
|
14.0 |
% |
|
$ |
150,982 |
|
|
|
9.5 |
% |
| Third-party Bank Sweep Program |
|
$ |
2,044 |
|
|
$ |
1,984 |
|
|
|
3.0 |
% |
|
$ |
578 |
|
|
|
253.6 |
% |
| ROA (bps) (12): |
|
|
|
|
|
|
|
|
|
|
|
|
|
|
|
|
|
|
|
|
| Private Client Group (9) |
|
|
83.0 |
|
|
|
80.9 |
|
|
|
|
|
|
|
82.5 |
|
|
|
|
|
| Asset Management |
|
|
37.6 |
|
|
|
38.1 |
|
|
|
|
|
|
|
39.6 |
|
|
|
|
|
| Third-party Bank Sweep Program |
|
|
451.2 |
|
|
|
137.2 |
|
|
|
|
|
|
|
429.7 |
|
|
|
|
|
| Stifel Bancorp Deposits (millions): |
|
|
|
|
|
|
|
|
|
|
|
|
|
|
|
|
|
|
|
|
| Sweep Deposits |
|
$ |
9,642 |
|
|
$ |
16,628 |
|
|
|
(42.0 |
%) |
|
$ |
11,142 |
|
|
|
(13.5 |
%) |
| Smart Rate Deposits |
|
|
14,465 |
|
|
|
8,710 |
|
|
|
66.1 |
% |
|
|
13,605 |
|
|
|
6.3 |
% |
| Direct Wealth Management Deposits at Stifel Bancorp |
|
|
402 |
|
|
|
43 |
|
|
|
nm |
|
|
|
397 |
|
|
|
1.3 |
% |
|
|
|
|
|
|
|
|
|
|
|
|
|
|
|
|
|
|
|
|
|
| Total Stifel Bancorp Wealth Management Deposits |
|
|
24,509 |
|
|
|
25,381 |
|
|
|
(3.4 |
%) |
|
|
25,144 |
|
|
|
(2.5 |
%) |
| Other Bank Deposits |
|
|
2,826 |
|
|
|
1,736 |
|
|
|
62.8 |
% |
|
|
2,450 |
|
|
|
15.3 |
% |
|
|
|
|
|
|
|
|
|
|
|
|
|
|
|
|
|
|
|
|
|
| Total Stifel Bancorp Deposits |
|
$ |
27,335 |
|
|
$ |
27,117 |
|
|
|
0.8 |
% |
|
$ |
27,594 |
|
|
|
(0.9 |
%) |
|
|
|
|
|
|
|
|
|
|
|
|
|
|
|
|
|
|
|
|
|
| Short-term Treasuries (millions) (13) |
|
$ |
7,855 |
|
|
$ |
4,431 |
|
|
|
77.3 |
% |
|
$ |
7,586 |
|
|
|
3.5 |
% |
| Wealth Management Cash (millions): |
|
|
|
|
|
|
|
|
|
|
|
|
|
|
|
|
|
|
|
|
| Stifel Bancorp Wealth Management Deposits |
|
$ |
24,509 |
|
|
$ |
25,381 |
|
|
|
(3.4 |
%) |
|
$ |
25,144 |
|
|
|
(2.5 |
%) |
| Third-party Bank Sweep Program |
|
|
2,044 |
|
|
|
1,984 |
|
|
|
3.0 |
% |
|
|
578 |
|
|
|
253.6 |
% |
| Other Sweep Cash |
|
|
324 |
|
|
|
187 |
|
|
|
73.3 |
% |
|
|
173 |
|
|
|
87.3 |
% |
| Money Market Mutual Funds |
|
|
9,374 |
|
|
|
6,529 |
|
|
|
43.6 |
% |
|
|
8,760 |
|
|
|
7.0 |
% |
|
|
|
|
|
|
|
|
|
|
|
|
|
|
|
|
|
|
|
|
|
| Total Wealth Management Cash |
|
$ |
36,251 |
|
|
$ |
34,081 |
|
|
|
6.4 |
% |
|
$ |
34,655 |
|
|
|
4.6 |
% |
|
|
|
|
|
|
|
|
|
|
|
|
|
|
|
|
|
|
|
|
|
|
|
|
| Stifel Financial Corp. Quarterly Financial Supplement | Fourth Quarter and Full Year 2023 Earnings Release |
|
Page 9 of 18 |
Institutional Group - Summary Results of Operations
|
|
|
|
|
|
|
|
|
|
|
|
|
|
|
|
|
|
|
|
|
|
|
|
|
|
|
|
|
|
|
|
|
| |
|
Three Months Ended |
|
|
Year Ended |
|
| (Unaudited, 000s) |
|
12/31/2023 |
|
|
12/31/2022 |
|
|
% Change |
|
|
9/30/2023 |
|
|
% Change |
|
|
12/31/2023 |
|
|
12/31/2022 |
|
|
% Change |
|
| Revenues: |
|
|
|
|
|
|
|
|
|
|
|
|
|
|
|
|
|
|
|
|
|
|
|
|
|
|
|
|
|
|
|
|
| Commissions |
|
$ |
60,992 |
|
|
$ |
56,301 |
|
|
|
8.3 |
% |
|
$ |
52,775 |
|
|
|
15.6 |
% |
|
$ |
228,648 |
|
|
$ |
236,951 |
|
|
|
(3.5 |
%) |
| Principal transactions |
|
|
97,528 |
|
|
|
72,869 |
|
|
|
33.8 |
% |
|
|
61,594 |
|
|
|
58.3 |
% |
|
|
281,158 |
|
|
|
333,759 |
|
|
|
(15.8 |
%) |
|
|
|
|
|
|
|
|
|
|
|
|
|
|
|
|
|
|
|
|
|
|
|
|
|
|
|
|
|
|
|
|
|
| Transactional revenues |
|
|
158,520 |
|
|
|
129,170 |
|
|
|
22.7 |
% |
|
|
114,369 |
|
|
|
38.6 |
% |
|
|
509,806 |
|
|
|
570,710 |
|
|
|
(10.7 |
%) |
| Capital raising |
|
|
71,724 |
|
|
|
51,956 |
|
|
|
38.0 |
% |
|
|
45,719 |
|
|
|
56.9 |
% |
|
|
248,987 |
|
|
|
237,347 |
|
|
|
4.9 |
% |
| Advisory |
|
|
129,378 |
|
|
|
166,935 |
|
|
|
(22.5 |
%) |
|
|
97,272 |
|
|
|
33.0 |
% |
|
|
465,588 |
|
|
|
714,623 |
|
|
|
(34.8 |
%) |
|
|
|
|
|
|
|
|
|
|
|
|
|
|
|
|
|
|
|
|
|
|
|
|
|
|
|
|
|
|
|
|
|
| Investment banking |
|
|
201,102 |
|
|
|
218,891 |
|
|
|
(8.1 |
%) |
|
|
142,991 |
|
|
|
40.6 |
% |
|
|
714,575 |
|
|
|
951,970 |
|
|
|
(24.9 |
%) |
| Other income (14) |
|
|
(330 |
) |
|
|
5,821 |
|
|
|
(105.7 |
%) |
|
|
(472 |
) |
|
|
30.1 |
% |
|
|
1,936 |
|
|
|
13,337 |
|
|
|
(85.5 |
%) |
|
|
|
|
|
|
|
|
|
|
|
|
|
|
|
|
|
|
|
|
|
|
|
|
|
|
|
|
|
|
|
|
|
| Net revenues |
|
|
359,292 |
|
|
|
353,882 |
|
|
|
1.5 |
% |
|
|
256,888 |
|
|
|
39.9 |
% |
|
|
1,226,317 |
|
|
|
1,536,017 |
|
|
|
(20.2 |
%) |
| Non-interest expenses: |
|
|
|
|
|
|
|
|
|
|
|
|
|
|
|
|
|
|
|
|
|
|
|
|
|
|
|
|
|
|
|
|
| Compensation and benefits |
|
|
248,970 |
|
|
|
220,730 |
|
|
|
12.8 |
% |
|
|
192,638 |
|
|
|
29.2 |
% |
|
|
841,671 |
|
|
|
929,606 |
|
|
|
(9.5 |
%) |
| Non-compensation operating expenses |
|
|
102,551 |
|
|
|
88,640 |
|
|
|
15.7 |
% |
|
|
92,054 |
|
|
|
11.4 |
% |
|
|
382,546 |
|
|
|
352,279 |
|
|
|
8.6 |
% |
|
|
|
|
|
|
|
|
|
|
|
|
|
|
|
|
|
|
|
|
|
|
|
|
|
|
|
|
|
|
|
|
|
| Total non-interest expenses |
|
|
351,521 |
|
|
|
309,370 |
|
|
|
13.6 |
% |
|
|
284,692 |
|
|
|
23.5 |
% |
|
|
1,224,217 |
|
|
|
1,281,885 |
|
|
|
(4.5 |
%) |
|
|
|
|
|
|
|
|
|
|
|
|
|
|
|
|
|
|
|
|
|
|
|
|
|
|
|
|
|
|
|
|
|
| Income/(loss) before income taxes |
|
$ |
7,771 |
|
|
$ |
44,512 |
|
|
|
(82.5 |
%) |
|
$ |
(27,804 |
) |
|
|
127.9 |
% |
|
$ |
2,100 |
|
|
$ |
254,132 |
|
|
|
(99.2 |
%) |
|
|
|
|
|
|
|
|
|
|
|
|
|
|
|
|
|
|
|
|
|
|
|
|
|
|
|
|
|
|
|
|
|
| As a percentage of net revenues: |
|
|
|
|
|
|
|
|
|
|
|
|
|
|
|
|
|
|
|
|
|
|
|
|
|
|
|
|
|
|
|
|
| Compensation and benefits |
|
|
69.3 |
% |
|
|
62.4 |
% |
|
|
690 |
|
|
|
75.0 |
% |
|
|
(570 |
) |
|
|
68.6 |
% |
|
|
60.5 |
% |
|
|
810 |
|
| Non-compensation operating expenses |
|
|
28.5 |
% |
|
|
25.0 |
% |
|
|
350 |
|
|
|
35.8 |
% |
|
|
(730 |
) |
|
|
31.2 |
% |
|
|
23.0 |
% |
|
|
820 |
|
| Income before income taxes |
|
|
2.2 |
% |
|
|
12.6 |
% |
|
|
(1,040 |
) |
|
|
(10.8 |
%) |
|
|
1,300 |
|
|
|
0.2 |
% |
|
|
16.5 |
% |
|
|
(1,630 |
) |
|
|
|
| Stifel Financial Corp. Quarterly Financial Supplement | Fourth Quarter and Full Year 2023 Earnings Release |
|
Page 10 of 18 |
Stifel Bancorp - Financial Information and Credit Metrics
|
|
|
|
|
|
|
|
|
|
|
|
|
|
|
|
|
|
|
|
|
| (Unaudited, 000s) |
|
12/31/2023 |
|
|
12/31/2022 |
|
|
% Change |
|
|
9/30/2023 |
|
|
% Change |
|
| Stifel Bancorp Financial Information: |
|
|
|
|
|
|
|
|
|
|
|
|
|
|
|
|
|
|
|
|
| Total assets |
|
$ |
29,722,320 |
|
|
$ |
29,318,421 |
|
|
|
1.4 |
% |
|
$ |
29,872,977 |
|
|
|
(0.5 |
%) |
| Total shareholder’s equity |
|
$ |
2,154,839 |
|
|
$ |
2,071,882 |
|
|
|
4.0 |
% |
|
$ |
2,162,000 |
|
|
|
(0.3 |
%) |
| Total loans, net (includes loans held for sale) |
|
$ |
19,729,804 |
|
|
$ |
20,622,004 |
|
|
|
(4.3 |
%) |
|
$ |
20,435,170 |
|
|
|
(3.5 |
%) |
| Residential real estate |
|
|
8,047,647 |
|
|
|
7,371,671 |
|
|
|
9.2 |
% |
|
|
7,957,027 |
|
|
|
1.1 |
% |
| Fund banking |
|
|
3,633,126 |
|
|
|
4,182,641 |
|
|
|
(13.1 |
%) |
|
|
4,114,889 |
|
|
|
(11.7 |
%) |
| Commercial and industrial |
|
|
3,566,987 |
|
|
|
4,897,176 |
|
|
|
(27.2 |
%) |
|
|
4,367,671 |
|
|
|
(18.3 |
%) |
| Securities-based loans |
|
|
2,306,455 |
|
|
|
2,724,551 |
|
|
|
(15.3 |
%) |
|
|
2,317,631 |
|
|
|
(0.5 |
%) |
| Construction and land |
|
|
1,034,370 |
|
|
|
593,191 |
|
|
|
74.4 |
% |
|
|
851,709 |
|
|
|
21.4 |
% |
| Commercial real estate |
|
|
660,631 |
|
|
|
675,599 |
|
|
|
(2.2 |
%) |
|
|
670,907 |
|
|
|
(1.5 |
%) |
| Other |
|
|
192,251 |
|
|
|
157,729 |
|
|
|
21.9 |
% |
|
|
172,555 |
|
|
|
11.4 |
% |
| Loans held for sale |
|
|
423,999 |
|
|
|
156,912 |
|
|
|
170.2 |
% |
|
|
142,617 |
|
|
|
197.3 |
% |
| Investment securities |
|
$ |
7,439,109 |
|
|
$ |
7,624,448 |
|
|
|
(2.4 |
%) |
|
$ |
7,411,040 |
|
|
|
0.4 |
% |
| Available-for-sale
securities, at fair value |
|
|
1,551,686 |
|
|
|
1,636,041 |
|
|
|
(5.2 |
%) |
|
|
1,512,233 |
|
|
|
2.6 |
% |
| Held-to-maturity
securities, at amortized cost |
|
|
5,887,423 |
|
|
|
5,988,407 |
|
|
|
(1.7 |
%) |
|
|
5,898,807 |
|
|
|
(0.2 |
%) |
| Unrealized gains/(losses) on
available-for-sale securities |
|
|
(175,943 |
) |
|
|
(227,178 |
) |
|
|
(22.6 |
%) |
|
|
(250,506 |
) |
|
|
(29.8 |
%) |
| Total deposits |
|
$ |
27,334,579 |
|
|
$ |
27,117,111 |
|
|
|
0.8 |
% |
|
$ |
27,594,358 |
|
|
|
(0.9 |
%) |
| Demand deposits (interest-bearing) |
|
|
27,111,072 |
|
|
|
26,805,073 |
|
|
|
1.1 |
% |
|
|
27,335,890 |
|
|
|
(0.8 |
%) |
| Demand deposits (non-interest-bearing) |
|
|
223,505 |
|
|
|
305,138 |
|
|
|
(26.8 |
%) |
|
|
258,466 |
|
|
|
(13.5 |
%) |
| Certificates of deposit |
|
|
2 |
|
|
|
6,900 |
|
|
|
nm |
|
|
|
2 |
|
|
|
0.0 |
% |
|
|
|
|
|
|
| Credit Metrics: |
|
|
|
|
|
|
|
|
|
|
|
|
|
|
|
|
|
|
|
|
| Allowance for credit losses |
|
$ |
161,605 |
|
|
$ |
147,853 |
|
|
|
9.3 |
% |
|
$ |
169,822 |
|
|
|
(4.8 |
%) |
| Allowance as a percentage of retained loans |
|
|
0.83 |
% |
|
|
0.72 |
% |
|
|
|
|
|
|
0.83 |
% |
|
|
|
|
| Net charge-offs as a percentage of average loans |
|
|
0.04 |
% |
|
|
0.00 |
% |
|
|
|
|
|
|
0.00 |
% |
|
|
|
|
| Total nonperforming assets |
|
$ |
45,456 |
|
|
$ |
10,374 |
|
|
|
338.2 |
% |
|
$ |
50,719 |
|
|
|
(10.4 |
%) |
| Nonperforming assets as a percentage of total assets |
|
|
0.15 |
% |
|
|
0.04 |
% |
|
|
|
|
|
|
0.17 |
% |
|
|
|
|
|
|
|
| Stifel Financial Corp. Quarterly Financial Supplement | Fourth Quarter and Full Year 2023 Earnings Release |
|
Page 11 of 18 |
Stifel Bancorp - Loan and Investment Portfolio
|
|
|
|
|
|
|
|
|
|
|
|
|
|
|
|
|
|
|
| (Unaudited, millions) |
|
12/31/2023 |
|
|
% of Total
Portfolio |
|
|
|
|
|
|
|
|
|
| Loan Portfolio |
|
|
|
|
|
|
|
|
|
Commercial Portfolio by Major Sector |
|
|
|
|
|
|
|
|
| Residential real estate |
|
$ |
8,048 |
|
|
|
31 |
% |
|
Industrials |
|
$ |
881 |
|
|
|
25 |
% |
| Securities-based loans |
|
|
2,306 |
|
|
|
9 |
% |
|
Financials |
|
|
831 |
|
|
|
23 |
% |
| Home equity lines of credit and other |
|
|
192 |
|
|
|
1 |
% |
|
Information technology |
|
|
510 |
|
|
|
14 |
% |
|
|
|
|
|
|
|
|
|
|
|
|
|
|
|
|
|
|
|
| Total consumer |
|
|
10,546 |
|
|
|
41 |
% |
|
Consumer discretionary |
|
|
375 |
|
|
|
11 |
% |
|
|
|
|
|
|
|
|
|
|
|
|
|
|
|
|
|
|
|
| Fund banking |
|
|
3,633 |
|
|
|
14 |
% |
|
REITs |
|
|
218 |
|
|
|
6 |
% |
| Commercial and industrial |
|
|
3,567 |
|
|
|
14 |
% |
|
Materials |
|
|
196 |
|
|
|
5 |
% |
| Construction and land |
|
|
1,034 |
|
|
|
4 |
% |
|
Healthcare |
|
|
195 |
|
|
|
5 |
% |
| Commercial real estate |
|
|
661 |
|
|
|
3 |
% |
|
Hotel, leisure, restaurants |
|
|
120 |
|
|
|
3 |
% |
|
|
|
|
|
|
|
|
|
|
|
|
|
|
|
|
|
|
|
| Total commercial |
|
|
8,895 |
|
|
|
35 |
% |
|
Communication services |
|
|
119 |
|
|
|
3 |
% |
|
|
|
|
|
|
|
|
|
|
|
|
|
|
|
|
|
|
|
| Total loan portfolio |
|
|
19,441 |
|
|
|
76 |
% |
|
Consumer staples |
|
|
85 |
|
|
|
2 |
% |
|
|
|
|
|
|
|
|
|
|
|
|
|
|
|
|
|
|
|
| Unfunded commitments |
|
|
6,299 |
|
|
|
24 |
% |
|
|
|
|
|
|
|
|
|
|
|
|
|
|
|
|
|
|
|
|
|
|
|
|
|
|
|
|
|
| Total |
|
$ |
25,740 |
|
|
|
100 |
% |
|
|
|
|
|
|
|
|
|
|
|
|
|
|
|
|
|
|
|
|
|
|
|
|
|
|
|
|
|
|
|
|
|
|
|
|
|
|
|
CLO by Major Sector |
|
|
|
|
|
|
|
|
|
|
|
|
|
|
|
|
|
|
High tech industries |
|
$ |
591 |
|
|
|
10 |
% |
| Investment Portfolio |
|
|
|
|
|
|
|
|
|
Healthcare & pharmaceuticals |
|
|
585 |
|
|
|
10 |
% |
| CLO |
|
$ |
5,854 |
|
|
|
77 |
% |
|
Services: business |
|
|
522 |
|
|
|
9 |
% |
| Agency MBS |
|
|
858 |
|
|
|
11 |
% |
|
Banking, finance, insurance, & real estate |
|
|
518 |
|
|
|
9 |
% |
| Corporate bonds |
|
|
615 |
|
|
|
8 |
% |
|
Media: broadcasting & subscription |
|
|
253 |
|
|
|
4 |
% |
| SBA |
|
|
123 |
|
|
|
2 |
% |
|
Construction & building |
|
|
248 |
|
|
|
4 |
% |
| Student loan ARS |
|
|
92 |
|
|
|
1 |
% |
|
Chemicals, plastics, & rubber |
|
|
244 |
|
|
|
4 |
% |
| CMBS |
|
|
70 |
|
|
|
1 |
% |
|
Services: consumer |
|
|
244 |
|
|
|
4 |
% |
| Other |
|
|
3 |
|
|
|
0 |
% |
|
Telecommunications |
|
|
234 |
|
|
|
4 |
% |
|
|
|
|
|
|
|
|
|
|
|
|
|
|
|
|
|
|
|
| Total Portfolio |
|
$ |
7,615 |
|
|
|
100 |
% |
|
Hotel, gaming, & leisure |
|
|
228 |
|
|
|
4 |
% |
|
|
|
|
|
|
|
|
|
|
|
|
|
|
|
|
|
|
|
|
|
|
| Stifel Financial Corp. Quarterly Financial Supplement | Fourth Quarter and Full Year 2023 Earnings Release |
|
Page 12 of 18 |
Loans and Lending Commitments - Allowance for Credit Losses
|
|
|
|
|
|
|
|
|
|
|
|
|
|
|
|
|
| |
|
December 31, 2023 |
|
|
|
|
|
|
|
| (Unaudited, 000s) |
|
Loans and Lending
Commitments |
|
|
ACL |
|
|
ACL % |
|
|
Q4 Provision |
|
| Residential real estate |
|
$ |
8,047,647 |
|
|
$ |
13,855 |
|
|
|
0.17 |
% |
|
$ |
(752 |
) |
| Fund banking |
|
|
3,633,126 |
|
|
|
10,173 |
|
|
|
0.28 |
% |
|
|
(1,345 |
) |
| Commercial and industrial |
|
|
3,566,987 |
|
|
|
67,077 |
|
|
|
1.88 |
% |
|
|
598 |
|
| Securities-based loans |
|
|
2,306,455 |
|
|
|
3,035 |
|
|
|
0.13 |
% |
|
|
17 |
|
| Construction and land |
|
|
1,034,370 |
|
|
|
11,817 |
|
|
|
1.14 |
% |
|
|
317 |
|
| Commercial real estate |
|
|
660,631 |
|
|
|
21,386 |
|
|
|
3.24 |
% |
|
|
1,521 |
|
| Other |
|
|
192,251 |
|
|
|
949 |
|
|
|
0.49 |
% |
|
|
320 |
|
|
|
|
|
|
|
|
|
|
|
|
|
|
|
|
|
|
| Loans held for investment, gross |
|
|
19,441,467 |
|
|
|
128,292 |
|
|
|
0.66 |
% |
|
|
676 |
|
| Loans held for sale |
|
|
423,999 |
|
|
|
|
|
|
|
|
|
|
|
|
|
|
|
|
|
|
|
|
|
|
|
|
|
|
|
|
|
|
| Total loans, gross |
|
|
19,865,466 |
|
|
|
|
|
|
|
|
|
|
|
|
|
| Lending-related commitments (unfunded) |
|
|
6,298,530 |
|
|
|
33,313 |
|
|
|
0.53 |
% |
|
|
(713 |
) |
|
|
|
|
|
|
|
|
|
|
|
|
|
|
|
|
|
| Loans and lending-related commitments |
|
$ |
26,163,996 |
|
|
$ |
161,605 |
|
|
|
|
|
|
$ |
(37 |
) |
|
|
|
|
|
|
|
|
|
|
|
|
|
|
|
|
|
|
|
|
| Stifel Financial Corp. Quarterly Financial Supplement | Fourth Quarter and Full Year 2023 Earnings Release |
|
Page 13 of 18 |
Consolidated Net Interest Income
|
|
|
|
|
|
|
|
|
|
|
|
|
|
|
|
|
|
|
|
|
|
|
|
|
|
|
|
|
|
|
|
|
|
|
|
|
| |
|
Three Months Ended |
|
| |
|
December 31, 2023 |
|
|
December 31, 2022 |
|
|
September 30, 2023 |
|
| (Unaudited, millions) |
|
Average
balance |
|
|
Interest
income/expense |
|
|
Average
interest
rate |
|
|
Average
balance |
|
|
Interest
income/expense |
|
|
Average
interest
rate |
|
|
Average
balance |
|
|
Interest
income/expense |
|
|
Average
interest
rate |
|
| Interest-earning assets: |
|
|
|
|
|
|
|
|
|
|
|
|
|
|
|
|
|
|
|
|
|
|
|
|
|
|
|
|
|
|
|
|
|
|
|
|
| Cash and federal funds sold |
|
$ |
2,956.9 |
|
|
$ |
40.1 |
|
|
|
5.42 |
% |
|
$ |
1,641.8 |
|
|
$ |
18.3 |
|
|
|
4.45 |
% |
|
$ |
2,595.1 |
|
|
$ |
35.6 |
|
|
|
5.48 |
% |
| Financial instruments owned |
|
|
962.2 |
|
|
|
4.0 |
|
|
|
1.65 |
% |
|
|
906.2 |
|
|
|
7.5 |
|
|
|
3.31 |
% |
|
|
875.6 |
|
|
|
4.4 |
|
|
|
2.01 |
% |
| Margin balances |
|
|
750.0 |
|
|
|
15.3 |
|
|
|
8.14 |
% |
|
|
985.2 |
|
|
|
15.6 |
|
|
|
6.33 |
% |
|
|
768.2 |
|
|
|
15.6 |
|
|
|
8.15 |
% |
| Investments: |
|
|
|
|
|
|
|
|
|
|
|
|
|
|
|
|
|
|
|
|
|
|
|
|
|
|
|
|
|
|
|
|
|
|
|
|
| Asset-backed securities |
|
|
6,079.2 |
|
|
|
112.4 |
|
|
|
7.39 |
% |
|
|
6,216.5 |
|
|
|
86.1 |
|
|
|
5.54 |
% |
|
|
6,130.3 |
|
|
|
111.0 |
|
|
|
7.25 |
% |
| Mortgage-backed securities |
|
|
935.5 |
|
|
|
5.3 |
|
|
|
2.27 |
% |
|
|
1,003.6 |
|
|
|
5.4 |
|
|
|
2.15 |
% |
|
|
957.3 |
|
|
|
5.3 |
|
|
|
2.22 |
% |
| Corporate fixed income securities |
|
|
617.1 |
|
|
|
4.3 |
|
|
|
2.78 |
% |
|
|
646.4 |
|
|
|
4.5 |
|
|
|
2.79 |
% |
|
|
619.5 |
|
|
|
4.3 |
|
|
|
2.77 |
% |
| Other |
|
|
4.7 |
|
|
|
— |
|
|
|
2.55 |
% |
|
|
4.5 |
|
|
|
— |
|
|
|
2.18 |
% |
|
|
4.8 |
|
|
|
0.1 |
|
|
|
2.55 |
% |
|
|
|
|
|
|
|
|
|
|
|
|
|
|
|
|
|
|
|
|
|
|
|
|
|
|
|
|
|
|
|
|
|
|
|
|
|
| Total investments |
|
|
7,636.5 |
|
|
|
122.0 |
|
|
|
6.39 |
% |
|
|
7,871.0 |
|
|
|
96.0 |
|
|
|
4.88 |
% |
|
|
7,711.9 |
|
|
|
120.7 |
|
|
|
6.26 |
% |
| Loans: |
|
|
|
|
|
|
|
|
|
|
|
|
|
|
|
|
|
|
|
|
|
|
|
|
|
|
|
|
|
|
|
|
|
|
|
|
| Residential real estate |
|
|
8,027.0 |
|
|
|
69.4 |
|
|
|
3.46 |
% |
|
|
7,240.6 |
|
|
|
55.7 |
|
|
|
3.08 |
% |
|
|
7,839.4 |
|
|
|
61.7 |
|
|
|
3.15 |
% |
| Commercial and industrial |
|
|
4,073.9 |
|
|
|
90.5 |
|
|
|
8.89 |
% |
|
|
4,997.7 |
|
|
|
84.4 |
|
|
|
6.75 |
% |
|
|
4,372.4 |
|
|
|
96.8 |
|
|
|
8.86 |
% |
| Fund banking |
|
|
4,076.5 |
|
|
|
80.9 |
|
|
|
7.94 |
% |
|
|
4,348.7 |
|
|
|
65.3 |
|
|
|
6.01 |
% |
|
|
4,155.7 |
|
|
|
83.0 |
|
|
|
7.99 |
% |
| Securities-based loans |
|
|
2,318.7 |
|
|
|
42.5 |
|
|
|
7.33 |
% |
|
|
2,735.5 |
|
|
|
40.0 |
|
|
|
5.85 |
% |
|
|
2,342.4 |
|
|
|
42.7 |
|
|
|
7.30 |
% |
| Commercial real estate |
|
|
659.3 |
|
|
|
12.3 |
|
|
|
7.49 |
% |
|
|
805.3 |
|
|
|
12.5 |
|
|
|
6.22 |
% |
|
|
668.0 |
|
|
|
13.4 |
|
|
|
8.00 |
% |
| Construction and land |
|
|
942.8 |
|
|
|
20.2 |
|
|
|
8.57 |
% |
|
|
583.7 |
|
|
|
9.9 |
|
|
|
6.77 |
% |
|
|
820.5 |
|
|
|
17.3 |
|
|
|
8.44 |
% |
| Loans held for sale |
|
|
254.0 |
|
|
|
4.7 |
|
|
|
7.40 |
% |
|
|
168.0 |
|
|
|
2.1 |
|
|
|
5.09 |
% |
|
|
202.2 |
|
|
|
2.6 |
|
|
|
5.06 |
% |
| Other |
|
|
186.9 |
|
|
|
3.7 |
|
|
|
7.90 |
% |
|
|
147.6 |
|
|
|
2.3 |
|
|
|
6.46 |
% |
|
|
162.2 |
|
|
|
3.2 |
|
|
|
7.86 |
% |
|
|
|
|
|
|
|
|
|
|
|
|
|
|
|
|
|
|
|
|
|
|
|
|
|
|
|
|
|
|
|
|
|
|
|
|
|
| Total loans |
|
|
20,539.1 |
|
|
|
324.2 |
|
|
|
6.31 |
% |
|
|
21,027.1 |
|
|
|
272.2 |
|
|
|
5.18 |
% |
|
|
20,562.8 |
|
|
|
320.7 |
|
|
|
6.24 |
% |
| Other interest-bearing assets |
|
|
812.3 |
|
|
|
10.6 |
|
|
|
5.26 |
% |
|
|
770.6 |
|
|
|
7.1 |
|
|
|
3.69 |
% |
|
|
730.9 |
|
|
|
8.2 |
|
|
|
4.49 |
% |
|
|
|
|
|
|
|
|
|
|
|
|
|
|
|
|
|
|
|
|
|
|
|
|
|
|
|
|
|
|
|
|
|
|
|
|
|
| Total interest-bearing assets/ interest income |
|
|
33,657.0 |
|
|
|
516.2 |
|
|
|
6.13 |
% |
|
|
33,201.9 |
|
|
|
416.7 |
|
|
|
5.02 |
% |
|
|
33,244.5 |
|
|
|
505.2 |
|
|
|
6.08 |
% |
| Interest-bearing liabilities: |
|
|
|
|
|
|
|
|
|
|
|
|
|
|
|
|
|
|
|
|
|
|
|
|
|
|
|
|
|
|
|
|
|
|
|
|
| Senior notes |
|
|
1,115.5 |
|
|
|
12.5 |
|
|
|
4.48 |
% |
|
|
1,114.4 |
|
|
|
10.5 |
|
|
|
3.77 |
% |
|
|
1,115.2 |
|
|
|
12.5 |
|
|
|
4.49 |
% |
| Deposits |
|
|
27,457.7 |
|
|
|
218.0 |
|
|
|
3.18 |
% |
|
|
27,267.0 |
|
|
|
98.7 |
|
|
|
1.45 |
% |
|
|
27,247.4 |
|
|
|
198.2 |
|
|
|
2.91 |
% |
| Other interest-bearing liabilities |
|
|
1,384.6 |
|
|
|
13.2 |
|
|
|
3.81 |
% |
|
|
1,303.0 |
|
|
|
5.6 |
|
|
|
1.72 |
% |
|
|
1,218.9 |
|
|
|
9.8 |
|
|
|
3.23 |
% |
|
|
|
|
|
|
|
|
|
|
|
|
|
|
|
|
|
|
|
|
|
|
|
|
|
|
|
|
|
|
|
|
|
|
|
|
|
| Total interest-bearing liabilities/ interest expense |
|
$ |
29,957.8 |
|
|
|
243.7 |
|
|
|
3.25 |
% |
|
$ |
29,684.4 |
|
|
|
114.8 |
|
|
|
1.55 |
% |
|
$ |
29,581.5 |
|
|
|
220.5 |
|
|
|
2.98 |
% |
|
|
|
|
|
|
|
|
|
|
|
|
|
|
|
|
|
|
|
|
|
|
|
|
|
|
|
|
|
|
|
|
|
|
|
|
|
| Net interest income/margin |
|
|
|
|
|
$ |
272.5 |
|
|
|
3.24 |
% |
|
|
|
|
|
$ |
301.9 |
|
|
|
3.64 |
% |
|
|
|
|
|
$ |
284.7 |
|
|
|
3.43 |
% |
|
|
|
|
|
|
|
|
|
|
|
|
|
|
|
|
|
|
|
|
|
|
|
|
|
|
|
|
|
|
|
|
|
|
|
|
|
|
|
|
| Stifel Financial Corp. Quarterly Financial Supplement | Fourth Quarter and Full Year 2023 Earnings Release |
|
Page 14 of 18 |
Stifel Bancorp Net Interest Income
|
|
|
|
|
|
|
|
|
|
|
|
|
|
|
|
|
|
|
|
|
|
|
|
|
|
|
|
|
|
|
|
|
|
|
|
|
| |
|
Three Months Ended |
|
| |
|
December 31, 2023 |
|
|
December 31, 2022 |
|
|
September 30, 2023 |
|
| (Unaudited, millions) |
|
Average
balance |
|
|
Interest
income/expense |
|
|
Average
interest
rate |
|
|
Average
balance |
|
|
Interest
income/expense |
|
|
Average
interest
rate |
|
|
Average
balance |
|
|
Interest
income/expense |
|
|
Average
interest
rate |
|
| Interest-earning assets: |
|
|
|
|
|
|
|
|
|
|
|
|
|
|
|
|
|
|
|
|
|
|
|
|
|
|
|
|
|
|
|
|
|
|
|
|
| Cash and federal funds sold |
|
$ |
1,841.8 |
|
|
$ |
26.4 |
|
|
|
5.73 |
% |
|
$ |
889.4 |
|
|
$ |
9.4 |
|
|
|
4.24 |
% |
|
$ |
1,536.8 |
|
|
$ |
21.9 |
|
|
|
5.70 |
% |
| Investments |
|
|
7,636.5 |
|
|
|
122.0 |
|
|
|
6.39 |
% |
|
|
7,871.0 |
|
|
|
96.0 |
|
|
|
4.88 |
% |
|
|
7,711.9 |
|
|
|
120.7 |
|
|
|
6.26 |
% |
| Loans |
|
|
20,539.1 |
|
|
|
324.2 |
|
|
|
6.31 |
% |
|
|
21,027.1 |
|
|
|
272.2 |
|
|
|
5.18 |
% |
|
|
20,562.8 |
|
|
|
320.7 |
|
|
|
6.24 |
% |
| Other interest-bearing assets |
|
|
64.7 |
|
|
|
0.7 |
|
|
|
4.55 |
% |
|
|
55.1 |
|
|
|
0.7 |
|
|
|
4.56 |
% |
|
|
64.9 |
|
|
|
0.7 |
|
|
|
4.08 |
% |
|
|
|
|
|
|
|
|
|
|
|
|
|
|
|
|
|
|
|
|
|
|
|
|
|
|
|
|
|
|
|
|
|
|
|
|
|
| Total interest-bearing assets/ interest income |
|
$ |
30,082.1 |
|
|
$ |
473.3 |
|
|
|
6.29 |
% |
|
$ |
29,842.6 |
|
|
$ |
378.3 |
|
|
|
5.07 |
% |
|
$ |
29,876.4 |
|
|
$ |
464.0 |
|
|
|
6.21 |
% |
| Interest-bearing liabilities: |
|
|
|
|
|
|
|
|
|
|
|
|
|
|
|
|
|
|
|
|
|
|
|
|
|
|
|
|
|
|
|
|
|
|
|
|
| Deposits |
|
$ |
27,457.7 |
|
|
$ |
218.0 |
|
|
|
3.18 |
% |
|
$ |
27,267.0 |
|
|
$ |
98.7 |
|
|
|
1.45 |
% |
|
$ |
27,247.4 |
|
|
$ |
198.2 |
|
|
|
2.91 |
% |
| Other interest-bearing liabilities |
|
|
73.2 |
|
|
|
1.4 |
|
|
|
7.70 |
% |
|
|
0.9 |
|
|
|
0.1 |
|
|
|
15.64 |
% |
|
|
0.9 |
|
|
|
0.2 |
|
|
|
80.57 |
% |
|
|
|
|
|
|
|
|
|
|
|
|
|
|
|
|
|
|
|
|
|
|
|
|
|
|
|
|
|
|
|
|
|
|
|
|
|
| Total interest-bearing liabilities/ interest expense |
|
$ |
27,530.9 |
|
|
|
219.4 |
|
|
|
3.19 |
% |
|
$ |
27,267.9 |
|
|
|
98.8 |
|
|
|
1.45 |
% |
|
$ |
27,248.3 |
|
|
|
198.4 |
|
|
|
2.91 |
% |
|
|
|
|
|
|
|
|
|
|
|
|
|
|
|
|
|
|
|
|
|
|
|
|
|
|
|
|
|
|
|
|
|
|
|
|
|
| Net interest income/margin |
|
|
|
|
|
$ |
253.9 |
|
|
|
3.38 |
% |
|
|
|
|
|
$ |
279.5 |
|
|
|
3.75 |
% |
|
|
|
|
|
$ |
265.6 |
|
|
|
3.56 |
% |
|
|
|
|
|
|
|
|
|
|
|
|
|
|
|
|
|
|
|
|
|
|
|
|
|
|
|
|
|
|
|
|
|
|
|
|
|
|
|
|
| Stifel Financial Corp. Quarterly Financial Supplement | Fourth Quarter and Full Year 2023 Earnings Release |
|
Page 15 of 18 |
GAAP to Core Reconciliation
|
|
|
|
|
|
|
|
|
|
|
|
|
|
|
|
|
|
|
|
|
|
|
|
|
|
|
|
|
|
|
|
|
| |
|
Three Months Ended |
|
|
Year Ended |
|
| (Unaudited, 000s) |
|
12/31/2023 |
|
|
12/31/2022 |
|
|
Change |
|
|
9/30/2023 |
|
|
Change |
|
|
12/31/2023 |
|
|
12/31/2022 |
|
|
Change |
|
| GAAP net revenues |
|
$ |
1,146,379 |
|
|
$ |
1,121,647 |
|
|
|
|
|
|
$ |
1,045,051 |
|
|
|
|
|
|
$ |
4,348,944 |
|
|
$ |
4,391,439 |
|
|
|
|
|
| Non-GAAP adjustments |
|
|
40 |
|
|
|
(4 |
) |
|
|
|
|
|
|
(23 |
) |
|
|
|
|
|
|
14 |
|
|
|
51 |
|
|
|
|
|
|
|
|
|
|
|
|
|
|
|
|
|
|
|
|
|
|
|
|
|
|
|
|
|
|
|
|
|
|
|
|
|
|
| Non-GAAP net revenues |
|
|
1,146,419 |
|
|
|
1,121,643 |
|
|
|
|
|
|
|
1,045,028 |
|
|
|
|
|
|
|
4,348,958 |
|
|
|
4,391,490 |
|
|
|
|
|
|
|
|
|
|
|
|
|
|
| GAAP compensation and benefits expense |
|
|
674,437 |
|
|
|
647,962 |
|
|
|
|
|
|
|
613,287 |
|
|
|
|
|
|
|
2,554,581 |
|
|
|
2,586,232 |
|
|
|
|
|
| Merger-related (15) |
|
|
(9,203 |
) |
|
|
(14,570 |
) |
|
|
|
|
|
|
(7,171 |
) |
|
|
|
|
|
|
(32,150 |
) |
|
|
(39,114 |
) |
|
|
|
|
|
|
|
|
|
|
|
|
|
|
|
|
|
|
|
|
|
|
|
|
|
|
|
|
|
|
|
|
|
|
|
|
|
| Non-GAAP compensation and benefits expense |
|
|
665,234 |
|
|
|
633,392 |
|
|
|
|
|
|
|
606,116 |
|
|
|
|
|
|
|
2,522,431 |
|
|
|
2,547,118 |
|
|
|
|
|
|
|
|
|
|
|
|
|
|
| GAAP non-compensation operating expenses |
|
|
265,947 |
|
|
|
239,988 |
|
|
|
|
|
|
|
322,335 |
|
|
|
|
|
|
|
1,087,671 |
|
|
|
920,091 |
|
|
|
|
|
| Merger-related (15) |
|
|
(7,678 |
) |
|
|
(8,931 |
) |
|
|
|
|
|
|
(6,623 |
) |
|
|
|
|
|
|
(31,058 |
) |
|
|
(27,934 |
) |
|
|
|
|
|
|
|
|
|
|
|
|
|
|
|
|
|
|
|
|
|
|
|
|
|
|
|
|
|
|
|
|
|
|
|
|
|
| Non-GAAP
non-compensation operating expenses |
|
|
258,269 |
|
|
|
231,057 |
|
|
|
|
|
|
|
315,712 |
|
|
|
|
|
|
|
1,056,613 |
|
|
|
892,157 |
|
|
|
|
|
|
|
|
|
|
|
|
|
|
|
|
|
|
|
|
|
|
|
|
|
|
|
|
|
|
|
|
|
|
|
|
|
|
| Total merger-related adjustments |
|
|
(16,921 |
) |
|
|
(23,497 |
) |
|
|
|
|
|
|
(13,771 |
) |
|
|
|
|
|
|
(63,222 |
) |
|
|
(67,099 |
) |
|
|
|
|
|
|
|
|
|
|
|
|
|
|
|
|
|
|
|
|
|
|
|
|
|
|
|
|
|
|
|
|
|
|
|
|
|
| GAAP provision for income taxes |
|
|
43,511 |
|
|
|
57,076 |
|
|
|
|
|
|
|
41,268 |
|
|
|
|
|
|
|
184,156 |
|
|
|
222,961 |
|
|
|
|
|
| Merger-related and other (15) |
|
|
3,498 |
|
|
|
5,923 |
|
|
|
|
|
|
|
5,198 |
|
|
|
|
|
|
|
16,953 |
|
|
|
16,902 |
|
|
|
|
|
|
|
|
|
|
|
|
|
|
|
|
|
|
|
|
|
|
|
|
|
|
|
|
|
|
|
|
|
|
|
|
|
|
| Non-GAAP provision for income taxes |
|
|
47,009 |
|
|
|
62,999 |
|
|
|
|
|
|
|
46,466 |
|
|
|
|
|
|
|
201,109 |
|
|
|
239,863 |
|
|
|
|
|
|
|
|
|
|
|
|
|
|
| Financial ratios: |
|
|
|
|
|
|
|
|
|
|
|
|
|
|
|
|
|
|
|
|
|
|
|
|
|
|
|
|
|
|
|
|
| Compensation and benefits |
|
|
58.0 |
% |
|
|
56.5 |
% |
|
|
150 |
|
|
|
58.0 |
% |
|
|
— |
|
|
|
58.0 |
% |
|
|
58.0 |
% |
|
|
— |
|
| Non-compensation operating expenses |
|
|
22.6 |
% |
|
|
20.6 |
% |
|
|
200 |
|
|
|
30.2 |
% |
|
|
(760 |
) |
|
|
24.3 |
% |
|
|
20.3 |
% |
|
|
400 |
|
| Income before income taxes |
|
|
19.4 |
% |
|
|
22.9 |
% |
|
|
(350 |
) |
|
|
11.8 |
% |
|
|
760 |
|
|
|
17.7 |
% |
|
|
21.7 |
% |
|
|
(400 |
) |
| Effective tax rate |
|
|
21.1 |
% |
|
|
24.5 |
% |
|
|
(340 |
) |
|
|
37.7 |
% |
|
|
(1,660 |
) |
|
|
26.1 |
% |
|
|
25.2 |
% |
|
|
90 |
|
|
|
|
| Stifel Financial Corp. Quarterly Financial Supplement | Fourth Quarter and Full Year 2023 Earnings Release |
|
Page 16 of 18 |
Footnotes
| (1) |
Please refer to the GAAP to Core Reconciliation for a reconciliation of the Company’s GAAP results to
these non-GAAP measures. |
| (2) |
Book value per common share represents shareholders’ equity (excluding preferred stock) divided by period
end common shares outstanding. Tangible book value per share represents tangible common shareholders’ equity (defined below) divided by period end common shares outstanding. |
| (3) |
Return on average common equity (“ROCE”) is calculated by dividing annualized net income applicable
to common shareholders by average common shareholders’ equity or, in the case of non-GAAP ROCE, calculated by dividing non-GAAP net income applicable to commons
shareholders by average common shareholders’ equity. |
| (4) |
Return on average tangible common equity (“ROTCE”) is calculated by dividing annualized net income
applicable to common shareholders by average tangible common equity or, in the case of non-GAAP ROTCE, calculated by dividing non-GAAP net income applicable to common
shareholders by average tangible common equity. Tangible common equity, also a non-GAAP financial measure, equals total common shareholders’ equity less goodwill and identifiable intangible assets and the
deferred taxes on goodwill and intangible assets. Average deferred taxes on goodwill and intangible assets was $71.1 million, $60.4 million, and $67.4 million, as of December 31, 2023 and 2022, and September 30, 2023,
respectively. |
| (5) |
Regulatory capital amounts and ratios are estimates as of the date of the Company’s earnings release,
January 24, 2024. |
| (6) |
Includes capital raising and advisory revenues. |
| (7) |
Includes independent contractors of 108, 102, and 108 as of December 31, 2023 and 2022, and
September 30, 2023, respectively. |
| (8) |
Includes client margin balances held by the Company’s broker-dealer subsidiaries and securities-based
loans held at the Company’s bank subsidiaries. |
| (9) |
Includes Private Client Group and Trust Business. |
| (10) |
Includes fund networking fees, retirement fees, transaction/handling fees, and ACAT fees.
|
| (11) |
Asset management assets managed in Private Client Group or Trust accounts. |
| (12) |
Return on assets (ROA) is calculated based on prior period-end balances
for Private Client Group, period-end balances for Asset Management, and average daily balances for Individual Program Banks. Prior to Q4 2023, ROA for Individual Program Banks was calculated on average
quarterly balances. Prior periods have not been restated to reflect the change as the differences are immaterial. |
| (13) |
Represents client assets in Treasury Securities with maturities of 52 weeks or less. |
| (14) |
Includes net interest, asset management, and other income. |
| (15) |
Primarily related to charges attributable to integration-related activities, signing bonuses, amortization of
restricted stock awards, debentures, and promissory notes issued as retention, additional earn-out expense, and amortization of intangible assets acquired. These costs were directly related to acquisitions of
certain businesses and are not representative of the costs of running the Company’s on-going business. |
|
|
|
| Stifel Financial Corp. Quarterly Financial Supplement | Fourth Quarter and Full Year 2023 Earnings Release |
|
Page 17 of 18 |
Disclaimer and Legal Notice
Forward-Looking Statements
This presentation may contain “forward-looking statements” within the meaning of the Private Securities Litigation Reform Act of 1995 that involve
significant risks, assumptions, and uncertainties, including statements relating to the market opportunity and future business prospects of Stifel Financial Corp., as well as Stifel, Nicolaus & Company, Incorporated and its subsidiaries
(collectively, “SF” or the “Company”). These statements can be identified by the use of the words “may,” “will,” “should,” “could,” “would,” “plan,”
“potential,” “estimate,” “project,” “believe,” “intend,” “anticipate,” “expect,” and similar expressions.
All statements not dealing with historical results are forward-looking and are based on various assumptions. The forward-looking statements are subject to
risks and uncertainties that could cause actual results to differ materially from those expressed in or implied by the statements. For information about the risks and important factors that could affect the Company’s future results, financial
condition and liquidity, see “Risk Factors” in Part I of the Company’s Annual Report on Form 10-K for the year ended December 31, 2022. Forward-looking statements speak only as to the date
they are made. The Company disclaims any intent or obligation to update forward-looking statements to reflect circumstances or events that occur after the date the forward-looking statements are made.
Use of Non-GAAP Financial Measures
The Company prepares its Consolidated Financial Statements using accounting principles generally accepted in the United States (U.S. GAAP). The Company may
disclose certain “non-GAAP financial measures” in the course of its earnings releases, earnings conference calls, financial presentations and otherwise. The Securities and Exchange Commission defines
a “non-GAAP financial measure” as a numerical measure of historical or future financial performance, financial position, or cash flows that is subject to adjustments that effectively exclude, or
include, amounts from the most directly comparable measure calculated and presented in accordance with U.S. GAAP. Non-GAAP financial measures disclosed by the Company are provided as additional information to
analysts, investors and other stakeholders in order to provide them with greater transparency about, or an alternative method for assessing the Company’s financial condition or operating results. These measures are not in accordance with, or a
substitute for U.S. GAAP, and may be different from or inconsistent with non-GAAP financial measures used by other companies. Whenever the Company refers to a non-GAAP
financial measure, it will also define it or present the most directly comparable financial measure calculated and presented in accordance with U.S. GAAP, along with a reconciliation of the differences between the
non-GAAP financial measure it references and such comparable U.S. GAAP financial measure.
Legal Notice
This Financial Supplement contains financial, statistical, and business-related information, as well as business and segment trends. The information
should be read in conjunction with the Company’s fourth quarter earnings release issued January 24, 2024.
|
|
|
| Stifel Financial Corp. Quarterly Financial Supplement | Fourth Quarter and Full Year 2023 Earnings Release |
|
Page 18 of 18 |
Exhibit 99.3 Fourth Quarter 2024 Financial Results Presentation January
24, 2024 Quarterly Earnings Report
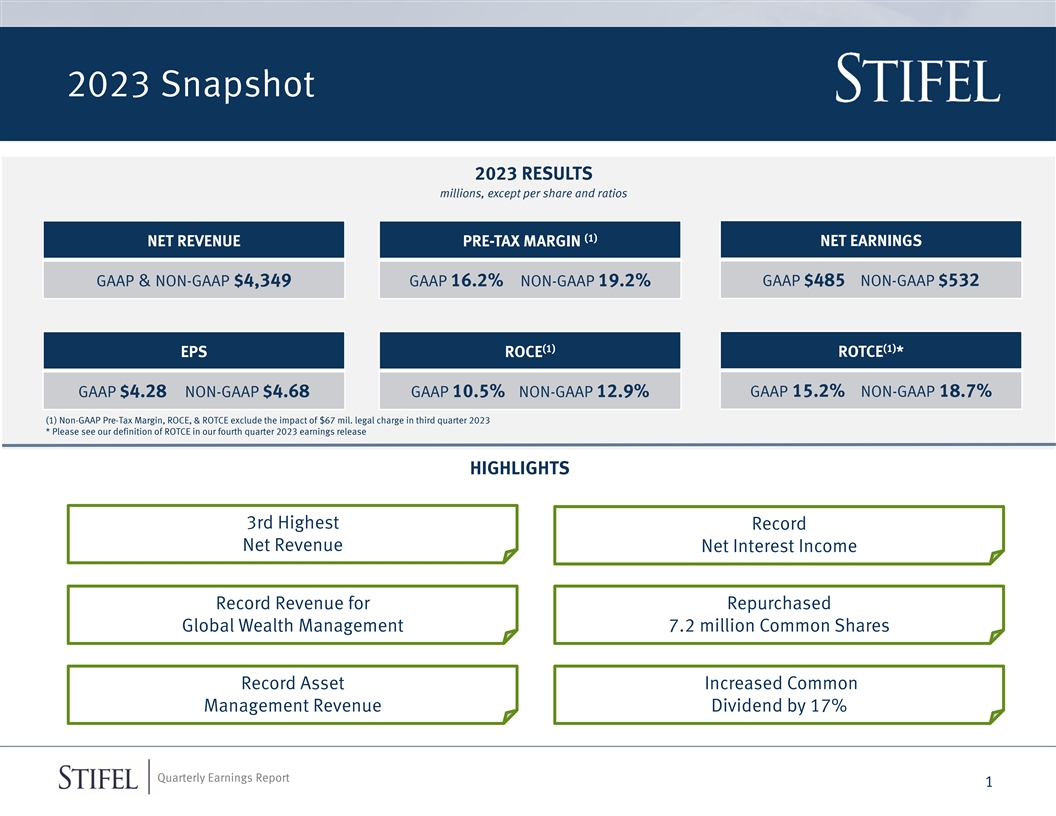
2023 Snapshot 2023 RESULTS millions, except per share and ratios (1) NET
REVENUE PRE-TAX MARGIN NET EARNINGS GAAP & NON-GAAP $4,349 GAAP 16.2% NON-GAAP 19.2% GAAP $485 NON-GAAP $532 (1) (1) EPS ROCE ROTCE * GAAP $4.28 NON-GAAP $4.68 GAAP 10.5% NON-GAAP 12.9% GAAP 15.2% NON-GAAP 18.7% (1) Non-GAAP Pre-Tax Margin,
ROCE, & ROTCE exclude the impact of $67 mil. legal charge in third quarter 2023 * Please see our definition of ROTCE in our fourth quarter 2023 earnings release HIGHLIGHTS 3rd Highest Record Net Revenue Net Interest Income Record Revenue for
Repurchased Global Wealth Management 7.2 million Common Shares Record Asset Increased Common Management Revenue Dividend by 17% Quarterly Earnings Report 1
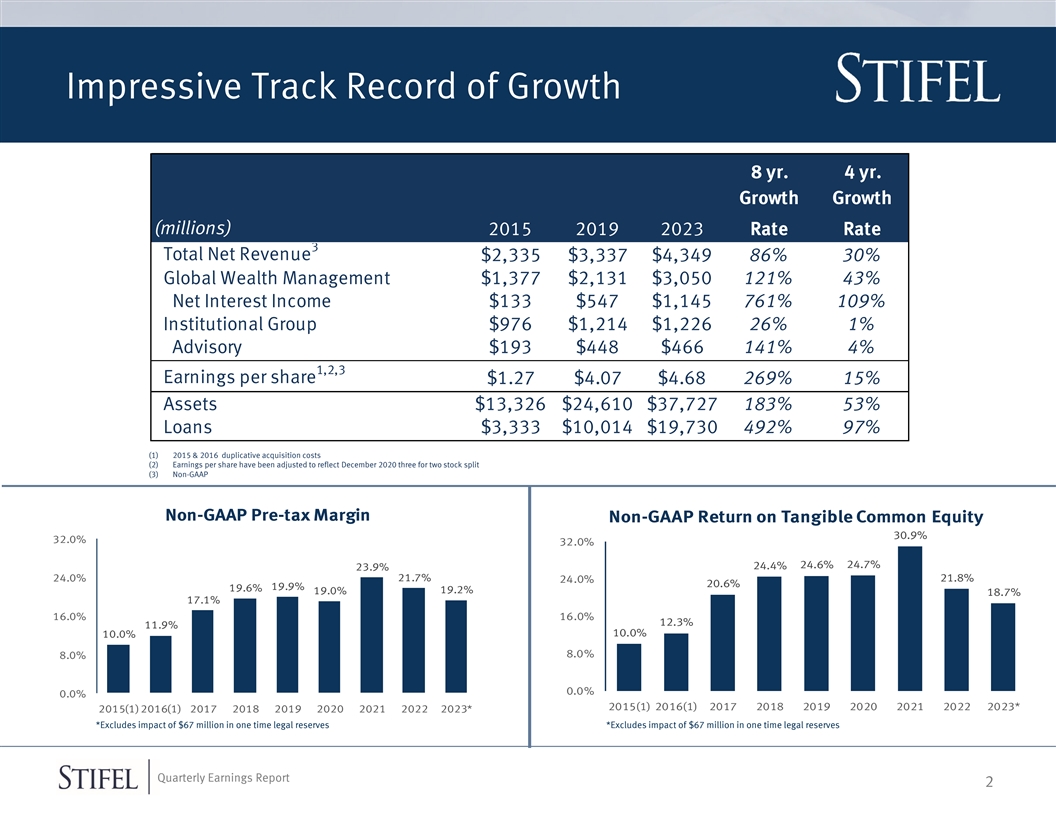
Impressive Track Record of Growth 8 yr. 4 yr. Growth Growth (millions)
2015 2019 2023 Rate Rate 3 Total Net Revenue $2,335 $3,337 $4,349 86% 30% Global Wealth Management $1,377 $2,131 $3,050 121% 43% Net Interest Income $133 $547 $1,145 761% 109% Institutional Group $976 $1,214 $1,226 26% 1% Advisory $193 $448 $466
141% 4% 1,2,3 Earnings per share $1.27 $4.07 $4.68 269% 15% Assets $13,326 $24,610 $37,727 183% 53% Loans $3,333 $10,014 $19,730 492% 97% (1) 2015 & 2016 duplicative acquisition costs (2) Earnings per share have been adjusted to reflect December
2020 three for two stock split (3) Non-GAAP Non-GAAP Pre-tax Margin Non-GAAP Return on Tangible Common Equity 30.9% 32.0% 32.0% 24.6% 24.7% 24.4% 23.9% 24.0% 21.7% 21.8% 24.0% 20.6% 19.9% 19.6% 19.2% 19.0% 18.7% 17.1% 16.0% 16.0% 12.3% 11.9% 10.0%
10.0% 8.0% 8.0% 0.0% 0.0% 2015(1) 2016(1) 2017 2018 2019 2020 2021 2022 2023* 2015(1)2016(1) 2017 2018 2019 2020 2021 2022 2023* *Excludes impact of $67 million in one time legal reserves *Excludes impact of $67 million in one time legal reserves
Quarterly Earnings Report 2
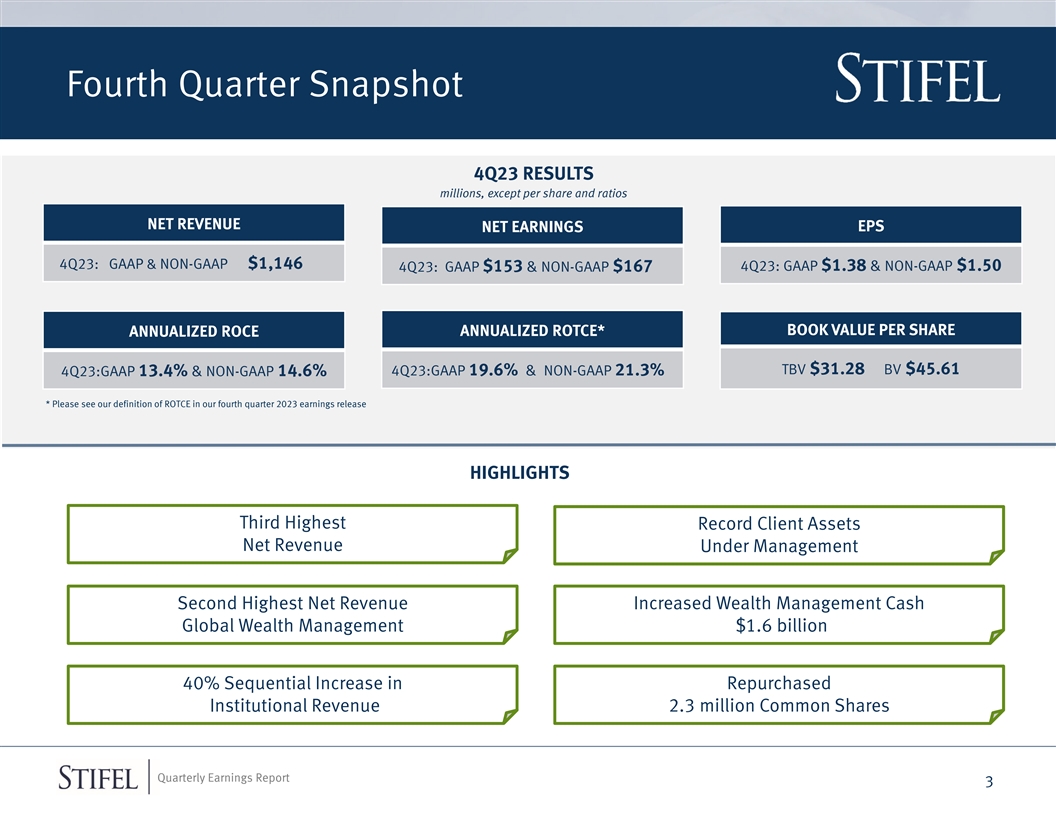
Fourth Quarter Snapshot 4Q23 RESULTS millions, except per share and
ratios NET REVENUE NET EARNINGS EPS 4Q23: GAAP & NON-GAAP $1,146 4Q23: GAAP $1.38 & NON-GAAP $1.50 4Q23: GAAP $153 & NON-GAAP $167 ANNUALIZED ROTCE* BOOK VALUE PER SHARE ANNUALIZED ROCE TBV $31.28 BV $45.61 4Q23:GAAP 13.4% & NON-GAAP
14.6% 4Q23:GAAP 19.6% & NON-GAAP 21.3% * Please see our definition of ROTCE in our fourth quarter 2023 earnings release HIGHLIGHTS Third Highest Record Client Assets Net Revenue Under Management Second Highest Net Revenue Increased Wealth
Management Cash Global Wealth Management $1.6 billion 40% Sequential Increase in Repurchased Institutional Revenue 2.3 million Common Shares Quarterly Earnings Report 3
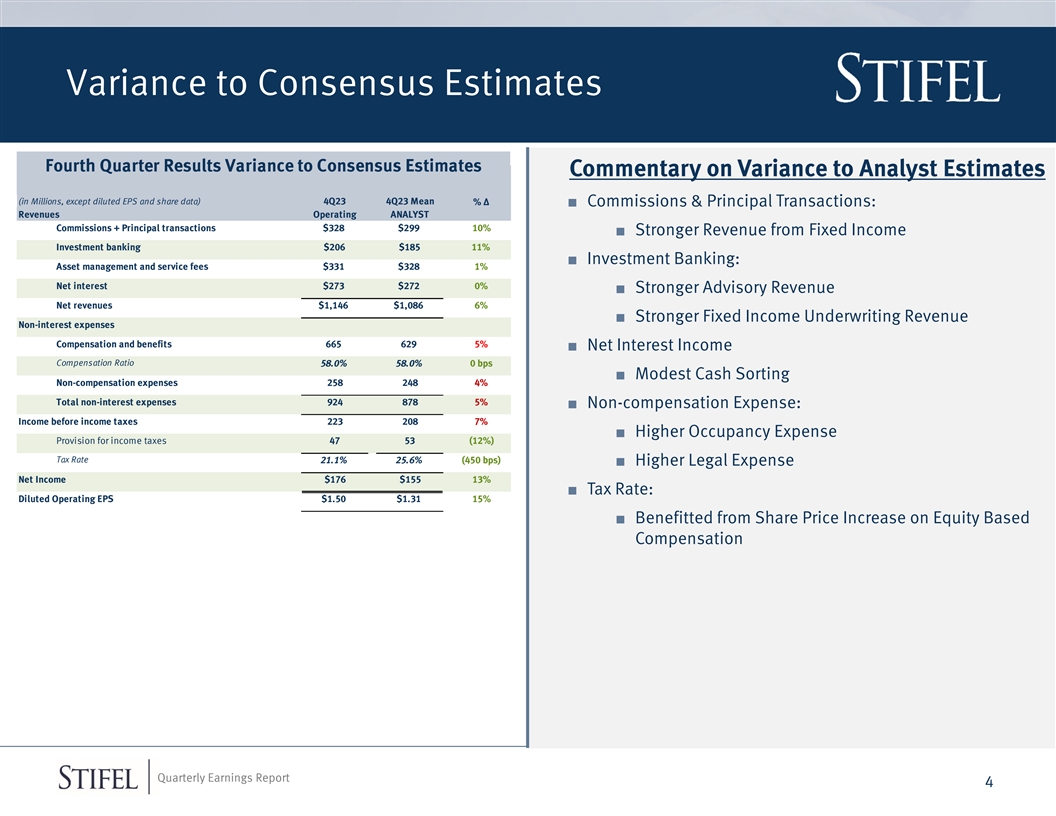
Variance to Consensus Estimates Fourth Quarter Results Variance to
Consensus Estimates Commentary on Variance to Analyst Estimates (in Millions, except diluted EPS and share data) 4Q23 4Q23 Mean % Δ ■ Commissions & Principal Transactions: Revenues Operating ANALYST Commissions + Principal
transactions $328 $299 10% ■ Stronger Revenue from Fixed Income Investment banking $206 $185 11% ■ Investment Banking: Asset management and service fees $331 $328 1% Net interest $273 $272 0% ■ Stronger Advisory Revenue Net
revenues $1,146 $1,086 6% ■ Stronger Fixed Income Underwriting Revenue Non-interest expenses Compensation and benefits 665 629 5% ■ Net Interest Income Compensation Ratio 58.0% 58.0% 0 bps ■ Modest Cash Sorting Non-compensation
expenses 258 248 4% Total non-interest expenses 924 878 5% ■ Non-compensation Expense: Income before income taxes 223 208 7% ■ Higher Occupancy Expense Provision for income taxes 47 53 (12%) Tax Rate 21.1% 25.6% (450 bps) ■ Higher
Legal Expense Net Income $176 $155 13% ■ Tax Rate: Diluted Operating EPS $1.50 $1.31 15% ■ Benefitted from Share Price Increase on Equity Based Compensation * Impact of Legal Reserves calculated as legal reserves of $67 million, an
adjusted tax rate of 25%, divided by the diluted average share count. Quarterly Earnings Report 4
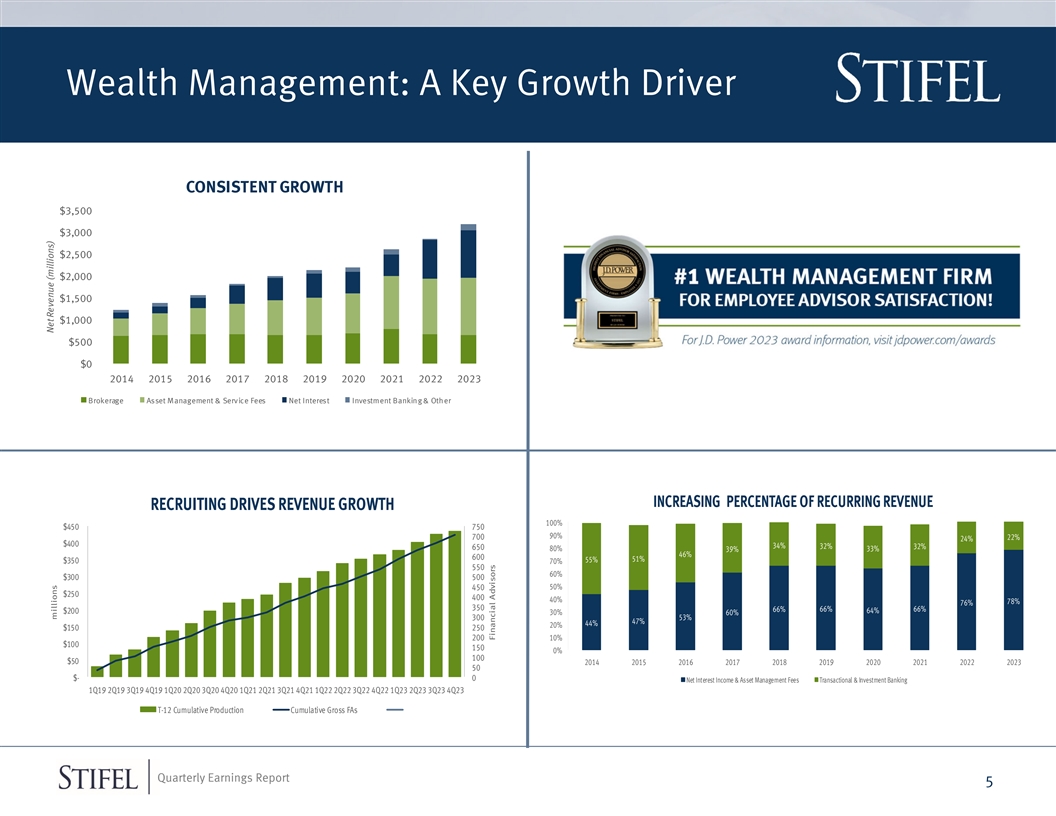
Wealth Management: A Key Growth Driver CONSISTENT GROWTH $3,500 $3,000
$2,500 $2,000 $1,500 $1,000 $500 $0 2014 2015 2016 2017 2018 2019 2020 2021 2022 2023 Brokerage Asset Management & Service Fees Net Interest Investment Banking & Other *2023 GWM Net Revenue based on annualized results through 9/30/2023
INCREASING PERCENTAGE OF RECURRING REVENUE RECRUITING DRIVES REVENUE GROWTH 100% $450 750 90% 700 22% 24% $400 34% 32% 32% 650 80% 39% 33% 46% 600 51% 55% $350 70% 550 60% $300 500 50% 450 $250 400 40% 78% 76% 350 66% 66% 66% $200 64% 30% 60% 53%
300 47% 44% 20% $150 250 200 10% $100 150 0% 100 $50 2014 2015 2016 2017 2018 2019 2020 2021 2022 2023 50 $- 0 Net Interest Income & Asset Management Fees Transactional & Investment Banking 1Q19 2Q19 3Q19 4Q19 1Q20 2Q20 3Q20 4Q20 1Q21 2Q21
3Q21 4Q21 1Q22 2Q22 3Q22 4Q22 1Q23 2Q23 3Q23 4Q23 T-12 Cumulative Production Cumulative Gross FAs Quarterly Earnings Report 5 Net Revenue (millions) millions Financial Advisors
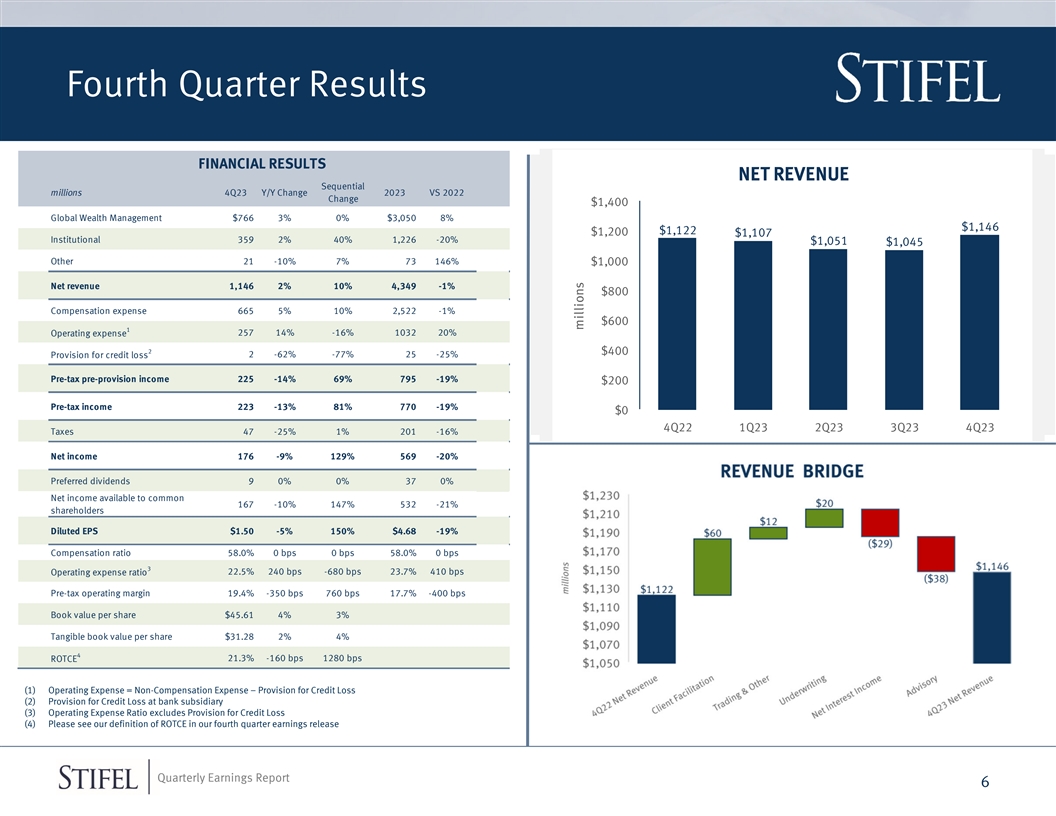
Fourth Quarter Results FINANCIAL RESULTS NET REVENUE Sequential millions
4Q23 Y/Y Change 2023 VS 2022 Change $1,400 Global Wealth Management $766 3% 0% $3,050 8% $1,146 $1,122 $1,200 $1,107 Institutional 359 2% 40% 1,226 -20% $1,051 $1,045 Other 21 -10% 7% 73 146% $1,000 Net revenue 1,146 2% 10% 4,349 -1% $800
Compensation expense 665 5% 10% 2,522 -1% $600 1 257 14% -16% 1032 20% Operating expense 2 $400 2 -62% -77% 25 -25% Provision for credit loss Pre-tax pre-provision income 225 -14% 69% 795 -19% $200 Pre-tax income 223 -13% 81% 770 -19% $0 4Q22 1Q23
2Q23 3Q23 4Q23 Taxes 47 -25% 1% 201 -16% Net income 176 -9% 129% 569 -20% Preferred dividends 9 0% 0% 37 0% Net income available to common 167 -10% 147% 532 -21% shareholders Diluted EPS $1.50 -5% 150% $4.68 -19% Compensation ratio 58.0% 0 bps 0 bps
58.0% 0 bps 3 22.5% 240 bps -680 bps 23.7% 410 bps Operating expense ratio Pre-tax operating margin 19.4% -350 bps 760 bps 17.7% -400 bps Book value per share $45.61 4% 3% Tangible book value per share $31.28 2% 4% 4 21.3% -160 bps 1280 bps ROTCE
(1) Operating Expense = Non-Compensation Expense – Provision for Credit Loss (2) Provision for Credit Loss at bank subsidiary (3) Operating Expense Ratio excludes Provision for Credit Loss (4) Please see our definition of ROTCE in our fourth
quarter earnings release Quarterly Earnings Report 6 millions
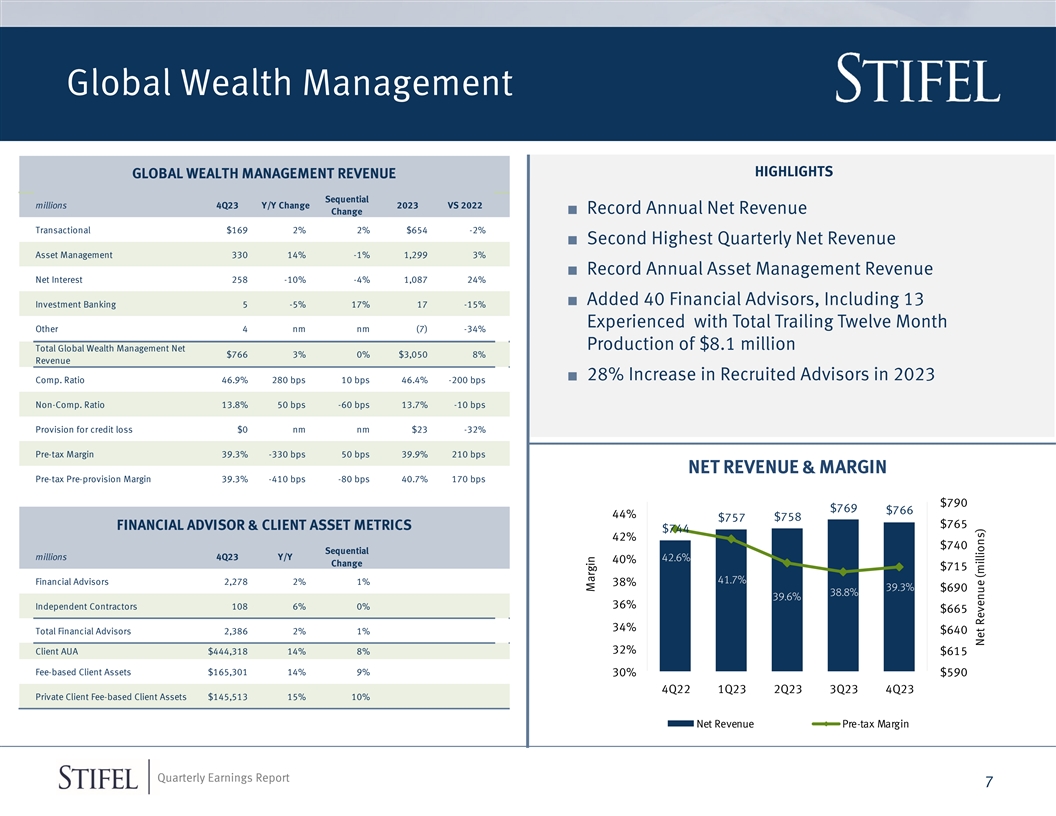
Global Wealth Management HIGHLIGHTS GLOBAL WEALTH MANAGEMENT REVENUE
Sequential millions 4Q23 Y/Y Change 2023 VS 2022 Change■ Record Annual Net Revenue Transactional $169 2% 2% $654 -2% ■ Second Highest Quarterly Net Revenue Asset Management 330 14% -1% 1,299 3% ■ Record Annual Asset Management
Revenue Net Interest 258 -10% -4% 1,087 24% ■ Added 40 Financial Advisors, Including 13 Investment Banking 5 -5% 17% 17 -15% Experienced with Total Trailing Twelve Month Other 4 nm nm (7) -34% Production of $8.1 million Total Global Wealth
Management Net $766 3% 0% $3,050 8% Revenue ■ 28% Increase in Recruited Advisors in 2023 Comp. Ratio 46.9% 280 bps 10 bps 46.4% -200 bps Non-Comp. Ratio 13.8% 50 bps -60 bps 13.7% -10 bps Provision for credit loss $0 nm nm $23 -32% Pre-tax
Margin 39.3% -330 bps 50 bps 39.9% 210 bps NET REVENUE & MARGIN Pre-tax Pre-provision Margin 39.3% -410 bps -80 bps 40.7% 170 bps $790 $769 $766 44% $757 $758 $765 FINANCIAL ADVISOR & CLIENT ASSET METRICS $744 42% $740 Sequential millions
4Q23 Y/Y 42.6% 40% Change $715 41.7% Financial Advisors 2,278 2% 1% 38% 39.3% $690 38.8% 39.6% 36% Independent Contractors 108 6% 0% $665 34% Total Financial Advisors 2,386 2% 1% $640 32% Client AUA $444,318 14% 8% $615 Fee-based Client Assets
$165,301 14% 9% 30% $590 4Q22 1Q23 2Q23 3Q23 4Q23 Private Client Fee-based Client Assets $145,513 15% 10% Net Revenue Pre-tax Margin Quarterly Earnings Report 7 Margin Net Revenue (millions)
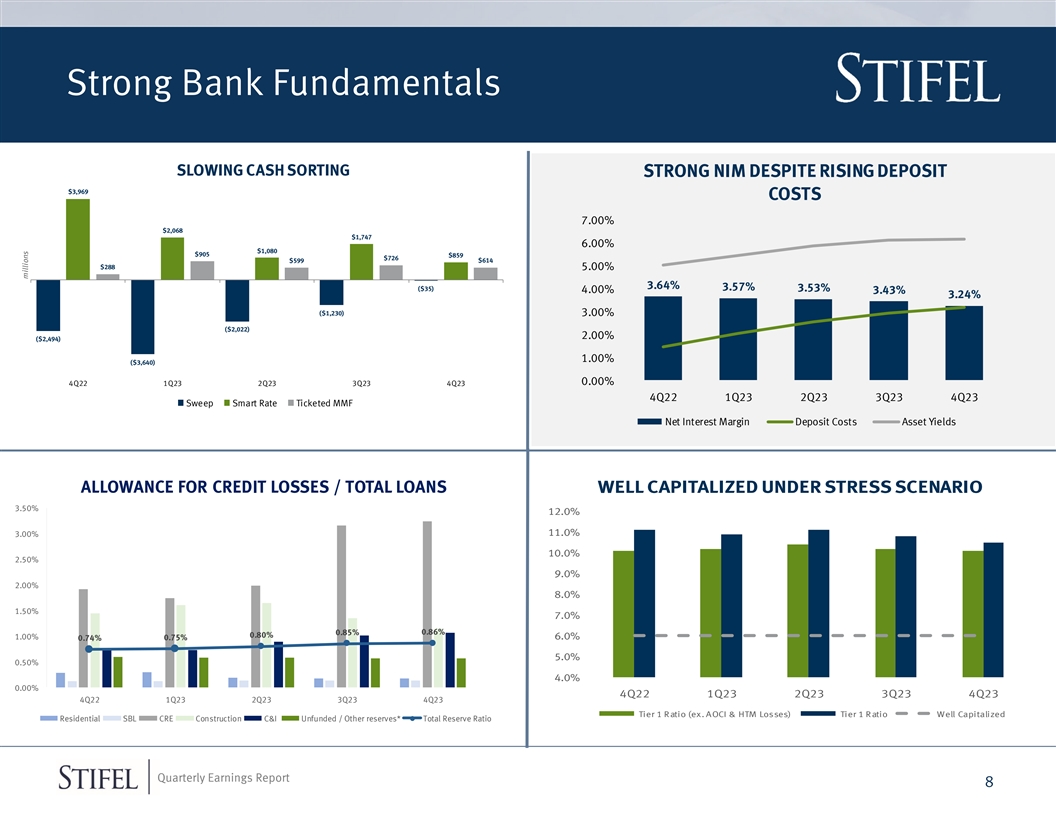
Strong Bank Fundamentals SLOWING CASH SORTING STRONG NIM DESPITE RISING
DEPOSIT $3,969 COSTS 7.00% $2,068 $1,747 6.00% $1,080 $905 $859 $726 $599 $614 $288 5.00% 3.64% ($35) 3.57% 3.53% 4.00% 3.43% 3.24% ($1,230) 3.00% ($2,022) 2.00% ($2,494) 1.00% ($3,640) 0.00% 4Q22 1Q23 2Q23 3Q23 4Q23 4Q22 1Q23 2Q23 3Q23 4Q23 Sweep
Smart Rate Ticketed MMF Net Interest Margin Deposit Costs Asset Yields ALLOWANCE FOR CREDIT LOSSES / TOTAL LOANS WELL CAPITALIZED UNDER STRESS SCENARIO 3.50% 12.0% 11.0% 3.00% 10.0% 2.50% 9.0% 2.00% 8.0% 1.50% 7.0% 0.86% 0.85% 0.80% 1.00% 0.75% 6.0%
0.74% 5.0% 0.50% 4.0% 0.00% 4Q22 1Q23 2Q23 3Q23 4Q23 4Q22 1Q23 2Q23 3Q23 4Q23 Tier 1 R atio (ex. AOCI & HTM Losses) Tier 1 Ratio Well Capitalized Residential SBL CRE Construction C&I Unfunded / Other reserves* Total Reserve Ratio Quarterly
Earnings Report 8 millions
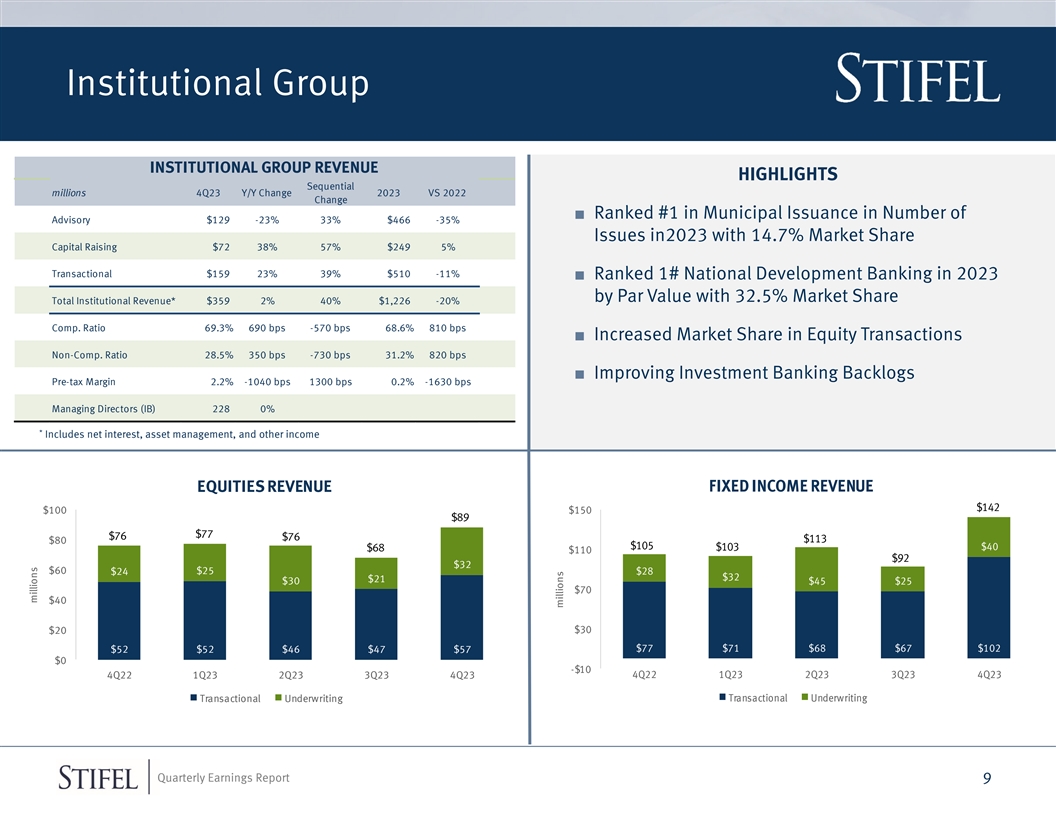
Institutional Group INSTITUTIONAL GROUP REVENUE HIGHLIGHTS Sequential
millions 4Q23 Y/Y Change 2023 VS 2022 Change ■ Ranked #1 in Municipal Issuance in Number of Advisory $129 -23% 33% $466 -35% Issues in2023 with 14.7% Market Share Capital Raising $72 38% 57% $249 5% Transactional $159 23% 39% $510 -11% ■
Ranked 1# National Development Banking in 2023 by Par Value with 32.5% Market Share Total Institutional Revenue* $359 2% 40% $1,226 -20% Comp. Ratio 69.3% 690 bps -570 bps 68.6% 810 bps ■ Increased Market Share in Equity Transactions Non-Comp.
Ratio 28.5% 350 bps -730 bps 31.2% 820 bps ■ Improving Investment Banking Backlogs Pre-tax Margin 2.2% -1040 bps 1300 bps 0.2% -1630 bps Managing Directors (IB) 228 0% * Includes net interest, asset management, and other income EQUITIES
REVENUE FIXED INCOME REVENUE $142 $100 $150 $89 $77 $76 $76 $113 $80 $105 $103 $40 $68 $110 $92 $32 $60 $24 $25 $28 $32 $21 $30 $45 $25 $70 $40 $30 $20 $77 $71 $68 $67 $102 $52 $52 $46 $47 $57 $0 -$10 4Q22 1Q23 2Q23 3Q23 4Q23 4Q22 1Q23 2Q23 3Q23
4Q23 Transactional Underwriting Transactional Underwriting * 2021 revenue based on annualized results through 9/30/2021 Quarterly Earnings Report 9 millions millions
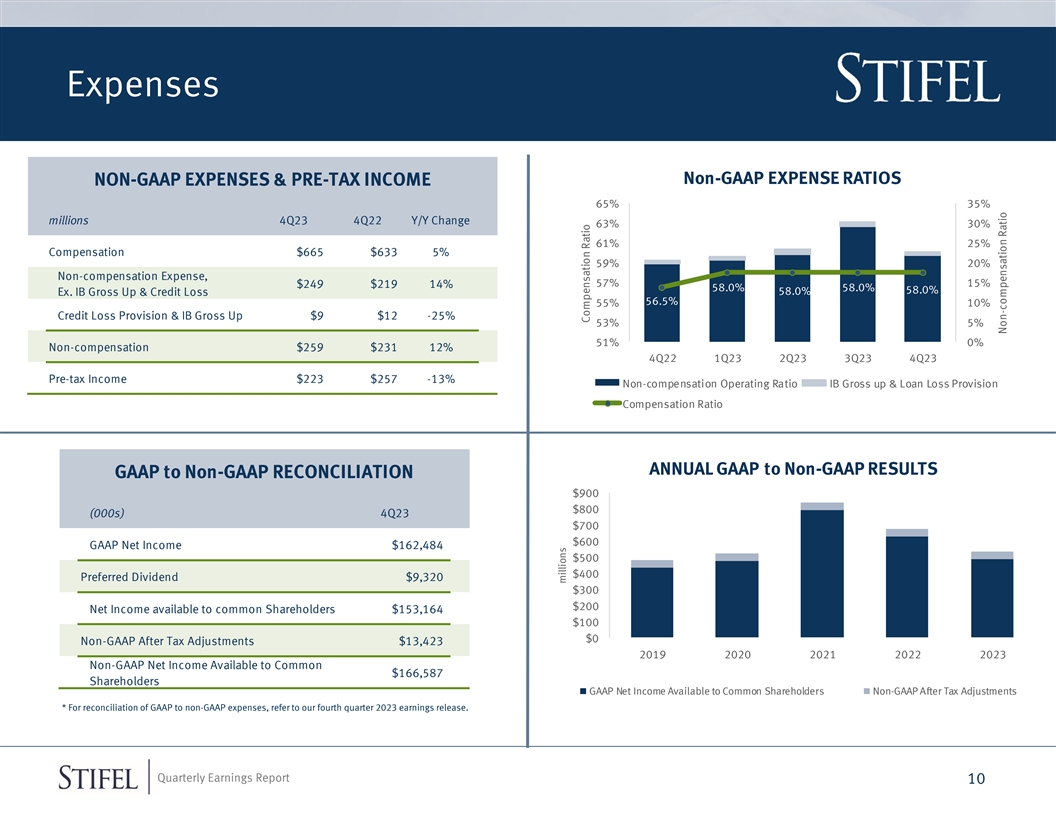
Expenses Non-GAAP EXPENSE RATIOS NON-GAAP EXPENSES & PRE-TAX INCOME
65% 35% millions 4Q23 4Q22 Y/Y Change 63% 30% 61% 25% Compensation $665 $633 5% 59% 20% Non-compensation Expense, 57% 15% $249 $219 14% 58.0% 58.0% 58.0% 58.0% Ex. IB Gross Up & Credit Loss 56.5% 55% 10% Credit Loss Provision & IB Gross Up
$9 $12 -25% 53% 5% 51% 0% Non-compensation $259 $231 12% 4Q22 1Q23 2Q23 3Q23 4Q23 Pre-tax Income $223 $257 -13% Non-compensation Operating Ratio IB Gross up & Loan Loss Provision Compensation Ratio ANNUAL GAAP to Non-GAAP RESULTS GAAP to
Non-GAAP RECONCILIATION $900 $800 (000s) 4Q23 $700 $600 GAAP Net Income $162,484 $500 $400 Preferred Dividend $9,320 $300 $200 Net Income available to common Shareholders $153,164 $100 $0 Non-GAAP After Tax Adjustments $13,423 2019 2020 2021 2022
2023 Non-GAAP Net Income Available to Common $166,587 Shareholders GAAP Net Income Available to Common Shareholders Non-GAAP After Tax Adjustments * For reconciliation of GAAP to non-GAAP expenses, refer to our fourth quarter 2023 earnings release.
*2023 annual GAAP to non-GAAP results based on annualized results through 12/31/2023 Quarterly Earnings Report 10 millions Compensation Ratio Non-compensation Ratio
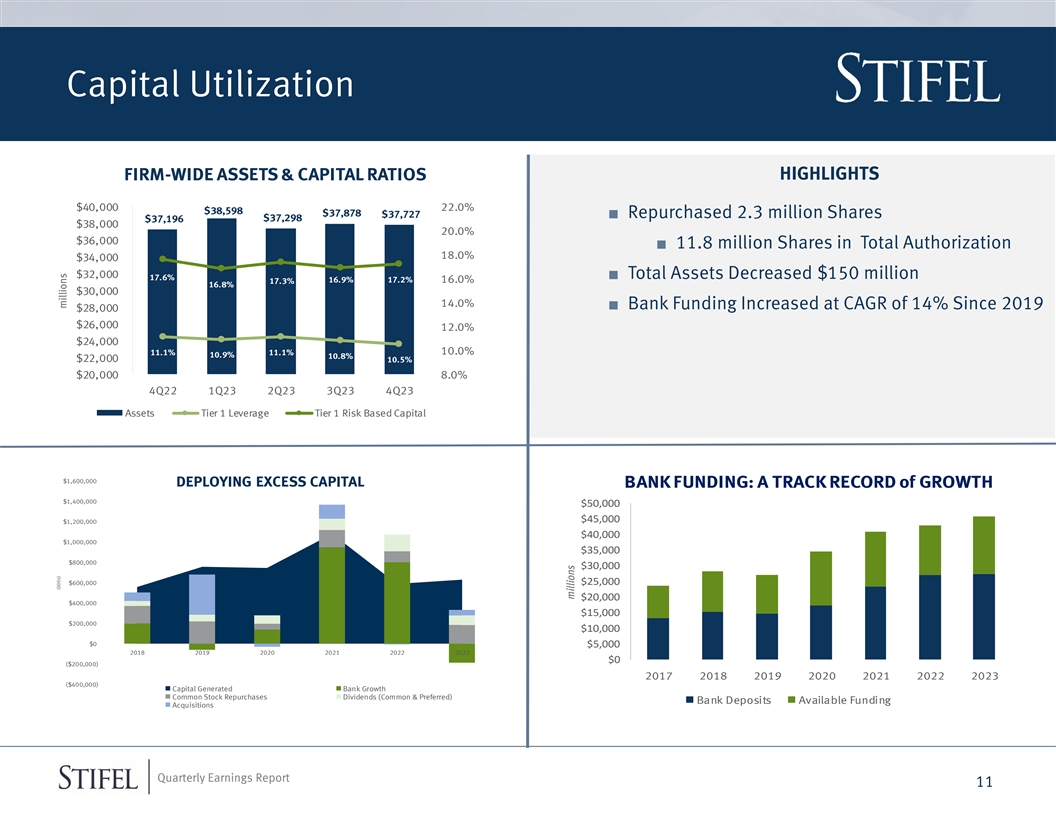
Capital Utilization FIRM-WIDE ASSETS & CAPITAL RATIOS HIGHLIGHTS
$40,000 22.0% $38,598 $37,878 $37,727 ■ Repurchased 2.3 million Shares $37,298 $37,196 $38,000 20.0% $36,000 ■ 11.8 million Shares in Total Authorization 18.0% $34,000 $32,000■ Total Assets Decreased $150 million 17.6% 16.9% 17.2%
16.0% 17.3% 16.8% $30,000 14.0% ■ Bank Funding Increased at CAGR of 14% Since 2019 $28,000 $26,000 12.0% $24,000 10.0% 11.1% 11.1% 10.9% 10.8% $22,000 10.5% $20,000 8.0% 4Q22 1Q23 2Q23 3Q23 4Q23 Assets Tier 1 Leverage Tier 1 Risk Based Capital
$1,600,000 DEPLOYING EXCESS CAPITAL BANK FUNDING: A TRACK RECORD of GROWTH $1,400,000 $50,000 $45,000 $1,200,000 $40,000 $1,000,000 $35,000 $800,000 $30,000 $600,000 $25,000 $20,000 $400,000 $15,000 $200,000 $10,000 $0 $5,000 2018 2019 2020 2021
2022 2023 $0 ($200,000) 2017 2018 2019 2020 2021 2022 2023 ($400,000) Capital Generated Bank Growth Common Stock Repurchases Dividends (Common & Preferred) Bank Deposits Available Funding Acquisitions *2023 based on results through 9/30/2023
*2023 Estimated Capital Generated based annualized 3Q23 Net Income plus current capital in excess of regulatory minimum. Quarterly Earnings Report 11 (000s) millions millions
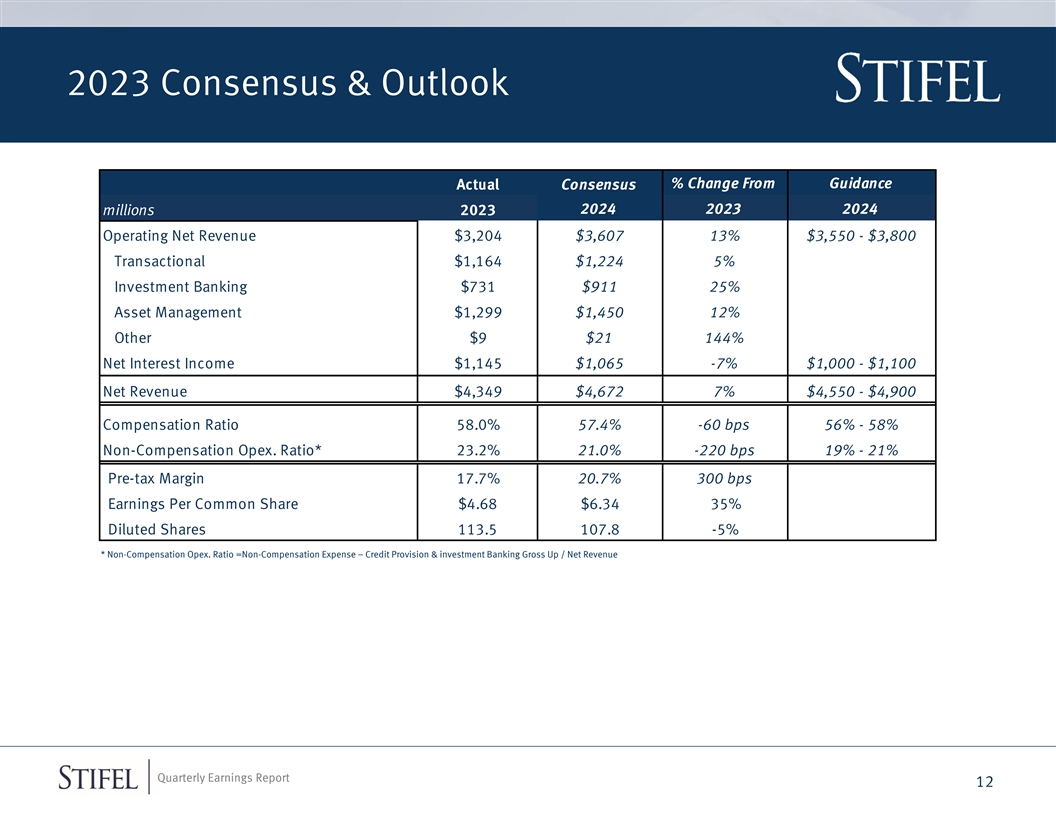
2023 Consensus & Outlook % Change From Guidance Actual Consensus
2024 2023 2024 millions 2023 Operating Net Revenue $3,204 $3,607 13% $3,550 - $3,800 Transactional $1,164 $1,224 5% Investment Banking $731 $911 25% Asset Management $1,299 $1,450 12% Other $9 $21 144% Net Interest Income $1,145 $1,065 -7% $1,000 -
$1,100 Net Revenue $4,349 $4,672 7% $4,550 - $4,900 Compensation Ratio 58.0% 57.4% -60 bps 56% - 58% Non-Compensation Opex. Ratio* 23.2% 21.0% -220 bps 19% - 21% Pre-tax Margin 17.7% 20.7% 300 bps Earnings Per Common Share $4.68 $6.34 35% Diluted
Shares 113.5 107.8 -5% * Non-Compensation Opex. Ratio =Non-Compensation Expense – Credit Provision & investment Banking Gross Up / Net Revenue Quarterly Earnings Report 12

Fourth Quarter 2023 Financial Results Presentation January 24, 2023
Quarterly Earnings Report
Disclaimer Forward-Looking Statements This presentation may contain
“forward-looking statements” within the meaning of the Private Securities Litigation Reform Act of 1995 that involve significant risks, assumptions, and uncertainties, including statements relating to the market opportunity and future
business prospects of Stifel Financial Corp., as well as Stifel, Nicolaus & Company, Incorporated and its subsidiaries (collectively, “SF” or the “Company”). These statements can be identified by the use of the words
“may,” “will,” “should,” “could,” “would,” “plan,” “potential,” “estimate,” “project,” “believe,” “intend,”
“anticipate,” “expect,” and similar expressions. All statements not dealing with historical results are forward-looking and are based on various assumptions. The forward-looking statements are subject to risks and
uncertainties that could cause actual results to differ materially from those expressed in or implied by the statements. For information about the risks and important factors that could affect the Company’s future results, financial condition
and liquidity, see “Risk Factors” in Part I of the Company’s Annual Report on Form 10-K for the year ended December 31, 2022. Forward-looking statements speak only as to the date they are made. The Company disclaims any intent or
obligation to update forward-looking statements to reflect circumstances or events that occur after the date the forward-looking statements are made. Use of Non-GAAP Financial Measures The Company prepares its Consolidated Financial Statements using
accounting principles generally accepted in the United States (U.S. GAAP). The Company may disclose certain “non-GAAP financial measures” in the course of its earnings releases, earnings conference calls, financial presentations and
otherwise. The Securities and Exchange Commission defines a “non-GAAP financial measure” as a numerical measure of historical or future financial performance, financial position, or cash flows that is subject to adjustments that
effectively exclude, or include, amounts from the most directly comparable measure calculated and presented in accordance with U.S. GAAP. Non-GAAP financial measures disclosed by the Company are provided as additional information to analysts,
investors and other stakeholders in order to provide them with greater transparency about, or an alternative method for assessing the Company’s financial condition or operating results. These measures are not in accordance with, or a
substitute for U.S. GAAP, and may be different from or inconsistent with non-GAAP financial measures used by other companies. Whenever the Company refers to a non-GAAP financial measure, it will also define it or present the most directly comparable
financial measure calculated and presented in accordance with U.S. GAAP, along with a reconciliation of the differences between the non-GAAP financial measure it references and such comparable U.S. GAAP financial measure. Quarterly Earnings Report
14
v3.23.4
Document and Entity Information
|
Jan. 24, 2024 |
| Document And Entity Information [Line Items] |
|
| Entity Registrant Name |
STIFEL FINANCIAL CORP
|
| Amendment Flag |
false
|
| Entity Central Index Key |
0000720672
|
| Document Type |
8-K
|
| Document Period End Date |
Jan. 24, 2024
|
| Entity Incorporation State Country Code |
DE
|
| Entity File Number |
001-09305
|
| Entity Tax Identification Number |
43-1273600
|
| Entity Address, Address Line One |
501 N. Broadway
|
| Entity Address, City or Town |
St. Louis
|
| Entity Address, State or Province |
MO
|
| Entity Address, Postal Zip Code |
63102-2188
|
| City Area Code |
(314)
|
| Local Phone Number |
342-2000
|
| Written Communications |
false
|
| Soliciting Material |
false
|
| Pre Commencement Tender Offer |
false
|
| Pre Commencement Issuer Tender Offer |
false
|
| Entity Emerging Growth Company |
false
|
| Common Stock [Member] |
|
| Document And Entity Information [Line Items] |
|
| Security 12b Title |
Common Stock, $0.15 par value per share
|
| Trading Symbol |
SF
|
| Security Exchange Name |
NYSE
|
| Depository Shares Each Representing One By Thousandth Interest In Share Of Six Point Two Five Percentage Not Cumulative Preferred Stock Series B [Member] |
|
| Document And Entity Information [Line Items] |
|
| Security 12b Title |
Depository Shares, each representing 1/1,000th interest in a share of 6.25% Non-Cumulative Preferred Stock, Series B
|
| Trading Symbol |
SF-PB
|
| Security Exchange Name |
NYSE
|
| Depository Shares Each Representing One By Thousandth Interest In Share Of Six Point One Two Five Percentage Not Cumulative Preferred Stock Series C Preferred Stock [Member] |
|
| Document And Entity Information [Line Items] |
|
| Security 12b Title |
Depository Shares, each representing 1/1,000th interest in a share of 6.125% Non-Cumulative Preferred Stock, Series C
|
| Trading Symbol |
SF-PC
|
| Security Exchange Name |
NYSE
|
| Depository Shares Each Representing One By Thousandth Interest In Share Of Four Point Five Zero Percentage Not Cumulative Preferred Stock Series D Preferred Stock [Member] |
|
| Document And Entity Information [Line Items] |
|
| Security 12b Title |
Depository Shares, each representing 1/1,000th interest in a share of 4.50% Non-Cumulative Preferred Stock, Series D
|
| Trading Symbol |
SF-PD
|
| Security Exchange Name |
NYSE
|
| Senior Notes 520 Due 2047 [Member] |
|
| Document And Entity Information [Line Items] |
|
| Security 12b Title |
5.20% Senior Notes due 2047
|
| Trading Symbol |
SFB
|
| Security Exchange Name |
NYSE
|
| X |
- DefinitionBoolean flag that is true when the XBRL content amends previously-filed or accepted submission.
| Name: |
dei_AmendmentFlag |
| Namespace Prefix: |
dei_ |
| Data Type: |
xbrli:booleanItemType |
| Balance Type: |
na |
| Period Type: |
duration |
|
| X |
- DefinitionFor the EDGAR submission types of Form 8-K: the date of the report, the date of the earliest event reported; for the EDGAR submission types of Form N-1A: the filing date; for all other submission types: the end of the reporting or transition period. The format of the date is YYYY-MM-DD.
| Name: |
dei_DocumentPeriodEndDate |
| Namespace Prefix: |
dei_ |
| Data Type: |
xbrli:dateItemType |
| Balance Type: |
na |
| Period Type: |
duration |
|
| X |
- DefinitionThe type of document being provided (such as 10-K, 10-Q, 485BPOS, etc). The document type is limited to the same value as the supporting SEC submission type, or the word 'Other'.
| Name: |
dei_DocumentType |
| Namespace Prefix: |
dei_ |
| Data Type: |
dei:submissionTypeItemType |
| Balance Type: |
na |
| Period Type: |
duration |
|
| X |
- DefinitionAddress Line 1 such as Attn, Building Name, Street Name
| Name: |
dei_EntityAddressAddressLine1 |
| Namespace Prefix: |
dei_ |
| Data Type: |
xbrli:normalizedStringItemType |
| Balance Type: |
na |
| Period Type: |
duration |
|
| X |
- Definition
+ References
+ Details
| Name: |
dei_EntityAddressCityOrTown |
| Namespace Prefix: |
dei_ |
| Data Type: |
xbrli:normalizedStringItemType |
| Balance Type: |
na |
| Period Type: |
duration |
|
| X |
- DefinitionCode for the postal or zip code
| Name: |
dei_EntityAddressPostalZipCode |
| Namespace Prefix: |
dei_ |
| Data Type: |
xbrli:normalizedStringItemType |
| Balance Type: |
na |
| Period Type: |
duration |
|
| X |
- DefinitionName of the state or province.
| Name: |
dei_EntityAddressStateOrProvince |
| Namespace Prefix: |
dei_ |
| Data Type: |
dei:stateOrProvinceItemType |
| Balance Type: |
na |
| Period Type: |
duration |
|
| X |
- DefinitionA unique 10-digit SEC-issued value to identify entities that have filed disclosures with the SEC. It is commonly abbreviated as CIK. Reference 1: http://www.xbrl.org/2003/role/presentationRef
-Publisher SEC
-Name Exchange Act
-Number 240
-Section 12
-Subsection b-2
| Name: |
dei_EntityCentralIndexKey |
| Namespace Prefix: |
dei_ |
| Data Type: |
dei:centralIndexKeyItemType |
| Balance Type: |
na |
| Period Type: |
duration |
|
| X |
- DefinitionIndicate if registrant meets the emerging growth company criteria. Reference 1: http://www.xbrl.org/2003/role/presentationRef
-Publisher SEC
-Name Exchange Act
-Number 240
-Section 12
-Subsection b-2
| Name: |
dei_EntityEmergingGrowthCompany |
| Namespace Prefix: |
dei_ |
| Data Type: |
xbrli:booleanItemType |
| Balance Type: |
na |
| Period Type: |
duration |
|
| X |
- DefinitionCommission file number. The field allows up to 17 characters. The prefix may contain 1-3 digits, the sequence number may contain 1-8 digits, the optional suffix may contain 1-4 characters, and the fields are separated with a hyphen.
| Name: |
dei_EntityFileNumber |
| Namespace Prefix: |
dei_ |
| Data Type: |
dei:fileNumberItemType |
| Balance Type: |
na |
| Period Type: |
duration |
|
| X |
- DefinitionTwo-character EDGAR code representing the state or country of incorporation.
| Name: |
dei_EntityIncorporationStateCountryCode |
| Namespace Prefix: |
dei_ |
| Data Type: |
dei:edgarStateCountryItemType |
| Balance Type: |
na |
| Period Type: |
duration |
|
| X |
- DefinitionThe exact name of the entity filing the report as specified in its charter, which is required by forms filed with the SEC. Reference 1: http://www.xbrl.org/2003/role/presentationRef
-Publisher SEC
-Name Exchange Act
-Number 240
-Section 12
-Subsection b-2
| Name: |
dei_EntityRegistrantName |
| Namespace Prefix: |
dei_ |
| Data Type: |
xbrli:normalizedStringItemType |
| Balance Type: |
na |
| Period Type: |
duration |
|
| X |
- DefinitionThe Tax Identification Number (TIN), also known as an Employer Identification Number (EIN), is a unique 9-digit value assigned by the IRS. Reference 1: http://www.xbrl.org/2003/role/presentationRef
-Publisher SEC
-Name Exchange Act
-Number 240
-Section 12
-Subsection b-2
| Name: |
dei_EntityTaxIdentificationNumber |
| Namespace Prefix: |
dei_ |
| Data Type: |
dei:employerIdItemType |
| Balance Type: |
na |
| Period Type: |
duration |
|
| X |
- DefinitionLocal phone number for entity.
| Name: |
dei_LocalPhoneNumber |
| Namespace Prefix: |
dei_ |
| Data Type: |
xbrli:normalizedStringItemType |
| Balance Type: |
na |
| Period Type: |
duration |
|
| X |
- DefinitionBoolean flag that is true when the Form 8-K filing is intended to satisfy the filing obligation of the registrant as pre-commencement communications pursuant to Rule 13e-4(c) under the Exchange Act. Reference 1: http://www.xbrl.org/2003/role/presentationRef
-Publisher SEC
-Name Exchange Act
-Number 240
-Section 13e
-Subsection 4c
| Name: |
dei_PreCommencementIssuerTenderOffer |
| Namespace Prefix: |
dei_ |
| Data Type: |
xbrli:booleanItemType |
| Balance Type: |
na |
| Period Type: |
duration |
|
| X |
- DefinitionBoolean flag that is true when the Form 8-K filing is intended to satisfy the filing obligation of the registrant as pre-commencement communications pursuant to Rule 14d-2(b) under the Exchange Act. Reference 1: http://www.xbrl.org/2003/role/presentationRef
-Publisher SEC
-Name Exchange Act
-Number 240
-Section 14d
-Subsection 2b
| Name: |
dei_PreCommencementTenderOffer |
| Namespace Prefix: |
dei_ |
| Data Type: |
xbrli:booleanItemType |
| Balance Type: |
na |
| Period Type: |
duration |
|
| X |
- DefinitionTitle of a 12(b) registered security. Reference 1: http://www.xbrl.org/2003/role/presentationRef
-Publisher SEC
-Name Exchange Act
-Number 240
-Section 12
-Subsection b
| Name: |
dei_Security12bTitle |
| Namespace Prefix: |
dei_ |
| Data Type: |
dei:securityTitleItemType |
| Balance Type: |
na |
| Period Type: |
duration |
|
| X |
- DefinitionName of the Exchange on which a security is registered. Reference 1: http://www.xbrl.org/2003/role/presentationRef
-Publisher SEC
-Name Exchange Act
-Number 240
-Section 12
-Subsection d1-1
| Name: |
dei_SecurityExchangeName |
| Namespace Prefix: |
dei_ |
| Data Type: |
dei:edgarExchangeCodeItemType |
| Balance Type: |
na |
| Period Type: |
duration |
|
| X |
- DefinitionBoolean flag that is true when the Form 8-K filing is intended to satisfy the filing obligation of the registrant as soliciting material pursuant to Rule 14a-12 under the Exchange Act. Reference 1: http://www.xbrl.org/2003/role/presentationRef
-Publisher SEC
-Name Exchange Act
-Section 14a
-Number 240
-Subsection 12
| Name: |
dei_SolicitingMaterial |
| Namespace Prefix: |
dei_ |
| Data Type: |
xbrli:booleanItemType |
| Balance Type: |
na |
| Period Type: |
duration |
|
| X |
- DefinitionTrading symbol of an instrument as listed on an exchange.
| Name: |
dei_TradingSymbol |
| Namespace Prefix: |
dei_ |
| Data Type: |
dei:tradingSymbolItemType |
| Balance Type: |
na |
| Period Type: |
duration |
|
| X |
- DefinitionBoolean flag that is true when the Form 8-K filing is intended to satisfy the filing obligation of the registrant as written communications pursuant to Rule 425 under the Securities Act. Reference 1: http://www.xbrl.org/2003/role/presentationRef
-Publisher SEC
-Name Securities Act
-Number 230
-Section 425
| Name: |
dei_WrittenCommunications |
| Namespace Prefix: |
dei_ |
| Data Type: |
xbrli:booleanItemType |
| Balance Type: |
na |
| Period Type: |
duration |
|
| X |
- Details
| Name: |
us-gaap_StatementClassOfStockAxis=us-gaap_CommonStockMember |
| Namespace Prefix: |
|
| Data Type: |
na |
| Balance Type: |
|
| Period Type: |
|
|
| X |
- Details
| Name: |
us-gaap_StatementClassOfStockAxis=sf_DepositorySharesEachRepresentingOneByThousandthInterestInShareOfSixPointTwoFivePercentageNonCumulativePreferredStockSeriesBMember |
| Namespace Prefix: |
|
| Data Type: |
na |
| Balance Type: |
|
| Period Type: |
|
|
| X |
- Details
| Name: |
us-gaap_StatementClassOfStockAxis=sf_DepositorySharesEachRepresentingOneByThousandthInterestInShareOfSixPointOneTwoFivePercentageNonCumulativePreferredStockSeriesCPreferredStockMember |
| Namespace Prefix: |
|
| Data Type: |
na |
| Balance Type: |
|
| Period Type: |
|
|
| X |
- Details
| Name: |
us-gaap_StatementClassOfStockAxis=sf_DepositorySharesEachRepresentingOneByThousandthInterestInShareOfFourPointFiveZeroPercentageNonCumulativePreferredStockSeriesDPreferredStockMember |
| Namespace Prefix: |
|
| Data Type: |
na |
| Balance Type: |
|
| Period Type: |
|
|
| X |
- Details
| Name: |
us-gaap_StatementClassOfStockAxis=sf_SeniorNotes520Due2047Member |
| Namespace Prefix: |
|
| Data Type: |
na |
| Balance Type: |
|
| Period Type: |
|
|
Stifel Financial (NYSE:SF-D)
과거 데이터 주식 차트
부터 5월(5) 2024 으로 6월(6) 2024

Stifel Financial (NYSE:SF-D)
과거 데이터 주식 차트
부터 6월(6) 2023 으로 6월(6) 2024
