GA false 0001376339 0001376339 2023-09-05 2023-09-05
UNITED STATES
SECURITIES AND EXCHANGE COMMISSION
WASHINGTON, DC 20549
FORM 8-K
CURRENT REPORT
PURSUANT TO SECTION 13 OR 15(d)
OF THE SECURITIES EXCHANGE ACT OF 1934
Date of Report (Date of earliest event reported): September 5, 2023
MIMEDX GROUP, INC.
(Exact name of registrant as specified in charter)
|
|
|
|
|
| Florida |
|
001-35887 |
|
26-2792552 |
| (State or other jurisdiction of incorporation) |
|
(Commission File Number) |
|
(IRS Employer Identification No.) |
|
| 1775 West Oak Commons Ct., NE, Marietta GA 30062 |
| (Address of principal executive offices) (Zip Code) |
Registrant’s telephone number, including area code: (770) 651-9100
Check the appropriate box below if the Form 8-K filing is intended to simultaneously satisfy the filing obligation of the registrant under any of the following provisions (see General Instruction A.2. below):
| ☐ |
Written communications pursuant to Rule 425 under the Securities Act (17 CFR 230.425) |
| ☐ |
Soliciting material pursuant to Rule 14a-12 under the Exchange Act (17 CFR 240.14a-12) |
| ☐ |
Pre-commencement communications pursuant to Rule 14d-2(b) under the Exchange Act (17 CFR 240.14d-2(b)) |
| ☐ |
Pre-commencement communications pursuant to Rule 13e-4(c) under the Exchange Act (17 CFR 240.13e-4(c)) |
Securities registered pursuant to Section 12(b) of the Act:
|
|
|
|
|
| Title of each class |
|
Trading Symbol(s) |
|
Name of each exchange on which registered |
| Common Stock, $0.001 par value per share |
|
MDXG |
|
The Nasdaq Stock Market LLC |
Indicate by check mark whether the registrant is an emerging growth company as defined in Rule 405 of the Securities Act of 1933 (§ 230.405 of this chapter) or Rule 12b-2 of the Securities Exchange Act of 1934 (§ 240.12b-2 of this chapter).
Emerging growth company ☐
If an emerging growth company, indicate by check mark if the registrant has elected not to use the extended transition period for complying with any new or revised financial accounting standards provided pursuant to Section 13(a) of the Exchange Act. ☐
On September 5, 2023, MiMedx Group, Inc. (the “Company”) issued a press release announcing that senior management will participate in the following investor conferences throughout September 2023, including the H.C. Wainwright 25th Annual Global Investment Conference on September 12, 2023, Northland Capital Markets Institutional Investor Conference on September 19, 2023, and Cantor Fitzgerald Global Healthcare Conference 2023 on September 27, 2023. A copy of the presentation materials to be made available by the Company in connection with the conferences is furnished as Exhibit 99.2 to this Current Report on Form 8-K (this “Current Report”) and is incorporated herein by reference.
The information in this Current Report, including Exhibit 99.1, shall not be deemed “filed” for purposes of Section 18 of the Securities Exchange Act of 1934, as amended (the “Exchange Act”), or otherwise subject to the liabilities of that section, nor shall such information be deemed incorporated by reference in any filing under the Securities Act of 1933, as amended, except as expressly set forth by specific reference in such filing.
| Item 9.01 |
Financial Statements and Exhibits. |
(d) Exhibits.
SIGNATURES
Pursuant to the requirements of the Exchange Act, the Registrant has duly caused this report to be signed on its behalf by the undersigned hereunto duly authorized.
|
|
|
|
|
|
|
|
|
|
|
|
|
MIMEDX GROUP, INC. |
|
|
|
|
| Date: September 5, 2023 |
|
|
|
By: |
|
/s/ Doug Rice |
|
|
|
|
|
|
Doug Rice |
|
|
|
|
|
|
Chief Financial Officer |
Exhibit 99.1

MIMEDX to Present at Upcoming Investor Conferences
MARIETTA, Ga., September 5, 2023 — MiMedx Group, Inc. (Nasdaq: MDXG) (“MIMEDX” or the “Company”) today announced that senior
management will participate in the following investor conferences:
H.C. Wainwright 25th Annual
Global Investment Conference
Presentation: Tuesday, September 12, 2023 at 12:30 PM ET
Webcast: Click here to access
Northland Capital
Markets Institutional Investor Conference
Participation: Tuesday, September 19, 2023
Cantor Fitzgerald Global Healthcare Conference 2023
Presentation: Wednesday, September 27, 2023 at 10:55 AM ET
Webcast: Click here to access
Institutional investors
interested in meeting with senior management may contact their respective H.C. Wainwright, Northland Capital, or Cantor Fitzgerald representative.
A live
webcast of each presentation will be available on the Events page of the Investors section of the Company’s website at www.mimedx.com or through the conference site by using the links above. A replay will be available on the Company’s
website following the event.
About MIMEDX
MIMEDX is
a pioneer and leader focused on helping humans heal. With more than a decade of helping clinicians manage chronic and other hard-to-heal wounds, MIMEDX is dedicated to
providing a leading portfolio of products for applications in the wound care, burn, and surgical sectors of healthcare. The Company’s vision is to be the leading global provider of healing solutions through relentless innovation to restore
quality of life. For additional information, please visit www.mimedx.com.
Contact:
Matt Notarianni
Investor Relations
470-304-7291
mnotarianni@mimedx.com

Exhibit 99.2 Investor Presentation September 2023 HELPING HUMANS
HEAL
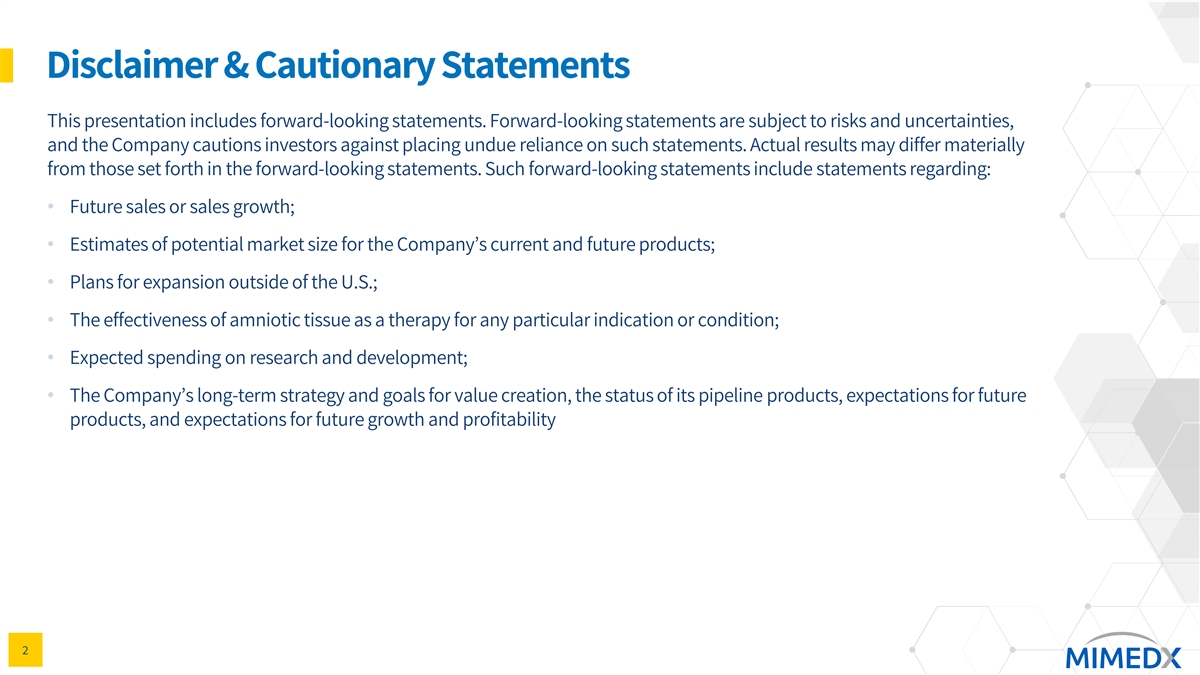
Disclaimer & Cautionary Statements This presentation includes
forward-looking statements. Forward-looking statements are subject to risks and uncertainties, and the Company cautions investors against placing undue reliance on such statements. Actual results may differ materially from those set forth in the
forward-looking statements. Such forward-looking statements include statements regarding: • Future sales or sales growth; • Estimates of potential market size for the Company’s current and future products; • Plans for
expansion outside of the U.S.; • The effectiveness of amniotic tissue as a therapy for any particular indication or condition; • Expected spending on research and development; • The Company’s long-term strategy and goals for
value creation, the status of its pipeline products, expectations for future products, and expectations for future growth and profitability 2

Disclaimer & Cautionary Statements Additional forward-looking
statements may be identified by words such as believe, expect, may, plan, potential, will, preliminary, and similar expressions, and are based on management's current beliefs and expectations. Forward-looking statements are subject to risks and
uncertainties, and the Company cautions investors against placing undue reliance on such statements. Actual results may differ materially from those set forth in the forward-looking statements. Factors that could cause actual results to differ from
expectations include: • Future sales are uncertain and are affected by competition, access to customers, patient access to healthcare providers, and many other factors; • The future market for the Company’s products can depend on
regulatory approval of such products, which might not occur at all or when expected, and is based in part on assumptions regarding the number of patients who elect less acute and more acute treatment than the Company’s products, market
acceptance of the Company’s products, and adequate reimbursement for such therapies; • The process of obtaining regulatory clearances or approvals to market a biological product or medical device from the FDA or similar regulatory
authorities outside of the U.S. is costly and time consuming, and such clearances or approvals may not be granted on a timely basis, or at all, and the ability to obtain the rights to market additional, suitable products depends on negotiations with
third parties which may not be forthcoming; • Whether there is full access to hospitals and healthcare provider facilities, as a continuation or escalation of access restrictions or lockdown orders resulting from the ongoing COVID-19 pandemic;
and • The Company describes additional risks and uncertainties in the Risk Factors section of its most recent annual report and quarterly reports filed with the Securities and Exchange Commission. Any forward-looking statements speak only as
of the date of this press release and the Company assumes no obligation to update any forward- looking statement. 3
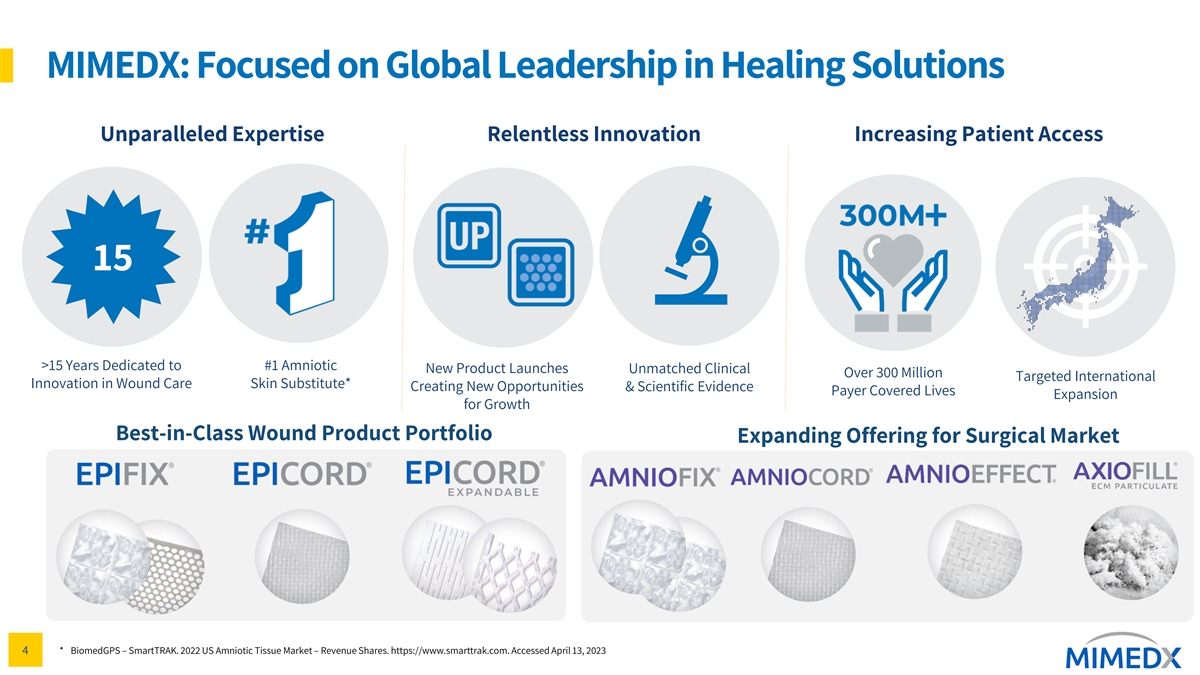
MIMEDX: Focused on Global Leadership in Healing Solutions Unparalleled
Expertise Relentless Innovation Increasing Patient Access 15 >15 Years Dedicated to #1 Amniotic New Product Launches Unmatched Clinical Over 300 Million Targeted International Innovation in Wound Care Skin Substitute* Creating New Opportunities
& Scientific Evidence Payer Covered Lives Expansion for Growth Best-in-Class Wound Product Portfolio Expanding Offering for Surgical Market * BiomedGPS – SmartTRAK. 2022 US Amniotic Tissue Market – Revenue Shares.
https://www.smarttrak.com. Accessed April 13, 2023 4

Large Placental Donation Network & Proprietary Tissue Processing
Technology Placental Donation Network Proprietary Processing 5 1 2 3 4 6 7 Expectant Mom Mom Consents to Delivery of Healthy Donated Placental Microbiological Proprietary Shelf-stable Introduced to Donate and Completes Baby via Tissues Recovered
Testing of Donor Processing and Packaged Donation Program FDA Donor Screening Caesarean Section Tissue Terminal Sterilization Product Assessment in the US 100,000+ 2 million+ Placentas recovered to-date via network of contracted birthing Allografts
distributed to-date hospitals and dedicated team of donor recovery specialists 5
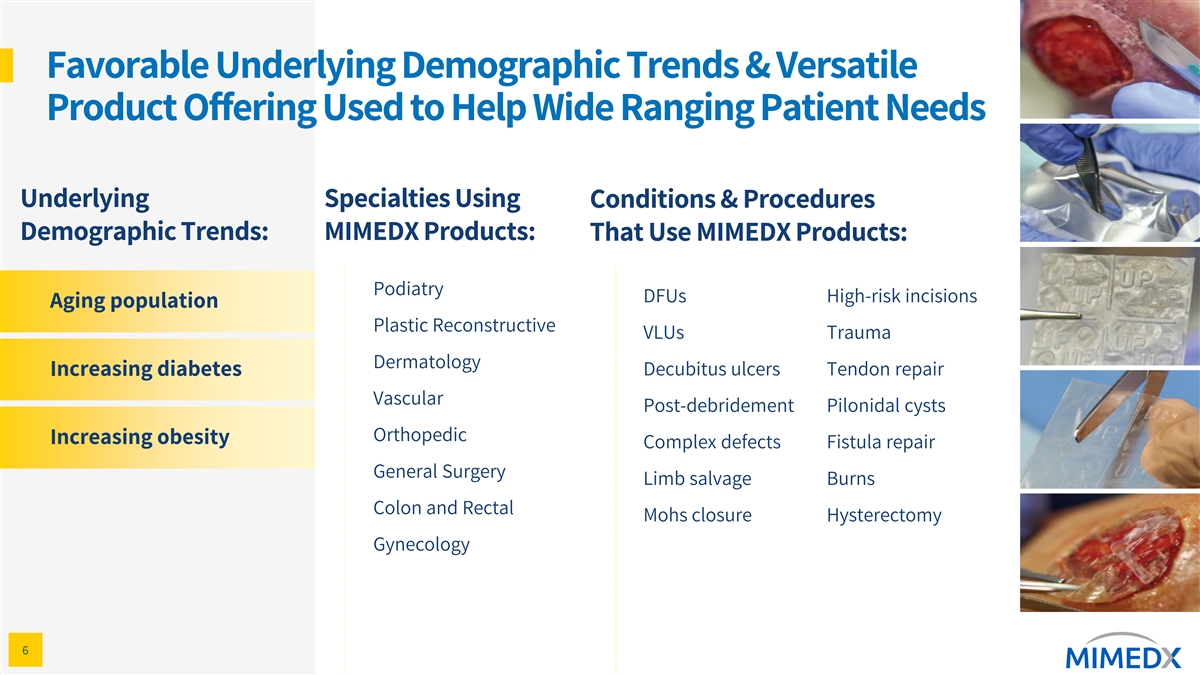
Favorable Underlying Demographic Trends & Versatile Product Offering
Used to Help Wide Ranging Patient Needs Underlying Specialties Using Conditions & Procedures Demographic Trends: MIMEDX Products: That Use MIMEDX Products: Podiatry DFUs High-risk incisions Aging population Aging population Plastic
Reconstructive VLUs Trauma Dermatology Increasing diabetes Decubitus ulcers Tendon repair Increasing diabetes Vascular Post-debridement Pilonidal cysts Increasing obesity Orthopedic Increasing obesity Complex defects Fistula repair General Surgery
Limb salvage Burns Colon and Rectal Mohs closure Hysterectomy Gynecology 6

Sizable Opportunities in Wound & Surgical End Markets CAGRs* Total
Addressable Markets +9% $3.5B +9% 0.7 Favorable Demographic Trends $2.5B & Increasing Need for $0.5B 1.3 +10% Wound Solutions for Large & Growing $0.9B Patient Population 1.5 +8% $1.1B $268MM MIMEDX 2022 Net Sales 2022 2026E U.S. Wound U.S.
Surgical Japan *CAGRs are the estimated cumulative annual growth rates for the period January 1, 2022 through December 31, 2026 BioMed GPS SmartTrak; 3rd party proprietary assessment; GlobalData Tissue Engineered-Skin Sub Data Model Wound Management
Year 2020 – retrieved Sept 2021; Management estimates 7

Diversified Business Across Multiple Sites of Service Proportion of Site
of Service Segment Commentary * MIMEDX Sales Hospital Setting (Inpatient & Stable reimbursement settings and growing with expanded ~57% Outpatient) & Wound use of products in surgical applications Care Clinics Regaining share as Medicare
reimbursement challenges abate Private Office ~29% as a result of signs of increasing enforcement Approximately 13% of net sales are derived from other sites of Other ~13% service, including federal facilities, and international *Sales mix based
upon Q2:23 results, percentages do not sum to 100% due to rounding 8

Introducing Our New ‘Why’ Statement & Company Vision Our
Why: Helping Humans Heal To be the leading global provider of healing solutions through Our Vision: relentless innovation to restore quality of life 9
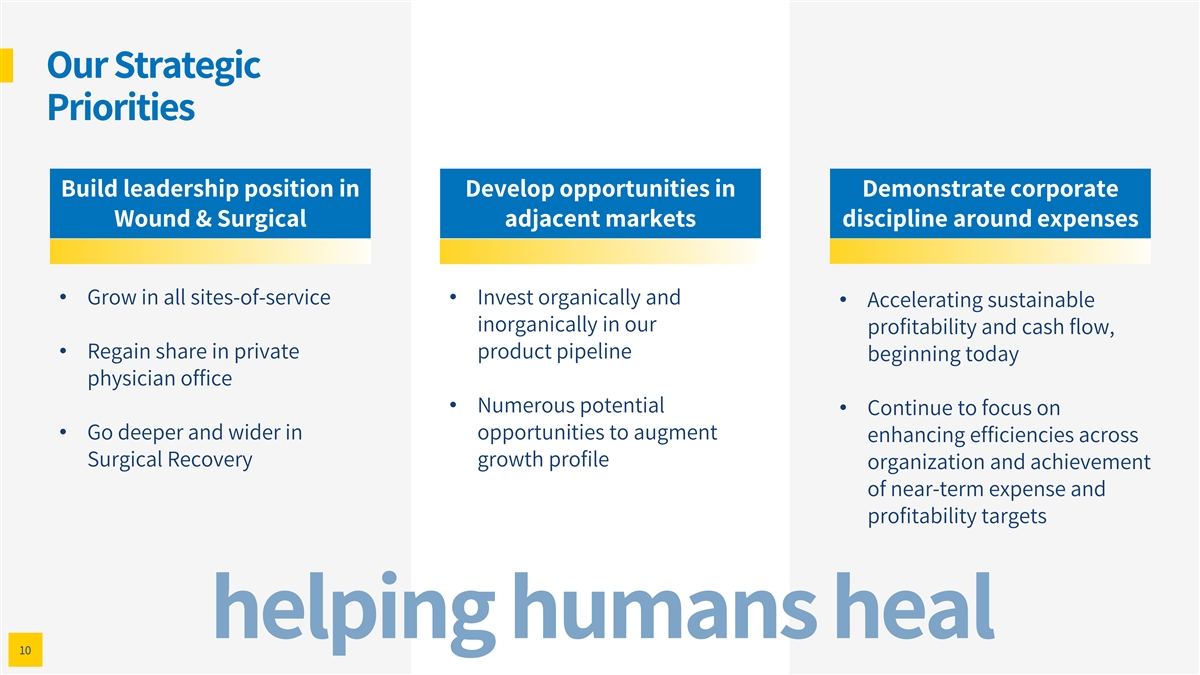
Our Strategic Priorities Build leadership position in Develop
opportunities in Demonstrate corporate Wound & Surgical adjacent markets discipline around expenses • Grow in all sites-of-service• Invest organically and • Accelerating sustainable inorganically in our profitability and cash
flow, • Regain share in private product pipeline beginning today physician office • Numerous potential • Continue to focus on • Go deeper and wider in opportunities to augment enhancing efficiencies across Surgical Recovery
growth profile organization and achievement of near-term expense and profitability targets helping humans heal 10
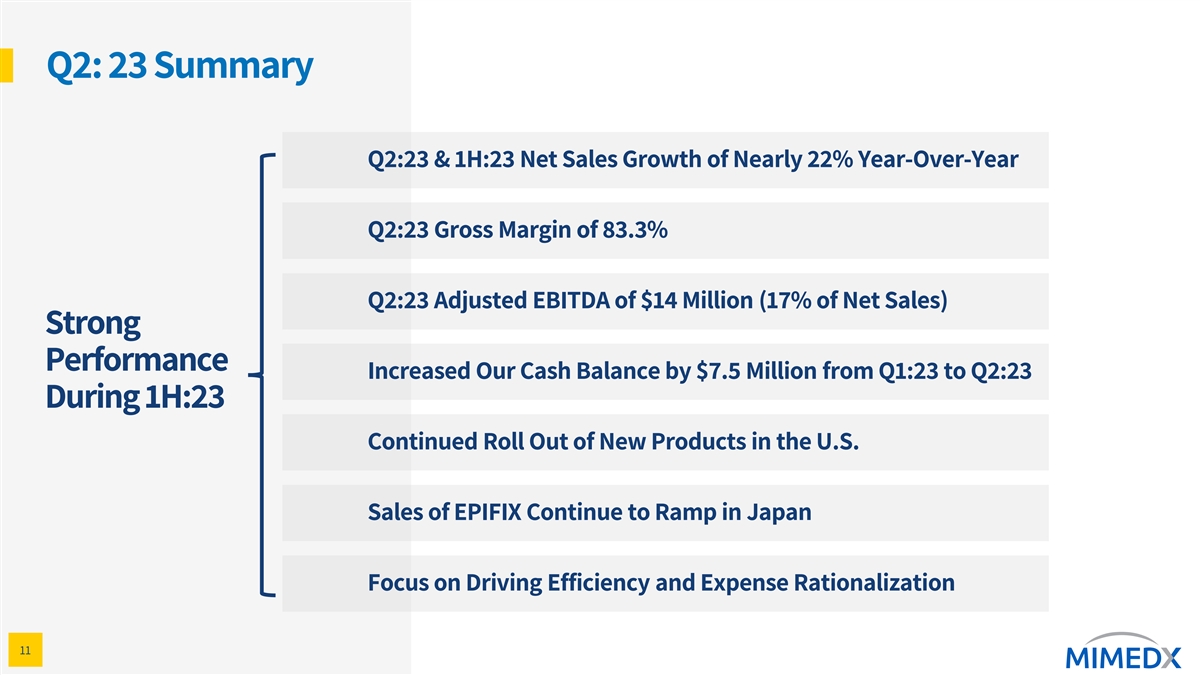
Q2: 23 Summary Q2:23 & 1H:23 Net Sales Growth of Nearly 22%
Year-Over-Year Q2:23 Gross Margin of 83.3% Q2:23 Adjusted EBITDA of $14 Million (17% of Net Sales) Strong Performance Increased Our Cash Balance by $7.5 Million from Q1:23 to Q2:23 During 1H:23 Continued Roll Out of New Products in the U.S. Sales of
EPIFIX Continue to Ramp in Japan Focus on Driving Efficiency and Expense Rationalization 11
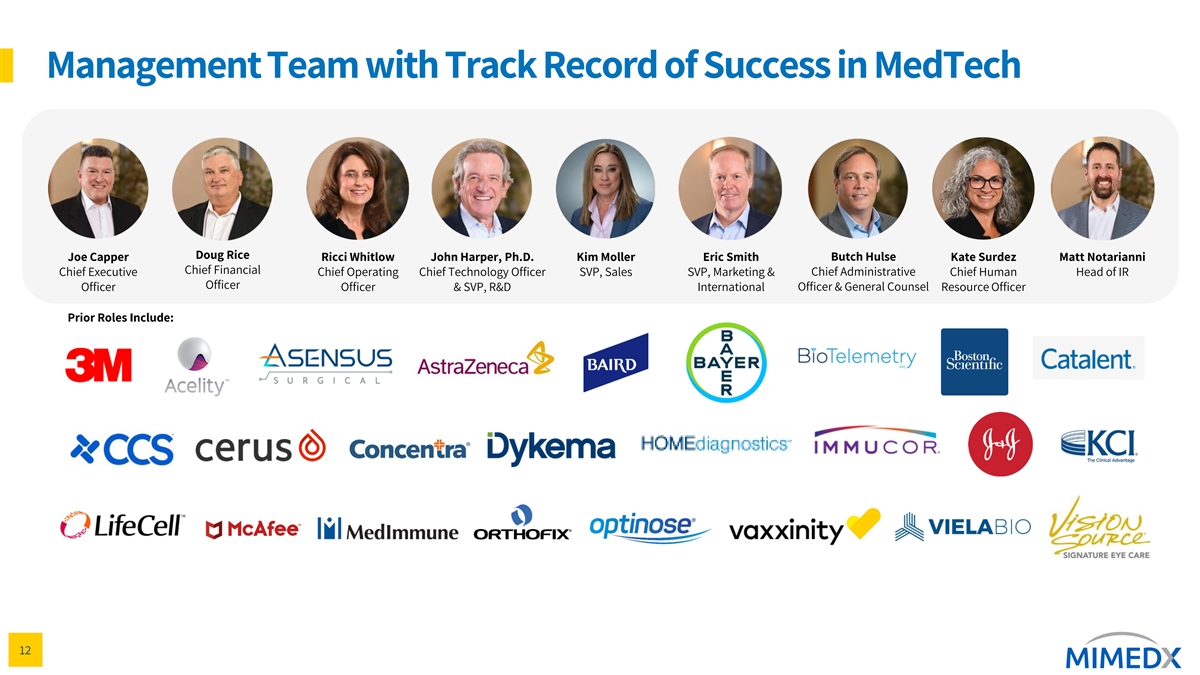
Management Team with Track Record of Success in MedTech Doug Rice Joe
Capper Ricci Whitlow John Harper, Ph.D. Kim Moller Eric Smith Butch Hulse Kate Surdez Matt Notarianni Chief Financial Chief Executive Chief Operating Chief Technology Officer SVP, Sales SVP, Marketing & Chief Administrative Chief Human Head of
IR Officer Officer Officer & SVP, R&D International Officer & General Counsel Resource Officer Prior Roles Include: 12

Conclusion Pioneer in Expanding Large and Committed to field of
placental pipeline in growing delivering above- based allografts Wound & market market growth Surgical opportunities and profitability helping humans heal. 13

Appendix
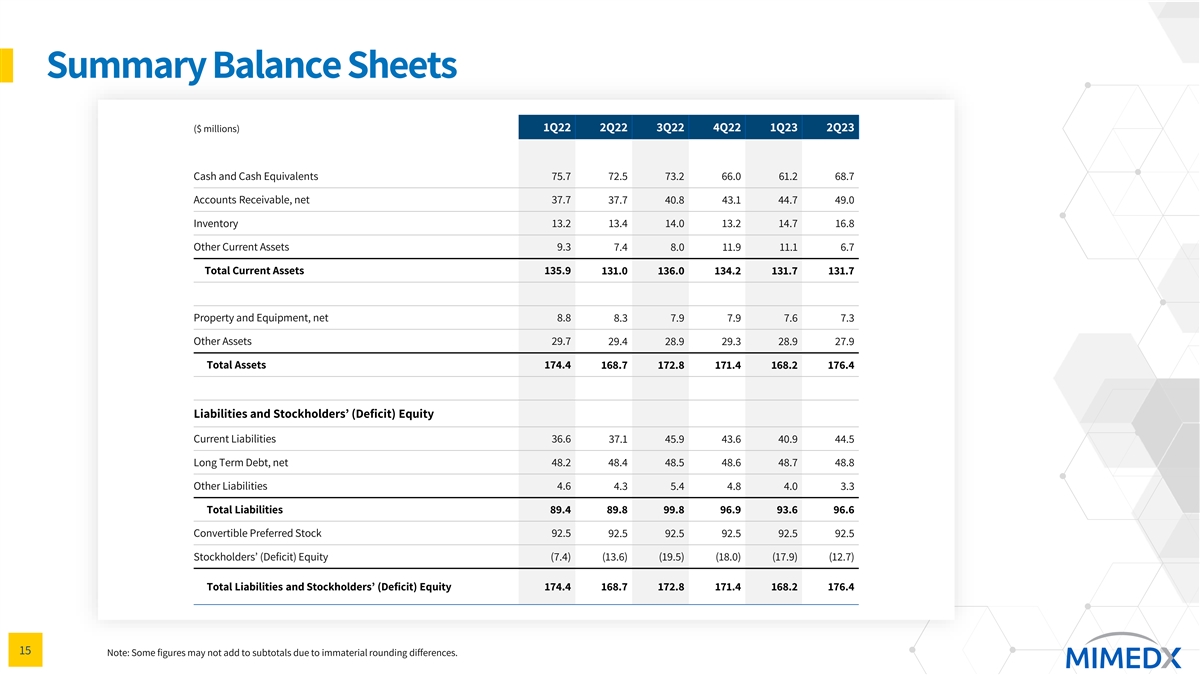
Summary Balance Sheets 1Q22 2Q22 3Q22 4Q22 1Q23 2Q23 ($ millions) Cash
and Cash Equivalents 75.7 72.5 73.2 66.0 61.2 68.7 Accounts Receivable, net 37.7 37.7 40.8 43.1 44.7 49.0 Inventory 13.2 13.4 14.0 13.2 14.7 16.8 Other Current Assets 9.3 7.4 8.0 11.9 11.1 6.7 Total Current Assets 135.9 131.0 136.0 134.2 131.7 131.7
Property and Equipment, net 8.8 8.3 7.9 7.9 7.6 7.3 Other Assets 29.7 29.4 28.9 29.3 28.9 27.9 Total Assets 174.4 168.7 172.8 171.4 168.2 176.4 Liabilities and Stockholders’ (Deficit) Equity Current Liabilities 36.6 37.1 45.9 43.6 40.9 44.5
Long Term Debt, net 48.2 48.4 48.5 48.6 48.7 48.8 Other Liabilities 4.6 4.3 5.4 4.8 4.0 3.3 Total Liabilities 89.4 89.8 99.8 96.9 93.6 96.6 Convertible Preferred Stock 92.5 92.5 92.5 92.5 92.5 92.5 Stockholders’ (Deficit) Equity (7.4) (13.6)
(19.5) (18.0) (17.9) (12.7) Total Liabilities and Stockholders’ (Deficit) Equity 174.4 168.7 172.8 171.4 168.2 176.4 15 Note: Some figures may not add to subtotals due to immaterial rounding differences. y
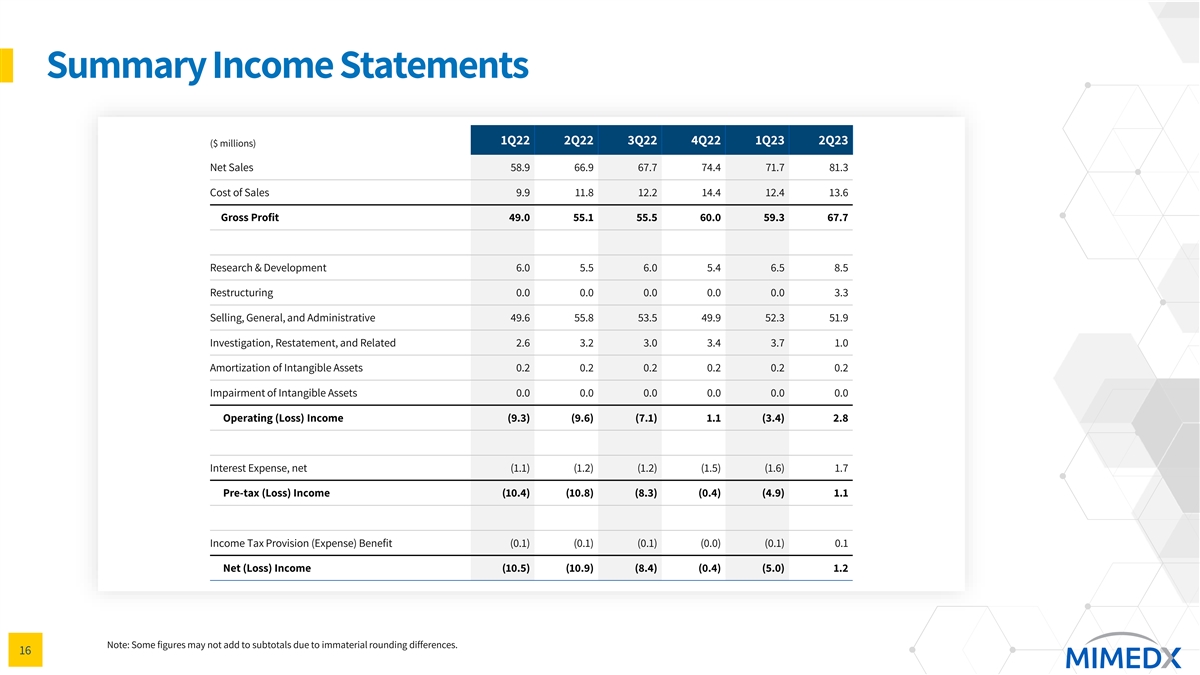
Summary Income Statements 1Q22 2Q22 3Q22 4Q22 1Q23 2Q23 ($ millions)
Net Sales 58.9 66.9 67.7 74.4 71.7 81.3 Cost of Sales 9.9 11.8 12.2 14.4 12.4 13.6 Gross Profit 49.0 55.1 55.5 60.0 59.3 67.7 Research & Development 6.0 5.5 6.0 5.4 6.5 8.5 Restructuring 0.0 0.0 0.0 0.0 0.0 3.3 Selling, General, and
Administrative 49.6 55.8 53.5 49.9 52.3 51.9 Investigation, Restatement, and Related 2.6 3.2 3.0 3.4 3.7 1.0 Amortization of Intangible Assets 0.2 0.2 0.2 0.2 0.2 0.2 Impairment of Intangible Assets 0.0 0.0 0.0 0.0 0.0 0.0 Operating (Loss) Income
(9.3) (9.6) (7.1) 1.1 (3.4) 2.8 Interest Expense, net (1.1) (1.2) (1.2) (1.5) (1.6) 1.7 Pre-tax (Loss) Income (10.4) (10.8) (8.3) (0.4) (4.9) 1.1 Income Tax Provision (Expense) Benefit (0.1) (0.1) (0.1) (0.0) (0.1) 0.1 Net (Loss) Income (10.5)
(10.9) (8.4) (0.4) (5.0) 1.2 Note: Some figures may not add to subtotals due to immaterial rounding differences. 16 y
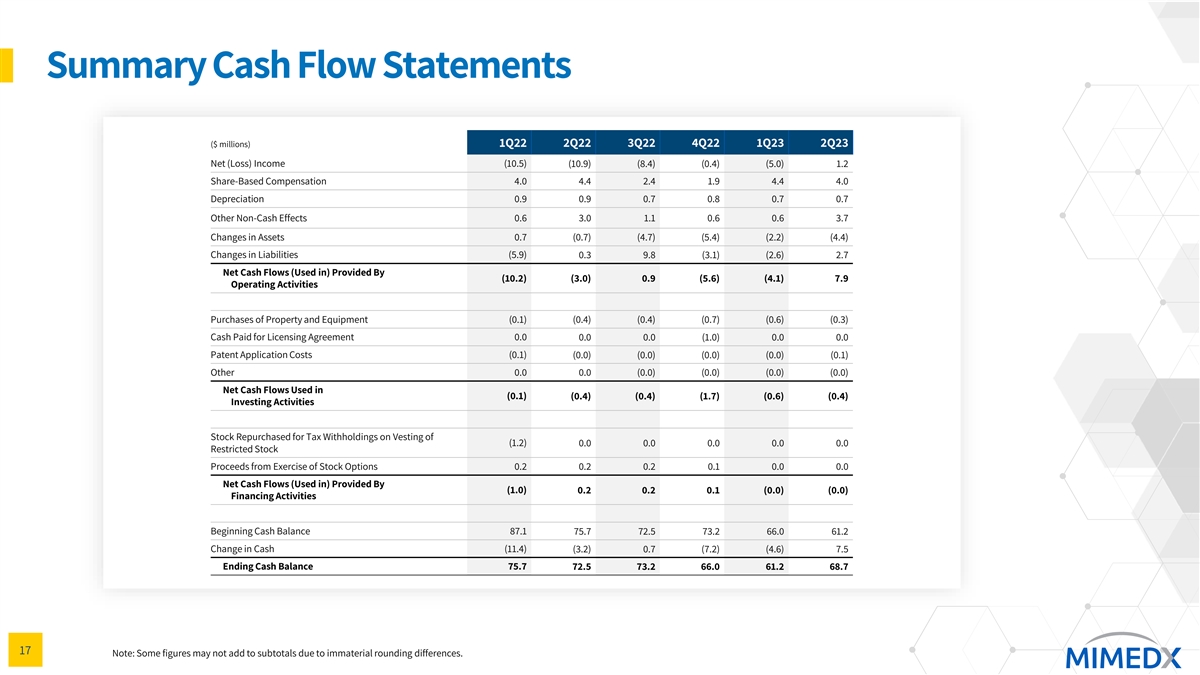
Summary Cash Flow Statements ($ millions) 1Q22 2Q22 3Q22 4Q22 1Q23 2Q23
Net (Loss) Income (10.5) (10.9) (8.4) (0.4) (5.0) 1.2 Share-Based Compensation 4.0 4.4 2.4 1.9 4.4 4.0 Depreciation 0.9 0.9 0.7 0.8 0.7 0.7 Other Non-Cash Effects 0.6 3.0 1.1 0.6 0.6 3.7 Changes in Assets 0.7 (0.7) (4.7) (5.4) (2.2) (4.4) Changes in
Liabilities (5.9) 0.3 9.8 (3.1) (2.6) 2.7 Net Cash Flows (Used in) Provided By (10.2) (3.0) 0.9 (5.6) (4.1) 7.9 Operating Activities Purchases of Property and Equipment (0.1) (0.4) (0.4) (0.7) (0.6) (0.3) Cash Paid for Licensing Agreement 0.0 0.0
0.0 (1.0) 0.0 0.0 Patent Application Costs (0.1) (0.0) (0.0) (0.0) (0.0) (0.1) Other 0.0 0.0 (0.0) (0.0) (0.0) (0.0) Net Cash Flows Used in (0.1) (0.4) (0.4) (1.7) (0.6) (0.4) Investing Activities Stock Repurchased for Tax Withholdings on Vesting of
(1.2) 0.0 0.0 0.0 0.0 0.0 Restricted Stock Proceeds from Exercise of Stock Options 0.2 0.2 0.2 0.1 0.0 0.0 Net Cash Flows (Used in) Provided By (1.0) 0.2 0.2 0.1 (0.0) (0.0) Financing Activities Beginning Cash Balance 87.1 75.7 72.5 73.2 66.0 61.2
Change in Cash (11.4) (3.2) 0.7 (7.2) (4.6) 7.5 Ending Cash Balance 75.7 72.5 73.2 66.0 61.2 68.7 17 Note: Some figures may not add to subtotals due to immaterial rounding differences. y
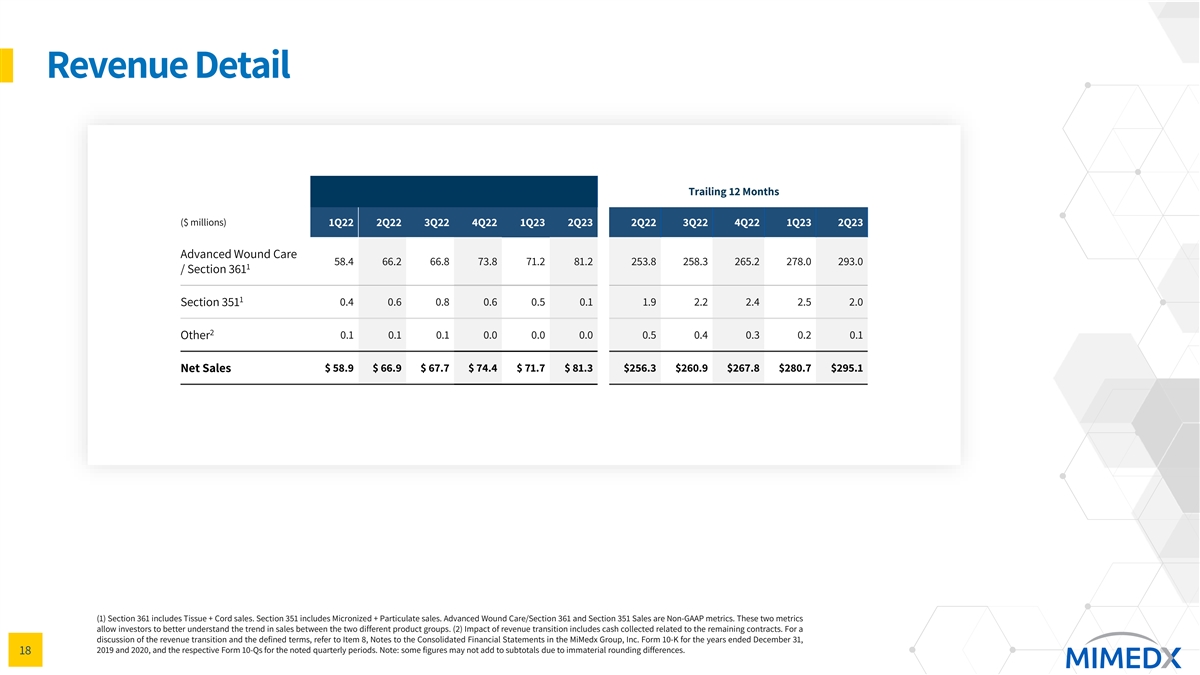
Revenue Detail Trailing 12 Months ($ millions) 1Q22 2Q22 3Q22 4Q22 1Q23
2Q23 2Q22 3Q22 4Q22 1Q23 2Q23 Advanced Wound Care 58.4 66.2 66.8 73.8 71.2 81.2 253.8 258.3 265.2 278.0 293.0 1 / Section 361 1 Section 351 0.4 0.6 0.8 0.6 0.5 0.1 1.9 2.2 2.4 2.5 2.0 2 Other 0.1 0.1 0.1 0.0 0.0 0.0 0.5 0.4 0.3 0.2 0.1 $ 58.9 $ 66.9
$ 67.7 $ 74.4 $ 71.7 $ 81.3 $256.3 $260.9 $267.8 $280.7 $295.1 Net Sales (1) Section 361 includes Tissue + Cord sales. Section 351 includes Micronized + Particulate sales. Advanced Wound Care/Section 361 and Section 351 Sales are Non-GAAP metrics.
These two metrics allow investors to better understand the trend in sales between the two different product groups. (2) Impact of revenue transition includes cash collected related to the remaining contracts. For a discussion of the revenue
transition and the defined terms, refer to Item 8, Notes to the Consolidated Financial Statements in the MiMedx Group, Inc. Form 10-K for the years ended December 31, 2019 and 2020, and the respective Form 10-Qs for the noted quarterly periods.
Note: some figures may not add to subtotals due to immaterial rounding differences. 18 y
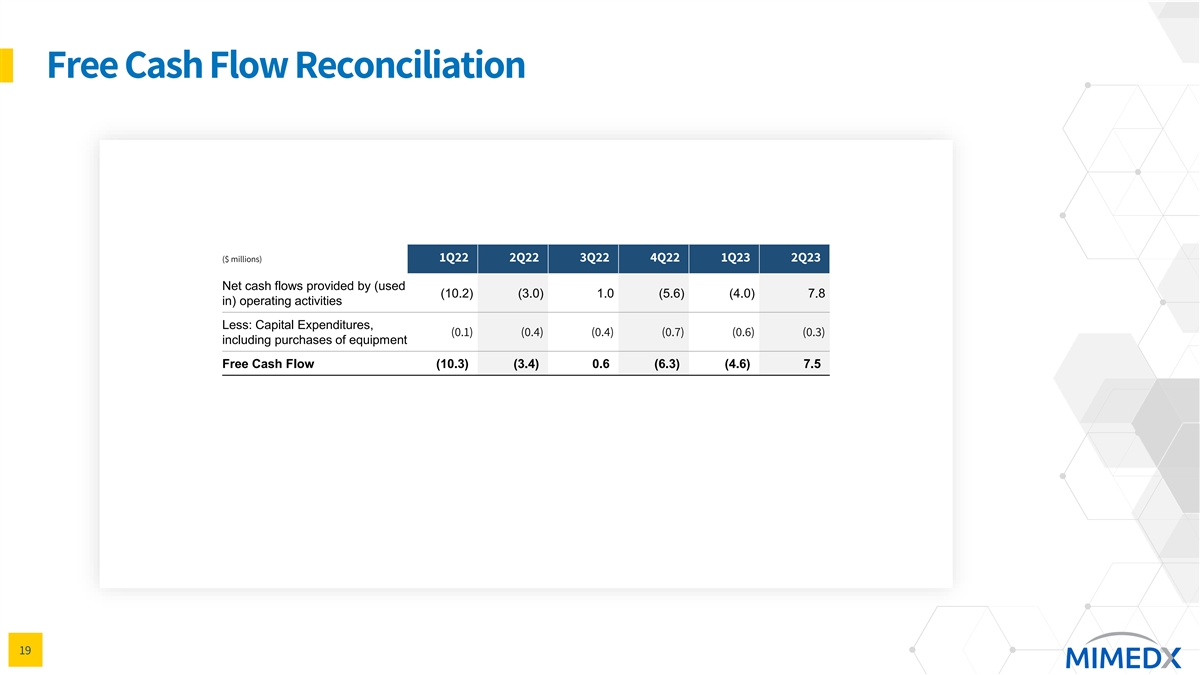
Free Cash Flow Reconciliation 1Q22 2Q22 3Q22 4Q22 1Q23 2Q23 ($
millions) Net cash flows provided by (used (10.2) (3.0) 1.0 (5.6) (4.0) 7.8 in) operating activities Less: Capital Expenditures, (0.1) (0.4) (0.4) (0.7) (0.6) (0.3) including purchases of equipment Free Cash Flow (10.3) (3.4) 0.6 (6.3) (4.6) 7.5 19
y
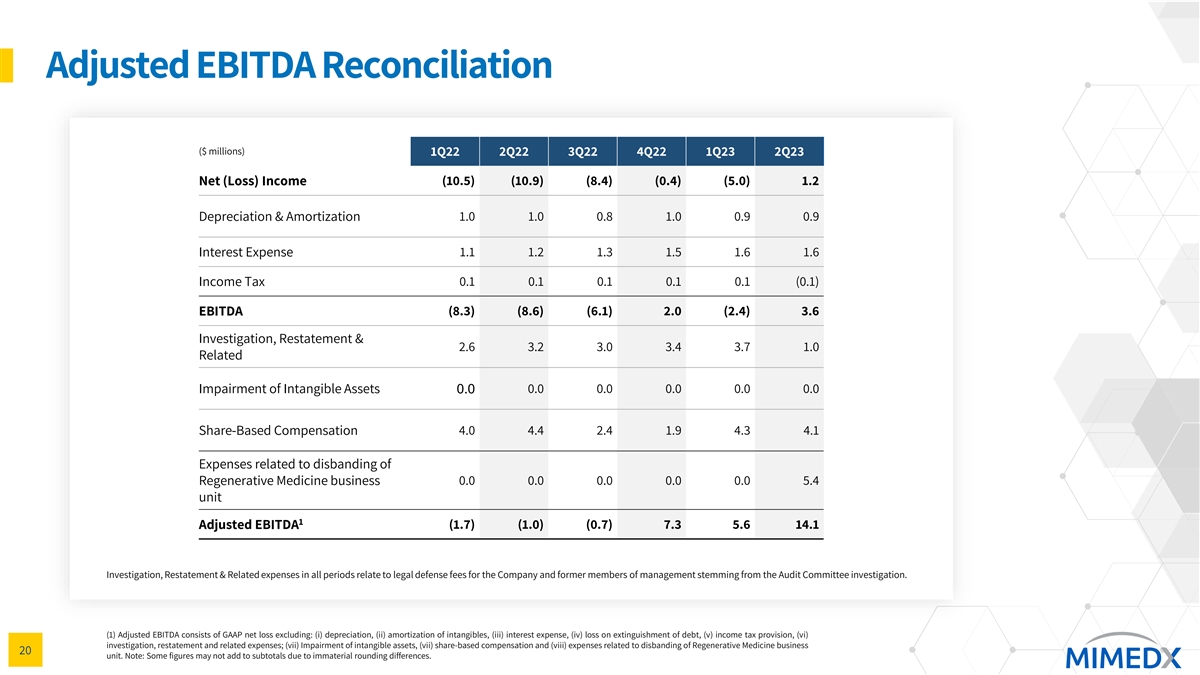
Adjusted EBITDA Reconciliation ($ millions) 1Q22 2Q22 3Q22 4Q22 1Q23
2Q23 Net (Loss) Income (10.5) (10.9) (8.4) (0.4) (5.0) 1.2 Depreciation & Amortization 1.0 1.0 0.8 1.0 0.9 0.9 Interest Expense 1.1 1.2 1.3 1.5 1.6 1.6 Income Tax 0.1 0.1 0.1 0.1 0.1 (0.1) (8.3) (8.6) (6.1) 2.0 (2.4) 3.6 EBITDA Investigation,
Restatement & 2.6 3.2 3.0 3.4 3.7 1.0 Related Impairment of Intangible Assets 0.0 0.0 0.0 0.0 0.0 0.0 Share-Based Compensation 4.0 4.4 2.4 1.9 4.3 4.1 Expenses related to disbanding of Regenerative Medicine business 0.0 0.0 0.0 0.0 0.0 5.4 unit
1 Adjusted EBITDA (1.7) (1.0) (0.7) 7.3 5.6 14.1 Investigation, Restatement & Related expenses in all periods relate to legal defense fees for the Company and former members of management stemming from the Audit Committee investigation. (1)
Adjusted EBITDA consists of GAAP net loss excluding: (i) depreciation, (ii) amortization of intangibles, (iii) interest expense, (iv) loss on extinguishment of debt, (v) income tax provision, (vi) investigation, restatement and related expenses;
(vii) Impairment of intangible assets, (vii) share-based compensation and (viii) expenses related to disbanding of Regenerative Medicine business 20 unit. Note: Some figures may not add to subtotals due to immaterial rounding differences.
y

Segment Data Wound & Surgical ($ millions) 1Q22 2Q22 3Q22 4Q22 1Q23
2Q23 Net Sales 58.3 66.1 66.9 73.6 70.6 80.5 Cost of Sales (9.1) (10.8) (11.2) (13.3) (11.3) -12.7 Selling, General and Administrative (34.0) (38.7) (35.5) (37.6) (37.7) -38.5 Expense Research and Development Expense (2.0) (2.4) (1.7) (1.8) (1.5)
-1.6 Segment Contribution 13.2 14.2 18.5 20.8 20.1 27.6 Regenerative Medicine ($ millions) 1Q22 2Q22 3Q22 4Q22 1Q23 2Q23 Net Sales 0.0 0.0 0.0 0.0 0.0 0.0 Cost of Sales 0.0 0.0 0.0 0.0 0.0 0.0 Selling, General and Administrative 0.0 0.0 0.0 0.0 0.0
0.0 Expense Research and Development Expense (4.0) (3.1) (4.3) (3.6) (5.0) (6.8) Restructuring Expense 0.0 0.0 0.0 0.0 0.0 (3.3) Segment Contribution (4.0) (3.1) (4.3) (3.6) (5.0) (10.1) 21 Note: Some figures may not add to subtotals due to
immaterial rounding differences. y
v3.23.2
| X |
- DefinitionBoolean flag that is true when the XBRL content amends previously-filed or accepted submission.
| Name: |
dei_AmendmentFlag |
| Namespace Prefix: |
dei_ |
| Data Type: |
xbrli:booleanItemType |
| Balance Type: |
na |
| Period Type: |
duration |
|
| X |
- DefinitionFor the EDGAR submission types of Form 8-K: the date of the report, the date of the earliest event reported; for the EDGAR submission types of Form N-1A: the filing date; for all other submission types: the end of the reporting or transition period. The format of the date is YYYY-MM-DD.
| Name: |
dei_DocumentPeriodEndDate |
| Namespace Prefix: |
dei_ |
| Data Type: |
xbrli:dateItemType |
| Balance Type: |
na |
| Period Type: |
duration |
|
| X |
- DefinitionThe type of document being provided (such as 10-K, 10-Q, 485BPOS, etc). The document type is limited to the same value as the supporting SEC submission type, or the word 'Other'.
| Name: |
dei_DocumentType |
| Namespace Prefix: |
dei_ |
| Data Type: |
dei:submissionTypeItemType |
| Balance Type: |
na |
| Period Type: |
duration |
|
| X |
- DefinitionAddress Line 1 such as Attn, Building Name, Street Name
| Name: |
dei_EntityAddressAddressLine1 |
| Namespace Prefix: |
dei_ |
| Data Type: |
xbrli:normalizedStringItemType |
| Balance Type: |
na |
| Period Type: |
duration |
|
| X |
- Definition
+ References
+ Details
| Name: |
dei_EntityAddressCityOrTown |
| Namespace Prefix: |
dei_ |
| Data Type: |
xbrli:normalizedStringItemType |
| Balance Type: |
na |
| Period Type: |
duration |
|
| X |
- DefinitionCode for the postal or zip code
| Name: |
dei_EntityAddressPostalZipCode |
| Namespace Prefix: |
dei_ |
| Data Type: |
xbrli:normalizedStringItemType |
| Balance Type: |
na |
| Period Type: |
duration |
|
| X |
- DefinitionName of the state or province.
| Name: |
dei_EntityAddressStateOrProvince |
| Namespace Prefix: |
dei_ |
| Data Type: |
dei:stateOrProvinceItemType |
| Balance Type: |
na |
| Period Type: |
duration |
|
| X |
- DefinitionA unique 10-digit SEC-issued value to identify entities that have filed disclosures with the SEC. It is commonly abbreviated as CIK. Reference 1: http://www.xbrl.org/2003/role/presentationRef
-Publisher SEC
-Name Exchange Act
-Number 240
-Section 12
-Subsection b-2
| Name: |
dei_EntityCentralIndexKey |
| Namespace Prefix: |
dei_ |
| Data Type: |
dei:centralIndexKeyItemType |
| Balance Type: |
na |
| Period Type: |
duration |
|
| X |
- DefinitionIndicate if registrant meets the emerging growth company criteria. Reference 1: http://www.xbrl.org/2003/role/presentationRef
-Publisher SEC
-Name Exchange Act
-Number 240
-Section 12
-Subsection b-2
| Name: |
dei_EntityEmergingGrowthCompany |
| Namespace Prefix: |
dei_ |
| Data Type: |
xbrli:booleanItemType |
| Balance Type: |
na |
| Period Type: |
duration |
|
| X |
- DefinitionCommission file number. The field allows up to 17 characters. The prefix may contain 1-3 digits, the sequence number may contain 1-8 digits, the optional suffix may contain 1-4 characters, and the fields are separated with a hyphen.
| Name: |
dei_EntityFileNumber |
| Namespace Prefix: |
dei_ |
| Data Type: |
dei:fileNumberItemType |
| Balance Type: |
na |
| Period Type: |
duration |
|
| X |
- DefinitionTwo-character EDGAR code representing the state or country of incorporation.
| Name: |
dei_EntityIncorporationStateCountryCode |
| Namespace Prefix: |
dei_ |
| Data Type: |
dei:edgarStateCountryItemType |
| Balance Type: |
na |
| Period Type: |
duration |
|
| X |
- DefinitionThe exact name of the entity filing the report as specified in its charter, which is required by forms filed with the SEC. Reference 1: http://www.xbrl.org/2003/role/presentationRef
-Publisher SEC
-Name Exchange Act
-Number 240
-Section 12
-Subsection b-2
| Name: |
dei_EntityRegistrantName |
| Namespace Prefix: |
dei_ |
| Data Type: |
xbrli:normalizedStringItemType |
| Balance Type: |
na |
| Period Type: |
duration |
|
| X |
- DefinitionThe Tax Identification Number (TIN), also known as an Employer Identification Number (EIN), is a unique 9-digit value assigned by the IRS. Reference 1: http://www.xbrl.org/2003/role/presentationRef
-Publisher SEC
-Name Exchange Act
-Number 240
-Section 12
-Subsection b-2
| Name: |
dei_EntityTaxIdentificationNumber |
| Namespace Prefix: |
dei_ |
| Data Type: |
dei:employerIdItemType |
| Balance Type: |
na |
| Period Type: |
duration |
|
| X |
- DefinitionLocal phone number for entity.
| Name: |
dei_LocalPhoneNumber |
| Namespace Prefix: |
dei_ |
| Data Type: |
xbrli:normalizedStringItemType |
| Balance Type: |
na |
| Period Type: |
duration |
|
| X |
- DefinitionBoolean flag that is true when the Form 8-K filing is intended to satisfy the filing obligation of the registrant as pre-commencement communications pursuant to Rule 13e-4(c) under the Exchange Act. Reference 1: http://www.xbrl.org/2003/role/presentationRef
-Publisher SEC
-Name Exchange Act
-Number 240
-Section 13e
-Subsection 4c
| Name: |
dei_PreCommencementIssuerTenderOffer |
| Namespace Prefix: |
dei_ |
| Data Type: |
xbrli:booleanItemType |
| Balance Type: |
na |
| Period Type: |
duration |
|
| X |
- DefinitionBoolean flag that is true when the Form 8-K filing is intended to satisfy the filing obligation of the registrant as pre-commencement communications pursuant to Rule 14d-2(b) under the Exchange Act. Reference 1: http://www.xbrl.org/2003/role/presentationRef
-Publisher SEC
-Name Exchange Act
-Number 240
-Section 14d
-Subsection 2b
| Name: |
dei_PreCommencementTenderOffer |
| Namespace Prefix: |
dei_ |
| Data Type: |
xbrli:booleanItemType |
| Balance Type: |
na |
| Period Type: |
duration |
|
| X |
- DefinitionTitle of a 12(b) registered security. Reference 1: http://www.xbrl.org/2003/role/presentationRef
-Publisher SEC
-Name Exchange Act
-Number 240
-Section 12
-Subsection b
| Name: |
dei_Security12bTitle |
| Namespace Prefix: |
dei_ |
| Data Type: |
dei:securityTitleItemType |
| Balance Type: |
na |
| Period Type: |
duration |
|
| X |
- DefinitionName of the Exchange on which a security is registered. Reference 1: http://www.xbrl.org/2003/role/presentationRef
-Publisher SEC
-Name Exchange Act
-Number 240
-Section 12
-Subsection d1-1
| Name: |
dei_SecurityExchangeName |
| Namespace Prefix: |
dei_ |
| Data Type: |
dei:edgarExchangeCodeItemType |
| Balance Type: |
na |
| Period Type: |
duration |
|
| X |
- DefinitionBoolean flag that is true when the Form 8-K filing is intended to satisfy the filing obligation of the registrant as soliciting material pursuant to Rule 14a-12 under the Exchange Act. Reference 1: http://www.xbrl.org/2003/role/presentationRef
-Publisher SEC
-Name Exchange Act
-Section 14a
-Number 240
-Subsection 12
| Name: |
dei_SolicitingMaterial |
| Namespace Prefix: |
dei_ |
| Data Type: |
xbrli:booleanItemType |
| Balance Type: |
na |
| Period Type: |
duration |
|
| X |
- DefinitionTrading symbol of an instrument as listed on an exchange.
| Name: |
dei_TradingSymbol |
| Namespace Prefix: |
dei_ |
| Data Type: |
dei:tradingSymbolItemType |
| Balance Type: |
na |
| Period Type: |
duration |
|
| X |
- DefinitionBoolean flag that is true when the Form 8-K filing is intended to satisfy the filing obligation of the registrant as written communications pursuant to Rule 425 under the Securities Act. Reference 1: http://www.xbrl.org/2003/role/presentationRef
-Publisher SEC
-Name Securities Act
-Number 230
-Section 425
| Name: |
dei_WrittenCommunications |
| Namespace Prefix: |
dei_ |
| Data Type: |
xbrli:booleanItemType |
| Balance Type: |
na |
| Period Type: |
duration |
|
MiMedx (NASDAQ:MDXG)
과거 데이터 주식 차트
부터 4월(4) 2024 으로 5월(5) 2024

MiMedx (NASDAQ:MDXG)
과거 데이터 주식 차트
부터 5월(5) 2023 으로 5월(5) 2024
