UNITED STATES
SECURITIES AND EXCHANGE COMMISSION
Washington, D.C. 20549
FORM 6-K
REPORT OF FOREIGN PRIVATE ISSUER PURSUANT TO RULE 13a-16 OR 15d-16
UNDER THE SECURITIES EXCHANGE ACT OF 1934
For the month of June 2024
Commission File Number: 001-41579
American Lithium Corp.
(Translation of registrant's name into English)
1030 West Georgia St., Suite 710
Vancouver, BC
Canada V6E 2Y3
(Address of principal executive office)
Indicate by check mark whether the registrant files or will file annual reports under cover of Form 20-F or Form 40-F.
Form 20-F ☐ Form 40-F ☒
SIGNATURES
Pursuant to the requirements of the Securities Exchange Act of 1934, the registrant has duly caused this report to be signed on its behalf by the undersigned, thereunto duly authorized.
|
|
American Lithium Corp.
(Registrant)
|
| |
|
| Date: June 12, 2024 |
/s/ Simon Clarke |
| |
Simon Clarke
Chief Executive Officer & Director |
EXHIBIT INDEX
FALCHANI LITHIUM PROJECT
NI 43-101 TECHNICAL REPORT
PRELIMINARY ECONOMIC ASSESSMENT - UPDATE
Prepared for:
AMERICAN LITHIUM CORP.
Effective Date: 10 JANUARY 2024
Report Date: 22 FEBRUARY 2024
Prepared By:
DRA PACIFIC
L7 256 Adelaide Terrace
Perth, Western Australia, 6000
SIGNED BY QUALIFIED PERSONS
John Joseph Riordan BSc, CEng, FAusIMM, MIChemE, RPEQ
Aveshan Naidoo MBA, BSc, PrEng, MSAIMM
Derek J. Loveday, P.Geo
Mariea Kartick, P.Geo
David Alan Thompson B-Tech, Pr Cert Eng, SACMA
Falchani Lithium Project
Puno District of Peru
Project No: GPEPPR7027
| GPEPPR7027-000-REP-PM-001 |
Page i of xxv |
Important Notice
DRA Note
This report was prepared as a National Instrument 43-101 Technical Report for American Lithium by DRA Pacific (DRA). The quality of information, conclusions, and estimates contained herein is consistent with the level of effort involved in DRA's services, based on: i) information available at the time of preparation, ii) data supplied by outside sources, and iii) the assumptions, conditions, and qualifications set forth in this report. This report is intended for use by American Lithium subject to the terms and conditions of its contract with DRA and relevant securities legislation. The contract permits American Lithium to file this report as a Technical Report with Canadian securities regulatory authorities pursuant to National Instrument 43-101, Standards of Disclosure for Mineral Projects. Except for the purposes legislated under provincial securities law, any other uses of this report by any third party is at that party's sole risk. The responsibility for this disclosure remains with American Lithium. The user of this document should ensure that this is the most recent Technical Report for the property as it is not valid if a new Technical Report has been issued.
Stantec Note
This notice is an integral component of the American Lithium Corporation Falchani Project Technical Report ("Technical Report" or "Report") and should be read in its entirety and must accompany every copy made of the Technical Report. The Technical Report has been prepared in accordance with the requirements of National Instrument 43-101 Standards of Disclosure for Mineral Projects.
The Technical Report has been prepared for American Lithium Corporation by Stantec Consulting Ltd (Stantec). The Technical Report is based on information and data supplied to Stantec by American Lithium Corporation. The quality of information, conclusions, and estimates contained herein are consistent with the level of effort involved in the services of Stantec, based on: i) information available at the time of preparation of the Report, and ii) the assumptions, conditions, and qualifications set forth in this Report.
| GPEPPR7027-000-REP-PM-001 |
Page ii of xxv |
Each portion of the Technical Report is intended for use by American Lithium Corporation subject to the terms and conditions of its contract (210223585) with the Stantec. Except for the purposes legislated under Canadian provincial and territorial securities law, any other uses of the Technical Report, by any third party, is at that party's sole risk.
The results of the Technical Report represent forward-looking information. The forward-looking information includes pricing assumptions, sales forecasts, projected capital, and operating costs, mine life and production rates, and other assumptions. Readers are cautioned that actual results may vary from those presented. The factors and assumptions used to develop the forward-looking information, and the risks that could cause the actual results to differ materially are presented in the body of this Report.
Stantec has used their experience and industry expertise to produce the estimates in the Technical Report. Where Stantec has made these estimates, they are subject to qualifications and assumptions, and it should also be noted that all estimates contained in the Technical Report may be prone to fluctuations with time and changing industry circumstances.
| GPEPPR7027-000-REP-PM-001 |
Page iii of xxv |
CERTIFICATE OF QUALIFIED PERSON
I, John Joseph Riordan, BSc, CEng, FAuslMM, MIChemE, RPEQ do hereby certify that:
1. I am Process Engineering Manager for DRA Pacific Limited of 256 Adelaide Terrace, Perth, Western Australia.
2. This certificate applies to the technical report titled "Falchani Project NI43-101 Technical Report Preliminary Economic Assessment Update," (the ''Technical Report"), prepared for American Lithium Corporation.
3. The Effective Date of the Technical Report is 10 January 2024.
4. I am a graduate of Cork Institute of Technology with a Bachelor of Science degree in Chemical Engineering (1986). I have worked as a metallurgist and process engineer continuously for a total of 36 years since my graduation and have been involved in the design, construction, commissioning, operation and optimisation of mineral processing and hydrometallurgical plants.
5. I am a Fellow of the Australasian Institute of Mining and Metallurgy (No. 229194), a Chartered Engineer (No. 461184), a Chartered Chemical Engineer (No. 256480), and a Registered Professional Engineer of Queensland (RPEQ No. 22426).
6. I have read the definition of "Qualified Person" set out in National lnstrument 43-101 (NI 43-101) and certify that by reason of my education, affiliation with a professional association (as defined in NI 43-101) and past relevant work experience, I fulfil the requirements to be, a "Qualified Person" for the purposes of NI 43-101.
7. I am the coordinating author of the Technical Report and have carried out or supervised the work done by other DRA professionals for DRA's contribution to the Technical Report. I take responsibility for sections 1.1, 1.5, 1.6, 1.9, 1.10, 1.13, 1.14, 2, 3, 13, 17, 19, 21, 25 and 26, unless subsections are specifically identified by another Qualified Person.
8. I have not visited the property.
9. I am independent of American Lithium Corporation applying all the tests in section 1.5 of NI 43-101.
10. I have not had prior involvement with the property that is the subject of the Technical Report.
11. I have read NI 43-101 and Form 43-101F1; the sections of the Technical Report I am responsible for have been prepared in compliance with that instrument and form.
12. As of the aforementioned Effective Date, to the best of my knowledge, information and belief, the sections of the Technical Report I am responsible for contain all scientific and technical information that is required to be disclosed to make the Technical Report not misleading.
Dated this 23rd day of February 2024.
Signed
/John Joseph Riordan/
John Joseph Riordan, FAuslMM (No. 229194)
DRA Pacific Pty Ltd
| GPEPPR7027-000-REP-PM-001 |
Page iv of xxv |
CERTIFICATE OF QUALIFIED PERSON
I Aveshan Naidoo, do hereby certify that:
1. I am Specialist Engineer: Hydromet and Economics for DRA South Africa Projects (Pty) Ltd of Building 33, Woodlands Office Park, 20 Woodlands Drive, Woodlands, Sandton, 2080.
2. This certificate applies to the technical report titled " Falchani Project NI 43-101 Technical Report - Preliminary Economic Assessment Update ", the ''Technical Report", prepared for American Lithium Corporation.
3. The Effective Date of the Technical Report is 10 January 2024.
4. I am a registered Professional Engineer with the Engineering Council of South Africa (Registration No. 20130523) and graduated from the University of KwaZulu-Natal, South Africa with a Bachelor of Science in Chemical Engineering and a Master of Business Administration at the University of Witwatersrand. I have practiced my profession continuously since 2008.
5. I have read the definition of "Qualified Person" set out in National lnstrument 43-101 (NI 43-101) and certify that by reason of my education, affiliation with a professional association (as defined in NI 43-101) and past relevant work experience, I fulfil the requirements to be, a "Qualified Person" for the purposes of NI 43-101.
6. Responsibilities: Section 22.
7. I am independent of American Lithium Corporation applying all the tests in section 1.5 of NI 43-101.
8. I have not visited the property.
9. I have not had prior involvement with the property that is the subject of the Technical Report.
10. I have read National Instrument 43-101 and Form 43-101F1 and the Technical Report has been prepared in compliance with same.
11. As of the aforementioned Effective Date, to the best of my knowledge, information and belief, the sections of the Technical Report I am responsible for contain all scientific and technical information that is required to be disclosed to make the Technical Report not misleading.
Dated this 23rd day of February 2024.
Signed
Aveshan Naidoo (PrEng 20130523)
DRA South Africa Projects (PTY) Ltd
| GPEPPR7027-000-REP-PM-001 |
Page v of xxv |
CERTIFICATE OF QUALIFIED PERSON
I, David Alan Thompson, B-Tech, Pr Cert Eng, SACMA do hereby certify that:
1. I am Principal Mining Engineer for DRA Projects Pty Ltd of of Building 33 Woodlands Office Park, 20 Woodlands Drive Woodlands, Sandton, 2080, South Africa.
2. This certificate applies to the technical report titled "Falchani Lithium Project NI 43-101 Technical Report - Preliminary Economic Assessment Update," (the ''Technical Report"), prepared for American Lithium Corporation Limited.
3. The Effective Date of the Technical Report is 10January 2024.
4. I am a graduate of University of Johannesburg with a Bacclaureus Technologie Degree in Mining Engineering. I have worked as a mining engineer for a total of 34 years and 11 years since my B-Tech graduation.
5. I am a member of the Engineering Council of South Africa (No. 201190010), and a current member of the South African Colliery Managers Association (5066).
6. I have read the definition of "Qualified Person" set out in National instrument 43-101 (NI 43-101) and certify that by reason of my education, affiliation with a professional association (as defined in NI 43-101) and past relevant work experience, I fulfil the requirements to be, a "Qualified Person" for the purposes of NI 43-101.
7. I am co-author of the Technical Report, and co-author responsible specifically for sections 1.4, 1.9, 1.10,15,16, and 21 unless subsections are specifically identified by another Qualified Person.
8. I have not visited the property but have reviewed all technical documentation available for the project to date.
9. I am independent of American Lithium Corporation applying all the tests in section 1.5 of NI 43-101.
10. I have not had prior involvement with the property that is the subject of the Technical Report.
11. I have read NI 43-101 and Form 43-101F1; the sections of the Technical Report I am responsible for have been prepared in compliance with that instrument and form.
12. As of the aforementioned Effective Date, to the best of my knowledge, information and belief, the sections of the Technical Report I am responsible for contains all scientific and technical information that is required to be disclosed to make the Technical Report not misleading.
Dated this 23th day of February 2024.
Signed
/David Alan Thompson/
David Alan Thompson (ECSA 201190010)
| GPEPPR7027-000-REP-PM-001 |
Page vi of xxv |
CERTIFICATE OF QUALIFIED PERSON
I, Derek J. Loveday, P.Geo., do hereby certify that:
1. I am currently employed as a Project Manager by Stantec Services Inc., 2890 East Cottonwood Parkway Suite 300, Salt Lake City UT 84121-7283.
2. I graduated with a Bachelor of Science Honors Degree in Geology from Rhodes University, Grahamstown, South Africa in 1992.
3. I am a licensed Professional Geoscientist in the Province of Alberta, Canada, #159394. I am registered with the South African Council for Natural Scientific Professions (SACNASP) as a Geological Scientist #400022/03.
4. I have worked as a geologist for a total of thirty years since my graduation from university, both for mining and exploration companies and as a consultant specializing in resource evaluation for precious metals and industrial minerals. I have many years' experience exploring and modelling volcanic hosted metal deposits of high concentrations in the United States, Canada and Australia, as well as stratiform lithium clay deposits and lithium pegmatite deposits in the United States.
5. I have read the definition of "qualified person" set out in National Instrument 43-101 (NI 43-101) and certify that by reason of my education, affiliation with a professional association (as defined in NI 43-101), and past relevant work experience, I meet the requirements to be a "Qualified Person" for the purposes of NI 43-101.
6. I am responsible for the preparation of portions of Sections 1,2, 25, 26 and 27; and the entirety of Sections 4 through 12, 14,15 and Section 23 of this Technical Report titled "Falchani Project NI 43-101 Technical Report- Preliminary Economic Assessment Update"
7. I have read NI 43-101 and Form 43-101F1, and the Technical Report has been prepared in compliance with that instrument and form.
8. I personally inspected the property in May 2023.
9. At the effective date of the Technical Report, to the best of my knowledge, information, and belief, the Technical Report contains all scientific and technical information that is required to be disclosed to make the Technical Report not misleading.
10. I am not aware of any material fact or material change with respect to the subject matter of the Technical Report that is not reflected in the Report, the omission to disclose which makes the Report misleading.
11. I am independent of the issuer applying all of the tests in Part 1.5 of NI 43-101CP.
Dated December 14, 2023
| |
|
"Original Signed and Sealed by Author" |
| |
|
|
| |
|
Derek J. Loveday, P.Geo. |
| |
|
Project Manager |
| GPEPPR7027-000-REP-PM-001 |
Page vii of xxv |
CERTIFICATE OF QUALIFIED PERSON
. I, Mariea K. Kartick, P.Geo., do hereby certify that:
1. I am currently employed as a Resource Geologist by Stantec Services Inc., 410 17th Street Suite 1400 Denver, CO 80402.
2. I graduated with a Master of Science Degree in Geology in 2015 and a Bachelor of Science Degree with Honors in 2014 from the University of Toronto in Toronto, Canada.
3. I am a licensed Professional Geoscientist in the Province of Ontario, Canada. I am a member in-good-standing of the Association of Professional Geoscientist of Ontario (Member 3226) since February 24, 2020.
4. I have worked as a geologist for a total of ten years since my graduation from university, both for mining and exploration companies and as a consultant specializing in resource evaluation for precious metals and critical minerals. I have many years' experience exploring and modelling volcanic hosted metal deposits of high concentrations in the United States, Canada and Mexico, as well as stratiform lithium clay deposits and lithium pegmatite deposits in the United States.
5. I have read the definition of "qualified person" set out in National Instrument 43-101 (NI 43-101) and certify that by reason of my education, affiliation with a professional association (as defined in NI 43-101), and past relevant work experience, I meet the requirements to be a "Qualified Person" for the purposes of NI 43-101.
6. I am responsible for portions of Sections 1,2, 25, 26 and 27; and the entirety of Sections 4 through 12, 14,15 and Section 23 of this Technical Report titled "Falchani Project NI 43-101 Technical Report- Preliminary Economic Assessment Update"
7. I have read NI 43-101 and Form 43-101F1, and the Technical Report has been prepared in compliance with that instrument and form.
8. I personally inspected the property in May 2023.
9. I have not had any prior involvement with the property that is the subject of this Technical Report.
10. At the effective date of the Technical Report, to the best of my knowledge, information, and belief, the Technical Report contains all scientific and technical information that is required to be disclosed to make the Technical Report not misleading.
11. I am not aware of any material fact or material change with respect to the subject matter of the Technical Report that is not reflected in the Report, the omission to disclose which makes the Report misleading.
12. I am independent of the issuer applying all of the tests in Part 1.5 of NI 43-101CP.
| Dated December 14, 2023 |
"Original Signed and Sealed by Author" |
| |
_________________________________ |
| |
Mariea K. Kartick P.Geo. |
| |
Resource Geologist |
| GPEPPR7027-000-REP-PM-001 |
Page viii of xxv |
Table of Contents
| 1 SUMMARY |
1 |
| |
|
| 1.1 Introduction |
1 |
| |
|
| 1.2 Geology & Mineralization |
2 |
| |
|
| 1.3 Mineral Resource Estimation |
2 |
| |
|
| 1.4 Mining Methods |
4 |
| |
|
| 1.4.1 Mine Planning |
5 |
| |
|
| 1.4.2 Mine Sequencing/Scheduling |
6 |
| |
|
| 1.5 Mineral Processing & Metallurgical Testing |
7 |
| |
|
| 1.6 Market Studies and Contracts |
9 |
| |
|
| 1.7 Environmental Studies, Permitting & Social Considerations |
10 |
| |
|
| 1.7.1 Environmental Assessment |
10 |
| |
|
| 1.7.2 Permitting |
10 |
| |
|
| 1.7.3 Social or Community-Related Requirements |
11 |
| |
|
| 1.8 Project Infrastructure |
11 |
| |
|
| 1.8.1 Access Roads |
12 |
| |
|
| 1.8.2 Power Supply |
12 |
| |
|
| 1.8.3 Water Supply |
12 |
| |
|
| 1.8.4 Tailings Transportation and Storage |
12 |
| |
|
| 1.9 Capital Cost Estimate |
13 |
| |
|
| 1.10 Operating Cost Estimate |
14 |
| |
|
| 1.11 Economic Outcomes |
15 |
| |
|
| 1.11.1 Introduction |
15 |
| |
|
| 1.11.2 Economic Outcomes |
15 |
| GPEPPR7027-000-REP-PM-001 |
Page ix of xxv |
| 1.11.3 Sensitivity |
16 |
| |
|
| 1.12 Adjacent Properties |
17 |
| |
|
| 1.13 Interpretations and Conclusions |
18 |
| |
|
| 1.14 Recommendations |
19 |
| |
|
| 2 INTRODUCTION |
21 |
| |
|
| 2.1 Background |
21 |
| |
|
| 2.2 Project Scope and Terms of Reference |
22 |
| |
|
| 2.3 Study Participants |
22 |
| |
|
| 2.4 Primary Information Sources |
22 |
| |
|
| 2.5 Qualified Persons |
23 |
| |
|
| 2.6 Qualified Person Site Visit |
25 |
| |
|
| 2.7 Financial Interest Disclaimer |
25 |
| |
|
| 2.8 Frequently Used Abbreviations, Acronyms and Units of Measure |
25 |
| |
|
| 3 RELIANCE ON OTHER EXPERTS |
30 |
| |
|
| 4 PROPERTY DESCRIPTION AND LOCATION |
31 |
| |
|
| 4.1 Description and Location |
31 |
| |
|
| 4.2 Mineral Tenure |
32 |
| |
|
| 4.2.1 Regulatory Mechanism |
32 |
| |
|
| 4.2.2 Property and Title |
32 |
| |
|
| 4.2.3 Environmental Regulations |
33 |
| |
|
| 4.2.4 Granting of Mining Concessions |
33 |
| |
|
| 4.2.5 Work Program for Mining Concessions |
33 |
| |
|
| 4.2.6 Mining Concession Description |
34 |
| |
|
| 4.2.7 Conclusions and Limitations |
35 |
| |
|
| 5 ACCESSIBILITY, CLIMATE, LOCAL RESOURCES, INFRASTRUCTURE AND PHYSIOGRAPHY |
39 |
| GPEPPR7027-000-REP-PM-001 |
Page x of xxv |
| 5.1 Accessibility to Site |
39 |
| |
|
| 5.2 Access to Land |
39 |
| |
|
| 5.3 Climate |
40 |
| |
|
| 5.4 Local Resources |
40 |
| |
|
| 5.5 Infrastructure |
40 |
| |
|
| 5.6 Physiography |
41 |
| |
|
| 6 HISTORY |
42 |
| |
|
| 6.1 Introduction |
42 |
| |
|
| 6.2 Ownership History |
42 |
| |
|
| 6.2.1 Uranium Price Fluctuations |
42 |
| |
|
| 6.2.2 Macusani Yellowcake |
42 |
| |
|
| 6.2.3 The Cameco-Vena Joint Venture |
43 |
| |
|
| 6.2.4 Azincourt buys Minergia |
43 |
| |
|
| 6.2.5 Macusani purchases Minergia |
43 |
| |
|
| 6.2.6 Macusani changes name to Plateau Uranium Inc. |
43 |
| |
|
| 6.2.7 Plateau Uranium Inc. changes name to Plateau Energy Metals Inc. |
43 |
| |
|
| 6.2.8 American Lithium Corp. Acquires Plateau Energy Metals |
43 |
| |
|
| 6.3 Previous Regional Exploration |
44 |
| |
|
| 6.3.1 Instituto Peruano de Energia Nuclear |
44 |
| |
|
| 6.3.2 UNDP/IAEA |
44 |
| |
|
| 6.4 Property Exploration |
45 |
| |
|
| 6.5 Historic estimates |
45 |
| |
|
| 6.6 Mining Studies |
46 |
| |
|
| 6.7 Mineral Processing and Metallurgical Testing |
47 |
| |
|
| 7 GEOLOGICAL SETTING AND MINERALIZATION |
48 |
| |
|
| 7.1 Introduction |
48 |
| GPEPPR7027-000-REP-PM-001 |
Page xi of xxv |
| 7.2 Regional Geology |
48 |
| |
|
| 7.3 Local Geology |
50 |
| |
|
| 7.3.1 Mineral Occurrences |
50 |
| |
|
| 7.3.2 Structural Geology |
52 |
| |
|
| 7.4 Property Geology |
54 |
| |
|
| 7.5 Mineralization |
59 |
| |
|
| 8 DEPOSIT TYPES |
60 |
| |
|
| 9 EXPLORATION |
61 |
| |
|
| 10 DRILLING Program |
63 |
| |
|
| 10.1 Drilling methodology |
63 |
| |
|
| 10.2 Sample Recovery and Core |
67 |
| |
|
| 11 SAMPLE PREPARATION, ANALYSES AND SECURITY |
68 |
| |
|
| 11.1 Introduction |
68 |
| |
|
| 11.2 Sample Recovery |
68 |
| |
|
| 11.3 Sample Quality |
68 |
| |
|
| 11.3.1 Sample Preparation |
68 |
| |
|
| 11.3.2 Sample Delivery Procedures |
69 |
| |
|
| 11.3.3 Sample Preparation and Analysis |
69 |
| |
|
| 12 DATA VERIFICATION |
76 |
| |
|
| 12.1 Introduction |
76 |
| |
|
| 12.2 Property Investigation, Sample and Documentation Review |
76 |
| |
|
| 12.2.1 Data Validation Limitation |
78 |
| |
|
| 12.3 Opinion of the Independent Qualified Person |
78 |
| |
|
| 13 METALLURGY AND METALLURGICAL TESTING |
81 |
| |
|
| 13.1 Introduction |
81 |
| |
|
| 13.2 Sampling background |
81 |
| GPEPPR7027-000-REP-PM-001 |
Page xii of xxv |
| 13.3 PEA Update Testwork |
82 |
| |
|
| 13.3.1 Introduction |
82 |
| |
|
| 13.3.2 Phase II Testwork |
83 |
| |
|
| 13.3.3 Phase III Testwork |
83 |
| |
|
| 13.3.4 Effect of Varying Acidity |
84 |
| |
|
| 13.3.5 By-product Recovery |
85 |
| |
|
| 13.3.6 Other Testwork Data |
85 |
| |
|
| 14 MINERAL RESOURCE ESTIMATES |
86 |
| |
|
| 14.1 Approach |
86 |
| |
|
| 14.2 Basis for Resource Estimation |
86 |
| |
|
| 14.3 Socioeconomic and Government Factors |
87 |
| |
|
| 14.4 Data Sources |
87 |
| |
|
| 14.5 Model |
88 |
| |
|
| 14.5.1 Model Inputs |
94 |
| |
|
| 14.5.2 Surface Topography |
94 |
| |
|
| 14.5.3 Structural features |
94 |
| |
|
| 14.5.4 Model Zones |
95 |
| |
|
| 14.5.5 Metal Grade Statistics within the Mineralized Zone |
97 |
| |
|
| 14.5.6 Density |
100 |
| |
|
| 14.5.7 Model Build |
101 |
| |
|
| 14.6 Assessment of Reasonable Prospects for Economic Extraction |
104 |
| |
|
| 14.7 Lithium Resource Estimates |
104 |
| |
|
| 14.8 Potential Risks |
109 |
| |
|
| 15 MINERAL RESERVE ESTIMATES |
110 |
| |
|
| 16 MINING METHODS |
111 |
| |
|
| 16.1 Introduction |
111 |
| GPEPPR7027-000-REP-PM-001 |
Page xiii of xxv |
| 16.2 Conclusions and Limitations |
112 |
| |
|
| 16.3 Units of Measure |
112 |
| |
|
| 16.4 Sources of Information |
113 |
| |
|
| 16.5 Geotechnical |
114 |
| |
|
| 16.6 Current Surveys |
115 |
| |
|
| 16.7 Stantec Resource Estimate |
116 |
| |
|
| 16.8 Open Pit Optimization |
120 |
| |
|
| 16.8.1 Block Models |
120 |
| |
|
| 16.8.2 Pit Optimization Parameters |
121 |
| |
|
| 16.8.3 Pit Optimization Results |
123 |
| |
|
| 16.9 Mine Planning |
125 |
| |
|
| 16.9.1 Dilution and Loss |
126 |
| |
|
| 16.9.2 Mine Sequencing/Scheduling |
126 |
| |
|
| 16.10 Open Pit Mine Operations |
133 |
| |
|
| 16.11 Waste Dumps |
134 |
| |
|
| 16.12 Mining Shift Cycles and Equipment |
134 |
| |
|
| 16.12.1 Blast Hole Drilling |
136 |
| |
|
| 16.12.2 Blasting |
137 |
| |
|
| 16.12.3 Explosive Design |
137 |
| |
|
| 16.12.4 Loading and Hauling |
137 |
| |
|
| 16.12.5 Production Equipment |
137 |
| |
|
| 16.12.6 Pit Access |
139 |
| |
|
| 16.12.7 Mining Personnel Estimate |
139 |
| |
|
| 16.13 Contractor Mining Benchmarked Opex |
142 |
| |
|
| 17 RECOVERY METHODS |
144 |
| |
|
| 17.1 Introduction |
144 |
| GPEPPR7027-000-REP-PM-001 |
Page xiv of xxv |
| 17.2 Design Criteria |
145 |
| |
|
| 17.3 Power and Water Consumption |
146 |
| |
|
| 17.3.1 Base Case (Phase 1) |
146 |
| |
|
| 17.3.2 Alternate Case |
147 |
| |
|
| 17.4 Process Block Flow Sheet & Process Plant Layout |
147 |
| |
|
| 17.5 Process Description |
151 |
| |
|
| 17.5.1 Area 100 - Crushing |
151 |
| |
|
| 17.5.2 Area 200 - Milling |
151 |
| |
|
| 17.5.3 Area 400 - Leaching |
151 |
| |
|
| 17.5.4 Area 500 - Pre-neutralisation |
152 |
| |
|
| 17.5.5 Area 600 - Impurity Removal |
152 |
| |
|
| 17.5.6 Area 700 - Softening |
153 |
| |
|
| 17.5.7 Area 800 - SulfateSulfate of Potash Separation |
153 |
| |
|
| 17.5.8 Area 900 - Fluoride Ion Exchange and Product Precipitation |
156 |
| |
|
| 17.5.9 Area 1000 - Product Drying and Packaging |
156 |
| |
|
| 17.5.10 Area 1100 - Tailings |
157 |
| |
|
| 17.5.11 Reagents |
157 |
| |
|
| 18 PROJECT INFRASTRUCTURE |
159 |
| |
|
| 18.1 Introduction |
159 |
| |
|
| 18.2 Access Roads |
159 |
| |
|
| 18.3 Raw Water Supply |
161 |
| |
|
| 18.4 Power Supply |
162 |
| |
|
| 18.4.1 Acid Plant Power Generation |
162 |
| |
|
| 18.4.2 Emergency Power |
162 |
| |
|
| 18.4.3 Diesel Generators |
162 |
| |
|
| 18.5 Site Services |
162 |
| GPEPPR7027-000-REP-PM-001 |
Page xv of xxv |
| 18.5.1 Fuel Supply, Storage and Distribution |
162 |
| |
|
| 18.5.2 Compressed Air |
163 |
| |
|
| 18.5.3 Potable Water |
163 |
| |
|
| 18.6 Buildings |
163 |
| |
|
| 18.6.1 Workshops and Warehouses |
163 |
| |
|
| 18.6.2 Office Facilities |
163 |
| |
|
| 18.6.3 Employee Housing |
163 |
| |
|
| 18.7 Tailings Transport and Storage |
163 |
| |
|
| 19 MARKET STUDIES AND CONTRACTS |
166 |
| |
|
| 19.1 Market Studies |
166 |
| |
|
| 19.2 Lithium Demand Outlook |
166 |
| |
|
| 19.3 Lithium Supply Outlook |
169 |
| |
|
| 19.4 Lithium Supply Demand Balance Forecast |
171 |
| |
|
| 19.5 Lithium Chemical and Battery Cathode Demand and Capacity Outlook |
172 |
| |
|
| 19.6 Long-term Supply Cost Curves for Lithium to 2035 |
174 |
| |
|
| 19.7 Lithium Price Forecast |
177 |
| |
|
| 19.8 By-Product Pricing |
177 |
| |
|
| 19.9 Conclusions |
178 |
| |
|
| 20 ENVIRONMENTAL STUDIES, PERMITTING & SOCIAL OR COMMUNITY |
180 |
| |
|
| 20.1 Introduction |
180 |
| |
|
| 20.2 Project Permitting Requirements |
180 |
| |
|
| 20.3 Environmental Baseline |
182 |
| |
|
| 20.4 Social, Community and Environmental Impacts |
183 |
| |
|
| 20.4.1 Stakeholder Engagement |
183 |
| |
|
| 20.4.2 Social and Environmental Impacts |
183 |
| |
|
| 20.4.2.1 Positive Impacts of American Lithium in The Macusani Region |
183 |
| GPEPPR7027-000-REP-PM-001 |
Page xvi of xxv |
| 20.4.2.2 Health of Workers |
184 |
| |
|
| 20.5 Rehabilitation and Closure |
184 |
| |
|
| 20.5.1 Post-Closure Monitoring and Maintenance |
184 |
| |
|
| 20.6 Green Project Initiatives |
185 |
| |
|
| 21 CAPEX and OPEX |
186 |
| |
|
| 21.1 Capital Cost |
186 |
| |
|
| 21.1.1 Estimate Classification |
186 |
| |
|
| 21.1.2 Assumptions |
186 |
| |
|
| 21.1.3 Exclusions |
186 |
| |
|
| 21.1.4 Contingency |
187 |
| |
|
| 21.1.5 Mining Costs |
188 |
| |
|
| 21.1.6 Process Costs |
188 |
| |
|
| 21.1.7 Bulk Infrastructure (Access Roads) Costs |
190 |
| |
|
| 21.1.8 Tailings Costs |
190 |
| |
|
| 21.1.9 Sustaining Capital |
191 |
| |
|
| 21.1.10 Closure Capital |
191 |
| |
|
| 21.1.11 Capital Cost Summary |
191 |
| |
|
| 21.2 Operating Costs |
192 |
| |
|
| 21.2.1 Estimate Classification |
192 |
| |
|
| 21.2.2 Mining Operating Costs |
192 |
| |
|
| 21.2.3 Contractor Mining Benchmarked Operating Costs. |
193 |
| |
|
| 21.2.4 Process Plant Operating Costs |
195 |
| |
|
| 21.2.5 Tailings Handling and Storage |
198 |
| |
|
| 21.2.6 General and Administration |
198 |
| |
|
| 21.2.7 Operating Costs Summary |
199 |
| |
|
| 22 ECONOMIC ANALYSIS |
201 |
| GPEPPR7027-000-REP-PM-001 |
Page xvii of xxv |
| 22.1 Introduction |
201 |
| |
|
| 22.2 Methodology |
201 |
| |
|
| 22.3 Key Economic Outcomes |
202 |
| |
|
| 22.4 Source of Information |
202 |
| |
|
| 22.5 Process Production Profile |
204 |
| |
|
| 22.6 Capital Expenditure and Phasing |
205 |
| |
|
| 22.7 Stay in Business Capital |
206 |
| |
|
| 22.8 Operating Costs |
206 |
| |
|
| 22.9 Product Recoveries |
207 |
| |
|
| 22.10 Product Pricing |
207 |
| |
|
| 22.11 Salvage Value |
207 |
| |
|
| 22.12 Working Capital |
207 |
| |
|
| 22.13 Sunk and On-going Capital |
207 |
| |
|
| 22.14 Reclamation and Closure |
207 |
| |
|
| 22.15 Taxation |
208 |
| |
|
| 22.15.1 Depreciation |
208 |
| |
|
| 22.15.2 Worker's Participation Tax |
208 |
| |
|
| 22.15.3 Pension Fund Contribution |
208 |
| |
|
| 22.15.4 Royalty Tax |
208 |
| |
|
| 22.15.5 Special Mining Tax |
208 |
| |
|
| 22.15.6 Income Tax |
208 |
| |
|
| 22.16 Economic Outcomes |
209 |
| |
|
| 22.17 Sensitivity |
210 |
| |
|
| 23 ADJACENT PROPERTIES |
212 |
| |
|
| 24 OTHER RELEVANT DATA AND INFORMATION |
213 |
| |
|
| 24.1 Project Development and Permitting Timeline |
213 |
| GPEPPR7027-000-REP-PM-001 |
Page xviii of xxv |
| 25 INTERPRETATION AND CONCLUSIONS |
213 |
| |
|
| 25.1 Mineral Resource Estimate |
213 |
| |
|
| 25.2 Preliminary Economic Assessment |
215 |
| |
|
| 25.2.1 LC Production |
215 |
| |
|
| 25.2.2 Capital and Operating Costs |
216 |
| |
|
| 25.2.3 Financial Evaluation |
216 |
| |
|
| 25.3 Environment |
217 |
| |
|
| 26 RECOMMENDATIONS |
218 |
| |
|
| 26.1 Recommended Phased Studies |
218 |
| |
|
| 26.2 Additional Recommendations |
220 |
| |
|
| 26.2.1 Risks |
220 |
| |
|
| 26.2.2 Opportunities |
220 |
| |
|
| 26.2.3 Recommendations |
221 |
| |
|
| 26.3 Environmental |
221 |
| |
|
| 26.4 Metallurgical and Processing |
221 |
| |
|
| 26.4.1 Testwork |
221 |
| |
|
| 26.4.2 Equipment vendor Engagement |
221 |
| |
|
| 26.4.3 Geometallurgical Model |
222 |
| |
|
| 26.5 Infrastructure |
222 |
| |
|
| 27 REFERENCES |
223 |
| GPEPPR7027-000-REP-PM-001 |
Page xix of xxv |
LIST OF TABLES
| Table 1-1 Milling Rate and Expansion Phases - Base and Alternate Case |
1 |
| |
|
| Table 1-2 Mineral resource Estimate effective October 31 2023 |
3 |
| |
|
| Table 1-3 Base Case Mineral Resource Summary |
5 |
| |
|
| Table 1-4 Mining Production Ramp Phases |
6 |
| |
|
| Table 1-5 TLC Design Criteria |
8 |
| |
|
| Table 1-6 Capital Cost |
13 |
| |
|
| Table 1-7 Life of Mine Operating Cost Breakdown |
14 |
| |
|
| Table 1-8 Discounted Cashflow Summary |
16 |
| |
|
| Table 1-9 Phase 1 Surface Mapping Program Costs |
19 |
| |
|
| Table 1-10 Phase 2 Infill Drilling Costs |
19 |
| |
|
| Table 2-1 Report Sections and Qualified Persons |
24 |
| |
|
| Table 2-2 Abbreviations, Acronyms and Units of Measure |
25 |
| |
|
| Table 4-1 Falchani Mineral Resource Mining Concessions |
35 |
| |
|
| Table 6-1 2018 Historic Estimates (Nupen, 2018) |
46 |
| |
|
| Table 6-2 2019 Historic Estimates (Nupen, 2019) |
46 |
| |
|
| Table 10-1 Drill Hole Locations, Inclination and Depth |
63 |
| |
|
| Table 11-1 Summary of QAQC Samples for all Drillholes |
70 |
| |
|
| Table 11-2 Summary of QAQC Samples for all Drillholes |
74 |
| |
|
| Table 13-1 Head Analysis of Lithium-rich Tuff Trench Sample |
81 |
| |
|
| Table 13-2 Data from Phase II Leaching Test |
83 |
| |
|
| Table 13-3 Data from Phase III Testwork |
84 |
| |
|
| Table 13-4 By-Product Recovery |
85 |
| |
|
| Table 14-1 Block Model Parameters |
89 |
| |
|
| Table 14-2 Vertical Zone Thickness (m) from Geological Implicit Model |
96 |
| |
|
| Table 14-3 Composite and Capping Li, Cs, K and Rb Grades from Drill Holes |
97 |
| |
|
| Table 14-4 Model Grade Estimation Parameters |
101 |
| |
|
| Table 14-5 Mineral Resource Estimate effective October 31 2023 |
106 |
| |
|
| Table 16-1 Conversion Factors for Lithium Compounds and Minerals |
113 |
| |
|
| Table 16-2 Conversion factors for Potassium and Cesium Compounds and Minerals |
113 |
| |
|
| Table 16-3 Summary Geotechnical Testwork |
115 |
| |
|
| Table 16-4 Mineral Resource Estimate Effective October 31,2023 |
117 |
| |
|
| Table 16-5 Mineral resource as of October 2023 (Source: Stantec) |
119 |
| GPEPPR7027-000-REP-PM-001 |
Page xx of xxv |
| Table 16-6 Block Model Origin and Dimensions |
120 |
| |
|
| Table 16-7 Summary of Key Fields in Block Model |
120 |
| |
|
| Table 16-8 Pit Optimisation Parameters Base Case |
122 |
| |
|
| Table 16-9 Summary of Pit Shell 3 In-situ Optimised Shell Content (Li < 2 600ppm) |
124 |
| |
|
| Table 16-10 Base Case Mineral Resource Summary |
125 |
| |
|
| Table 16-11 Production Ramp Phases |
126 |
| |
|
| Table 16-12 PEA LoM Production Schedule Summary |
127 |
| |
|
| Table 16-13 Typical Shift Roster |
134 |
| |
|
| Table 16-14 Contractor Operated Mining Hour Summary |
136 |
| |
|
| Table 16-15 Preliminary Production Equipment |
138 |
| |
|
| Table 16-16 Mining Owners Team Compliment |
140 |
| |
|
| Table 16-17 Contractor Mining Team Compliment |
140 |
| |
|
| Table 16-18 Total Open Pit Summary Personnel Table |
142 |
| |
|
| Table 16-19 Open Pit Summary Personnel Table |
142 |
| |
|
| Table 17-1 Process Rate and Expansion Phases - Base Case |
144 |
| |
|
| Table 17-2 Design Criteria |
145 |
| |
|
| Table 18-1 Access Roads Analysis - Outcomes |
160 |
| |
|
| Table 21-1 Mining Capital Costs |
188 |
| |
|
| Table 21-2 Process Direct Capital Costs - Base Case |
189 |
| |
|
| Table 21-3 Process Direct Capital Costs - Alternate Case |
190 |
| |
|
| Table 21-4 Tailings Capital Cost |
191 |
| |
|
| Table 21-5 LoM Capital Costs - Base Case |
191 |
| |
|
| Table 21-6 LoM Capital Costs - Alternate Case |
192 |
| |
|
| Table 21-7 ALC G&A Allowance |
193 |
| |
|
| Table 21-8 Contractor Mining Operating Costs (Benchmarked) |
193 |
| |
|
| Table 21-9 South American High Altitude Mining Operations |
194 |
| |
|
| Table 21-10 Process Reagent and Consumable Costs |
195 |
| |
|
| Table 21-11 Process Power Demand |
196 |
| |
|
| Table 21-12 Phase 1 Labor Costs |
197 |
| |
|
| Table 21-13 Process Consumable Costs |
197 |
| |
|
| Table 21-14 Process Plant OPEX - Laboratory |
198 |
| |
|
| Table 21-15 G&A Costs |
198 |
| |
|
| Table 21-16 Operating Cost Summary - Base Case |
199 |
| GPEPPR7027-000-REP-PM-001 |
Page xxi of xxv |
| Table 21-17 Operating Cost Summary - Alternate Case |
199 |
| |
|
| Table 22-1 Key Economic Outcomes (Post-tax) |
202 |
| |
|
| Table 22-2 Source of Information |
203 |
| |
|
| Table 22-3 Milling Rate and Expansion Phases |
204 |
| |
|
| Table 22-4 Capital Expenditure - Base and Alternate Case - Constant Terms (2023)* |
205 |
| |
|
| Table 22-5 Capital Costs Phase - Constant Terms (2023) |
205 |
| |
|
| Table 22-6 SIB Capital Cost (LoM) - Constant Terms (2023) |
206 |
| |
|
| Table 22-7 Operating Costs - Constant Terms (2023) |
206 |
| |
|
| Table 22-8 Product Recoveries and Grades |
207 |
| |
|
| Table 22-9 Economic Outcomes |
209 |
| |
|
| Table 26-1 Phase 1 Surface Mapping Program Costs |
218 |
| |
|
| Table 26-2 Phase 2 Infill Drilling Costs |
219 |
| |
|
| Table 26-3 Estimated Schedule and Costs of Recommended Activities |
219 |
| GPEPPR7027-000-REP-PM-001 |
Page xxii of xxv |
LIST OF FIGURES
| Figure 1-1 Mining Production Schedule and Mined Lithium Grades |
7 |
| |
|
| Figure 1-2 Mining Production Schedule and Strip Ratios |
7 |
| |
|
| Figure 1-3 Sensitivity Analysis Summary - Base Case |
17 |
| |
|
| Figure 4-1 General Location Map |
37 |
| |
|
| Figure 4-2 Mineral Tenure Map |
38 |
| |
|
| Figure 7-1 Regional Geology Map |
49 |
| |
|
| Figure 7-2 Local Geology Map |
51 |
| |
|
| Figure 7-3 Macusani Structural Zone |
53 |
| |
|
| Figure 7-4 Fault Evidence and the Macusani Volcanic Field |
54 |
| |
|
| Figure 7-5 Upper Breccia and LRT Contact in Core |
56 |
| |
|
| Figure 7-6 Geologic Cross Section A-A' |
58 |
| |
|
| Figure 7-7 Geologic Cross Section B-B' |
59 |
| |
|
| Figure 9-1 Drilling Configuration |
62 |
| |
|
| Figure 10-1 Drill Hole Location Map |
66 |
| |
|
| Figure 11-1 PZ Series Drillholes Duplicate Li Scatter Plot |
71 |
| |
|
| Figure 11-2 PZ Series Lithium Field Blanks (A) and Laboratory Blanks (B |
73 |
| |
|
| Figure 11-3 PZ Series Lithium Standard STD 41R01-MA |
75 |
| |
|
| Figure 12-1 Core Storage Facility and Hole PCHAC 14 - TW Core Box |
77 |
| |
|
| Figure 12-2 Site Visit Photographs |
79 |
| |
|
| Figure 14-1 Surface Topography and Model Limit Map |
90 |
| |
|
| Figure 14-2 Model Fault Blocks |
92 |
| |
|
| Figure 14-3 Model Stratigraphy and Lithium Grade from Representative Drilling |
93 |
| |
|
| Figure 14-4 3D Geological Model |
96 |
| |
|
| Figure 14-5 Mineralized Zones Grade Distributions |
98 |
| |
|
| Figure 14-6 Global Lithium Semi-Variograms |
99 |
| |
|
| Figure 14-7 Global Lithium Semi- Variogram |
100 |
| |
|
| Figure 14-8 Resource Block Model Cross Section A-A' |
102 |
| |
|
| Figure 14-9 Resource Block Model Cross Section B-B' |
103 |
| |
|
| Figure 14-10 Economic Pit Shell |
107 |
| |
|
| Figure 14-11 Generalized Resource Classification Map |
108 |
| |
|
| Figure 16-1 Plant Feed Photo Core Photo PCHAC-14 (Source: Stantec) |
114 |
| GPEPPR7027-000-REP-PM-001 |
Page xxiii of xxv |
| Figure 16-2 Road to Falchani Project (Source: Stantec) |
115 |
| |
|
| Figure 16-3 Surface Topography and Model Limits Map (Source: Stantec) |
116 |
| |
|
| Figure 16-4 Generalized Resource Classification Map (Source: Stantec) |
119 |
| |
|
| Figure 16-5 Whittle Optimisation Results with Pit Shell 3 Selection |
124 |
| |
|
| Figure 16-6 Mining Production Schedule and Mined Lithium Grades |
128 |
| |
|
| Figure 16-7 Mining Production Schedule and Mined Potassium Grades |
129 |
| |
|
| Figure 16-8 Mining Production Schedule and Mined Cesium Grades |
130 |
| |
|
| Figure 16-9 Mining Production Schedule and Strip Ratios |
131 |
| |
|
| Figure 16-10 Plant Feed Schedule and Feed Grades |
131 |
| |
|
| Figure 16-11 Push Back Planning and Progression in the Mine Scheduling |
132 |
| |
|
| Figure 16-12 Typical Mining Production Fleet |
133 |
| |
|
| Figure 16-13 Production Fleet per Year per Production Phase |
139 |
| |
|
| Figure 16-14 Contractor Mining LoM Costs |
143 |
| |
|
| Figure 17-1 Process Block Flow Diagram - Base Case |
148 |
| |
|
| Figure 17-2 Process Block Flow Diagram - Alternate Case |
149 |
| |
|
| Figure 17-3 Falchani Lithium Overall General Arrangement Plan - Process Plant Phase 1 |
150 |
| |
|
| Figure 18-1 Proposed Route of Access Road from Interoceanica Highway to Site (Option 1) |
161 |
| |
|
| Figure 18-2 Tailings Storage Facility Options (Source: Vice Versa Consulting) |
164 |
| |
|
| Figure 18-3 TSF Capital Cost Options |
165 |
| |
|
| Figure 19-1 Lithium Demand By Sector [Source: Benchmark Mineral Intelligence, Lithium Forecast, Q4 2023] |
167 |
| |
|
| Figure 19-2 Lithium Battery Demand Breakdown by Cathode Chemistry and End Source, 2033 [Source Benchmark Mineral Intelligence, Lithium Forecast, Q4 2023] |
168 |
| |
|
| Figure 19-3 Lithium Battery Demand Breakdown by Region [Source Benchmark Mineral Intelligence, Lithium Forecast, Q4 2023 ] |
168 |
| |
|
| Figure 19-4 Lithium Supply Forecast to 2040 [Source: Benchmark Mineral Intelligence, Lithium Forecast, Q4 2023] |
170 |
| |
|
| Figure 19-5 Recycled Lithium Supply Forecast, tonnes LC [Source: Benchmark Mineral Intelligence, Lithium Forecast, Q4 2023 ] |
171 |
| |
|
| Figure 19-6 Long-Term Supply Forecast [Source: Benchmark Mineral Intelligence, Lithium Forecast, Q4 2023 ] |
172 |
| |
|
| Figure 19-7 Lithium Supply & Demand by Chemical Product [Source: Benchmark Mineral Intelligence, Lithium Forecast, Q4 2023] |
173 |
| GPEPPR7027-000-REP-PM-001 |
Page xxiv of xxv |
| Figure 19-8 Forecast Lithium Chemical Deficit, 2015-2040 [Source: Benchmark Mineral Intelligence, Lithium Forecast, Q4 2023] |
174 |
| |
|
| Figure 19-9 C3 Supply Cost for Lithium Carbonate - 2022 [Source: Benchmark Mineral Intelligence, Lithium Forecast, Q4 2023] |
176 |
| |
|
| Figure 19-10 Lithium Carbonate Price Forecast [Source: Benchmark Mineral Intelligence, Lithium Forecast, Q4 2023] |
177 |
| |
|
| Figure 21-1 Contractor Mining LoM Costs |
194 |
| |
|
| Figure 22-1 Mine and Plant Feed Profile |
204 |
| |
|
| Figure 22-2 Sensitivity Analysis - Base Case |
211 |
| |
|
| Figure 24-1 Estimated Schedule |
213 |
| GPEPPR7027-000-REP-PM-001 |
Page xxv of xxv |
1 SUMMARY
1.1 Introduction
The Falchani Project (the "Project") is located within the Falchani and Ocacasa 4 concessions held by American Lithium Corporation (the "Company"). The Project is situated on the Macusani Plateau, located in the Carabaya Province, Puno District of south-eastern Peru in the Andes Mountains, which has been actively explored for uranium since the 1980's, and more recently for lithium. Located approximately 650 km east southeast of Lima and about 220 km by the Interoceanica Highway from Juliaca in the south, two roads connect the Falchani Project to the Interoceanica Highway and are accessible year-round. The town of Macusani is 25 km to the southeast of the Company's Project area.
This Technical Report presents a Base Case scenario which is exclusively lithium carbonate recovery excluding any by-products and an Alternate Case that includes the recovery of cesium as cesium sulfate and potassium as potassium sulfate as by-products.
The Project consists of an open pit mine and an associated processing facility along with onsite and off-site infrastructure to support the operation. The design for the process plant is based on achieving a peak milled tonnage of 6M t/y over three phases. An overview of the phased production strategy is presented in Table 1-1.
Table 1-1 Milling Rate and Expansion Phases - Base and Alternate Case
|
Description
|
Years
|
Milling Rate
|
|
Phase 1
|
1 - 5
|
1.5M t/y
|
|
Phase 2
|
6 - 10
|
3.0M t/y
|
|
Phase 3
|
11 - 43
|
6.0M t/y
|
A total of 2.6 million tonnes of lithium carbonate (minimum purity 99.5%) is produced over life of mine at a lithium recovery of 80%.
1.2 Geology & Mineralization
The lithium occurrences at Falchani are hosted in an ash-flow Tuff named Lithium Rich Tuff (LRT) and volcanoclastic breccias (Upper and Lower Breccia, UBX and LBX) that bound the LRT. Lithium mineralization is also observed in the basal Coarse Felsic Intrusion (CFI) which is interpreted to be a stratiform felsic intrusion underlying the above lithium host rocks. Elevated concentrations of cesium, potassium, and rubidium are associated with lithium mineralization and these elements show potential to be included as a byproduct of lithium processing to produce battery grade lithium carbonate. The general dimensions of the mineralized zone at Falchani covers an area approximately 3,300 m wide by 2,440 m long extending from outcrop to a maximum modelled depth of approximately 1,000 m below surface. The mineralization is continuous from surface. The highest and most consistent lithium grades occur in the LRT. The basement mineralized coarse felsic intrusion has a known depth of 400 m from drillhole intercepts, however the maximum thickness of the unit is still unknown.
1.3 Mineral Resource Estimation
The geologic model from which lithium resources are reported is a 3D block model developed using the World Geodetic System (WGS) 1984 UTM Zone 19S and is in metric units. The geologic model is separated into seven lithological zones of which four mineralized zones exist. The lithologic zones are, from top to bottom: Overburden, Upper Rhyolite, mineralized Upper Breccia (UBX), mineralized Lithium Rich Tuff (LRT), mineralized Lower Breccia (LBX), mineralized Coarse Felsic Intrusion (CFI) basement unit, and Rhyolite Subvolcanic Intrusion. The lithologic zones are further separated into nine (9) fault blocks that are split by two (2) north-south trending high angle normal faults (Valley Fault and East Fault) and six (6) northwest and southwest trending normal faults (NW1 through NW6). The lithium, as well as cesium, potassium and rubidium grades from exploration drilling were estimated into the blocks using an inverse distance algorithm. Semi-variograms were used as guide in the estimation process and classification of mineral resource estimates into assurance categories.
Mineral resources for the upper three mineralized zones (UBX, LRT and LBX) are classified by distance from nearest valid drill hole sample up to a maximum distance of 250 m for inferred, 160 m indicated, and 80 m measured. Mineral resources for the CFI are within 160 m for inferred, 80 m indicated, and 40 m measured.
The lithium mineral resource estimates are presented in Table 1.4 in metric units. The resource estimates are contained within an economic pit shell at constant 45° pit slope to a maximum vertical depth of 300 m below surface. Lithium resources are presented for a range of cutoff grades to a maximum of 5,000 ppm lithium. The base case lithium resource estimates are highlighted in bold type in Table 1.4. All lithium resources on the Falchani Property are surface mineable at a stripping ratio of 0.4 BCM/metric tonne at the base case cutoff grade of 600 ppm lithium. The effective date of the lithium resource estimate is October 31, 2023.
Table 1-2 Mineral resource Estimate effective October 31 2023
|
Cutoff
|
Volume
|
Tonnes
|
Li
|
Metric Tonnes (Mt)
|
Cs
|
K
|
Rb
|
|
Li (ppm)
|
(Mm3)
|
(Mt)
|
(ppm)
|
Li
|
Li2CO3
|
LiOH.H20
|
(ppm)
|
(%)
|
(ppm)
|
|
Measured
|
|
600
|
29
|
69
|
2,792
|
0.19
|
1.01
|
1.15
|
631
|
2.74
|
1,171
|
|
800
|
28
|
68
|
2,832
|
0.19
|
1.01
|
1.15
|
641
|
2.72
|
1,194
|
|
1,000
|
27
|
65
|
2,915
|
0.19
|
1.01
|
1.15
|
647
|
2.71
|
1,208
|
|
1,200
|
25
|
61
|
3,024
|
0.18
|
0.96
|
1.09
|
616
|
2.74
|
1,228
|
|
1,400
|
24
|
57
|
3,142
|
0.18
|
0.96
|
1.09
|
547
|
2.78
|
1,250
|
|
Indicated
|
|
600
|
156
|
378
|
2,251
|
0.85
|
4.52
|
5.14
|
1,039
|
2.92
|
1,055
|
|
800
|
148
|
357
|
2,342
|
0.84
|
4.47
|
5.08
|
1,058
|
2.90
|
1,070
|
|
1,000
|
136
|
327
|
2,472
|
0.81
|
4.31
|
4.90
|
1,095
|
2.87
|
1,104
|
|
1,200
|
129
|
310
|
2,549
|
0.79
|
4.20
|
4.78
|
1,086
|
2.86
|
1,146
|
|
1,400
|
120
|
288
|
2,646
|
0.76
|
4.04
|
4.60
|
1,041
|
2.88
|
1,166
|
|
Measured plus Indicated
|
|
600
|
185
|
447
|
2,327
|
1.04
|
5.53
|
6.29
|
976
|
2.90
|
1,072
|
|
800
|
176
|
425
|
2,424
|
1.03
|
5.48
|
6.23
|
991
|
2.87
|
1,090
|
|
1,000
|
163
|
392
|
2,551
|
1.00
|
5.32
|
6.05
|
1,021
|
2.84
|
1,121
|
|
1,200
|
154
|
371
|
2,615
|
0.97
|
5.16
|
5.87
|
1,009
|
2.84
|
1,160
|
|
1,400
|
144
|
345
|
2,725
|
0.94
|
5.00
|
5.69
|
960
|
2.86
|
1,180
|
|
Inferred
|
|
600
|
198
|
506
|
1,481
|
0.75
|
3.99
|
4.54
|
778
|
3.31
|
736
|
|
800
|
174
|
443
|
1,597
|
0.71
|
3.78
|
4.30
|
837
|
3.24
|
762
|
|
1,000
|
138
|
348
|
1,785
|
0.62
|
3.30
|
3.75
|
886
|
3.18
|
796
|
|
1,200
|
110
|
276
|
1,961
|
0.54
|
2.87
|
3.27
|
942
|
3.10
|
850
|
|
1,400
|
82
|
201
|
2,211
|
0.44
|
2.34
|
2.66
|
1,022
|
3.01
|
926
|
- CIM definitions are followed for classification of Mineral Resource.
- Mineral Resource surface pit extent has been estimated using a lithium carbonate price of US20,000 US$/tonne and mining cost of US$3.00/t, a lithium recovery of 90%, fixed density of 2.40 g/cm3
- Conversions: 1 metric tonne = 1.102 short tons, metric m3 = 1.308 yd3, Li2CO3:Li ratio = 5.32, LiOH.H2O:Li ratio =6.05
- Totals may not represent the sum of the parts due to rounding.
- The Mineral Resource estimate has been prepared by Mariea Kartick, P. Geo., and Derek Loveday, P. Geo. Of Stantec Consulting Services Inc. in conformity with CIM "Estimation of Mineral Resource and Mineral Reserves Best Practices" guidelines and are reported in accordance with the Canadian Securities Administrators NI 43-101. Mineral resources are not mineral reserves and do not have demonstrated economic viability. There is no certainty that any mineral resource will be converted into mineral reserve.
1.4 Mining Methods
Open pit mining is planned to use conventional truck and shovel mining methods with drill and blasting to break the rock mass into manageable particle sizes. Mining operations are planned to be undertaken by a contractor operated fleet, which is the cost basis for this preliminary economic assessment. Mining and processing operations will be conducted 24 hours day, seven (7) days week and 353 days per year.
The following design parameters were used for the PEA study update: -
- Fully mobile production equipment, consisting of medium sized hydraulic shovels and 90 tonne rigid dump trucks has been planned.
- Total mining costs of $2.60/t and a mining height adjustment factor of $0.06 per vertical meter of all material moved at altitude is the basis for the Project economics.
- A bulk supplies diesel price of $1.10/L is incorporate in the mining costs.
- Support equipment will be Front End Loaders, tracked dozers, graders, and water trucks.
- The run-of-mine (RoM) pad at near the Process Plants primary crusher will be the mining and process battery limit.
- Benchmarked operation elevation of 4700 masl was used.
- Operation elevation of 4480 to 4875 masl have been observed and this will require dual turbo charging of all equipment to limit high altitude derating factors
- The deepest pushback planned is at a depth of 305 m.
- Geotechnically designed slope are applied to relevant pit areas.
The open pit design contains 152M t (LoM) of mineralized material with an average Li grade of 3321 ppm, 24M t of low grade mineralized material with an average Li grade of 2287 ppm and 35 Mt of marginal grade mineralized with an average grade of 1520 ppm. The stripping ratio is low at 0.6:1, waste t to mineralization t, and the total waste mined is 126M t.
1.4.1 Mine Planning
Production scheduling and push back planning was undertaken on the selected pit shells. The conceptual mine scheduling for the ramping up from 1.5 to 6 M t/y process plant feed. The mineral resource summary results are shown in Table 1-3.
Table 1-3 Base Case Mineral Resource Summary
|
Falchani - Production Scheduled Mineral Resources
|
|
Parameter
|
Unit
|
Value
|
|
Mine Production Life
|
Year
|
34
|
|
High Grade Stockpile Range
|
ppm
|
> 2600
|
|
HG Process Feed Material
|
Mt
|
152.4
|
|
HG Diluted Li grade (mill head grade)
|
ppm
|
3321
|
|
HG Contained LCE (Mt)
|
Mt
|
2.695
|
|
HG Diluted K grade (mill head grade)
|
%
|
2.960
|
|
HG Diluted Cs grade (mill head grade)
|
%
|
0.056
|
|
Low Grade Stockpile Range
|
ppm
|
< 2600 >1600
|
|
LG Process Feed Material
|
Mt
|
24.6
|
|
LG Diluted Li grade (stockpile grade)
|
ppm
|
2287
|
|
LG Contained LCE (Mt)
|
Mt
|
0.299
|
|
LG Diluted K grade (stockpile grade)
|
%
|
2.779
|
|
LG Diluted Cs grade (stockpile grade)
|
%
|
0.117
|
|
Marginal Grade Stockpile Range
|
ppm
|
> 1600 > 1000
|
|
Marginal Process HG Feed Material
|
Mt
|
35.7
|
|
Marginal Diluted Li grade (stockpile grade)
|
ppm
|
1520
|
|
Marginal Contained LCE (Mt)
|
Mt
|
0.289
|
|
Marginal Diluted K grade (stockpile grade)
|
%
|
2.315
|
|
Marginal Diluted Cs grade (stockpile grade)
|
%
|
0.099
|
|
Waste
|
Mt
|
127
|
|
Total Material
|
Mt
|
339.7
|
|
Strip Ratio
|
tw:t total pf
|
0.6
|
|
Strip Ratio
|
tw:H-G pf
|
0.83
|
Dilution and Loss
Since the mining mineralized deposits zones are massive with low strip ratios the following dilution and losses parameters where used:
- Mining losses of only 2% where used due to the limited zones of interaction between waste and mineralized material.
- For mining modelling purposes geological losses of 5.8% average are derived from the historic geological resource works which consider the current relatively low drilling density. In the new resource model this would be zero but time did not allow this to be included in the PEA Update modelling and will be addressed in the Pre-feasibility Study (PFS).
1.4.2 Mine Sequencing/Scheduling
The annual mining schedule has been developed based on the three phases (1.5, 3.0 & 6.0M t/y) production ramp up detailed in Table 1-4. Production is planned to be ramped up to a maximum mill feed of 6M t/y, (≈16,500t/d). The mining activity for this Project is approximately 32 years, (including 6 months pre-production), with a further 11 years of processing of low-grade material from stockpiles, based on the 152.4Mt of Indicated and Inferred Mineral Resources.
The plant feed tonnage, waste tonnes and lithium grades are shown in Figure 1-1. The strip ratios are shown in Figure 1-2.
Table 1-4 Mining Production Ramp Phases
|
Production Ramp Up
|
Y 1
|
Y 2
|
Y 3 to 7
|
Y 8
|
Y 9 to 12
|
Y 13
|
Y 14 to 32
|
|
Plant Feed M t/y
|
0.75
|
1.00
|
1.50
|
2.25
|
3.00
|
4.50
|
6.00
|
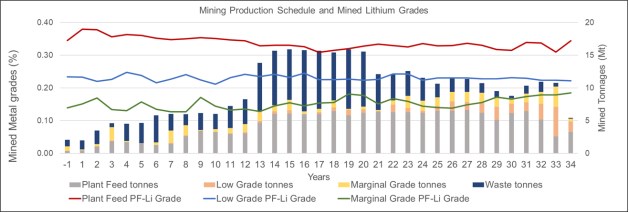
Figure 1-1 Mining Production Schedule and Mined Lithium Grades
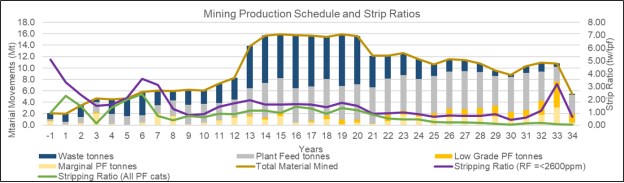
Figure 1-2 Mining Production Schedule and Strip Ratios
1.5 Mineral Processing & Metallurgical Testing
A substantial body of metallurgical testwork has been carried out on the Falchani lithium-bearing tuff material. The testwork referenced in this report was carried out by Tecmmine in Peru (prior to 2018) and testwork carried out in 2018 and 2019 was carried out by Tecmmine and ANSTO Minerals in Australia. Both the Tecmmine and ANSTO testwork was carried out on the lithium rich tuff obtained from a trench on site. The testwork supports a number of technically viable process flowsheet routes (hydrochloric acid leaching, salt roast, sulfation baking, pressure leaching, purification processes) but for the purpose of this PEA a flowsheet using atmospheric leaching in a sulfuric acid medium, followed by downstream purification processes, was selected for the production of battery grade lithium carbonate. The early focus of the acid leach process was on maximizing the extraction of lithium using aggressive leach conditions and the later work focused on optimizing the leach parameters and confirming inputs to the process design criteria.
The process flow sheet was developed by DRA, working with ANSTO Minerals (ANSTO) and with input from M.Plan International (M.Plan). Following mining, mineralized material will be crushed to a P80 of 150 μm, followed by a warm (95 °C) sulfuric acid tank leach with a residence time of 24 hours, to extract 85% of lithium to leach solution. The process utilizes conventional tank leaching, widely used in various mining operations to extract metals from mineralized material. This is followed by a three-stage purification process to reduce various impurities in the leach solution, mechanical evaporation and conventional precipitation, using a crystallization plant, to produce a battery grade Li2CO3 product. An overall recovery of 80% from mineralized material to Li2CO3 is utilized in the PEA.
As a significant portion of the operating costs are derived from sulfuric acid use as the leaching reagent, the PEA includes the construction of a 1,700 tonnes per day (t/d) sulfur burning acid plant at site in Phase I (P1) to produce, on average, 1,500 t/d of sulfuric acid. The acid plant includes a power generation facility that generates approximately 18MW of clean energy from the steam generated in the sulfur burner. In subsequent phases, additional modules are added to meet expanded processing capacity.
More recent (2023) testwork performed by ANSTO focused on the recovery of by-products namely potassium as potassium sulfate and cesium as a cesium sulfate. While potassium sulfate is expected to be a relatively pure product the cesium sulfate would need to be further refined by third parties into desired end-products. The Alternate Case discussed and presented in this PEA Update includes the by-product recovery in addition to the LC production.
The key project design criteria for both the Base Case and the Alternate Case are shown in Table 1-5.
Table 1-5 TLC Design Criteria
|
Description
|
Unit
|
Value
|
|
Life of Mine
|
y
|
43
|
|
Plant Design Throughput (Phase 1 - Year 1 to 5)
|
M t/y
|
1.5
|
|
Plant Design Throughput (Phase 2 - Year 6 to 10)
|
M t/y
|
3.0
|
|
Description
|
Unit
|
Value
|
|
Plant Design Throughput (Phase 3 - Year 11 to 43)
|
M t/y
|
6.0
|
|
Operating Hours Per Year
|
h/y
|
8 000
|
|
Lithium Head grade RoM (Year 1- 32)
|
ppm Li
|
3 380
|
|
Lithium Head grade Low Grade (Year 33 - 43)
|
ppm Li
|
1 841
|
|
Lithium Production as LC (Phase 1)
|
t/y
|
23 000
|
|
Lithium Production as LC (Phase 2)
|
t/y
|
45 000
|
|
Lithium Production as LC (Phase 2 - RoM)
|
t/y
|
84 000
|
|
Lithium Production as LC (Phase 2 - Low Grade)
|
t/y
|
44 800
|
|
Lithium extraction Method
|
|
Sulfuric acid leach
|
|
Acid addition/ t Run of Mine (RoM)
|
Kg/t
|
387
|
|
Lithium recovery
|
%
|
80
|
|
Alternate Case (Year 6 - 43)
|
|
|
|
Potassium recovery
|
%
|
20.7
|
|
SOP Produced (Average LoM)
|
t/y
|
81 556
|
|
Cesium Recovery
|
%
|
74.7
|
|
Cs₂SO₄ Produced (Average LoM)
|
t/y
|
3 796
|
1.6 Market Studies and Contracts
The Falchani Project is not currently in production and has no operational sales contracts in place. To evaluate the market for its lithium product, American Lithium subscribed to the Lithium Forecast Service of Benchmark Mineral Intelligence (BMI). BMI's Q4 2023 forecast describes the lithium supply chain, long-term supply forecasts for lithium to 2040 and long-term supply cost curves for lithium to 2040. Forecast prices for the same period for battery grade LC and hydroxide are also provided, and these have formed the basis for the economic analysis undertaken for the PEA.
There is an ongoing need for capacity investments in lithium raw material extraction, chemical processing and cathode manufacturing as shown in the BMI forecast to 2040. Given the direction of travel and level of investment in the downstream of the electric vehicle supply chain, at an automobile manufacture and battery cell level, there is an impending shortfall in all areas of the upstream supply chain which needs to be addressed.
The forecast market deficit will incentivise investment in both raw material and chemical processing capacity. For LC, BMI forecasts long-term pricing to settle in the region of $28 980/t and for lithium hydroxide $30 980/t.
An opportunity exists for the Falchani project to become a significant regional supplier of potassium sulfate products. American Lithium Corp. has not engaged with any traders but estimates a likely future market price of $1 000/t of potassium sulfate.
The potential exists to produce a by-product stream containing cesium sulfate. Cesium is used in high-pressure, high-temperature offshore oil and gas drilling and is used in infrared detectors, optics, photoelectrical cells, scintillation counters and spectrometers. Cesium sulfate produced at Falchani can be further refined by third parties into desired end-products. ALC has advised DRA to use a value of $58 000/t of Cesium sulfate for the financial modelling of the Alternate Case. No contracts have been entered into so pricing and market size should be considered prospective at this stage.
1.7 Environmental Studies, Permitting & Social Considerations
1.7.1 Environmental Assessment
A baseline environmental study undertaken by ACOMISA, a Lima-based environmental consulting company, and continued in collaboration with Anddes is ongoing. The study was expanded to include each of the Falchani Lithium Project and Macusani Uranium Project areas and now covers the affected areas belonging to the communities of Isivilla, Tantamaco, Corani, Chimboya and Paquaje, and Chacaconiza. The study has recently progressed into an EIA that includes community relations and impacts of future development, as well as flora, fauna, water, air and noise sampling and comprehensive archaeological studies.
1.7.2 Permitting
Peru has many environmental laws and regulations that apply to resources sector. These are arranged in a general framework of laws, legislative decrees, supreme decrees, legislative resolutions, ministerial resolutions and decisions. Key among these are: the General Environmental Law (28611-2005) (GEL); the Environmental Impact Assessment (EIA) Law (27446-2001); the Environmental Impact Assessment Regulation (Supreme Decree 019-2009); the Environmental Regulation on Exploration Activities (020-2008-EM) (EREA); the Environmental Regulation for mining exploration activities (020-2008-EM); and the Regulations on the Protection and Environmental Management for exploitation, operation, general labor, transportation and storage (040-2014-EM).
Prior to commencing mine development and operation, Peruvian Environmental Regulations require an EIA-d to be carried out. The EIA-d must be approved by SENACE before mining activities may commence.
1.7.3 Social or Community-Related Requirements
An environmental study is required to be completed to fully understand the potential social and environmental impacts due to the implementation of the Project.
The development of the Project will include the following Green Initiatives:
- Water Efficiency: Use of filtered tailings enables recycling of up to 90% of process water;
- Environmental and Personnel Safety: Use of environmentally responsible dry stacking tailings technology;
- Clean Energy Generation: The sulfuric acid plant on site produces sufficient clean energy to power entire process plant and provide excess power;
- Future development work to evaluate opportunities such as:
- Electric mine fleet with excess clean energy storage on site;
- Rainwater run off storage and additional water recycling;
- Low CO2 transport and logistics for consumables.
1.8 Project Infrastructure
An investigation into infrastructure requirements for the Project revealed the following requirements for the Falchani site.
- Access road;
- Raw water supply;
- Power transmission line and sub-stations;
- Emergency power;
- General site services;
- Buildings;
- Tailings transportation and storage.
1.8.1 Access Roads
The existing connecting road between the highway and the Project site is not suitable for heavy vehicle transit. A study was conducted by Vice Versa consulting to evaluate potential access road options. On the outcomes from this study, the Project has assumed a new road starting at the diversion that is currently used to access the area of Project. This option takes advantage of the existing section of access to the town of Tantamaco, Isivilla and the accesses built for the communities of Quelccaya and Chaccaconiza.
1.8.2 Power Supply
The plant's primary source of electrical power will be the power co-generation facility at the acid plant. Diesel-fuelled generators will provide power for remotely located equipment (the raw water pumps at the river and equipment located at the tailings storage facility). The grid will provide power for emergency lighting and for key process drives (for example, leach tank agitators, scrubber fans, thickener rakes).
1.8.3 Water Supply
Water is sourced from local river courses. In its 2014 Preliminary Economic Assessment (PEA) for Plateau Energy Metals' uranium projects, GBM Mining Engineering Consultants Limited (GBM) was of the view that the area has access to sufficient water resources for the purposes of mining operations at a rate of 1M t/y (Short et al, 2016). The availability of water has not been assessed during the PEA and it is recommended that the availability of suitable water be quantified in later stages of the Project's development.
1.8.4 Tailings Transportation and Storage
Tailings from the plant will be pumped to a belt filter adjacent to the Tailings Storage Facility (TSF). The filtered tailings will be stacked in the TSF and the filtrate will be pumped back to the process water tank in the plant. Vice Versa Consulting have identified a number of suitable locations for the TSF that will be utilised throughout the life of the Project. The Base Case will utilize a total of three deposition locations over LoM based on capacity requirements.
1.9 Capital Cost Estimate
A contractor-operated fleet has been adopted for the purposes of this Project and capital requirements relating to mining cover pre-site establishment. The capital cost estimate for the plant has been compiled based on a priced mechanical equipment list. Factors were applied to the equipment cost to derive costs for bulk materials, freight, installation and for Project indirects. Initial (Phase I) capital estimates are identical for both the Base Case and Alternate Case. Quotations from suppliers have accounted for approximately 80% of total equipment costs. Non-process infrastructure costs relating to access roads and the TSF have been based on a study concluded by Vice Versa Consulting.
The prepared estimate is classified by DRA as a Class 4 estimate with a +40% / -40% accuracy, similar to an AACE International Class 4 (+50% / -30%) and deemed suitable for a PEA level study.
An 11% contingency, relative to total process plant cost and exclusive of non-process infrastructure, has been allocated to the direct and indirect costs.
A summarized version of the capital estimates over LoM has been presented in the table below and cover the Base Case. The initial capital outlay amounts to $ 681M of which direct costs constitute 75% of total costs. Table 1-6 shows the capital cost summary for the Project by area presented in United States $.
Table 1-6 Capital Cost
|
Area
|
Phase 1,
$ M
|
Phase 2,
$ M
|
Phase 3,
$ M
|
LoM,
$ M
|
|
Mining Capital
|
10.3
|
10.3
|
20.6
|
41.1
|
|
Process Plant, Direct Costs
|
399.9
|
359.9
|
720.5
|
1 480.0
|
|
Plant/Mine, Infrastructure
|
36.3
|
32.7
|
65.5
|
134.0
|
|
Bulk Infrastructure
|
35.1
|
17.6
|
35.2
|
88.0
|
|
Tailings
|
29.2
|
-
|
127.4
|
157
|
|
Total Direct Costs
|
510.8
|
420.5
|
969.1
|
1 900.0
|
|
Indirect Costs
|
109.7
|
98.7
|
197.4
|
406.0
|
|
Contingency
|
60.1
|
54.1
|
108.2
|
222.0
|
|
Closure
|
-
|
-
|
-
|
36
|
|
Total Project Capital Cost
|
680.6
|
573.3
|
1 274.7
|
2 565.5
|
| Note: Costs for closure capital have been estimated. |
1.10 Operating Cost Estimate
The operating cost estimate was completed from a zero base and presented in United States $. Costs associated with power, labor, materials, consumables and general and administration have been included in this estimate. A contractor-operated fleet has been adopted for the purposes of this Project.
The prepared estimate is classified by DRA as a Class 4 estimate with a +40% / -40% accuracy, and deemed suitable for a PEA level study.
No contingency has been applied to the Project operating costs.
The overall operating cost estimate is presented in Table 1-7 for the Base Case. The breakdown shows all the costs associated with mine and plant operation covering costs for contractor mining, labor, power, maintenance, reagents, consumables and general administration. Key cost drivers for both options reside with the process plant of which reagents constitute the largest single cost category overall.
Table 1-7 Life of Mine Operating Cost Breakdown
|
Description
|
Units
|
LoM
Base Case
|
LoM
Alternate Case
|
|
G&A Costs
|
$ M
|
353
|
353
|
|
Mining Costs
|
$ M
|
1 226
|
1 226
|
|
Processing Costs
|
$ M
|
11 623
|
13 242
|
|
Tailings Costs
|
$ M
|
238
|
238
|
|
Total LoM Operating Cost
|
$ M
|
13 440
|
15 059
|
|
Unit Costs
|
|
|
|
|
G&A Costs
|
$/t LC
|
134
|
134
|
|
Mining Costs
|
$/t LC
|
464
|
464
|
|
Processing Costs
|
$/t LC
|
4 403
|
5 017
|
|
Tailings Costs
|
$/t LC
|
90
|
90
|
|
Total Unit Cost
|
$/t LC
|
5 092
|
5 705
|
|
|
|
|
|
1.11 Economic Outcomes
1.11.1 Introduction
The financial evaluation presents the determination of the net present value (NPV), payback period (time in years to recapture the initial capital investment), and the internal rate of return (IRR) for the Project. Annual cash flow projections were estimated over the life of the mine based on the estimates of capital expenditures, production cost, and sales revenue. The analysis has been conducted in real terms with no consideration given to inflation or escalation of costs or prices over the life of the Project.
The economic model has been populated on a 100% equity basis and therefore does not consider alternative financing scenarios. Financing related costs such as interest expense, withholding taxes on dividends and interest income, are excluded from the economic model.
A Base Case which considers the production of battery grade lithium carbonate has been evaluated. In addition, the upside potential to produce sulfate of potash (SOP) and cesium sulfate (Cs₂SO₄) as by-products has been presented as an Alternate Case.
1.11.2 Economic Outcomes
The economic analysis is prepared on a 100% equity project basis and does not consider financing scenarios. An 8% real discount rate has been used in the analysis. A throughput over LoM of 213 Mt producing 2.6 Mt of LCE is projected for the Base Case and Alternate Case.
The Base Case total capital cost over LoM is estimated to be $ 2.6bn, inclusive of mine rehabilitation and closure costs, with an initial capital expenditure of $ 681M allocated for Phase I. Mining costs are estimated to be $ 464/t LCE on average, over LoM. Process costs are estimated at $ 4 403/t LCE for the Base Case and $ 5 017/t LCE for the Alternate Case. General and administration costs begin at $ 5M for Phase 1, $ 7M for Phase 2 and ramping up to $ 9M for Phase 3. The analysis has revealed a post-tax Net Present Value (NPV) of $ 5.1bn with an internal rate of return (IRR) of 32% with post-tax payback period of 3.0 years based LoM price of $ 22 500/t LCE. For the Alternate Case the analysis has revealed a post-tax Net Present Value (NPV) of $ 5.6bn with an internal rate of return (IRR) of 29.9% with post-tax payback period of 3.0 years based LoM price of $ 1 000/t SOP and $ 58 000/t cesium sulfate. The outcomes of the analysis are summarised and presented in Table 1-8.
Table 1-8 Discounted Cashflow Summary
|
Description
|
Units
|
Base Case
|
Alternate Case
|
|
Financial Outcomes (PRE-TAX)
|
|
|
|
|
NPV (8%)
|
$ M
|
8 410
|
9 251
|
|
IRR
|
%
|
40.7
|
38.5
|
|
Payback Period (undiscounted)
|
years
|
2.5
|
2.5
|
|
Financial Outcomes (POST-TAX)
|
|
|
|
|
NPV (8%)
|
$ M
|
5 109
|
5 585
|
|
IRR
|
%
|
32.0
|
29.9
|
|
Payback Period (undiscounted)
|
years
|
3.0
|
3.0
|
1.11.3 Sensitivity
A sensitivity analysis, as shown in Figure 1-3, has been conducted on the Base Case assessing the impact of variations in capital cost, operating cost, lithium carbonate selling price and reagent pricing (lime, limestone and sulfur). Each variable is assessed in isolation to determine the impact on NPV and IRR.
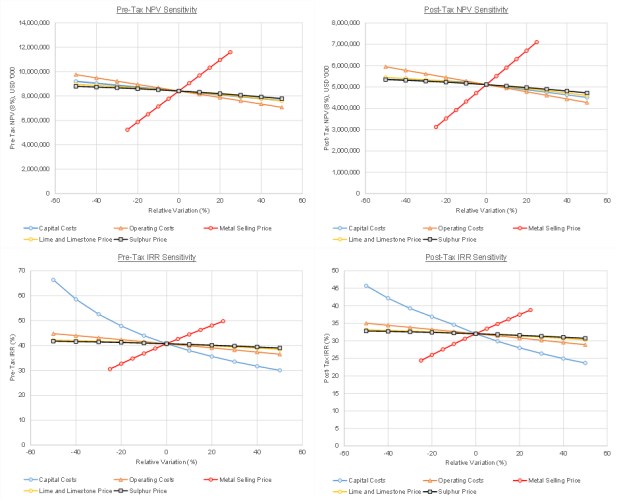
Figure 1-3 Sensitivity Analysis Summary - Base Case
1.12 Adjacent Properties
The Falchani Property is surrounded by other American Lithium controlled concessions as part of the MPA. Other explorers of significance within the region are Fission 3.0 Energy Corporation (Fission), whose portfolio of properties in the Macusani area resulted from a spin-out from Strathmore Minerals in 2007 (Fission Energy Corporation, 2010). In April 2013, Fission announced the arrangement whereby Denison Mines Corporation acquired all the outstanding common shares of Fission and the spin-out of certain assets into a new exploration company, Fission Uranium Corporation. In November 2013, certain properties and assets of Fission Uranium, including the Macusani, Peru property, became properties and assets of Fission 3.0 Corp. Nine claim blocks encompassing 51km2 were held in the Macusani area (Fission 3.0 Uranium Corporation, 201420) (Riordan et al.,2020). Fission 3.0 has subsequently relinquished these concessions after failing to pay their good standing fees in June 2021.
1.13 Interpretations and Conclusions
Exploration of the Falchani property has been successful in identifying a mineral resource of lithium and ancillary cesium, rubidium, and potassium. The Falchani lithium deposit is unique in its host rock and mineralization. The lithium occurrences are hosted in an ash-flow Lithium Rich Tuff (LRT) and volcanoclastic breccias (Upper and Lower Breccia, UBX and LBX, respectively) that bound the LRT. Lithium mineralization is also observed in the basal Coarse Felsic Intrusion (CFI) which is interpreted to be a stratiform felsic intrusion underlying the above lithium host rocks.
Potential risks that may impact accuracy of the mineral resource estimates are:
- The resource is limited to within two E-W fault blocks east of the Valley Fault as described in Section 14.4.3 that may shift location given further exploration. Should new supporting data support a significant shift in the fault locations this may have a material impact on the resource estimates.
- The CFI basement and the other volcanics around the extremities of the Property are only recognized from 28 drillholes. Future exploration drilling in these areas of the Property may show these intrusions and other volcanics extending into the Property below surface. This may have a material impact on the resource estimates in these regions of the deposit.
- Metallurgical tests currently under the coordination of DRA may indicate that the input costs for the practical extraction of lithium to be higher than anticipated. Since processing costs are a significant component of lithium carbonate (or lithium hydroxide monohydrate) production, the lithium cutoff grade may be higher than the base case cutoff grade of 600 ppm used for the lithium resource estimates.
- Given the uniform densities applied to the mineralized zones, Stantec believes the density to be adequate for resource estimation, however, additional density data would support more accurate mineral resource tonnage estimates.
- There is potential for elevated uranium concentrations on Falchani based on proximity of the deposit to the Macusani Yellowcake project located 5-25 km east and north of the property.
The PEA for the Falchani Project is based upon limited and time-sensitive information, such as lithium carbonate, fuel and reagent pricing. Changes in the understanding of the Project such as access to power, social/environmental issues, the ability to convert Mineral Resources to Mineral Reserves and market demand conditions could have significant effects on the Project's overall economic viability.
The Base Case project economics have revealed a post-tax Net Present Value (NPV) of $ 5.1bn with an internal rate of return (IRR) of 32.0% and a post-tax payback period of 3.0 years based on an average LoM price of $ 22 500/t LCE.
1.14 Recommendations
The Falchani mineral resource estimation has relied on exploration drilling results. The following development path is recommended for the Falchani Project.
Phase 1 Work Program Surface Mapping
Surface mapping of the Project area will provide additional information that will enhance the understanding of the structural geology and faulting within the property. This information will greatly improve the accuracy of the current geologic model and resource estimates. Structural mapping will validate and focus the interpolated faults in the geologic model. The Authors site inspection of the property identified areas of exposed rhyolite outcrops on the Property that could be mapped in detail. Costs for a geologist and mapping program is listed in Table 1-9.
Table 1-9 Phase 1 Surface Mapping Program Costs
| Activity |
Unit costs (US$) |
No. |
Cost (US$) |
| Surface Mapping |
1,000/day |
14 |
14 000 |
| Grab Sample Assay |
50/sample |
120 |
6 000 |
| Structural modeling |
1,200/day |
8 |
9 600 |
| |
|
Total |
29 600 |
Phase 2 Work Program Infill Drilling and Modeling
The proposed Phase 2 program is not dependent on the successful results of the Phase 1 program above. For Phase 2 an infill drilling program of approximately 2,500 m is recommended to improve the mineral resource confidence. Estimated costs for the Phase 2 program is outlined in Table 1-10.
Table 1-10 Phase 2 Infill Drilling Costs
| Activity |
Unit costs (US$) |
No. |
Cost
(US$) |
| Core Drilling |
200/m |
2 500 |
500 000 |
| Core Sample Assay |
50/sample |
2 000 |
100 000 |
| Resource Modeling |
n/a |
n/a |
50 000 |
| |
|
Total |
650 000 |
Phase 3 Pre-Feasibility Study
It is recommended that a Pre-feasibility Study (PFS) be completed to further demonstrate the Project's technical and economic viability and to provide a greater degree of confidence in the capital and operating cost estimates. Further definition of the Project is required to allow a PFS to be completed and the following is recommended to further develop the Project and reduce its technical uncertainty and risk:
- Mineralized material characterisation (to better define the design data for the crushing and milling circuits);
- Mineralized material variability (to understand how variability across the orebody may impact on plant performance and to make design allowances accordingly);
- Process optimisation testwork (to optimise operating parameters and reagent consumptions);
- Equipment Sizing (to allow equipment vendors to size their equipment and provide performance guarantees);
- By-product Recovery (to define the design conditions for the recovery of valuable by-products)
- Engage with equipment vendors to carry out testwork (for example, thickeners, filters, crystallisers) to allow them to offer performance guarantees;
- Engage with vendors of the major packages to better define their scope and investigate possibilities for build, own, operate commercial arrangements.
2 INTRODUCTION
This Technical Report was prepared by DRA for American Lithium Corporation (American Lithium) in accordance with the requirements of National Instrument 43-101 Standards of Disclosure for Mineral Projects (NI 43-101). This Technical Report is an update of a prior Technical Report on the Falchani Lithium Property (the Property) completed by Stantec in December 2023 (Kartick and Loveday, 2023) and includes a PEA. In 2020 (Riordan et. al., 2020) DRA completed a PEA for the same property. The information presented in this PEA supersedes results of prior reports.
Information used in the compilation of the Technical Report was provided by American Lithium
as well as from public domain sources. All source of information in addition to the American Lithium's exploration data are listed in the reference Section 27.
Qualified Persons (QP), Mariea Kartick (P.Geo) and Derek Loveday (P.Geo), inspected the Property in May 2023. The QP's verified drill hole locations, and reviewed core, geological logs, and sample handling procedures.
2.1 Background
The Falchani Lithium Project falls within licenses held by Macusani Yellowcake S.A.C. (Macusani Yellowcake) which is controlled by American Lithium Corp. (ALC). The Project is situated on the Macusani Plateau, a region of Peru which has been actively explored for uranium since the 1980s, and more recently for lithium. ALC also controls several other properties on the Macusani Plateau, as described in Section 4.2. The combination of ALC exploration properties on the Macusani Plateau is referred to as the Macusani Project Area (MPA).
This Technical Report presents a Base Case scenario which is inclusive of both the Falchani and Ocacasa 4 concessions.
The Project consists of an open pit mine and an associated processing facility along with onsite and off-site infrastructure to support the operation.
2.2 Project Scope and Terms of Reference
The Project consists of an open pit mine and an associated processing facility along with onsite and off-site infrastructure to support the operation. The life of mine production covers 43 years with 32 years processing feed from mining activities and 11 years processing low grade stockpiles build up over the mine life. Mining activities commence two years (Years -2 and -1) prior to start of production resulting in 34 years mining activities The initial Project (Phase 1) has been designed to produce nominally 23,000 tonnes per year of battery grade lithium carbonate. Production will increase in Phase 2 to 45 000 tonnes per year and Phase 3 to 84 000 tonne per year.
This technical report has been prepared by DRA Pacific Pty Ltd and DRA Projects Pty Ltd (DRA) on behalf of ALC, a company listed on the TSX Venture Exchange. This technical report documents the results of a Preliminary Economic Assessment (PEA) Update for the Falchani Lithium Project (Falchani) located on the Macusani Plateau in the Puno District of southeastern Peru.
2.3 Study Participants
DRA is an independent company specializing in the development, design, construction, and operation of mining and metallurgical projects globally. DRA was commissioned by ALC to carry out a PEA Update to design and cost a process facility, with associated infrastructure, to treat the Falchani lithium-bearing material to produce battery grade lithium carbonate. DRA also prepared the mine plan. The prepared estimate is classified by DRA as a Class 4 estimate with a +40% / -40% accuracy, similar to an AACE International Class 4 (+50% / -30%) and deemed suitable for a PEA-level study.
Stantec is a leading advisory firm focused on the provision of geological and mining engineering services and has prepared the Mineral Resource estimates and completed data verification for the project.
2.4 Primary Information Sources
This report makes use of the following primary information sources:
Technical Report and Mineral Resource Estimate- Falchani Property; Prepared by Stantec Consulting Ltd. Salt Lake City, Utah. Report Date December 2023, and Effective Date October 31, 2023.
The technical report titled "Mineral Resource Estimates for the Falchani Lithium Project in the Puno District of Peru" with an effective date of 1 March 2019 prepared by The Mineral Corporation for Plateau Energy Metals Inc under National Instrument 43-101 and accompanying documents NI 43-101F1 and NI 43-101CP. The Mineral Corporation Report No. C-MYI-EXP-1727-1134. Effective Date: 01 March 2019 (The Mineral Corporation, 2019).
ANSTO Minerals, "Lithium Recovery From the Macusani Deposit - C1568," ANSTO, 2018.
"Plateau Energy Metals Falchani Lithium Trade-off Study Report," DRA, Perth, 2019.
ANSTO Minerals, "Optimisation of Sulfuric Acid Extraction of Lithium From The Macusani Deposit - C1630 DRAFT," ANSTO, 2019.
ANSTO Minerals, "PN1 Leach Tests American Lithium Phase III vs 2 (3_11_23)," ANSTO, 2023.
ANSTO Minerals, "ANSTO Report C1818_Plateau Energy Metals Alum Processing Phase II," ANSTO, 2023.
ANSTO Minerals, "C1667 Alum Processing Desktop Study and Preliminary Tests DRAFT 29.01.2020," ANSTO, 2023.
DRA Pacific, "Falchani Lithium Project NI 43-101Technical Report - Preliminary Economic Assessment" DRA, 2022.
DRA has also used various other information sources which are referenced where applicable in this report.
2.5 Qualified Persons
The DRA Qualified persons are:
- John Riordan, BSc, CEng, AuslMM, MIChemE, RPEQ
- Aveshan Naidoo, MEng, PrEng
- David Thompson, B-Tech, Pr Cert Eng, SACMA
The Stantec Qualified persons are:
- Derek J. Loveday, P. Geo.
- Mariea Kartick, P. Geo.
This PEA was prepared by, or under the supervision of, the Qualified Person(s) identified in Table 2-1.
Table 2-1 Report Sections and Qualified Persons
|
Section #
|
Section Title
|
Qualified Person(s)
|
|
1
|
Summary
|
DRA - John Riordan
Stantec - Derek Loveday
Stantec - Mariea Kartick
|
|
2
|
Introduction
|
DRA - John Riordan
Stantec - Derek Loveday
Stantec - Mariea Kartick
|
|
3
|
Reliance on Other Experts
|
DRA - John Riordan
|
|
4
|
Property Description and Location
|
Stantec - Derek Loveday
Stantec - Mariea Kartick
|
|
5
|
Accessibility, Climate, Local Resources, Infrastructure and Physiography
|
Stantec - Derek Loveday
Stantec - Mariea Kartick
|
|
6
|
History
|
Stantec - Derek Loveday
Stantec - Mariea Kartick
|
|
7
|
Geological Setting and Mineralization
|
Stantec - Derek Loveday
Stantec - Mariea Kartick
|
|
8
|
Deposit Types
|
Stantec - Derek Loveday
Stantec - Mariea Kartick
|
|
9
|
Exploration
|
Stantec - Derek Loveday
Stantec - Mariea Kartick
|
|
10
|
Drilling
|
Stantec - Derek Loveday
Stantec - Mariea Kartick
|
|
11
|
Sample Preparation, Analyses and Security
|
Stantec - Derek Loveday
Stantec - Mariea Kartick
|
|
12
|
Data Verification
|
Stantec - Derek Loveday
Stantec - Mariea Kartick
|
|
13
|
Metallurgy and Metallurgical Testing
|
DRA - John Riordan
|
|
14
|
Mineral Resource Estimates
|
Stantec - Derek Loveday
Stantec - Mariea Kartick
|
|
15
|
Mineral Reserve Estimates
|
Stantec - Derek Loveday
Stantec - Mariea Kartick
|
|
16
|
Mining Methods
|
DRA - David Thompson
|
|
17
|
Recovery Methods
|
DRA - John Riordan
|
|
18
|
Project Infrastructure
|
DRA - John Riordan
|
|
19
|
Market Studies and Contracts
|
DRA - John Riordan
|
|
20
|
Environmental Studies, Permitting and Social or Community Impact
|
DRA - John Riordan
|
|
21
|
Capital and Operating Costs
|
DRA - John Riordan
DRA - David Thompson
|
|
22
|
Economic Analysis
|
DRA - Aveshan Naidoo
|
|
23
|
Adjacent Properties
|
Stantec - Derek Loveday
Stantec - Mariea Kartick
|
|
24
|
Other Relevant Data and Information
|
DRA - John Riordan
|
|
25
|
Interpretation and Conclusions
|
DRA - John Riordan
Stantec - Derek Loveday
Stantec - Mariea Kartick
|
|
26
|
Recommendations
|
DRA - John Riordan
Stantec - Derek Loveday
Stantec - Mariea Kartick
|
|
27
|
References
|
DRA - John Riordan
Stantec - Derek Loveday
Stantec - Mariea Kartick
|
2.6 Qualified Person Site Visit
Derek Loveday and Mariea Kartick authors and independent Stantec Qualified Personnel (QP) inspected the Property in May 2023. The QP's verified drill hole locations, and reviewed core, geological logs, and sample handling procedures.
A visit to site in January 2019 was attended by DRA's Val Coetzee. DRA's mining QP has not visited site visit but has reviewed all relevant reports and associated annexures. DRA was given full access to relevant data on the Project areas.
2.7 Financial Interest Disclaimer
Neither DRA, Stantec nor any of their agents or consultants employed in the preparation of this report have any beneficial interest in the assets of American Lithium Corporation.
2.8 Frequently Used Abbreviations, Acronyms and Units of Measure
Table 2-2 Abbreviations, Acronyms and Units of Measure
|
Abbreviation
|
Description
|
|
A
|
Ampere
|
|
AACE
|
AACE International
|
|
ALC
|
American Lithium Corporation
|
|
amsl
|
Above Mean Sea Level
|
|
ANSTO
|
Australian Nuclear Science and Technology Organisation
|
|
BCM
|
Bulk Cubic Metre
|
|
BG
|
Battery Grade
|
|
BMI
|
Benchmark Mineral Intelligence
|
|
BOO
|
Build Own Operate
|
|
°C
|
Degrees Celsius
|
|
Capex
|
Capital Expenditure
|
|
CIMM
|
Centro de lnvestigacion Minera y Metalurgica
|
|
Abbreviation
|
Description
|
|
cm
|
Centimetre
|
|
CRM
|
Certified Reference Material
|
|
COC
|
Chain of Custody
|
|
COG
|
Cut-off grade
|
|
Cs₂SO₄
|
Cesium Sulfate
|
|
d
|
Day
|
|
d/y
|
Days per year
|
|
Datamine
|
Datamine Strat3DTM modelling software
|
|
DEM
|
Digital Elevation Model
|
|
DGAAM
|
General Directorate of Mining Environmental Affairs (Dirección General de Asuntos Ambientales Mineros)
|
|
DRA
|
DRA Pacific
|
|
EA
|
Environmental Evaluation
|
|
EBITDA
|
Earnings before interest, taxes, depreciation, and amortization
|
|
edds
|
electronic data deliverables
|
|
EIA
|
Environmental Impact Assessment
|
|
EIA-d
|
Detail Environmental Impact Assessment
|
|
EIA-sd
|
Semi-detail Environmental Impact Assessment
|
|
EIS
|
Environmental Impact Statement
|
|
EPC
|
Engineering, Procurement, Construction
|
|
EPCM
|
Engineering, Procurement & Construction Management
|
|
EREA
|
Environmental Regulation on Exploration Activities (020-2008-EM)
|
|
Falchani
|
Falchani Lithium Project
|
|
FEED
|
Front End Engineering and Design
|
|
FEL
|
Front End Loader
|
|
FS
|
Feasibility study
|
|
ft
|
Foot
|
|
GL
|
Giga liter
|
|
h
|
Hour
|
|
h/d
|
Hours per day
|
|
ha
|
Hectare
|
|
HV
|
High Voltage
|
|
Abbreviation
|
Description
|
|
ICP-OES
|
Inductively Coupled Plasma Optical Emission Spectrometry
|
|
ICP-MS
|
Inductively Coupled Plasma Mass Spectrometer
|
|
IDW
|
Inverse-distance weighted algorithm
|
|
INGEMMET
|
Institute of Geology, Mining and Metallurgy
|
|
IPEN
|
Instituto Peruano de Energia Nuclear
|
|
IRR
|
Internal rate of return
|
|
IR
|
Impurity removal
|
|
IX
|
Ion exchange
|
|
J
|
Joule (energy)
|
|
k
|
Kilo or thousand
|
|
kg
|
Kilogram
|
|
km
|
Kilometre
|
|
kt
|
Kilo tonne (thousand metric tonne)
|
|
kW
|
Kilowatt (power)
|
|
kWh
|
Kilowatt hour
|
|
L
|
Liter
|
|
lb
|
Pounds
|
|
LC
|
Lithium Carbonate
|
|
LCE
|
Lithium Carbonate Equivalent
|
|
LCT
|
Locked Cycle Testwork
|
|
LIBS
|
Laser Induced Breakdown Spectroscopy
|
|
LoM
|
Processing Life of Mine - Total 43 years consisting of mining activity for 32 years plus 11 years treating low grade surface dumps
|
|
LV
|
Low voltage
|
|
m
|
Metre
|
|
M
|
Million
|
|
Mt
|
Million tonnes
|
|
m2
|
Square metre
|
|
m3
|
Cubic metre
|
|
MEM
|
Ministry of Energy and Mines (See MINEM)
|
|
MetSim
|
METSIM metallurgical modelling software
|
|
MCC
|
Motor control center
|
|
Abbreviation
|
Description
|
|
MEG
|
Moment Exploration and Environmental Geochemistry Inc.
|
|
MINAM
|
Ministry of the Environment (Ministerio del Ambiente)
|
|
MINEM
|
Ministerio de Energía y Minas de Perú (See MEM)
|
|
mm
|
Millimetre
|
|
MM
|
Mineralized Material
|
|
m/h
|
Miles per hour
|
|
MPA
|
Macusani Project Area
|
|
MRE
|
Mineral Resource Estimate
|
|
MSP
|
Mixed Sulfate Product
|
|
Mst
|
Million std tonnes
|
|
Mt
|
Million tonnes (metric)
|
|
Mt/y
|
Million tonnes per year
|
|
MW
|
Megawatt
|
|
NPV
|
Net present value
|
|
OK
|
Ordinary kriging
|
|
OSINERGMIN
|
Supervisory Agency for Investment in Energy and Mining (Organismo Supervisor de la Inversión en Energía y Minas)
|
|
P80
|
80% passing size
|
|
PAMA
|
Program for Environmental Management and Adjustment
|
|
PEA
|
Preliminary Economic Assessment
|
|
PFS
|
Pre-Feasibility Study
|
|
PLS
|
Pregnant Leach Solution
|
|
PPM
|
Parts Per Million
|
|
PS
|
Process Start
|
|
QA/QC
|
Quality Assurance and Quality Control
|
|
QP
|
Qualified Person as defined in NI43-101
|
|
RC
|
Reverse Circulation drilling
|
|
RoM
|
Run-of-Mine
|
|
SIB
|
Stay in Business
|
|
SOP
|
Sulfate of Potash/ Potassium Sulfate/ K₂SO₄
|
|
RQD
|
Rock Quality Designation
|
|
Abbreviation
|
Description
|
| s |
Second |
|
SAP
|
Sulfuric Acid Plant
|
|
SENACE
|
National Environmental Certification Service for Sustainable Investments (Servicio Nacional de Certificación Ambiental para las Inversiones Sostenibles)
|
|
t
|
Tonne (metric)
|
|
t/d
|
Tonnes per day
|
|
t/h
|
Tonnes per hour
|
|
t/m3
|
Tonnes per cubic metre
|
|
t/y
|
Tonnes per year
|
|
TMI-RTP
|
Total Magnetic Intensity - Reduced to the Pole
|
|
TSF
|
Tailings Storage Facility
|
|
$
|
United States Dollar
|
|
$ M
|
United States Dollar - Million
|
|
$ B
|
United States Dollar - Billion
|
|
µm
|
Micrometre or micron
|
|
UNDP/IAEA
|
United Nation Development Programme/International Atomic Energy Agency
|
|
UTM
|
Universal Transverse Mercator
|
|
V
|
Volt
|
|
VAT
|
Value added tax
|
|
VSD
|
Variable speed drive
|
|
WAI
|
Wardell Armstrong International
|
|
WMSF
|
Waste Material Storage Facility
|
|
WRSF
|
Waste Rock Storage Facility
|
|
XRD
|
X-Ray Diffraction
|
|
XRF
|
X-Ray Fluorescence
|
|
y
|
Year or Years
|
|
|
|
3 RELIANCE ON OTHER EXPERTS
The Qualified Persons have relied on expert opinions and information provided by American Lithium pertaining to environmental considerations, taxation matters and legal matters including mineral tenure, and surface rights.
With respect to Mineral Tenure (Section 4.2), Stantec has relied on information that has been provided by American Lithium. This information is believed to be correct to the best of the QP's knowledge and it would appear that no information has been intentionally withheld that would affect the contents of this report. It is noted that the QP has not interrogated the legal aspects of title or mineral rights for the properties and concessions and cannot therefore express a legal opinion as to the ownership status of the mining concessions. However, Stantec has interrogated the Peruvian national concession online registry administered by INGEMMET to confirm the validity and ownership of the Falchani project concessions by ALC subsidiaries.
For the purposes of Section 19 (Market Studies and Contracts) of this report, the Qualified Person has relied on information pertaining to market forecasts provided by Benchmark Minerals Intelligence as referenced within the section. The Qualified Person has reviewed the information provided by American Lithium and believes this information to be correct and adequate for use in this report.
For the purposes of Section 20 (Environmental Studies, Permitting, and Social or Community Impact) of this report the Qualified Person has relied on information provided by American Lithium as referenced within the section. The Qualified Person has reviewed the information provided by American Lithium and believes this information to be correct and adequate for use in this report.
For the purposes of Section 22 (Economic Analysis) of this report the Qualified Person has relied on information provided by American Lithium and other sources as referenced within the section, pertaining to taxation. The Qualified Person has reviewed the taxation information provided and believes it to be correct and adequate for use in this report.
4 PROPERTY DESCRIPTION AND LOCATION
4.1 Description and Location
Peru is divided into 24 "Departments", each of which is subdivided into provinces and districts or regions. The American Lithium concessions are located in the Carabaya Province which is a province of the Department of Puno in the south-eastern part of Peru. The Carabaya Province is divided into ten districts or regions. It is bounded to the north by the Madre de Dios Region, on the east by the Sandia Province, to the south by the provinces of Azángaro, Melgar and Putina and on the west by the Cusco Region. The capital of the province is Macusani. The people in the province are mainly indigenous citizens of Quechua descent. Quechua is the language which the majority of the population (84%) learn to speak from childhood, while 15% of the residents use the Spanish language and <1% communicate in Aymara.
Falchani is an exploration property located on the Macusani Plateau and falls within licenses held by Macusani Yellowcake S.A.C (Macusani Yellowcake), formerly Global Gold S.A.C, which is 100% controlled and 99.5% owned by American Lithium. American Lithium has a number of other exploration properties on the Macusani Plateau, which are primarily uranium exploration properties, and for which Mineral Resources have been declared. The combination of American Lithium' exploration properties on the Macusani Plateau is referred to as the Macusani Project Area (MPA). The locality of the Macusani Project Area (MPA) is shown in Figure 4-1, General Location Map. The portfolio comprises the amalgamation of those rights held by American Lithium along with along with six uranium Complexes. American Lithium owned concessions that include the lithium mineral resource outlined in Section 14 of the report is shown in Figure 4-2, Mineral Tenure Map.
The MPA is located approximately 650 km east southeast of Lima and about 220 km by road from Juliaca in the south. The town of Macusani is some 25 km to the southeast of the Macusani Plateau. The MPA covers a total area of 109,057 ha.
The survey reference system utilized for this report is Universal Transverse Mercator, Zone 19S, using the WGS 1984 datum, hereafter referred to as WGS84 UTM Zone 19S. The MPA concessions lie between the coordinates 320,000 and 340,000 East and 8,444,000 and 8,467,500 North.
4.2 Mineral Tenure
4.2.1 Regulatory Mechanism
Mining in Peru is primarily regulated by national laws and regulations enacted by the Peruvian Congress and the executive branch of government. The principal legal framework on mining is set forth in the 1992 General Mining Law and its amendments to promote the development of the mineral resources of the nation. The mining sector is regulated by its Law and Regulations on Organization and Functions, pursuant to which the Ministry of Energy and Mines (MEM) was created. It is the principal government entity that, together with its various offices, departments, and agencies, is responsible for the mining sector in Peru. The MEM is a member of the executive branch of government and is responsible for putting in place specific policies and rules governing the matters in its jurisdiction, namely energy, hydrocarbon, and mining activities.
Investment promotion laws, the Peruvian tax regime and environmental framework are other components of the Peruvian mining landscape. Concessions are granted for exploration, exploitation, beneficiation, auxiliary services, and transportation by the MEM. No concessions are required for reconnaissance, prospecting, or trading.
4.2.2 Property and Title
The general mining law defines and regulates different categories of mining activities according to stage of development (prospecting, exploitation, processing, and marketing). The ownership of mineral claims is controlled by mining concessions which are established using UTM coordinates to define areas of interest and measured in hectares. While the holder of a mining concession is protected under the Peruvian Constitution and the Civil Code, it does not confer ownership of land and the owner of a mining concession must deal with the registered landowner to obtain the right of access to fulfil the production obligations inherent in the concession grant. It is important to recognize that all transactions and contracts pertaining to a mining concession must be duly registered with the Public Mining Registry in the event of subsequent disputes at law.
4.2.3 Environmental Regulations
The General Mining Law, administered by the MEM, may require a mining company to prepare an Environmental Evaluation (EA) Peru, an Environmental Impact Assessment (EIA), a Program for Environmental Management and Adjustment (PAMA) and a Closure Plan prior to mining construction and operation.
4.2.4 Granting of Mining Concessions
MEM grants mining concessions to local or foreign individuals or legal entities, through a specialized body called The Institute of Geology, Mining and Metallurgy (INGEMMET). A mining concession grants its holder the right to explore and exploit minerals within its area and the key characteristics include:
- Concessions are exclusive, freely transferable and mortgageable
- Location is in WGS84 UTM Zone 19S
- The aerial extent of concessions ranges from 100 ha to 1,000 ha
- Granted on a first-come, first served basis, without preference given to the technical and financial qualifications of the applicant
- With the exception of mining concessions granted within urban expansion areas, the term of a mining concession is indefinite but with restrictions and objective based criteria including payment of annual license fees of $3 per hectare. Failure to pay the applicable license fees for two consecutive years will result in the termination of the mining concession
- A single annual fee is payable; and
- Access to the property must be negotiated with surface landowners.
4.2.5 Work Program for Mining Concessions
A work program and expenditure schedule have to be presented in Year 7 of the life of a mining concession to the MEM and penalties are incurred for under expenditure. By Year 12 of the life of a mining concession, it is expected that exploitation should be ongoing; if this is not the case, then justification has to be presented to the MEM and an extension of 6 years may be conferred (Henkle, 2014). The work program budget and expenditure defined in the "objective based criteria" for Macusani Yellowcake was approximately $3.8 m against a budget of $5 m.
4.2.6 Mining Concession Description
The Mineral Resources in this report fall within four (4) mining concessions, as shown in Figure 4-2. Macusani Yellowcake is 100% controlled and 99.5% owned by American Lithium.
On February 20, 2019, INGEMMET issued Resolution No. 0464-2019-INGEMMET/PD (the "Resolution") declaring the expiration of the Ocacasa 4 concession, among others, citing the late payment of annual concession fees. The affected concessions are shown in Figure 4-2, and it is noted that the Falchani concession does not form part of the Resolution. The Resolution was upheld by MINEM in July 2019, through Resolution No. 363-2019-MINEM/CM (together with the Resolution, the "Admin Resolutions").
As the expiration of Ocacasa 4 was not issued through a court of law, Administrative Acts may be declared invalid within 2 years of the original issuance, through a legal process. In October 2019, the court in Peru admitted the "Demanda Contencioso Administrativa" (the "Contentious-Administrative Filing") submitted by Macusani, in adherence with the prescribed deadline (3 months) to commence the judicial process requesting annulment of the Admin Resolutions that cancelled the concessions and seeks to restore their validity and Macusani's legal title to the Concessions.
As reported by American Lithium in November 2019, Macusani has been granted a "Medidas Cautelares", or "Precautionary Measure" with respect to 17 of these 32 concessions. The Precautionary Measure provides for:
- Temporary suspension of the effects of the Resolution declared by INGEMMET
- Temporary suspension of the effects of the resolutions issued by MINEM which confirmed the resolution issued by INGEMMET
- Temporary suspension of the effects of the Presidential Resolution W/N issued by INGEMMET. dated October 3rd, 2018, that declared inadmissible the accreditation of the payments for the 32 mining concessions, and
- Temporary restoration of the validity and ownership of the 32 mining concessions.
American Lithium has further reported that a Precautionary Measure was granted for the remaining 15 concessions, including Ocacasa 4, on March 2, 2021. The Contentious-Administrative proceedings potentially has three phases and could last for between 36 and 78 months. A total of 6 judicial rulings on the 32 concessions have been decided in Plateau's favor, and American Lithium continues pursuing both judicial and administrative remedies. If ALC does not obtain a successful resolution to these proceedings, Macusani's title to the Ocacasa 4 concession could be revoked and ALC would not be able to proceed with the Base Case.
Table 4-1 Falchani Mineral Resource Mining Concessions
|
Concession Number
|
Owner/ Title
|
Date
|
Area (Ha)
|
|
010320205
|
MACUSANI YELLOWCAKE S.A.C
|
13/10/2023
|
700
|
|
010076505
|
MACUSANI YELLOWCAKE S.A.C
|
28/3/2023
|
500
|
|
010078105
|
MACUSANI YELLOWCAKE S.A.C
|
29/3/2023
|
600
|
|
010215005
|
MACUSANI YELLOWCAKE S.A.C
|
11/7/2005
|
1,000
|
4.2.7 Conclusions and Limitations
The parts of the Falchani Project which fall within the Falchani concession lie within a valid and secure mining concession. There have been changes to the mineral tenure circumstances of Ocacasa 4 when compared to that reported in the 2019 Technical Report. These changes have required the QP to consider if the reporting of Mineral Resource estimates within the Ocacasa 4 concession remains appropriate.
The effect of the Precautionary Measure is that Macusani maintains the validity and ownership of 17 of the 32 mining concessions as they were prior to the issuance of the INGEMMET resolutions, until all administrative and judicial remedies have been exhausted. An identical Precautionary Measure was granted for the remaining 15 concessions, including Ocacasa 4, on March 2, 2021. Furthermore, American Lithium maintains that the concession payments were valid, on time, in accordance with the "General Mining Law" and that there is a reasonable prospect for a permanent resolution, either through judicial or administrative processes. Most recently, on November 15, 2023, 2023, a three-judge tribunal of Peru's Superior Court SALA 4 specialized in administration disputes has unanimously upheld the ruling of the lower court judge from Court SALA 6 from November 2, 2021, in favor of Macusani Yellowcake in relation to title over 32 disputed concessions out of 172 owned by Macusani Yellowcake. The Court ruling, consistent with prior legal proceedings, clearly establishes that Macusani is the rightful owner of these concessions and highlights that the action launched by INGEMMET and MINEM in October 2018 was baseless and unsubstantiated. INGEMMET and MINEM have one final opportunity to petition the Supreme Court of Peru to consider the tribunal's ruling based on legal arguments, which have been exhausted. American Lithium believes the Supreme Court will not accept any petition of the lower courts' rulings. American Lithium, and its subsidiaries, have a demonstrated track record of managing the mineral tenure for a number of projects in Peru over several years. On this basis, the QP considers it reasonable to still report the estimates within Ocacasa 4 as Mineral Resources.
Stantec has restricted its review of the Mining Concession held by Macusani Yellowcake to checking the individual license boundaries on plans against those depicted on the mining concession outputs from the MEM. No legal reviews of the validity of the process Macusani Yellowcake went through to obtain the mining concessions have been undertaken, nor has an attempt been made to understand the various company structures and ownerships prior to transfer to Macusani Yellowcake.
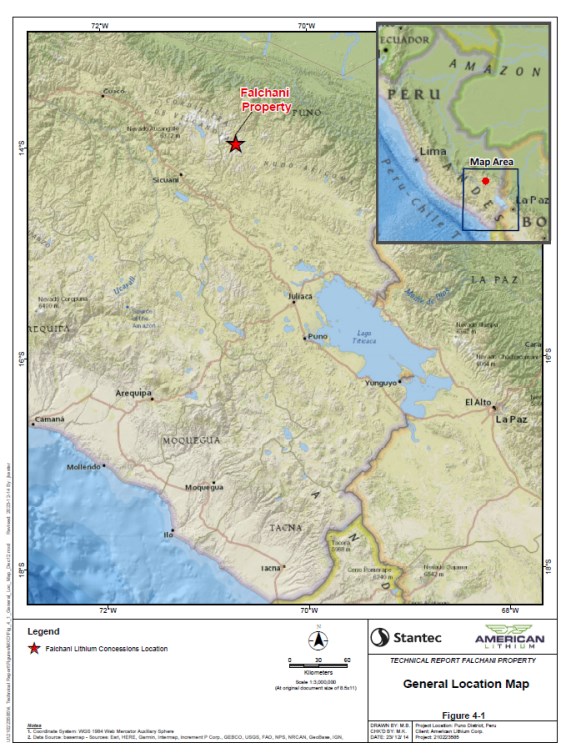
Figure 4-1 General Location Map
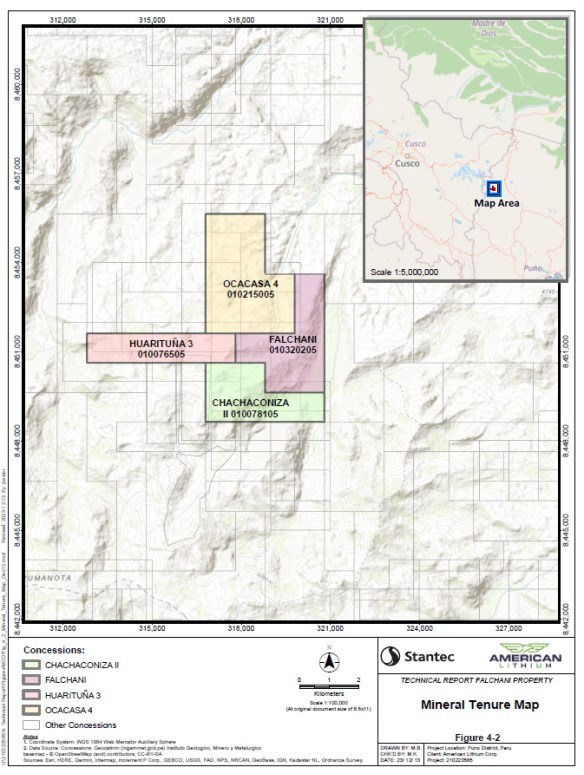
Figure 4-2 Mineral Tenure Map
5 ACCESSIBILITY, CLIMATE, LOCAL RESOURCES, INFRASTRUCTURE AND PHYSIOGRAPHY
5.1 Accessibility to Site
The MPA is located approximately 650 km east south-east of Lima and about 220 km by road from Juliaca to the south. The nearest towns to the MPA are Macusani (25 km to the south-east) and Corani (14 km to the north-west).
The Interoceanica Highway (IH) is a system of tarred/sealed roads that link the ports of Materani, Molendo and Ilo on the west coast of Peru over the Andes Mountains to the west side of Brazil. The IH passes within 10 km to 15 km to the east of the MPA. Two unpaved roads connect the Project to the IH and other unpaved roads, generally in good condition, connect the various sites within the MPA to one another. These roads are accessible during the dry season in two-wheel drive vehicles and during the wet season in four-wheel drive vehicles.
The closest airport to the MPA is located at Juliaca. The facility is in good condition and services daily flights from Lima and Cusco.
5.2 Access to Land
The issue of land tenure is of increasing significance in Peru, particularly as the national cadastral system for agricultural land ownership is not always accurate due to many rights over private land not being registered. Peruvian law does not vest surface rights with mineral rights and any proposed development requires the developer to purchase the surface rights or negotiate an appropriate access agreement with the surface rights owners to have access to the property.
At present the company has working agreements ("convenios") with the following communities within the MPA: Chaccaconiza, Isivilla, an independent Cooperative (Imagina), Quelccaya and various independent small land holders. The working agreement with the community of Quelccaya is valid until July 2020. Until sanctioned otherwise, the agreement with the Cooperative and the small land holders is open ended and based on the progress achieved by exploration. The agreement with the communities of Chaccaconiza and Isivilla have expired and are being renegotiated. Short-term agreements and subsequent renewals are the model under which ALC has been working with its host communities for the past 15 years. The Company is in constant dialogue with all of its host communities in the MPA as part of its continuity of community relations programs and does not foresee any issues with subsequent renewals when the time comes.
5.3 Climate
The climate on the Macusani Plateau is characterized by two distinct seasons - the wet season (which starts in September but peaks from January to April) and the dry season (May to September). The rainy season is controlled by tropical air-masses and the dry winters by subtropical high pressure.
While the exposed eastern slopes of the Andes receive more than 2,500 mm of rain annually, the average rainfall for the Carabaya Province varies between 600 mm to 1,000 mm. The period between May and August is characterized by very dry conditions and cold nights. Significant electrical storm activity is common in the wet season and moisture falls in the form of rain, hail and, occasionally snow.
Temperatures range from 19°C in November to -10°C in July. While temperatures are mild, high ultraviolet readings are common in the middle of the day. These climatic conditions and the altitude dictate that the area is vegetated by coarse scrub and grasses.
5.4 Local Resources
Peru has a robust mining economy with many operations exploiting copper, gold, iron ore, lead, molybdenum, rhenium, silver, tin and zinc, as well as industrial minerals and mineral fuels (coal, natural gas and crude oil). Founded on this mining culture, it is thus reasonable to assume that a workforce consisting of skilled and semi-skilled people could be sourced for the Project.
5.5 Infrastructure
The San Gaban II hydro generation station is approximately 40 kms (88 km via the IH) to the north of the MPA and high voltage power lines run adjacent to the MPA. In order for a grid connection to be made an extension of the power line will be required to reach the project site and any connection will be subject to negotiation with the supply authority. These matters will need to be taken into account as the project progresses.
At this time, the supply of water is derived from local river courses. In its 2014 Preliminary Economic Assessment (PEA) for Plateau Energy Metals' uranium projects, GBM Mining Engineering Consultants Limited (GBM) was of the view that the area has access to sufficient water resources for the purposes of mining operations (Short et al, 2014).
5.6 Physiography
The Macusani Plateau is part of the relatively flat Altiplano of the Eastern Cordillera of the Andes Mountain Range, except where incised narrow canyons exist with a relief of up to 250 m. The canyon walls are steep with slope angles up to 60°, with some sections being vertical. The elevation of the Plateau ranges between 4,330 m and 4,580 m above mean sea level.
6 HISTORY
6.1 Introduction
The Falchani Property is situated within what is largely known as the Macusani Project Area (MPA) (Riordan et al., 2020). Historical ownership and exploration are described below. There is no record of mining activity within or adjacent to the Falchani Property.
6.2 Ownership History
6.2.1 Uranium Price Fluctuations
To a large extent, the cyclical nature of uranium exploration on the Macusani Plateau has been driven by the fluctuating price of the commodity since the mid-1980s. During the collapse of prices in the 1980s and in the wake of the Three Mile Island accident, there was little incentive for exploration and mining companies to explore for uranium. However, the uranium prices experienced a spectacular rise between 2001 and 2008 during which time junior mining companies mobilized their campaigns by staking properties over prospective ground. Amongst these early explorers was Vena Resources Inc (Vena) who acquired seven concessions in the Macusani Plateau as well as additional concessions elsewhere in Peru (Henkle, 2011). In 2006, Vena commenced scintillometer prospecting, radon, and surface outcrop mapping over various IPEN uranium showings.
Global interest in uranium declined in the wake of the Global Economic Crisis of 2008/2009 and, more so, in the aftermath of the Fukushima Daiichi nuclear disaster in March 2011.
6.2.2 Macusani Yellowcake
Macusani Yellowcake Inc. was a Canadian uranium exploration and development company focused on the exploration of its properties on the Macusani Plateau. The Company was incorporated in November 2006 and was created through the amalgamation of privately held Macusani Yellowcake Inc. and Silver Net Equities Group, a TSX Venture Capital pool company. The Company owns a 99.5% interest in the Peruvian concessions through Global Gold S.A.C. Macusani has been actively exploring in the Macusani area since 2007.
6.2.3 The Cameco-Vena Joint Venture
In 2007, Cameco Corporation (and its wholly owned subsidiary Cameco Global Exploration Limited (Cameco)) entered into a joint venture with Vena with the objective of jointly exploring for uranium in Peru. Minergia S.A.C was formed as the joint venture vehicle, with Cameco providing the funding and Vena undertaking the exploration management. The ownership was founded on 50% shareholding in favor of each party. The combined portfolio covered an area of 14,700 ha. The details of this transaction are summarized by Henkle (2014).
6.2.4 Azincourt buys Minergia
During November 2013, Azincourt Uranium announced that it had entered into a definitive share-purchase agreement with joint-venture partners Cameco and Vena to acquire full ownership of the resource-stage Macusani and other exploration projects. In January 2014, Azincourt announced that the acquisition of Minergia S.A.C. had been completed.
6.2.5 Macusani purchases Minergia
Macusani Yellowcake Inc. and Azincourt Uranium Inc. announced in September 2014 that they had completed the acquisition by Macusani of Azincourt's adjacent uranium properties located on the Macusani Plateau. Under the terms of the transaction, Macusani acquired 100% of Azincourt's Peruvian subsidiary, Minergia S.A.C. Arising from this transaction, there was a consolidation of mining concessions within the MPA.
6.2.6 Macusani changes name to Plateau Uranium Inc.
On April 30, 2015, Macusani Yellowcake Inc. changed its name to Plateau Uranium Inc. Young (2015) reported consolidated uranium Mineral Resources estimates for six mineral Complexes that fell under the Plateau Uranium umbrella. In May 2016, the Mineral Resources for two of the Complexes (Kihitian and Isivilla) were updated to include lithium and potassium (Stantec, 2016).
6.2.7 Plateau Uranium Inc. changes name to Plateau Energy Metals Inc.
In March 2018, Plateau Uranium Inc. changed its name to Plateau Energy Metals.
6.2.8 American Lithium Corp. Acquires Plateau Energy Metals
In April 2021, ALC, a Vancouver based TSX Venture listed company with lithium assets in the USA, acquired Plateau Energy Metals Inc.
6.3 Previous Regional Exploration
6.3.1 Instituto Peruano de Energia Nuclear
In 1975, the uranium and nuclear activities in Peru were placed under the control of the Instituto Peruano de Energia Nuclear (IPEN). A five-year exploration plan (1976-1981) was initiated with the aim of identifying and developing resources in the country. The Macusani East area was the most studied area in southern Peru by IPEN. After IPEN discovered the first 60 uranium showings in 1978, systematic radiometric prospecting and trenching were carried out over an area of approximately 600km2, culminating in the discovery of numerous additional uranium showings (Young, 2013).
6.3.2 UNDP/IAEA
From mid-1977, a long-term United Nation Development Programme/International Atomic Energy Agency (UNDP/IAEA) project was initiated consisting of regional reconnaissance over selected areas. The results of most of the work were negative except for those from a car-borne radiometric survey of the Puno Basin where a significant discovery was made near Macusani in the southern Cordillera Oriental, north of Lake Titicaca. Anomalies were found in the volcanic and interbedded sediments of the Upper Tertiary age Macusani volcanics and the Permian age Mitu Group (Young, 2013).
In the same exploration phase, additional anomalies were located to the SSW near Santa Rosa in Tertiary age porphyritic rhyolites and andesites.
These (and other discoveries in the Lake Titicaca region) concentrated the exploration in the area. A helicopter spectrometric survey of selected areas was completed in 1980 in Muñani, Lagunaillas and Rio Blanca as an IAEA/IPEN Project and a fixed wing survey was completed in an adjacent area by IPEN. Numerous uranium anomalies were discovered.
In 1984, the Organization for Economic Co-operation and Development's Nuclear Energy Agency and the IAEA sponsored an International Uranium Resources Evaluation Project Mission (IUREP, 1984) to Peru. The mission estimated that the Speculative Resources of the country fell within the range of 6,000 to 11,000 t of uranium.
6.4 Property Exploration
Two diamond drilling campaigns were undertaken at the Falchani Project. The first campaign was initiated in 2017, and the second program continued to the end of December 2018. In total, 51 drillholes were drilled by Macusani Yellowcake, from 15 drilling platforms. The total drilled length was 14,816 m with a total of 9,102 samples, excluding QAQC control samples. Due to drill access limitations, the drilling was mainly undertaken from a series of platforms, with anything from two to nine drillholes being drilled radially from each platform (Nupen, 2019, Riordan et al., 2020).
For the 2017-2018 drilling programs, sample preparation was done on site at a mobile field station which was located close to the drill rigs and periodically re-located. Once logged and photographed, the entire core identified for sampling was placed into a sampling bag. The pre-marked aluminum tag was stapled to the sample bag. Sample depths were recorded together with a basic geological description on a sampling reconciliation log which was later entered digitally. Quality control samples in the form of standards were inserted at the permanent field office located in the village of lsivilla. These standards were prepared by Macusani Yellowcake and certified by ALEPH Group & Asociados S.A.C. Metrologia de las Radiaciones (Radioactivity Measuring Techniques) by having check analyses of the standards completed at CERTIMIN SA (CERTIMIN), which was previously known as the Centro de lnvestigacion Minera y Metalurgica (CIMM), laboratory in Lima (Nupen, 2019, Riordan et al., 2020).
Plateau Energy Metals conducted a surface sampling program in April 2018. A total of 181 samples were collected and analyzed for lithium.
6.5 Historic estimates
Two prior estimates have been documented for the Falchani Property. In 2018, by The Mineral Corporation (TMC) (Nupen, 2018) for Plateau Energy Metals Inc. In 2019, TMC updated their estimates (Nupen, 2019) for Plateau Energy Metals Inc. Table 6-1 shows the 2018 historical estimates and Table 6-2 shows the 2019 historical estimates.
Table 6-1 2018 Historic Estimates (Nupen, 2018)
|
Category
|
Metric Tonnes
(Mt)
|
Density
|
Li (ppm)
|
Li2O
|
Li2O3
|
Contained
Li2CO3
(Mt)
|
|
Indicated
|
40.58
|
2.4
|
3,104
|
0.67
|
1.65
|
0.67
|
|
Inferred
|
121.7
|
2.4
|
2,724
|
0.59
|
1.45
|
1.76
|
Li (ppm) grade cut-off of 1,000 Li (ppm) applied
Li Conversion Factors as follows: Li:Li2O=2.153; Li:Li2CO3=5.323; Li2O:Li2CO3=2.473
Table 6-2 2019 Historic Estimates (Nupen, 2019)
|
Category
|
Metric Tonnes
(Mt)
|
Density
|
Li (ppm)
|
Li2O
|
Li2O3
|
Contained
Li2CO3
(Mt)
|
|
Indicated
|
60.92
|
2.4
|
2954
|
0.64
|
1.57
|
0.96
|
|
Inferred
|
260.07
|
2.4
|
2706
|
0.58
|
1.44
|
3.75
|
Li (ppm) grade cut-off of 1,000 Li (ppm) applied
Li Conversion Factors as follows: Li:Li2O=2.153; Li:Li2CO3=5.323; Li2O:Li2CO3=2.473
To generate the estimates presented in Table 6-1 and Table 6-2, TMC modelled the deposit using the drillhole data contained in Plateau Energy Metals Microsoft Access database, Google Earth™ generated topography and Datamine Studio™ Software. For the estimates ordinary kriging was undertaken for lithium grades, into a block model using estimation parameters supported by semi-variograms generated from drillhole grade data. The QP is of the opinion that TMC's approach in generating the historic estimates shown in Table 6-1 and Table 6-2 follows general best practice. However, since 2019 additional exploration drilling has been completed Property and lithium market price projects have changed. These are material to the Project as demonstrated in Section 14, Mineral Resource Estimates.
The Authors have not done sufficient work to classify these historical estimates as current mineral resources and the issuer is not treating the historical estimate as current mineral resources.
6.6 Mining Studies
In 2020, a Preliminary Economic Assessment (PEA) was completed by DRA Pacific (Riordan et al., 2020) for Plateau Energy Metals Inc. A preliminary open pit Whittle optimization and conceptual production schedules were completed to support the PEA Study. Open pit mining was planned to use conventional truck and shovel mining methods with drill and blasting to break the rock mass into manageable particle sizes. The Base Case open pit design contained 145 Mt (LoM) of mineralized material with an average Li grade of 3,338 ppm. The stripping ratio is low at 0.97:1, waste t to mineralization t, and the total waste mined is 142 Mt. The annual mining schedule was developed based on maximum ramped up mill feed of 6 Mt/y, (≈16,500 t/d). The life of the mine of this Project was approximately 33 years producing a battery grade Li₂CO₃ product using sulfuric acid leaching and purification processes for an overall recovery of 80% from mineralized material.
The 2020 PEA was preliminary in nature and included Inferred historic estimates (Nupen, 2019) that are considered too speculative geologically to have the economic considerations applied to them. There have been no prefeasibility study or feasibility studies completed for the Falchani project. Accordingly, at the present level of development, there are no Mineral Reserve estimates for the Falchani project.
6.7 Mineral Processing and Metallurgical Testing
Past mineral processing and metallurgical testing is well documented by Riordan et al. (2020). A substantial body of metallurgical test work has been carried out on the Falchani lithium-bearing tuff material. The test work referenced was carried out by Tecmmine in Peru (prior to 2018) and test work carried out in 2018 and 2019 was completed by Tecmmine and ANSTO Minerals in Australia. Both the Tecmmine and ANSTO test work was carried out on the lithium rich tuff obtained from a trench on site. The test work supported a number of technically viable process flowsheet routes, namely: hydrochloric acid leaching, salt roast, sulfation baking, pressure leaching, purification processes.
For the 2020 PEA (see section 6.7), a flowsheet using atmospheric leaching in a sulfuric acid medium, followed by downstream purification processes, was selected for the production of battery grade lithium carbonate. The early focus of the acid leach process was on maximizing the extraction of lithium using aggressive leach conditions and the later work focused on optimizing the leach parameters and confirming inputs to the process design criteria. The process flow sheet was developed by DRA, working with ANSTO Minerals (ANSTO) and with input from M.Plan International Limited.
7 GEOLOGICAL SETTING AND MINERALIZATION
7.1 Introduction
The American Lithium concessions are located in the Carabaya Province, Puno Department of south-eastern Peru in the Andes. The Andes are a geographical feature formed by active mountain building processes driven by plate tectonics.
7.2 Regional Geology
A common geological feature of orogenic belts is that they are usually structurally and stratigraphically complex. In the Puno region of Peru, mainly Paleozoic sediments (520-250 Ma old) that were formed on the western Brazilian Craton have been highly deformed by thrusting and folding due to the westward movement of the South American tectonic plate (Brazilian Craton) over-riding the Pacific tectonic plate (Nazca Plate) along the western margin of the Americas over the last ±150 Ma. This occurred during the Pangean breakup (~ 200 Ma) which coincided with rifting between the Eurasian and African plates relative to the Americas plates. The main regional geological units and physiographic features are shown in Figure 7-1, Regional Geology Map. The Oceanic Trench as shown in Figure 7-1 forms the western margin of the South American plate.
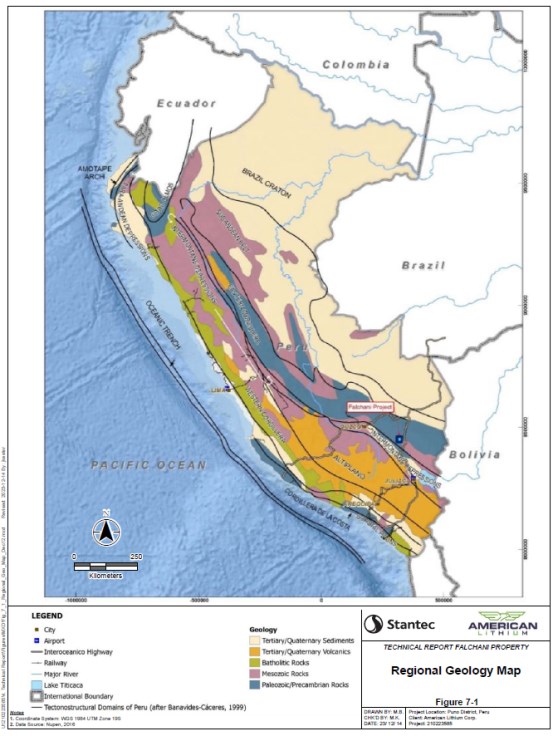
Figure 7-1 Regional Geology Map
The tectonic history has led to the older sediments being bounded by westward dipping thrusts, intense folding and intrusions of dykes, batholiths and being affected by volcanic activity at various times (Henkle, 2014). The Andes represents a large anticlinorium complicated by a series of faults and intrusions, with the flanks of this superstructure made up of the coastal Mesozoic and eastern Paleozoic belts. The Andes represent the Late Tertiary and Quaternary rejuvenation by block faulting of an eroded, early Tertiary folded mountain range which occupied the axis of Paleozoic and Mesozoic geosynclines. Topographically the mountains consist of a central dissected plateau, the Intermontane Depressions and Altiplano enclosed by narrow ranges, the Western Cordillera and the Eastern Cordillera as depicted in Figure 7-1.
7.3 Local Geology
7.3.1 Mineral Occurrences
Lithium mineralization at Falchani is hosted in an ash-flow tuff named Lithium Rich Tuff (LRT) and volcanoclastic breccias (Upper and Lower Breccia) that bound the LRT. Lithium mineralization is also observed in the basal Coarse Felsic Intrusion which is interpreted to be a stratiform felsic intrusion underlying the above lithium host rocks. These lithologic units are interpreted to be a part of the Sapanuta Member as shown in Figure 7-2, Local Geology Map. North-South (N-S), northwest (NW), and southwest (SW) trending faults are also interpreted on Figure 7-2 and discussed further below.
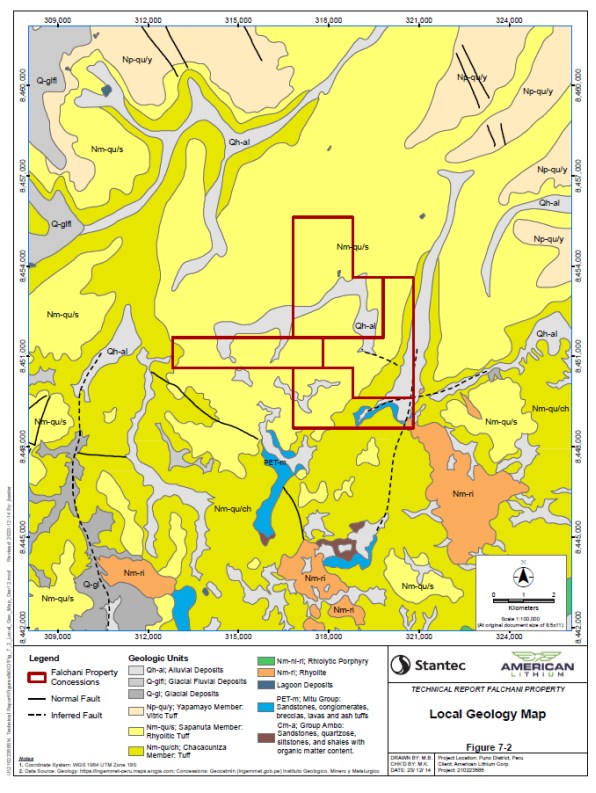
Figure 7-2 Local Geology Map
7.3.2 Structural Geology
Due to extensive pre-Andean orogenic deformation and active tectonic activity the structural geology of the Andes region is complex. The Falchani project is located within a structural deformation zone called the Macusani Structural Zone (MSZ) which is a sub-section of the Eastern Cordillera as shown in Figure 7-3, Macusani Structural Zone.
The MSZ is characterized by extensional structures that were active during Triassic rifting and later re-activated as compressional structures during Andean mountain building processes. Due to these pre-existing rift structures, the MSZ is dominated by N-S, northeast-southwest (NE-SW), and north-northwest-south-southeast (NNW-SSE) trending faults and folds (Perez, 2016). Much of the historic research on structural deformation near Falchani has focused on thick and thin-skinned tectonics affecting pre-Andean Palaeozoic rocks, and less on structural deformation affecting Cenozoic volcanic rocks. The MSZ is bounded to the south by the northwest trending re-activated Triassic San Anton normal-fault and to the north by the northwest trending Cenozoic Cordillera de Carabaya backthrust which has uplifted the MSZ as shown on Figure 7-3. Due to the active tectonic mountain building processes of the Andes, the MSZ has likely undergone more recent extension resulting in normal offset of the Cenozoic extrusion intrusive rocks that host the lithium mineralization at Falchani (Cheilletz A et al., 1992).
A detailed study of the structural geology affecting Cenozoic deposits in and around the Falchani area is warranted to better understand subsurface geology and mineralization.Figure 7-4, Fault Evidence and the Macusani Volcanic Field, shows potential fault traces as interpreted from imagery generated from the 2023 LiDAR survey.
As shown in Figure 7-4, there are N-S, NW, and SW trending topographic lows which are indicative of structural weakness. Also shown in Figure 7-4, are offset outcrop patterns that are present within the Falchani project area. The trends of the observed topographic lows bounded by steep topographic highs align with the well-studied structural trends observed in the MSZ.
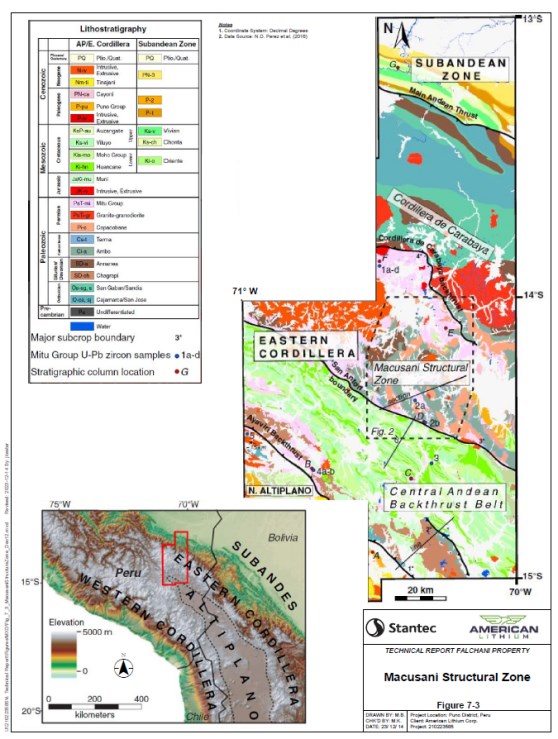
Figure 7-3 Macusani Structural Zone
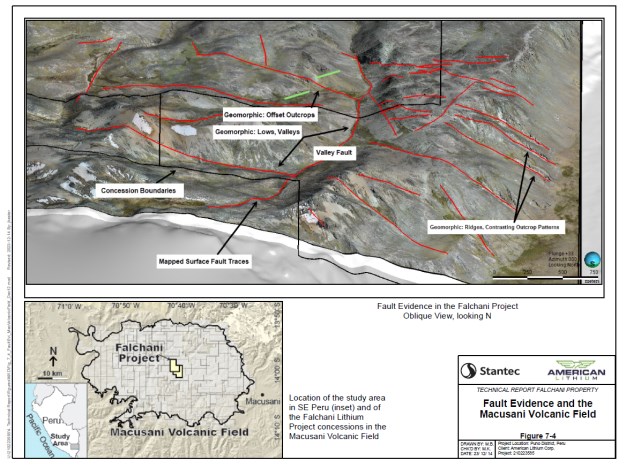
Figure 7-4 Fault Evidence and the Macusani Volcanic Field
7.4 Property Geology
Lithium mineralization within the Falchani Project is hosted in shallowly dipping acidic tuffs, with pyroclasts from sub-macroscopic to 60 mm in size. These volcanic rocks are contained within the Macusani Volcanic Field (MVF) shown in Figure 7-4 and described further by Torro et al. 2022. Primary minerals constituting the tuff are quartz, orthoclase, and plagioclase in a groundmass of amorphous glass. Crude bedding is evident in some outcrops and is based on strata containing larger and smaller pyroclasts. The petrography of the samples analysed by Thatcher (2011) indicate that the acidic volcanics (crystal lapilli tuffs) may contain varying rock type compositions ranging from rhyolite to dacite to latite which supports the likely presence of stratigraphic layering of the volcanic pile as noted in Section 7.2.1 and by Cheilletz et al (1992).
Limited mineralogical work has been undertaken by SGS Canada on samples from the Falchani Project, and the understanding of the stratigraphy has evolved through exploration mapping and drilling programs. In the immediate vicinity of the boreholes drilled at Falchani, the youngest rocks appear to be classified by Plateau Energy Metals as the Upper Rhyolite. The Upper Rhyolite forms prominent outcrops, demonstrates crude bedding, and is shallowly dipping to the north-northeast. Outcrops of the Upper Rhyolite demonstrate similar appearance to the acidic tuffs of the Yapamayo and Sapanuta Members of the Quenamari Formation, which host nearby uranium mineralization.
Below the Upper Rhyolite is the Upper Breccia, which separates the Upper Rhyolite from the Lithium Rich Tuff (LRT). The Upper Breccia is not well defined in outcrop but is very distinctive in core. Figure 7-5, Upper Breccia and LRT Contact in Core, shows the contact between the Upper Breccia and the LRT. The Upper Breccia contains angular clasts of volcanic material, in a very fine groundmass (Figure 7-5- top). The LRT is a light grey to white, very fine-grained rock, with prominent layering (Figure 7-5- bottom).
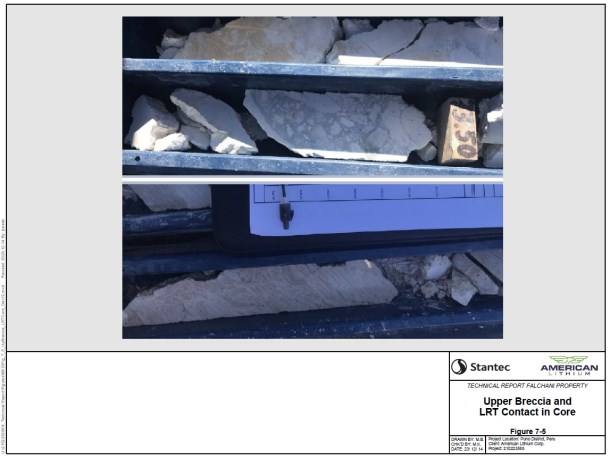
Figure 7-5 Upper Breccia and LRT Contact in Core
The contact between the LRT and the Lower Breccia is less marked than the Upper Breccia. The Lower Breccia has been identified in outcrop in the Tres Hermanas trenches and has been interpreted from drilling. Below the Lower Breccia is Coarse Felsic Intrusion (CFI), another lithium mineralized basement lithological unit.
The thickness of the Upper Breccia varies from 10 m to 20 m, while the thickness of the Lithium-rich Tuff varies in drilling from 50 m to 140 m. The Lower Breccia unit varies in thickness. Recent drilling further demonstrates that the Lower Breccia unit may reach thicknesses of up to 175 m and contains large (up to 20 m intercept lengths) blocks of Lithium-rich Tuff. The CFI below the Lower Breccia extends beyond the limits of the modelled resource and has been intersected by 28 drillholes with the max depth of 407 m in drillhole PZ01-TV3. The CFI is interpreted to have a higher density of 2.7 g/cm3 in comparison to the upper mineralized zones. The density has been determined based on the similarity to that of analogous igneous intrusive rock types such as andesite and granite (www.geologyscience.com).
The lithologic units and structures described above are displayed in two (2) cross sections (A-A' and B-B') as shown in Figure 7-6 Geologic Cross Section A-A' and Figure 7-7 Geologic Cross Section B-B'.
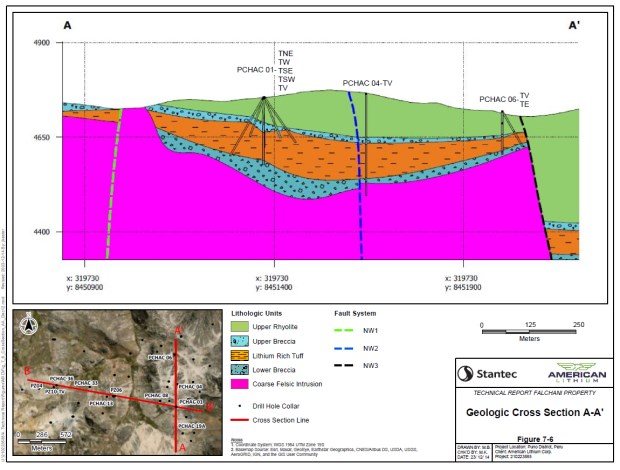
Figure 7-6 Geologic Cross Section A-A'
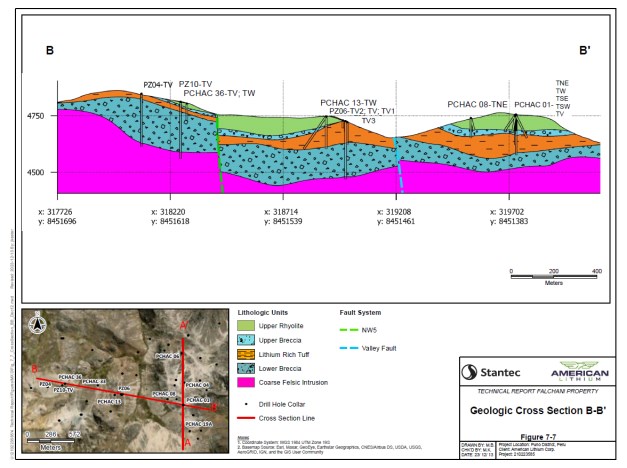
Figure 7-7 Geologic Cross Section B-B'
7.5 Mineralization
The general dimensions of the mineralized zone at Falchani covers an area approximately 3,300 m wide by 2,440 m long extending from outcrop to a maximum modelled depth of approximately 1000 m below surface. The mineralization is continuous from surface to depth. The highest and most consistent lithium grades occur in the Lithium Rich Tuff. The basement mineralized coarse felsic intrusion has a known depth of 400 m from drillhole intercepts, however the maximum thickness of the unit is still unknown
8 DEPOSIT TYPES
Increased global demand for Battery Electric Vehicles (BEVs) and electronic devices requiring lithium-ion batteries has increased exploration efforts for discovering economic Li deposits. There are currently 124 known Li-bearing minerals, of which, nine (9) are economically important. The three (3) principal deposit types hosting economic quantities of Li are pegmatite deposits, volcanic clay deposits, and brine deposits (Bowell et al. 2020). Li bearing pegmatites occur globally and often contain other important rare metals (London 2008, Bradley et al. 2017). Li-bearing volcanic clay deposits are spatially related to rhyolitic volcanic rocks. Of the different type of volcanic clay deposits, Falchani is considered to a be hydrothermally altered ion-clay deposit hosted within lacustrine volcanoclastic and rhyolitic tuff rocks. The origin and formation of these deposits is heavily debated still. (Bowell et al. 2020). Lithium rich brines are formed through the chemical weathering of volcanic lithium bearing rocks by hydrothermal fluids usually restricted to basins in areas of high evaporation, forming lithium carbonate minerals such as zabuyelite. Prior technical reports have also proposed that the Li-bearing volcanic tuff is interpreted to have been deposited sub-aerially, and the transitional Li-bearing breccias are interpreted to have been deposited within a crater lake volcano-sedimentary environment (Nupen 2019, Riordan et al., 2020).
Close to 70% of the world's lithium resources are situated in the borders of Chile, Bolivia and Argentina (Lithium Triangle) area, but these deposits only account for 40% of global Li production (Bowell et al 2020). The Lithium Triangle contains the largest brine source lithium deposits such as Salar de Atacama, Sala de Uyuni and Salar de Hombre Muerto (Nupen 2019). While pegmatite deposits account for approximately 60% of global Li production, more focus is being directed to exploration and development of Li volcanic clay deposits (Bowell et al 2020).
9 EXPLORATION
The section summarizes exploration that has occurred since the previous Technical Report (Nupen, 2019, Riordan et al., 2020). Prior exploration is summarized in Section 6.
Exploration was initiated at the Falchani Project as a result of an observed radiometric anomaly. In 2018 Plateau Energy Metals undertook surface sampling and collected 181 field grab samples, which were analyzed for lithium. Between 2017 and 2018 Plateau Energy Metals conducted a drilling campaign of 51 diamond drill holes for a total drilling length of 14,816 m. Due to drill access limitations, the drilling was mainly undertaken from a series of platforms, with anything from two to nine drillholes being drilled radially from each platform, shown in Figure 9-1 Drilling Configuration. The platform spacing resulted in mineralized zone intersection separation distances ranging from 50 m to up to 200 m. Results from this exploration was incorporated into a MRE in 2019 (Nupen, 2019).
Recent exploration by American Lithium at Falchani include a LiDAR survey of the property, and additional drilling of 15 piezometer core holes in 2022-23. The core holes were analyzed for lithium and the potential of byproducts cesium, rubidium, and potassium. Details on the 2022-2023 drilling is found in Section 10.
A drone-based laser imaging detection and ranging (LiDAR) Survey was flown by Global Mapping S.A.C. during April 2023. The results of this survey were used in the building of the geologic resource model described in Section 14.
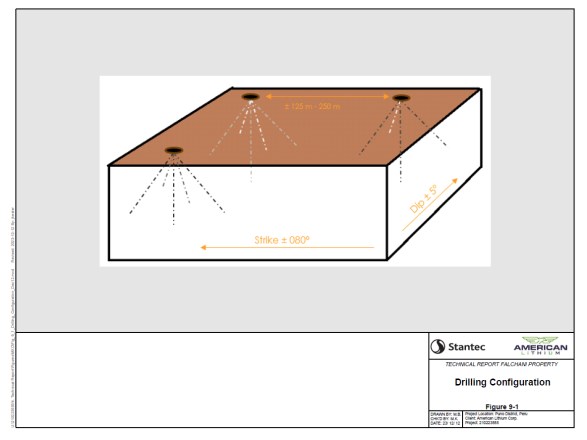
Figure 9-1 Drilling Configuration
10 DRILLING PROGRAM
10.1 Drilling methodology
A combination of diamond core holes and piezometer holes have been drilled on the Falchani Property. Drilling began in 2017 and is planned to continue in the next few years. The previous technical report's (Riordan et al., 2020; Nupen, 2019) drill hole database included holes from the 2017 and 2018 drilling campaigns and consisted of 52 diamond core holes totaling a length of 14,816 m. For this Technical Report update, an additional 15 piezometer drill holes were completed for a total of 67 drill holes used to define the mineral resource estimate as outlined in Section 14.
The additional 15 holes were completed by American Lithium owned drill rigs with local contract personnel. The 15 vertical piezometer holes were drilled from 10 platforms for a total length of 3,075 m.Table 10-1 shows the list of all drill hole locations used within the model with their details on year, depth, and type. Figure 10-1, Drill Hole Location Map, shows the locations of the holes listed in Table 10-1.
Table 10-1 Drill Hole Locations, Inclination and Depth
|
Hole Name
|
Drilling
Campaign
|
Easting
|
Northing
|
Elevation
(m)
|
Depth
(m)
|
Dip
|
Azimuth
|
|
PCHAC 01-TNE
|
2017-18
|
319,729
|
8,451,374
|
4,755
|
183
|
-55
|
55
|
|
PCHAC 01-TNW
|
2017-18
|
319,729
|
8,451,374
|
4,755
|
146
|
-55
|
355
|
|
PCHAC 01-TSE
|
2017-18
|
319,729
|
8,451,374
|
4,755
|
119
|
-60
|
130
|
|
PCHAC 01-TSW
|
2017-18
|
319,729
|
8,451,374
|
4,755
|
83
|
-55
|
265
|
|
PCHAC 01-TSW1
|
2017-18
|
319,732
|
8,451,372
|
4,754
|
261
|
-55
|
215
|
|
PCHAC 01-TV
|
2017-18
|
319,729
|
8,451,374
|
4,755
|
133
|
-90
|
180
|
|
PCHAC 01-TV1
|
2017-18
|
319,732
|
8,451,372
|
4,754
|
178
|
-90
|
0
|
|
PCHAC 02-TSE
|
2017-18
|
319,875
|
8,451,465
|
4,738
|
192
|
-60
|
135
|
|
PCHAC 02-TV
|
2017-18
|
319,875
|
8,451,465
|
4,738
|
202
|
-90
|
0
|
|
PCHAC 03-TE
|
2017-18
|
319,852
|
8,451,253
|
4,748
|
149
|
-60
|
90
|
|
PCHAC 03-TSW
|
2017-18
|
319,852
|
8,451,253
|
4,748
|
158
|
-55
|
230
|
|
PCHAC 03-TV
|
2017-18
|
319,852
|
8,451,253
|
4,748
|
159
|
-90
|
0
|
|
PCHAC 04-TV
|
2017-18
|
319,748
|
8,451,643
|
4,764
|
269
|
-90
|
90
|
|
PCHAC 05-TV
|
2017-18
|
320,134
|
8,451,868
|
4,718
|
239
|
-90
|
0
|
|
PCHAC 06-TE
|
2017-18
|
319,712
|
8,452,003
|
4,718
|
131
|
-60
|
90
|
|
Hole Name
|
Drilling
Campaign
|
Easting
|
Northing
|
Elevation
(m)
|
Depth
(m)
|
Dip
|
Azimuth
|
|
PCHAC 06-TN
|
2017-18
|
319,712
|
8,452,003
|
4,718
|
107
|
-60
|
0
|
|
PCHAC 06-TV
|
2017-18
|
319,712
|
8,452,003
|
4,718
|
104
|
-90
|
0
|
|
PCHAC 07-TNE
|
2017-18
|
319,789
|
8,452,212
|
4,727
|
246
|
-90
|
0
|
|
PCHAC 07-TV
|
2017-18
|
319,794
|
8,452,221
|
4,725
|
302
|
-90
|
0
|
|
PCHAC 08-TNE
|
2017-18
|
319,540
|
8,451,445
|
4,740
|
264
|
-70
|
55
|
|
PCHAC 08-TV
|
2017-18
|
319,540
|
8,451,445
|
4,740
|
88
|
-90
|
0
|
|
PCHAC 09-TNW
|
2017-18
|
319,641
|
8,451,679
|
4,755
|
309
|
-55
|
325
|
|
PCHAC 09-TV
|
2017-18
|
319,641
|
8,451,679
|
4,755
|
224
|
-90
|
0
|
|
PCHAC 10-TV
|
2017-18
|
319,504
|
8,452,028
|
4,718
|
143
|
-90
|
0
|
|
PCHAC 11-TSW
|
2017-18
|
320,167
|
8,452,361
|
4,688
|
244
|
-90
|
0
|
|
PCHAC 12-TV
|
2017-18
|
318,853
|
8,451,298
|
4,758
|
175
|
-90
|
0
|
|
PCHAC 12-TW
|
2017-18
|
318,853
|
8,451,298
|
4,758
|
148
|
-55
|
270
|
|
PCHAC 13-TV
|
2017-18
|
318,900
|
8,451,499
|
4,747
|
143
|
-90
|
0
|
|
PCHAC 13-TW
|
2017-18
|
318,900
|
8,451,499
|
4,747
|
174
|
-55
|
270
|
|
PCHAC 14-TV
|
2017-18
|
318,992
|
8,451,753
|
4,700
|
179
|
-90
|
0
|
|
PCHAC 14-TW
|
2017-18
|
318,992
|
8,451,753
|
4,700
|
401
|
-55
|
270
|
|
PCHAC 16-TNE
|
2017-18
|
319,932
|
8,451,674
|
4,754
|
213
|
-60
|
45
|
|
PCHAC 16-TV
|
2017-18
|
319,932
|
8,451,674
|
4,754
|
211
|
-90
|
90
|
|
PCHAC 17-TV
|
2017-18
|
320,012
|
8,451,552
|
4,729
|
187
|
-90
|
0
|
|
PCHAC 19A-TS
|
2017-18
|
319,810
|
8,451,060
|
4,738
|
59
|
-55
|
245
|
|
PCHAC 19A-TV
|
2017-18
|
319,810
|
8,451,060
|
4,738
|
42
|
-90
|
0
|
|
PCHAC 19-TV
|
2017-18
|
319,908
|
8,450,966
|
4,720
|
157
|
-90
|
0
|
|
PCHAC 23-TV
|
2017-18
|
319,946
|
8,451,065
|
4,698
|
210
|
-90
|
0
|
|
PCHAC 25-TV
|
2017-18
|
319,326
|
8,452,171
|
4,627
|
42
|
-90
|
0
|
|
PCHAC 29-TN
|
2017-18
|
319,552
|
8,452,104
|
4,696
|
224
|
-60
|
360
|
|
PCHAC 29-TV
|
2017-18
|
319,552
|
8,452,104
|
4,696
|
255
|
-90
|
0
|
|
PCHAC 30-TSW
|
2017-18
|
319,938
|
8,451,940
|
4,745
|
227
|
-55
|
250
|
|
PCHAC 30-TV
|
2017-18
|
319,938
|
8,451,940
|
4,745
|
222
|
-90
|
0
|
|
PCHAC 32-TNW
|
2017-18
|
318,562
|
8,451,416
|
4,802
|
122
|
-55
|
315
|
|
PCHAC 32-TV
|
2017-18
|
318,562
|
8,451,416
|
4,802
|
71
|
-90
|
0
|
|
PCHAC 32-TW
|
2017-18
|
318,562
|
8,451,416
|
4,802
|
114
|
-55
|
270
|
|
PCHAC 33-TV
|
2017-18
|
318,698
|
8,451,613
|
4,727
|
342
|
-90
|
0
|
|
PCHAC 33-TW
|
2017-18
|
318,698
|
8,451,613
|
4,727
|
246
|
-55
|
270
|
|
PCHAC 36-TV
|
2017-18
|
318,297
|
8,451,635
|
4,804
|
74
|
-90
|
270
|
|
PCHAC 36-TW
|
2017-18
|
318,297
|
8,451,635
|
4,804
|
174
|
-55
|
270
|
|
Hole Name
|
Drilling
Campaign
|
Easting
|
Northing
|
Elevation
(m)
|
Depth
(m)
|
Dip
|
Azimuth
|
|
PCHAC 41-TV
|
2017-18
|
319,648
|
8,451,444
|
4,762
|
79
|
-90
|
90
|
|
PCHAC 43-TV
|
2017-18
|
319,626
|
8,451,615
|
4,756
|
115
|
-90
|
0
|
|
PZ01-TV
|
2022-23
|
318,267
|
8,452,180
|
4,750
|
233
|
-90
|
0
|
|
PZ01-TV2
|
2022-23
|
318,278
|
8,452,180
|
4,750
|
226
|
-90
|
0
|
|
PZ01-TV3
|
2022-23
|
318,256
|
8,452,180
|
4,750
|
300
|
-90
|
0
|
|
PZ02-TV
|
2022-23
|
318,629
|
8,452,037
|
4,722
|
300
|
-90
|
0
|
|
PZ03-TV
|
2022-23
|
319,181
|
8,452,011
|
4,642
|
169
|
-90
|
0
|
|
PZ04-TV
|
2022-23
|
318,087
|
8,451,593
|
4,847
|
233
|
-90
|
0
|
|
PZ05-TV
|
2022-23
|
319,163
|
8,451,739
|
4,650
|
214
|
-90
|
0
|
|
PZ06-TV
|
2022-23
|
318,986
|
8,451,507
|
4,726
|
46
|
-90
|
0
|
|
PZ06-TV1
|
2022-23
|
318,996
|
8,451,507
|
4,722
|
100
|
-90
|
0
|
|
PZ06-TV2
|
2022-23
|
318,976
|
8,451,507
|
4,729
|
34
|
-90
|
0
|
|
PZ06-TV3
|
2022-23
|
318,987
|
8,451,497
|
4,726
|
256
|
-90
|
0
|
|
PZ07-TV
|
2022-23
|
317,889
|
8,451,584
|
4,879
|
234
|
-90
|
0
|
|
PZ08-TV
|
2022-23
|
318,231
|
8,451,188
|
4,883
|
209
|
-90
|
0
|
|
PZ09-TV
|
2022-23
|
318,500
|
8,451,257
|
4,882
|
165
|
-90
|
0
|
|
PZ10-TV
|
2022-23
|
318,266
|
8,451,615
|
4,811
|
251
|
-90
|
0
|
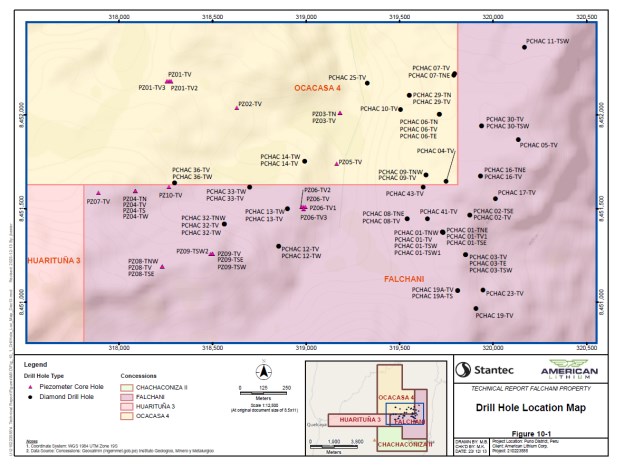
Figure 10-1 Drill Hole Location Map
Data for the added 67 drillholes were provided as individual files for both lithology and laboratory assays by American Lithium staff. Lithology was received by either Excel or assay data was provided by Excel spreadsheets accompanied by the original laboratory PDF certificates. Information on sample depths and QA/QC samples were acquired from a combination of the files mentioned above and follow up communications with American Lithium staff. Stantec compiled the individual data files into a MinePlan software Torque database for insertion into a MinePlan resource model. Downhole thicknesses for vertical drill holes are considered accurate true thickness intersections.
Drill core samples are cut longitudinally with a diamond saw, with one-half of the core placed in sealed bags and shipped to Certimin's sample analytical laboratory in Lima for sample preparation, processing, and ICP-MS/OES multi-element analysis, see Section 11. Certimin is an ISO 9000 certified assay laboratory.
10.2 Sample Recovery and Core
The core recovery over the length of the drillholes is approximately 95%, which is above industry standard deeming the overall core recovery as acceptable.
11 SAMPLE PREPARATION, ANALYSES AND SECURITY
11.1 Introduction
The data which informs these lithium Mineral Resource estimates are derived from the exploration efforts of American Lithium. Stantec reviewed all Quality Assurance and Quality Control (QAQC) data for the Project and the documented QAQC procedures described in Stantec's (TMC) 2019 NI43-101 technical report (TMC, 2019).
11.2 Sample Recovery
Core from these deposits was scrutinized by the TMC QP during the May 2018 site visit and again by the Stantec QP in May 2023, although the overall quality of the core recovered was good, there are zones, particularly within the Upper and Lower Breccia, where drilling conditions are difficult, and the core recovery was relatively poor but adequate for representative sampling. Observation of core available on site was that, although the core was in some cases blocky, the core recovery in the Lithium-rich Tuff was good, and the core pieces fit together well in the core boxes prior to sampling. In the Upper and Lower Breccias, the core recovered was often broken, and an assessment of core recovery was difficult. The overall core recovery was 95%.
Given the overall thickness of the mineralized zones, the consistent lithium grade within the zones and the relatively good core recovery, it is considered unlikely that any bias related to core recovery could be introduced.
11.3 Sample Quality
As the entire core was sampled, the sample taken from the core box is considered representative. Whole core was sampled in order to minimize the risk of sample loss. The method of sampling the whole core is sound, even though no intact library sample was retained. A comprehensive photo archive has been retained along with the sample reject material.
11.3.1 Sample Preparation
Sample preparation occurred on site at a mobile field station which was located close to the drill rigs and periodically re-located. Once logged and photographed, the entire core identified for sampling was placed into a sampling bag. The pre-marked aluminum tag was stapled to the sample bag. Sample depths were recorded together with a basic geological description on a sampling reconciliation log. This log was later captured into an Excel spreadsheet.
Quality control samples in the form of standards were inserted at the permanent field office located in the village of Isivilla. These standards were prepared by Macusani Yellowcake and certified by ALEPH Group & Asociados S.A.C. Metrologia de las Radiaciones (Radioactivity Measuring Techniques) by having check analyses of the standards completed at CERTIMIN SA (CERTIMIN), which was previously known as the Centro de Investigación Minera y Metalủrgica (CIMM), laboratory in Lima.
11.3.2 Sample Delivery Procedures
The complete sample batch, accompanied by a senior representative of the Macusani Yellowcake exploration team, was sent by road to the town of Juliaca. The samples entered the CERTIMIN LIMS system at this point. From the preparatory laboratory in Juliaca, the pulverized samples were transported by CERTIMIN, to the main CERTIMIN Laboratory in Miraflores, Lima, by either road or as air freight.
11.3.3 Sample Preparation and Analysis
Sample preparation and analysis was carried out through the CERTIMIN Laboratory.
Preparation Laboratory (CERTIMIN - Juliaca)
The samples were weighed on delivery and entered into the LIMS system. Drying was completed over a 12-hour period at 100˚ C. Crushing was done by two jaw crushers; the first to 6 mm and the second to 2.5 mm. Crushing was completed when the sample was 100% <2.5 mm. Laboratory standards were entered into the stream after the first jaw crusher. The jaw crushers were flushed with quartz, some of which were sent to the Lima offices for analysis on a regular basis.
One certified reference material, one blank sample and two duplicate samples were incorporated into each batch of 50 samples delivered to CERTIMIN for laboratory analytical quality assurance and control (QAQC). These results were given to Macusani Yellowcake on the analysis certificates.
After homogenization, the crushed sample was riffle split to an approximate 250 g sample that was pulverized by a ring mill. The ring mill was flushed with quartz after approximately every five samples or if there was a marked color change in the crushed material. The preparation facility strives to have the pulverized material at 85% <200 mesh grain size.
Acid Digestion and Final Analysis (CERTIMIN - Miraflores)
The pulverized material was manually homogenized. Wet samples were dried before an approximate 0.20g aliquot (±0.02g) sample was spooned out and digested with a mixture of HCl+HNO3+HF+HClO4 acid over a period of eight hours. The concentration of lithium was determined from the acid digested liquid by inductively coupled plasma - mass spectrometry (ICP-MS) for abundances of 0.05 ppm to 10,000 ppm (1%). Any results greater than 10,000 ppm were re-analyzed via inductively coupled plasma-optical emission spectrometry (ICP-OES). The latter instrument would require a new acid digest to be completed on an aliquot of 0.25 g. The ICP-MS and ICP-OES equipment is calibrated daily with three appropriate standards.
Analytical Quality Assurance and Control (QAQC) Procedures
The data which informs these lithium Mineral Resource estimates was generated by American Lithium, or its subsidiaries, since the initiation of exploration on the Falchani Project in 2017. American Lithium inserted standard, blank, and duplicate samples (Field) into the sampling streams, in addition to those inserted by the laboratory, in order to assess the accuracy and precision of the lithium analytical results.
A summary of the overall statistics for the QAQC samples is shown in Table 11-1.
Table 11-1 Summary of QAQC Samples for all Drillholes
No. of
Samples |
Duplicates |
Standards |
Blanks |
% QAQC |
| Field |
Laboratory |
Field |
Laboratory |
Field |
Laboratory |
|
| 12,738 |
264 |
389 |
106 |
580 |
110 |
342 |
14 |
QAQC data was reviewed for both PCHAC (2017-2018) and PZ Series (2023) drillholes. Stantec reviewed the documentation for PCHAC series QAQC data from TMC's 2019 report, and found the results to be accurate; therefore, only QAQC results for PZ Series drillholes are discussed below.
Duplicate Data
Laboratory duplicate Li values were paired with their respective parent sample and then plotted together. Duplicate analysis showed positive repeatability, with a R2 value of 0.9965 on 105 duplicate pairs as shown in Figure 11-1, PZ Series drill holes duplicate Li scatter plot. All duplicate Li values were within 20% of the original Li value and 104 out of 105 duplicate Li values were within 10% of the original Li value.
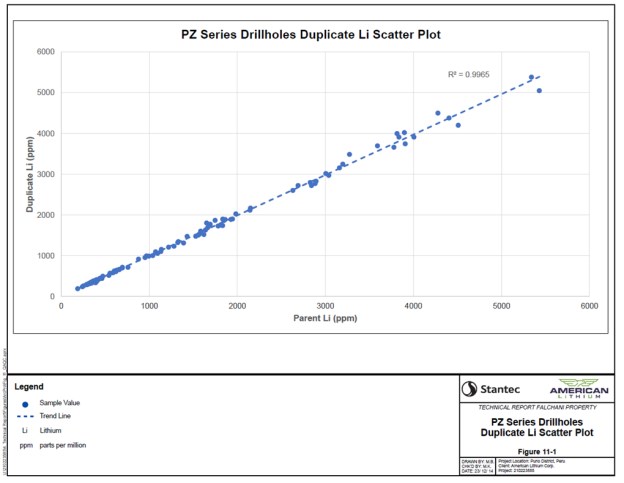
Figure 11-1 PZ Series Drillholes Duplicate Li Scatter Plot
Blank Data
Field and laboratory blank values were plotted in order of drillhole name. The analytical results for field and laboratory blanks are shown in Figure 11-2 , PZ Series Lithium Field Blanks (A) and Laboratory Blanks (B). The field blanks show low levels of lithium. Laboratory blanks return values below the detection limit of >0.1 Li ppm. The levels of lithium returned from the field blanks are not considered material, when compared with the anticipated lithium grades within the Project.
Sample Database
Stantec received the drillhole logging results as a series of Microsoft Excel files. The database was imported into Leapfrog Geo for further analysis. A check on the accuracy of the transposition of approximately 5% of the sample results from assay certificate to database was completed by Stantec, and no transcription errors were identified.
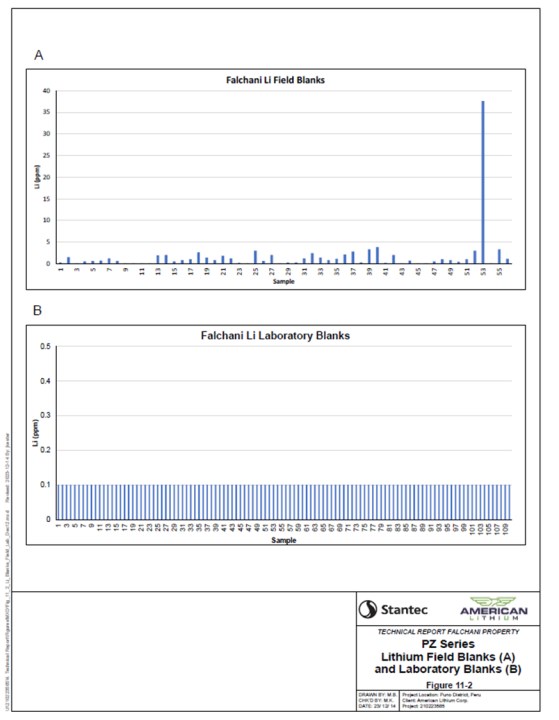
Figure 11-2 PZ Series Lithium Field Blanks (A) and Laboratory Blanks (B
Standard Data
Table 11-2 displays the standards used and their respective certified Li values and certified standard deviations (SD). Analysed Li standard values for the PZ series holes were plotted in order of drillhole name shown on Figure 11-3.
Table 11-2 Summary of QAQC Samples for all Drillholes
| Standard Name |
Reported
Element |
Certified
Element Value
(ppm) |
Certified
Low 2SD
(ppm) |
Certified
High 2SD
(ppm) |
| STD41R01-MA-ICPOESMS |
Li |
33 |
29 |
37 |
| OREAS 149 |
Li |
9 930 |
9 390 |
10 470 |
Standard OREAS149 was used intermittently and only three (3) Li values were reported. The three (3) values were within 1 SD. The QP believes three (3) samples is an inadequate sample population to generate a chart of standard performance. Standard values for by product elements on OREAS149 (Cs, and Rb) and NSC DC 86304 (Cs) were reviewed. By product values from both standards fell within two (2) SD.
The results for the standards inserted for lithium are considered acceptable.
Adequacy of Laboratory Procedures and Sample Security
It is the opinion of the Qualified Person, following an audit of QAQC assay data, that the exploration data is adequate for the basis for building a geologic model and estimation of lithium resources.
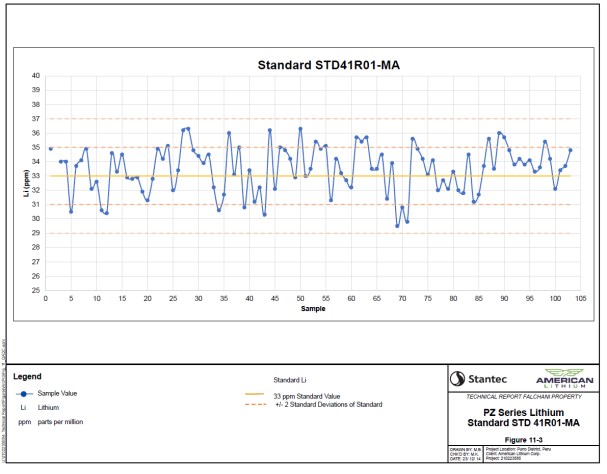
Figure 11-3 PZ Series Lithium Standard STD 41R01-MA
12 DATA VERIFICATION
12.1 Introduction
An audit of the 15 additional drill holes since the prior Technical Report (Riordan et al., 2020) has been completed by the Authors and Qualified Persons. Only lithium analyses were reviewed in detail during the QA/QC.
12.2 Property Investigation, Sample and Documentation Review
Stantec Geologists and Qualified Persons, Derek Loveday, P.Geo. and Mariea Kartick, P. Geo. completed site investigations of the Falchani Property from May 19 to 20, 2023. The site visit included inspection of core storage facility, drill hole collars, active drilling practices, core splitting equipment and core storage, sampling QAQC and the organization of lab samples. The Authors were accompanied by American Lithium representatives.
On May 17, 2023, the Authors met with the American Lithium team in Lima to review the Falchani exploration progress, examine maps and rock samples and met with the local Project Geologists. On May 18 to 19, 2023, the Authors travelled to Puno District and were transported by vehicle to the Falchani core storage facility, shown in Figure 12-1, Image A. The storage facilities were found to be well organized with core boxes properly labelled with footage, intervals and drillhole name. Stantec Geologists reviewed drill core and compared it to geologic logging of mineralogy, lithology and structural details observed in core, Figure 12-1, Image B. Exploration sampling equipment and documents for Falchani are also stored at an office within the community of Lake Isivilla. This includes core splitting equipment, maps and sampling items, which were viewed by QPs during the visit. QPs did not witness active core splitting or sampling while on site.
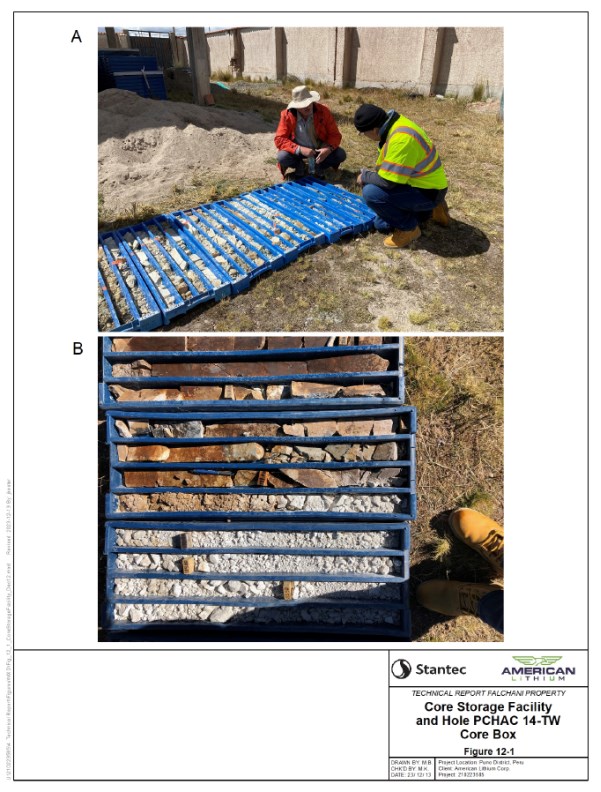
Figure 12-1 Core Storage Facility and Hole PCHAC 14 - TW Core Box
The Falchani Property was visited on May 20, 2023, by a well-maintained dirt road off the main highway, as shown in Figure 12-2, Image A, site visit photographs. Active drilling was observed at platforms PZ06 and PZ01, and two (2) drill hole collar locations were inspected and verified using a handheld GPS, PCHAC-13 and PCHAC-14, as shown in Figure 12-2, Image B and Figure 12-2, Image C. QPs were able to observe surface topography and the vast scale of the Falchani deposit and upper rhyolite outcrops, as shown in Figure 12-3.
12.2.1 Data Validation Limitation
The Qualified Persons did not complete the following:
- Laboratory inspections of Certimin labs were not completed by the Qualified Person.
- The Qualified Person did not independently witness sample collection and methodology at the drill pads.
- Review of the Falchani long term core storage facility was not inspected during the site visit.
12.3 Opinion of the Independent Qualified Person
Stantec Q.P. opines the field procedures, sample and log documentation, and security methods meet industry standards. The quality of the warehouse organization and core storage methods are adequate.
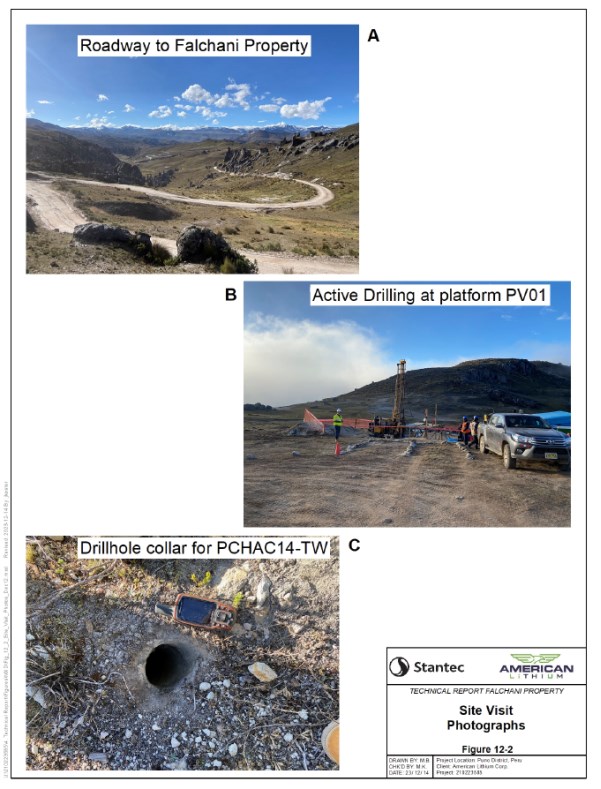
Figure 12-2 Site Visit Photographs
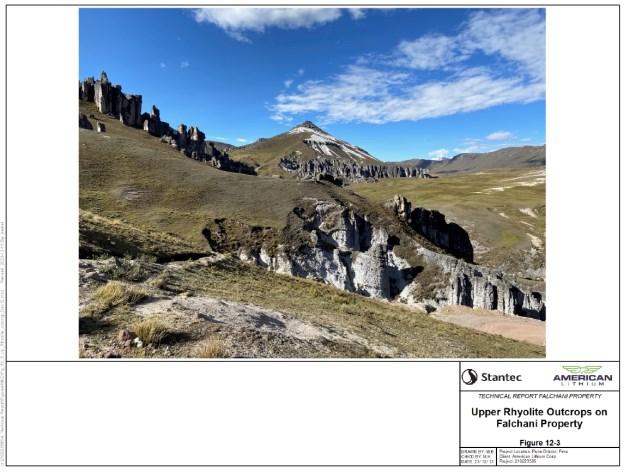
Figure 12-3 Upper Rhyolite Outcrop on Falchani Property
13 METALLURGY AND METALLURGICAL TESTING
13.1 Introduction
For the 2020 PEA study a substantial body of metallurgical testwork was carried out on the Falchani lithium-bearing tuff material. The testwork was focused on the recovery of lithium as lithium carbonate. The 2020 PEA included a process route trade-off study, and the conclusion was to pursue the sulfuric acid leach. The lithium recovery and conditions established in the 2020 PEA study are used for the lithium recovery in the 2024 PEA Update. The metallurgical testwork for the 2020 PEA is not repeated in this 2024 PEA Update but it can be reviewed in the published 2020 PEA document.
For this 2024 PEA Update the focus was on the recovery of acid leach by-products namely potassium as Sulfate of Potash (SOP) and cesium as cesium sulfate using historic test work and current testwork conducted by ANSTO.
13.2 Sampling background
The ANSTO testwork was carried out on the lithium rich tuff obtained from trenches on site. Table 13-1 shows the head analysis of the trench sample.
Table 13-1 Head Analysis of Lithium-rich Tuff Trench Sample
| Element |
Weight % |
| Al |
8.17 |
| As |
0.012 |
| B |
0.064 |
| Ca |
0.189 |
| Cr |
0.019 |
| Cs |
0.060 |
| Cu |
<0.001 |
| F |
1.99 |
| Fe |
0.515 |
| K |
2.95 |
| Li |
0.337 |
| Mg |
0.016 |
| Mn |
0.079 |
| Mo |
<0.001 |
| Element |
Weight % |
| Na |
2.39 |
| Ni |
0.024 |
| P |
0.370 |
| Pb |
0.002 |
| Rb |
0.146 |
| S |
<0.001 |
| Si |
33.3 |
| Sr |
0.002 |
| U |
0.002 |
| Zn |
0.009 |
13.3 PEA Update Testwork
13.3.1 Introduction
Throughout the various test work programs conducted to support the 2020 PEA, realizing the in-situ value of potassium and cesium as saleable by-products was under consideration as a secondary objective (after the primary objective of recovering lithium). The testwork conducted for the 2020 PEA had established the lithium dissolution and recovery and the intent of the PEA Update testwork was to establish dissolution and recovery figures for cesium, potassium, and rubidium. The samples used for this testwork were the same as those used for the 2020 testwork.
ANSTO's testwork included a Phase II and Phase III. For the Phase II testwork an acidity of >280g/l as H₂SO₄ was targeted. During Phase III a direct leach test was conducted at target acidity of 150 g/l as H₂SO₄ along with some leach tests conducted in a counter current fashion test at target acidity of 225 g/l as H₂SO₄.
These tests demonstrated that the lithium dissolution was not improved at the higher acid levels. The dissolution of cesium, potassium, and rubidium was improved at the higher acid levels, but the value of these by-products did not offset the cost of the additional acid. Based on this it was decided to utilize the results from the from Phase III direct Leach 1 testwork that provided the following dissolutions:
These dissolution results were used to calculate the by-product recoveries.
13.3.2 Phase II Testwork
Six (6) samples of tuff, each weighing 3.3 kg, were leached in baffled stainless-steel tanks for 24 hours under the same conditions. Mass balances were prepared for first three (3) individual leaches and a composite mass balance was prepared for all six (6) tests (Table 13-2).
Potassium, Rb and Cs extractions were each slightly lower in Test 3 than in Tests 1 and 2, in comparison to the average for all six (6) tests. The reason for this is not known. The average extractions across the six leaches were 80% for Li, 51% for K, 73% for Rb and 79% for Cs. The composite primary filtrate contained 3.3 g/L Li, 18 g/L K, 564 mg/L Rb and 238 mg/L Cs. All these tests were carried out at a target acidity of >280 g/l as H2SO4.
Table 13-2 Data from Phase II Leaching Test
| Conditions |
Leach 1 |
Leach 2 |
Leach 3 |
Composite |
| Temperature (oC) |
95 |
| Time (h) |
24 |
| Initial solids content (wt%) |
45 |
| Target acidity (g/L as H2SO4) |
> 280 |
| Final acidity (g/L as H2SO4) |
0.02 |
350 |
351 |
- |
| Feed sample mass (kg) |
3.3 |
3.3 |
3.3 |
19.8 |
| Mass loss (%) |
28 |
23 |
24 |
21 |
| Acid added at start (% of total) |
100 |
100 |
80 |
- |
| Acid addition (kg/t ore) |
517 |
517 |
513 |
- |
| Acid consumption (kg/t ore) |
196 |
144 |
173 |
- |
| Extractions (%) |
|
|
|
|
| Li |
- |
- |
- |
80 |
| K |
44 |
43 |
35 |
51 |
| Rb |
64 |
62 |
46 |
73 |
| Cs |
73 |
64 |
49 |
79 |
| |
|
|
|
|
13.3.3 Phase III Testwork
In brief, the first leach test was conducted at 150 g/L H2SO4 to compare with previous higher acidity test work and to assess the ability to significantly reduce acid addition / consumption. This was followed by five (5) tests at an intermediate acidity of 225 g/L H2SO4.
The tests at 225 g/L H2SO4 were performed in a counter-current fashion. The first test (CC1) used fresh acid and water, with the next three tests (CC2, CC3 and CC4) employing a 50:50 mixture of recycled alum precipitation barrens and fresh water + acid viz. 50% recycle. The last test (CC5) was performed without any addition of water at all, so the leachate was, except for fresh acid added to maintain acidity, 100% recycled alum precipitate barrens.
13.3.4 Effect of Varying Acidity
The extraction of lithium varied somewhat from test to test, but was ~75% in 100 g/L H₂SO₄, ~80% in 200 g/L H₂SO₄ and ~80% in 300 g/L H₂SO₄. One test CC3, produced an anomalously low Li extraction. The exact reason for this result remains unclear but given the heavy dependence of the extraction (calculated) on the lithium concentration in the leach residue, it is suggested that this result was probably due to analytical or experimental error.
Despite the scattered nature of the potassium extraction data, there was a general trend towards increased extraction at higher acidities. Potassium extractions were ~30% in 100 g/L H₂SO₄, ~35% in 200 g/L H₂SO₄and ~45% in 300 g/L H₂SO₄.
Cesium extraction was the most scattered dataset, but in general extractions were ~65% in 100 g/L H₂SO₄, ~85% in 200 g/L H₂SO₄ and between 50-75% in 300 g/L H₂SO₄.
Table 13-3 Data from Phase III Testwork
| Test ID |
Ph II
Leach
1 |
Ph III
Leach
1 |
Ph III
CC1 |
Ph III
CC2 |
Ph III
CC3 |
Ph III
CC4 |
Ph III
CC5 |
| Temperature (oC) |
95 |
95 |
| Time (h) |
24 |
24 |
| Initial solids content (wt%) |
45 |
45 |
| Proportion of initial lixiviant that is recycled (%) |
0 |
0 |
0 |
50 |
50 |
50 |
100 |
| Target acidity (g/L as H2SO4) |
300 |
150 |
225 |
225 |
225 |
225 |
225 |
| Final acidity (g/L as H2SO4) |
339 |
176 |
206 |
226 |
192 |
217 |
217 |
| Feed sample mass (kg) |
3.3 |
1.0 |
2.0 |
2.0 |
2.0 |
2.0 |
2.0 |
| Mass loss (%) |
28 |
18 |
7.0 |
9.4 |
9.8 |
12 |
8.0 |
| Acid added at start (% of total) |
100 |
75 |
56 |
54 |
50 |
48 |
29 |
| Test ID |
Ph II
Leach
1 |
Ph III
Leach
1 |
Ph III
CC1 |
Ph III
CC2 |
Ph III
CC3 |
Ph III
CC4 |
Ph III
CC5 |
| Acid addition (kg/t ore) |
517 |
321 |
433 |
262 |
275 |
315 |
234 |
| Acid consumption (kg/t ore) |
196 |
206 |
228 |
245 |
242 |
259 |
288 |
| Extractions (%) |
|
|
|
|
|
|
|
| Li |
80 |
83 |
88 |
87 |
72 |
84 |
77 |
| K |
44 |
29 |
37 |
38 |
35 |
36 |
35 |
| Rb |
64 |
58 |
66 |
67 |
65 |
64 |
62 |
| Cs |
73 |
78 |
87 |
85 |
88 |
85 |
87 |
13.3.5 By-product Recovery
Although the dissolution values have been determined from testwork the by-product recovery testwork is still being finalised so for the PEA Update MetSim modelling was used to determine the various stage recoveries of the by-products as shown in Table 13-4. These recoveries were used in the financial evaluation Alternate Case.
Table 13-4 By-Product Recovery
| Recovery |
Unit |
Potassium |
Cesium |
Rubidium |
| Overall |
% |
20.7 |
74.7 |
41.7 |
| SOP Plant |
% |
70.4 |
95.8 |
81.2 |
| Leach |
% |
29.0 |
78.0 |
58.0 |
| Leach dewatering |
% |
100 |
100 |
100 |
| Alum Crystallisation |
% |
91.2 |
99.8 |
99.9 |
| SOP Neutralisation |
% |
90.0 |
96.0 |
93.0 |
| Softening |
% |
100 |
100 |
100 |
| SOP Crystallisation |
% |
85.8 |
100 |
87.4 |
| Mixed Sulfate Crystallisation |
% |
- |
100 |
100 |
13.3.6 Other Testwork Data
Besides the leach recoveries the ANSTO testwork provided some useful information on the filterability and filtration rates of precipitates at various stages of the proposed flowsheet. This data was used to provide guidance for the sizing of liquid solid separation equipment.
14 MINERAL RESOURCE ESTIMATES
14.1 Approach
In accordance with the requirements of NI 43-101 and the Canadian Institute of Mining, Metallurgy and Petroleum Definition Standards, the Qualified Persons employed at Stantec validated the drill hole and sample data set and created a geologic model for the purposes of generating lithium resource estimates from the volcanic tuff, breccia and felsic intrusion hosted lithium deposit within the Falchani Property. The lithium resource estimate also includes average concentrations of cesium (Cs), potassium (K) and Rubidium (Rb) that have the potential to be produced as a biproduct from the processing of lithium. The geologic model described below was used as the basis for estimating mineral resources on the Falchani Property
14.2 Basis for Resource Estimation
NI 43-101 specifies that the definitions of the Canadian Institute of Mining, Metallurgy and Petroleum (CIM) Guidelines be used for the identification of resources. The CIM Resource and Reserve Definition Committee have produced the following statements which are restated here in the format originally provided in the CIM Reserve Resource Definition document: "Mineral Resources are sub-divided, in order of increasing geological confidence, into Inferred, Indicated, and Measured categories. An Inferred Mineral Resource has a lower level of confidence than that applied to an Indicated Mineral Resource. An Indicated Mineral Resource has a higher level of confidence than an Inferred Mineral Resource but has a lower level of confidence than a Measured Mineral Resource."
The Definition of Resources is as follows: "A Mineral Resource is a concentration or occurrence of material of economic interest in or on the Earth's crust in such form, quality and quantity that there are reasonable prospects for eventual economic extraction. The location, quantity, grade, continuity, and other geological characteristics of a Mineral Resource are known, estimated or interpreted from specific geological evidence and knowledge, including sampling." "Material of economic interest refers to diamonds, natural inorganic material, or natural fossilized organic material including base and precious metals, coal, and industrial minerals." Lithium falls under the industrial minerals' category. The committee went on to state that: "The term Mineral Resource covers mineralization and natural material of intrinsic economic interest which has been identified and estimated through exploration and sampling and within which Mineral Reserves may subsequently be defined by the consideration and application of technical, economic, legal, environmental, social, and governmental factors.
14.3 Socioeconomic and Government Factors
The phrase 'reasonable prospects for eventual economic extraction' implies a judgment by the Qualified Person in respect of the technical and economic factors likely to influence the prospect of economic extraction.
Interpretation of the word 'eventual' in this context may vary depending on the commodity or mineral involved. For example, for some coal, iron, potash deposits and other bulk minerals or commodities, it may be reasonable to envisage 'eventual economic extraction' as covering time periods exceeding 50 years. However, for many gold deposits, application of the concept would normally be restricted to perhaps 10 to 15 years, and frequently to much shorter periods of time."
Extraction of lithium from volcanic hosted lithium deposits is most similar to bulk mineral commodities such as coal and potash and as such eventual economic extraction can cover time periods in excess of 50 years depending on the size and concentration of lithium in the volcanic tuff, breccia and coarse felsic intrusion.
14.4 Data Sources
The geologic models and resulting resource estimation described within this report utilized the following data and information provided by American Lithium:
- exploration drill hole logs;
- drill hole sample data;
- surface grab samples;
- surface geologic maps;
- geologic cross sections;
- LiDAR survey;
- 2019 TMC NI43-101 (Nupen, 2019)
- 2020 Falchani PEA (Riordan, et al., 2020)
Drill holes used for geologic resource model generation were completed during two drilling campaigns occurring in the 2017 - 2018 and 2022 - 2023 exploration seasons with all meterage consisting of diamond HQ core drilling. The author would like to note that drilling during the 2017 - 2018 program; 23 drill holes were directionally drilled with inclined drilling and the remaining 28 were vertically drilled. For the 2022 - 2023 program all exploration holes were drilled vertically.
Details of applied drilling and sampling methods are explained in Sections 10 and 11 of this report. Drill hole sampling data is detailed in Section 11. Surface grab samples were used for guidance of lithologic feature interpolation for the geologic model framework only, these samples were not used for resource estimation and had no influence on grade calculations. The geologic cross sections provided by American Lithium were drawn at various orientations and displayed lithologic and structural interpretations along drilling intercepts across the property.
Stantec acquired raw LiDAR data from American Lithium. The surface topology was derived from densified LiDAR point clouds captured by drone survey with a range of 12-20 PPSM (Pulse Per Square Meter). Stantec processed this data using ESRI ArcPro version 11 software into a Digital Terrain Model (DTM).
The provided data was deemed accurate for the purposes of estimating resources on the Property.
14.5 Model
The geologic model used for reporting of lithium resources was developed using Seequent's Leapfrog geological modelling software, Leapfrog Geo version 2023.1. and Hexagon Mining's resource modelling and mine planning software, MinePlan version 16.1.1. Leapfrog Geo and MinePlan are widely accepted throughout the mining industry for digital resource model development. Seequent's Leapfrog Geo and Hexagon Mining's suite of interpretive and modelling tools is well-suited to meet the resource estimation requirements for the Falchani Property. The geologic model from which lithium resources are reported is a 3D block model developed using the World Geodetic System (WGS) 1984 UTM Zone 19S and is in metric units. The model limits and block size are outlined in Table 14-1 Block Model Parameters, and the plan view extent of the geologic model is shown on Figure 14-1, Surface Topography and Model Limits Map.
Table 14-1 Block Model Parameters
|
Coordinate
|
Minimum
|
Maximum
|
Range (m)
|
Block (m)
|
|
Easting
|
317,300
|
320,600
|
3,300
|
20
|
|
Northing
|
8,450,410
|
8,452,850
|
2,440
|
20
|
|
Elevation
|
4,000
|
5,200
|
1,200
|
5
|
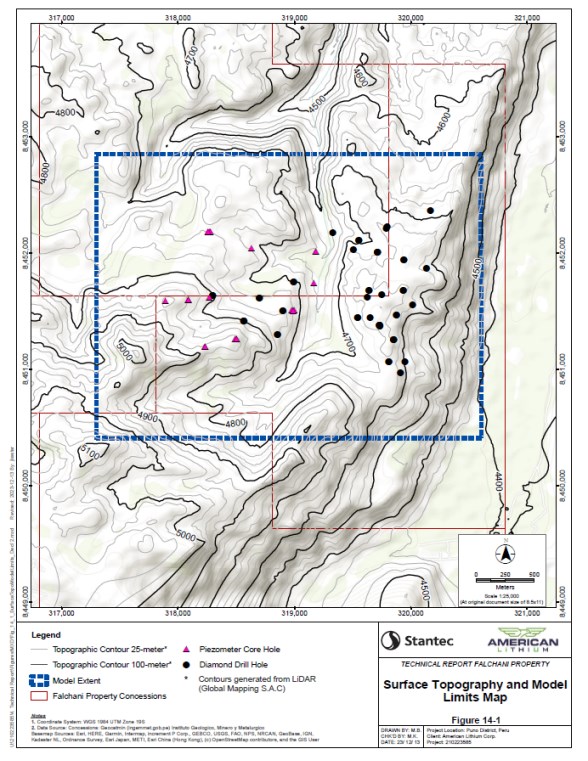
Figure 14-1 Surface Topography and Model Limit Map
The database was verified and QAQC checks were performed prior to developing the geological model, details are documented in Section 11. A topography wireframe was created using the processed DTM data. High resolution imagery sourced from American Lithium LiDAR drone flights was draped onto the topography to identify potential structural trends from geomorphological features. Trends from surface fault mapping provided by American Lithium were also used to guide the structural interpretation. North-South (N-S) and northwest (NW) to southwest (SW) fault trends were mapped, and generally matched observed fault zone geomorphic features and drill hole logging offsets described in Section 7 and shown in Figure 7-4. In addition to imagery, previous fault trace interpretations (Nupen, 2019, Riordan et al.,2020) and observed drill hole logging offsets were used to interpolate eight (8) faults which resulted in nine (9) fault blocks within the Falchani geologic model, Figure 14-2, Model Fault Blocks.
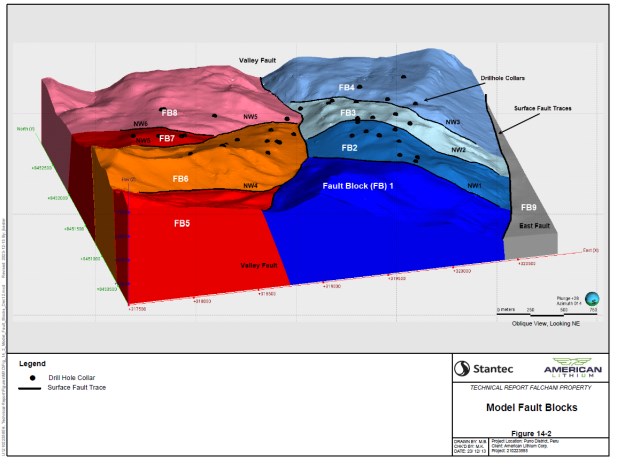
Figure 14-2 Model Fault Blocks
Logged drill core was utilized in determining geological contacts and lithological units. Observation of drill core log photos and drill hole database was carried out to inform lithological grouping for implicit modelling and associated contact surfaces. Figure 14-3, Model Stratigraphy and Lithium Grade from Representative Drilling, displays the stratigraphic order of typical lithologies encountered in two (2) drill holes together with lithium concentration.
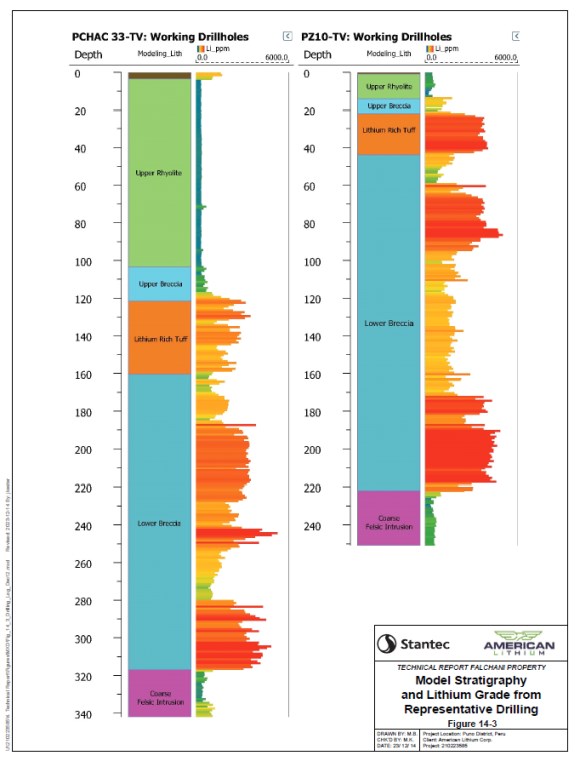
Figure 14-3 Model Stratigraphy and Lithium Grade from Representative Drilling
The logged lithologies were coded and used to implicitly model contact surfaces between each lithologic unit within each fault block. Leapfrog geo control disks were used to guide the implicit algorithm to generate more realistic surfaces. Control disks are drawn in as interpretations based on surrounding data and fault interactions. The geological model interpolations were peer reviewed and exported to MinePlan software.
Resource modeling method and approach is the development of a multiple ore percent standard block model with interpretation of geologic controls on mineralization based on exploration data. A significant new addition to the resource from prior estimates (Riordan, et al., 2020) is the recognition of an additional mineralized basement lithological unit, Coarse Felsic Intrusion (CFI), below the lower mineralized volcanic breccia horizon.
14.5.1 Model Inputs
Inputs used in the construction of the geologic model and resource estimation include the following:
- Surface topography;
- Surface geologic maps and cross sections;
- 15 vertical piezometer core holes from 10 platforms (2022 to 2023);
- 52 drill core holes (vertical and inclined) from 25 platforms (2017 to 2019);
- Drill hole and piezometer core log descriptions;
- 8,297 core samples from 52 core holes;
- 3,009 core samples from 15 piezometer holes; and
- Average specific gravity of 2.4 g/cm3 and 2.7 g/cm3 (CFI only)
14.5.2 Surface Topography
LiDAR drone surveys were provided by American Lithium and processed into a 2 m DTM format by Stantec. The topography was generated in the 3D block model shown in Table 14.1.
14.5.3 Structural features
The Property is separated into nine (9) fault blocks that are split by two (2) north-south trending high angle normal faults (Valley Fault and East Fault) and six (6) northwest and southwest trending normal faults (NW1 through NW6). The location of the faults and fault blocks are illustrated in Figure 14-2 and shown in the geologic cross sections A-A' and B-B' which are detailed in Section 7, Figures 7-6 and 7-7. Modeled faults align with prominent topographic lows and areas where offset outcrop patterns are observed. The basis for the modeling of the eight (8) faults is discussed in Section 7.5 and shown in Figure 7-4. The N-S trending Valley Fault separates the model into east and west sides. The N-S trending East Fault defines an approximately 400 m difference in elevation from the highlands of the main Falchani area to a drop-down basin towards the east. The East Fault also defines the extent of modeled lithologies due to distance from drill hole data whereas the hanging wall has no modeled lithologies. The east and west sides of the model are further divided by NW-SW trending high angle faults. The east side contains faults: NW1, NW2, and NW3 and on the west, faults: NW4, NW5, and NW6. Interpolated fault placements are based on satellite imagery geomorphic features and drill hole logs. NW1 and NW3 are resource limiting faults due to distance from drilling data and observed offset, respectively.
Description of the local and structural geology are detailed in Section 7.
14.5.4 Model Zones
The geologic model is separated into seven lithological zones of which four mineralized zones exist, as indicated below, from top to bottom:
1. Overburden
2. Upper Rhyolite
3. Mineralized Upper Breccia (UBX);
4. Mineralized Lithium Rich Tuff (LRT);
5. Mineralized Lower Breccia (LBX) and;
6. Mineralized Coarse Felsic Intrusion (CFI) basement unit.
7. Rhyolite Subvolcanic Intrusion
Wireframe solids generated from these seven zones are presented on Figure 14-4, 3D Geologic Model, showing an oblique view of the geologic model looking towards the northeast. Table 14-2 provides composite vertical thickness statistics of the seven lithological units as penetrated from the drill hole records. Only the upper breccia, lithium rich tuff, lower breccia and coarse felsic intrusion are considered resource. The mineralized horizons are offset by normal fault offsets that truncate the N-S trending Valley fault, shown in Figure 14-4. The CFI basement zone is intersected by 28 drillholes with the max depth of 407 m in drillhole PZ01-TV3, however the true thickness is not well defined. The CFI zone mineral resources have been limited by the generated pit depth of 300 m below surface.
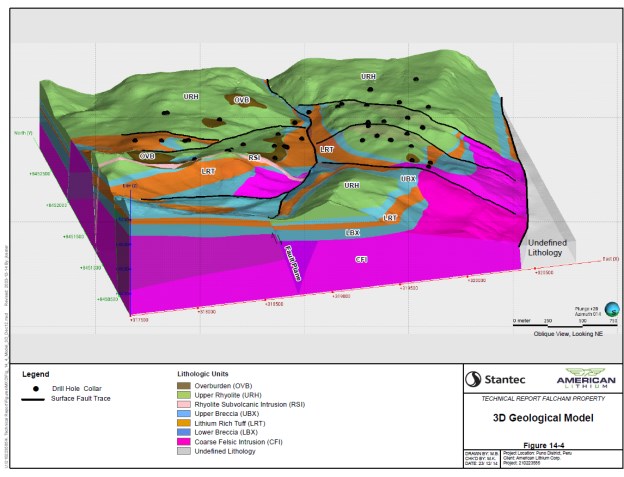
Figure 14-4 3D Geological Model
Table 14-2 Vertical Zone Thickness (m) from Geological Implicit Model
Mineralized
Zone |
Average Thickness (m) |
| East of Valley Fault |
West of Valley Fault |
| UBX |
30 |
20 |
| LRT |
60 |
50 |
| LBX |
50 |
90 |
| CFI |
- |
- |
14.5.5 Metal Grade Statistics within the Mineralized Zone
Prior to estimation, drill hole samples were composited at regular 1-meter intervals given that the majority (95%) of the drill hole samples assessed for lithium resource were derived from 1 m interval drill core samples. Statistics on the number of 1 m composites for Li, Cs, K and Rb concentrations from drill hole records for each mineralized zone, are shown in Table 14.3, Composite and Capping Li, Cs, K, and Rb Grades from Drill Holes. Frequency distribution chart (histogram) generated from the regular 1 m composites for lithium are shown in Figure 14-5 for the four mineralized zones. Metal grade outliers were capped as shown in Table 14-3 following observation of grade frequency distribution shown in Figure 14-5. For other by-product metals (Cs, K and Rb) select capping was applied using the same approach as that applied to lithium grades.
Table 14-3 Composite and Capping Li, Cs, K and Rb Grades from Drill Holes
|
Zone
|
Composite
|
Count
|
Min
|
Max
|
Capping
|
Average
|
|
UBX
|
Lithium (ppm)
|
749
|
150
|
4,334
|
-
|
1,672
|
|
Cesium (ppm)
|
749
|
22
|
6,820
|
5,000
|
684
|
|
Rubidium (ppm)
|
749
|
18
|
1,878
|
-
|
845
|
|
Potassium (%)
|
749
|
0.1
|
4
|
-
|
749
|
|
LRT
|
Lithium (ppm)
|
2,522
|
310
|
4,551
|
-
|
3,093
|
|
Cesium (ppm)
|
2,522
|
3
|
11,390
|
2,000
|
517
|
|
Rubidium (ppm)
|
2,522
|
322
|
2,288
|
1,800
|
1,281
|
|
Potassium (%)
|
2,522
|
1
|
5
|
-
|
3
|
|
LBX
|
Lithium (ppm)
|
2,079
|
155
|
5,739
|
-
|
2,134
|
|
Cesium (ppm)
|
2,079
|
2
|
12,160
|
6,000
|
1,457
|
|
Rubidium (ppm)
|
2,079
|
83
|
2,071
|
-
|
1,059
|
|
Potassium (%)
|
2,079
|
0.01
|
7
|
6
|
3
|
|
CFI
|
Lithium (ppm)
|
1,544
|
94
|
3,601
|
2,000
|
795
|
|
Cesium (ppm)
|
1,544
|
35
|
5,070
|
1,800
|
414
|
|
Rubidium (ppm)
|
1,544
|
127
|
1,141
|
1,000
|
518
|
|
Potassium (%)
|
1,544
|
1
|
5
|
-
|
4
|
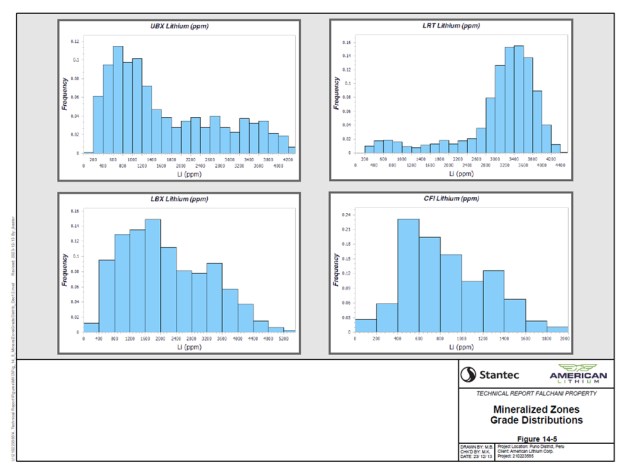
Figure 14-5 Mineralized Zones Grade Distributions
Global multi-directional (30º increment) semi-variograms were generated from the 1m composite samples within the four (4) separate lithium mineralized zones as shown on Figure 14-6, mineralized zones semi-variograms. The semi-variogram shown in Figure 14-7, Global Lithium Semi-variogram, represents the combined variances at 30° increments for all lithium mineralized zones. The maximum global range to sill distance is approximately 250 m. The semi-variograms shown in Figures 14-6 and 14-7 were used to guide the grade estimation approach and resource classification.
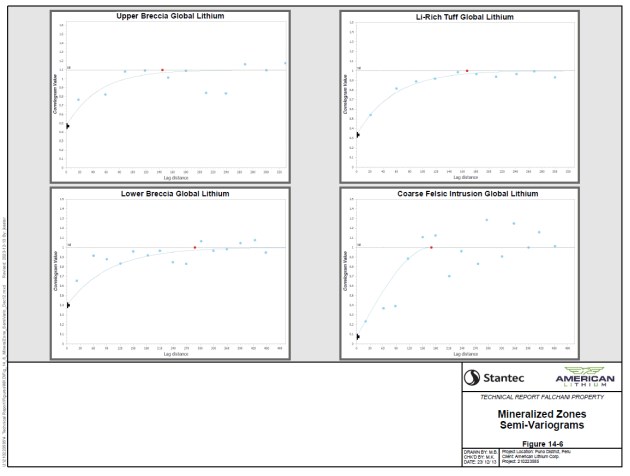
Figure 14-6 Global Lithium Semi-Variograms
Observation of the lithium grade profiles from samples taken within the mineralized zones show separate concentrations of dissipated lithium ranging from around 400 ppm to more than 5,000 ppm. Correlation of lithium grade intervals to individual lithological units was not possible within the mineralized zones, as these grade intervals were observed to be more lens-like as opposed to continuous beds. However, grades within the LRT zone were observed to be more continuous as compares to the other mineralized zones, and having the consistent highest grades, > 4,000 ppm Li.
Broad intervals of high and low grade were modelled by limiting the number of composites per block estimate and using the UBX-LRT Li volcanic contact as a relative elevation surface to account for fault offsets.
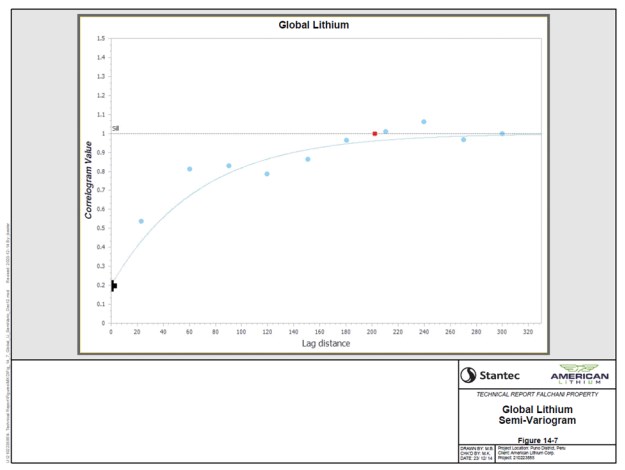
Figure 14-7 Global Lithium Semi- Variogram
14.5.6 Density
In situ densities were determined based on the mineralogical composition of the lithologies on the Property. Earlier exploration by Plateau Energy analyzed eight field samples using a pycnometer, resulting in an average density of 2.4 t/m3 (Riordan et al., 2020). The dominant lithology on the Property, volcanic breccia, and tuff, were assigned a fixed density of 2.4 g/cm3. The basement lithology, CFI, was assigned a fixed specific gravity of 2.7 g/ cm3 for resource calculations based on documented densities for analogous rock types, notably andesite at 2.8 g/cm3 and granite between 2.65 g/cm3 and 2.75 g/cm3 (www.geologyscience.com).
14.5.7 Model Build
The procedures followed in building the resource model are outlined below:
- Topography was coded as a block percent using a wireframe generated from LiDAR data.
- The four mineralized zone solids (UB, LRT, LB, and CFI) were coded into blocks as a percentage item and zone item.
- Regular 1 m composites from within the mineralized zone were estimated into mineralized zone blocks using an inverse distance squared (IDW2) algorithm and isotropic search.
- The maximum range for metal grade (Li, Cs, K and Rb) estimates for resource determination was set at 600 m using observation of semi-variogram analyses of the lithium grade data as a guide.
- Prior to estimation select metal grade outliers were capped as shown in Table 14.3.
- The UBX-LRT contact was used as a relative elevation surface to trend grade estimates across fault offsets.
- Maximum number of samples for block estimates was set to the nearest twenty (20) samples with a maximum of fifteen (15) samples per hole to simulate the grade trends as observed from drill hole records.
- Mineralized zone blocks UBX, LRT and LBX that are within 250 m of nearest valid samples were tagged as inferred, 160 m indicated, and 80 m measured. The mineralized CFI blocks that are within 160 m of nearest valid samples were tagged as inferred, 80 m indicated, and 40 m measured. These resource classification zones were further modified to account for local geologic complexity.
- Model grade estimates were validated against input drill hole grades using cross-sections and swath plots through the block model.
Model estimation parameters are summarized in Table 14-4.
Table 14-4 Model Grade Estimation Parameters
| Maximum Search |
No. Composites |
| Direction |
Range (m) |
Minimum |
Maximum |
Maximum per hole |
| East |
600 |
3 |
20 |
15 |
| North |
600 |
3 |
20 |
15 |
| Vertical |
600 |
3 |
20 |
15 |
Figures 14-8 and 14-9 illustrate the lithium grade distribution along the same cross-section lines as shown above in Section 7 (A-A' and B-B') through the mineralized zone in the resource block model.
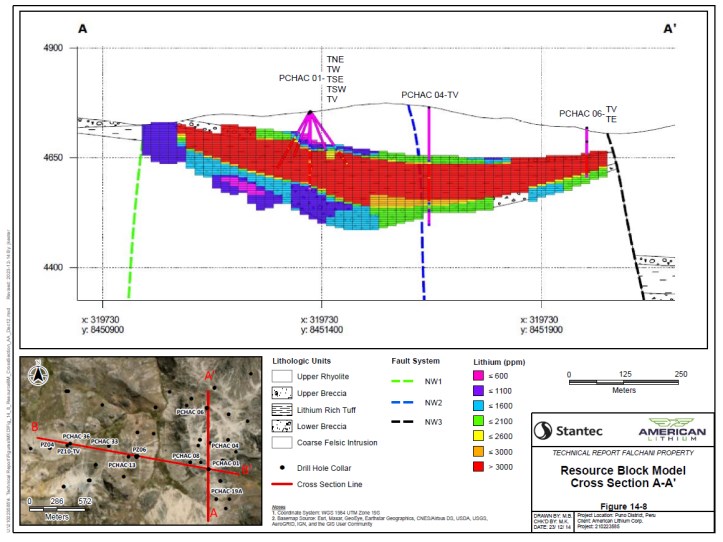
Figure 14-8 Resource Block Model Cross Section A-A'
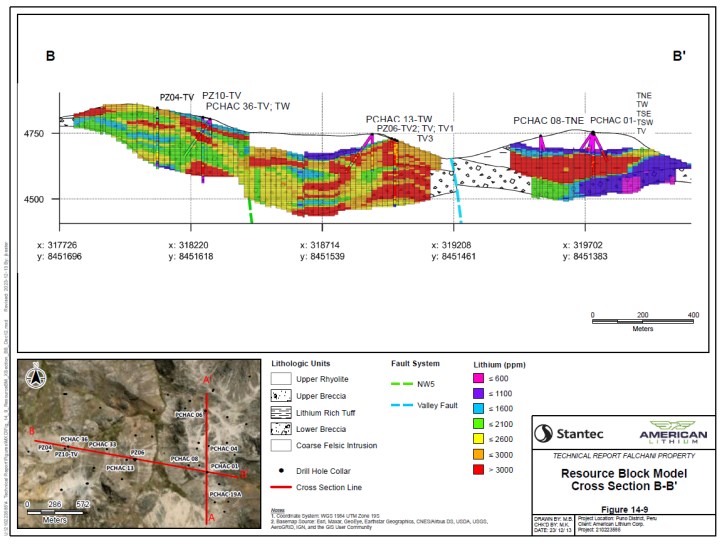
Figure 14-9 Resource Block Model Cross Section B-B'
14.6 Assessment of Reasonable Prospects for Economic Extraction
A base case lithium resource cut-off grade has been calculated based on the economics of a medium size (100 Mt/y) run-of-mine (ROM) surface mining operation. Processing of the mineralized material would be onsite extracting lithium from volcanic tuffs, volcanic breccias and a coarse felsic intrusion using an acid digestion method. Resources are reported from within an economic pit shell at 45° constant slope using Hexagon Mining's Pseudoflow algorithm. Maximum pit depth is limited to 300 m below surface. No underground mining is considered.
The following mining, processing, royalty, and recovery costs, in $, were used to derive a base case cut-off grade to produce a lithium carbonate (Li2CO3) equivalent product:
- Mining costs $2.5/tonne;
- Processing costs $50/tonne;
- General and administration $1/tonne; and
- Processing recovery of 80%.
Revenue from a lithium carbonate product is estimated to be $20,000/tonne for the cutoff grade calculation. Using the above inputs and Li2CO3:Li ratio of 5.32, a base case cut-off grade for lithium is estimated to be 600 ppm,. The base case cut-off grade of 600 ppm lithium is lower than the previous (Riordan et al., 2020) Mineral Resource Estimate cut-off grade of 1000 ppm lithium, mostly due to an increase in the assumed lithium carbonate price compared to the prior MRE.
14.7 Lithium Resource Estimates
Lithium resources are contained within the UBX, LRT, LBX and CFI basement. The mineralized zones are further constrained within nine (9) fault blocks that truncate at two (2) north-south trending high angle normal faults (Valley Fault and East Fault) and the resource is limited to the east by faults NW1 and NW3, shown on Figure 14-2. The CFI zone true depth has not been well defined by drilling and is limited by the generated pit depth of 300 m below surface. Mineral resources for the upper three zones (UBX, LRT and LBX) are classified by distance from nearest valid drill hole sample up to a maximum distance of 250 m for inferred, 160 m indicated, and 80 m measured. Mineral resources for the CFI are within 160 m for inferred, 80 m indicated, and 40 m measured.
The lithium mineral resource estimates are presented in Table 14-5 in metric units. The resource estimates are contained within an economic pit shell at constant 45° pit slope to a maximum vertical depth of 300 m below surface. The crest of the pit shell and pit shell depth is shown on Figure 14-10, Economic Pit Shell. The generalized mineral resource classification map is shown in Figure 14-11. Lithium resources are presented for a range of cutoff grades to a maximum of 5,000 ppm lithium. The base case lithium resource estimates are highlighted in bold type in Table 14-5. All lithium resources on the Falchani Property are surface mineable at a stripping ratio of 0.4 BCM/metric tonne at the base case cutoff grade of 600 ppm lithium. The effective date of the lithium resource estimate is October 31, 2023.
Table 14-5 Mineral Resource Estimate effective October 31 2023
|
Cutoff
|
Volume
|
Tonnes
|
Li
|
Metric Tonnes (Mt)
|
Cs
|
K
|
Rb
|
|
Li
(ppm)
|
(Mm3)
|
(Mt)
|
(ppm)
|
Li
|
Li2CO3
|
LiOH.H20
|
(ppm)
|
(%)
|
(ppm)
|
|
Measured
|
|
600
|
29
|
69
|
2,792
|
0.19
|
1.01
|
1.15
|
631
|
2.74
|
1,171
|
|
800
|
28
|
68
|
2,832
|
0.19
|
1.01
|
1.15
|
641
|
2.72
|
1,194
|
|
1,000
|
27
|
65
|
2,915
|
0.19
|
1.01
|
1.15
|
647
|
2.71
|
1,208
|
|
1,200
|
25
|
61
|
3,024
|
0.18
|
0.96
|
1.09
|
616
|
2.74
|
1,228
|
|
1,400
|
24
|
57
|
3,142
|
0.18
|
0.96
|
1.09
|
547
|
2.78
|
1,250
|
|
Indicated
|
|
600
|
156
|
378
|
2,251
|
0.85
|
4.52
|
5.14
|
1,039
|
2.92
|
1,055
|
|
800
|
148
|
357
|
2,342
|
0.84
|
4.47
|
5.08
|
1,058
|
2.90
|
1,070
|
|
1,000
|
136
|
327
|
2,472
|
0.81
|
4.31
|
4.90
|
1,095
|
2.87
|
1,104
|
|
1,200
|
129
|
310
|
2,549
|
0.79
|
4.20
|
4.78
|
1,086
|
2.86
|
1,146
|
|
1,400
|
120
|
288
|
2,646
|
0.76
|
4.04
|
4.60
|
1,041
|
2.88
|
1,166
|
|
Measured plus Indicated
|
|
600
|
185
|
447
|
2,327
|
1.04
|
5.53
|
6.29
|
976
|
2.90
|
1,072
|
|
800
|
176
|
425
|
2,424
|
1.03
|
5.48
|
6.23
|
991
|
2.87
|
1,090
|
|
1,000
|
163
|
392
|
2,551
|
1.00
|
5.32
|
6.05
|
1,021
|
2.84
|
1,121
|
|
1,200
|
154
|
371
|
2,615
|
0.97
|
5.16
|
5.87
|
1,009
|
2.84
|
1,160
|
|
1,400
|
144
|
345
|
2,725
|
0.94
|
5.00
|
5.69
|
960
|
2.86
|
1,180
|
|
Inferred
|
|
600
|
198
|
506
|
1,481
|
0.75
|
3.99
|
4.54
|
778
|
3.31
|
736
|
|
800
|
174
|
443
|
1,597
|
0.71
|
3.78
|
4.30
|
837
|
3.24
|
762
|
|
1,000
|
138
|
348
|
1,785
|
0.62
|
3.30
|
3.75
|
886
|
3.18
|
796
|
|
1,200
|
110
|
276
|
1,961
|
0.54
|
2.87
|
3.27
|
942
|
3.10
|
850
|
|
1,400
|
82
|
201
|
2,211
|
0.44
|
2.34
|
2.66
|
1,022
|
3.01
|
926
|
- CIM definitions are followed for classification of Mineral Resource.
- Mineral Resource surface pit extent has been estimated using a lithium carbonate price of US20,000 US$/tonne and mining cost of US$3.00/t, a lithium recovery of 90%, fixed density of 2.40 g/cm3
- Conversions: 1 metric tonne = 1.102 short tons, metric m3 = 1.308 yd3, Li2CO3:Li ratio = 5.32, LiOH.H2O:Li ratio =6.05
- Totals may not represent the sum of the parts due to rounding.
- The Mineral Resource estimate has been prepared by Mariea Kartick, P. Geo., and Derek Loveday, P. Geo. Of Stantec Consulting Services Inc. in conformity with CIM "Estimation of Mineral Resource and Mineral Reserves Best Practices" guidelines and are reported in accordance with the Canadian Securities Administrators NI 43-101. Mineral resources are not mineral reserves and do not have demonstrated economic viability. There is no certainty that any mineral resource will be converted into mineral reserve.
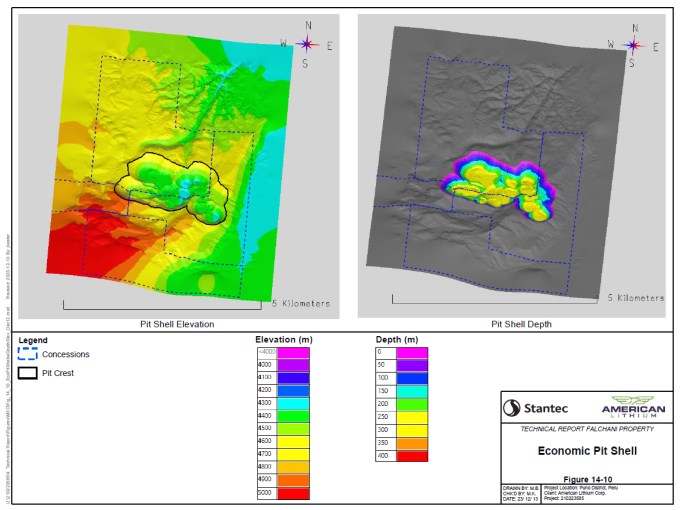
Figure 14-10 Economic Pit Shell
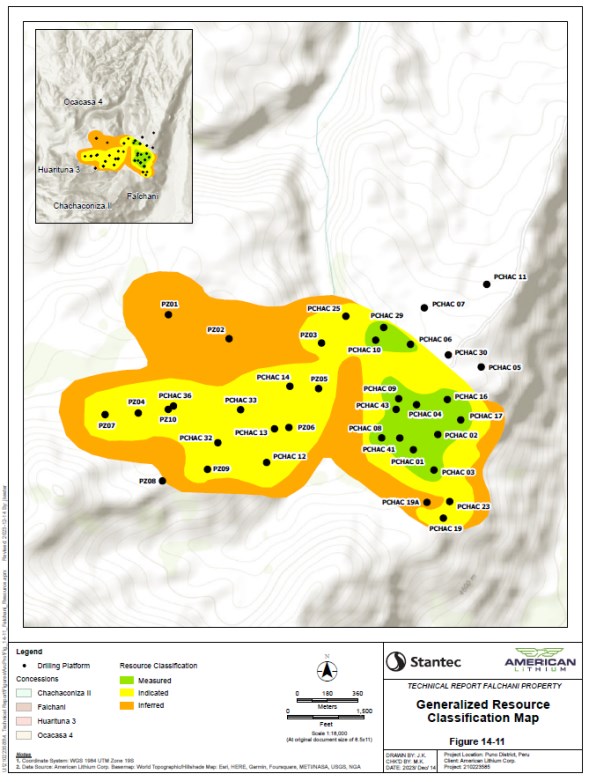
Figure 14-11 Generalized Resource Classification Map
14.8 Potential Risks
The accuracy of resource estimates is, in part, a function of the quality and quantity of available data and of engineering and geological interpretation and judgment. Given the data available at the time; the estimates presented herein are considered reasonable. However, they should be accepted with the understanding that additional data and analysis available after the date of the estimates may necessitate revision. These revisions may be material.
Mineral resources are not mineral reserves and there is no assurance that any mineral resources will ultimately be reclassified as Proven or Probable reserves. Mineral resources which are not mineral reserves do not have demonstrated economic viability.
Potential risks that may impact accuracy of the mineral resource estimates are:
- The resource is limited to within two E-W fault blocks east of the Valley Fault as described in Section 14.4.3 that may shift location given further exploration. Should new supporting data support a significant shift in the fault locations this may have a material impact on the resource estimates.
- The CFI basement and the other volcanics around the extremities of the Property are only recognized from 28 drillholes. Future exploration drilling in these areas of the Property may show these intrusions and other volcanics extending into the Property below surface. This may have a material impact on the resource estimates in these regions of the deposit.
- Metallurgical test work currently under the coordination of DRA may indicate that the input costs for the practical extraction of lithium to be higher than anticipated. Since processing costs are a significant component of lithium carbonate (or lithium hydroxide monohydrate) production, the lithium cutoff grade may be higher than the base case cutoff grade of 600 ppm used for the lithium resource estimates.
- Given the uniform densities applied to the mineralized zones, Stantec believes the density to be adequate for resource estimation, however, additional density data would support more accurate mineral resource tonnage estimates.
There is potential for elevated uranium concentrations on Falchani based on proximity of the deposit to the Macusani Yellowcake project located 5-25 km east and north of the property.
15 MINERAL RESERVE ESTIMATES
This Technical Report does not include an estimate of reserves.
16 MINING METHODS
16.1 Introduction
This report comprises a technical study assessing the proposed mining operations which contribute towards the findings of an independent preliminary economic assessment (PEA) of the Falchani Lithium Project in Puno, south-eastern Peru. DRASA Project (DRASA P) prepared this report in collaboration with DRA Pacific (DRAP), who are acting as lead author of this PEA.
The Technical Report has been prepared in accordance with the requirements of National Instrument 43-101 Standards of Disclosure for Mineral Projects.
Conclusions of this Technical Report contains forward-looking information such as metal pricing, assumptions, sales forecasts, projected capital, and operating costs, mine life and production rates, and other assumptions. Readers are cautioned that actual results may vary from those presented.
This Technical Report update and associated Mineral Resource for the Falchani Property was re-assessed due to additional drilling, sampling and sample analysis completed by American Lithium Corporation and prepared by Stantec Consulting Services Inc. (Stantec) in accordance with the requirements of National Instrument 43-101 Standards of Disclosure for Mineral Projects (NI 43-101).
However, since 2019 additional exploration drilling has been completed on the Property and lithium market price projects have changed. These are material to the Project as demonstrated in the Mineral Resource Estimates.
The economic analysis provides only a preliminary overview of the Project economics based on broad or factored assumptions. As per CIM guidelines, Mineral Reserves can only be declared with a PFS level or higher level of study.
The Mineral Resources used in the life of mine (LoM) plan and economic analysis includes Inferred classified material. Inferred Mineral Resources are estimated with limited geological or sampling data and cannot be converted into Mineral Reserves.
The preliminary economic assessment is preliminary in nature, includes inferred mineral resources that are considered too speculative geologically to have the economic considerations applied to them that would enable them to be categorized as mineral reserves and there is no certainty that the preliminary economic assessment will be realized.
16.2 Conclusions and Limitations
The parts of the Falchani Project which fall within the Falchani concession lie within a valid and secure mining concession. There have been changes to the mineral tenure circumstances of Ocacasa 4 when compared to that reported in the 2019 Technical Report. These changes have required the QP to consider if the reporting of Mineral Resource estimates within the Ocacasa 4 concession remains appropriate.
A Court ruling, consistent with prior legal proceedings, clearly establishes that Macusani is the rightful owner of these concessions and highlights that the action launched by INGEMMET and MINEM in October 2018 was baseless and unsubstantiated. INGEMMET and MINEM have one final opportunity to petition the Supreme Court of Peru to consider the tribunal's ruling based on legal arguments, which have been exhausted. American Lithium believes the Supreme Court will not accept any petition of the lower courts' rulings. American Lithium, and its subsidiaries, have a demonstrated track record of managing the mineral tenure for several projects in Peru over several years. On this basis, the QP considers it reasonable to still report the estimates within Ocacasa 4 as Mineral Resources.
16.3 Units of Measure
Unless otherwise stated, all units used in this report are metric units of measure. The currency used throughput this report is in U.S. dollars unless otherwise stated. Lithium values are reported in percentages (%) or (ppm) unless other units are specifically stated. Grades are also expressed as lithium compounds in percentages or ppm, lithium oxide (Li2O) or lithium carbonate (Li2CO3) content.
Common comparisons for the lithium market use lithium carbonate equivalent (LCE), which is an industry standard terminology equivalent to lithium carbonate (Li2CO3). Use of LCE is to provide data comparable to industry reports and is the total equivalent amount of lithium converted to lithium carbonate using conversions factors detailed below (Table 16-1). The use of LCE assumes a final product purity of 99.5%.
Table 16-1 Conversion Factors for Lithium Compounds and Minerals
|
Convert From
|
Convert to Li
|
Convert to Li2O
|
Convert to Li2CO3
|
|
Lithium Li
|
1
|
2.153
|
5.323
|
|
Lithium Oxide Li2O
|
0.464
|
1
|
2.473
|
|
Lithium Carbonate Li2CO3
|
0.188
|
0.404
|
1
|
|
Note: Lithium Carbonate (Li2CO3) = LCE (Lithium Carbonate Equivalent)
|
Table 16-2 Conversion factors for Potassium and Cesium Compounds and Minerals
| Convert From |
Convert to K |
Convert to K₂SO₄ |
| Potassium (K) |
1 |
2.23 |
| Convert From |
Convert to Cs |
Convert to Cs₂SO₄ |
| Cesium (Cs) |
1 |
1.36 |
16.4 Sources of Information
This report is based on information provided by American Lithium Corp. and its associate consultants. The Falchani Project is an exploration property located on the Macusani Plateau, Puno, Southern Peru. and falls within licenses held by Macusani Yellowcake S.A.C (Macusani Yellowcake), formerly Global Gold S.A.C, which is 100% controlled and 99.5% owned by American Lithium
Stantec has estimated Mineral Resources, and this information is available on SEDAR, and the current Mineral Resource is detailed in the 14 December 2023 Technical Report.
The Mineral Resource Estimate ("MRE") and Technical Report were completed by Stantec, which estimated significantly larger lithium resource which will form the basis of an updated preliminary economic assessment on the Falchani ("PEA"). The MRE has been incorporated into the Mine Plan within the PEA. Mineral processing recovery and operating costs have been reliant on work completed by both ANSTO (mineralogy/testwork) and DRA Global (process plant and infrastructure).
16.5 Geotechnical
A review of previous geotechnical work was done and the following observation made.
No specific geotechnical investigations have been carried out on the Project area to date. The resource drilling program from TMC reports drilling conditions in the Lithium-rich Tuff were good, however, within the Upper and Lower Breccias, more difficult conditions were encountered. The core recovery over the length of the drillholes is approximately 95%, which is above industry standard deeming the overall core Feed recovery as acceptable. Given the overall thickness of the mineralized zones, the consistent lithium grade within the zones and the relatively good core recovery, it is considered unlikely that any bias related to core recovery could be introduced.
Photographs of recovered Plant Feed (pf) from the resource drilling program and general site conditions are shown in Figure 16-1 and Figure 16-2.
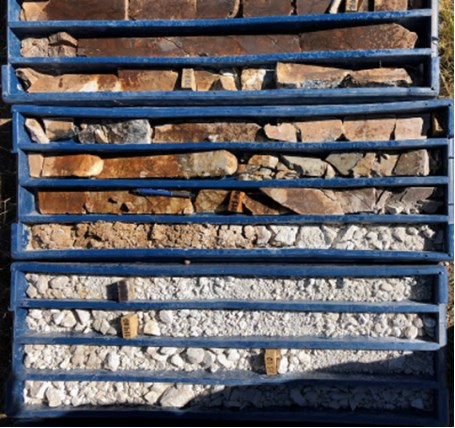
Figure 16-1 Plant Feed Photo Core Photo PCHAC-14 (Source: Stantec)
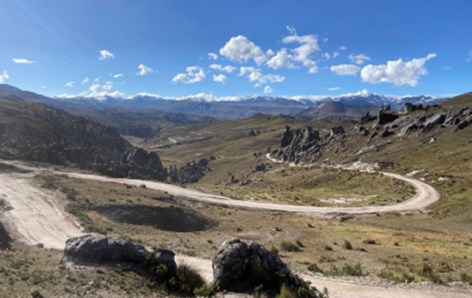
Figure 16-2 Road to Falchani Project (Source: Stantec)
Slope angles of 52° have been used for the Whittle optimisation parameters. The slope angle has been selected from preliminary assessment of slope angles based on the parameters in Table 16-3. The preliminary assessment has been used to inform the pit optimisation and does not constitute a geotechnical investigation; seismic acceleration has been considered in the analysis.
Table 16-3 Summary Geotechnical Testwork
| Sample |
Lithology |
UCS
(MPa) |
Young's Modulus
(GPa) |
Poisson's Ratio
(v) |
| M-2 (GS-01) |
Tuff |
31.8 |
15.3 |
0.31 |
| M-6 (GS-02) |
Tuff |
27.2 |
21.5 |
0.27 |
| Note: Anddes Report EPE-19.10.033 |
16.6 Current Surveys
LiDAR drone surveys were provided by American Lithium and processed into a 2 m DTM format by Stantec.
The topography was generated in the 3D block model shown in Figure 16-3.
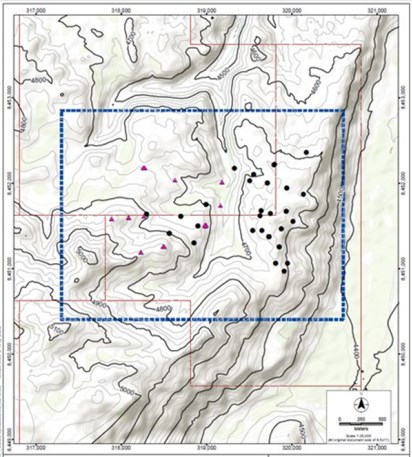
Figure 16-3 Surface Topography and Model Limits Map (Source: Stantec)
16.7 Stantec Resource Estimate
Lithium resources are contained within the UBX, LRT, LBX and CFI basement. The mineralized zones are further constrained within nine (9) fault blocks that truncate at two (2) north-south trending high angle normal faults (Valley Fault and East Fault) and the resource is limited to the east by faults NW1 and NW3, shown on Figure 14-2. The CFI zone true depth has not been well defined by drilling and is limited by the generated pit depth of 300 m below surface. Mineral resources for the upper three zones (UBX, LRT and LBX) are classified by distance from nearest valid drill hole sample up to a maximum distance of 250 m for inferred, 160 m indicated, and 80 m measured. Mineral resources for the Coarse Felsic Intrusion (CFI) are within 160 m for inferred, 80 m indicated, and 40 m measured.
The lithium mineral resource estimates are presented in Table 16-4 in metric units. The resource
estimates are contained within an economic pit shell at constant 45° pit slope to a maximum vertical depth of 300 m below surface. Table 16-4 shows the mineral resource estimate effective October 31, 2023.
Table 16-4 Mineral Resource Estimate Effective October 31,2023
|
Cutoff
|
Volume
|
Tonnes
|
Li
|
Metric Tonnes (Mt)
|
Cs
|
K
|
Rb
|
|
Li
(ppm)
|
(Mm3)
|
(Mt)
|
(ppm)
|
Li
|
Li2CO3
|
LiOH.H20
|
(ppm)
|
(%)
|
(ppm)
|
|
Measured
|
|
|
|
|
600
|
29
|
69
|
2792
|
0.19
|
1.01
|
1.15
|
631
|
2.74
|
1171
|
|
800
|
28
|
68
|
2832
|
0.19
|
1.01
|
1.15
|
641
|
2.72
|
1194
|
|
1000
|
27
|
65
|
2915
|
0.19
|
1.01
|
1.15
|
647
|
2.71
|
1208
|
|
1200
|
25
|
61
|
3024
|
0.18
|
0.96
|
1.09
|
616
|
2.74
|
1228
|
|
1400
|
24
|
57
|
3142
|
0.18
|
0.96
|
1.09
|
547
|
2.78
|
1250
|
|
Indicated
|
|
|
|
|
600
|
156
|
378
|
2251
|
0.85
|
4.52
|
5.14
|
1039
|
2.92
|
1055
|
|
800
|
148
|
357
|
2342
|
0.84
|
4.47
|
5.08
|
1058
|
2.9
|
1070
|
|
1000
|
136
|
327
|
2472
|
0.81
|
4.31
|
4.9
|
1,95
|
2.87
|
1104
|
|
1200
|
129
|
310
|
2549
|
0.79
|
4.2
|
4.78
|
1086
|
2.86
|
1146
|
|
1400
|
120
|
288
|
2646
|
0.76
|
4.04
|
4.6
|
1041
|
2.88
|
1166
|
|
Measured plus Indicated
|
|
|
|
|
600
|
185
|
447
|
2327
|
1.04
|
5.53
|
6.29
|
976
|
2.9
|
1072
|
|
800
|
176
|
425
|
2424
|
1.03
|
5.48
|
6.23
|
991
|
2.87
|
1090
|
|
1000
|
163
|
392
|
2551
|
1
|
5.32
|
6.05
|
1021
|
2.84
|
1121
|
|
1200
|
154
|
371
|
2615
|
0.97
|
5.16
|
5.87
|
1009
|
2.84
|
1160
|
|
1400
|
144
|
345
|
2725
|
0.94
|
5
|
5.69
|
960
|
2.86
|
1180
|
|
Inferred
|
|
|
|
|
600
|
198
|
506
|
1481
|
0.75
|
3.99
|
4.54
|
778
|
3.31
|
736
|
|
800
|
174
|
443
|
1597
|
0.71
|
3.78
|
4.3
|
837
|
3.24
|
762
|
|
1000
|
138
|
348
|
1785
|
0.62
|
3.3
|
3.75
|
886
|
3.18
|
796
|
|
1200
|
110
|
276
|
1961
|
0.54
|
2.87
|
3.27
|
942
|
3.1
|
850
|
|
1400
|
82
|
201
|
2211
|
0.44
|
2.34
|
2.66
|
1022
|
3.01
|
926
|
• CIM definitions are followed for classification of Mineral Resource.
• Mineral Resource surface pit extent has been estimated using a lithium carbonate price of US20,000 US$/tonne and mining cost of US$3.00/t, a lithium recovery of 90%, fixed density of 2.40 g/c.
• Conversions: 1 metric tonne = 1.102 short tons, metric m3 = 1.308 yd3, Li₂CO₃:Li ratio = 5.32, LiOH.H2O:Li ratio =6.05
• Totals may not represent the sum of the parts due to rounding. Mark, P.G. and Derek Loveday, P. Geo. Of Stantec Consulting Services Inc. in conformity with CIM "Estimation of Mineral Resource and Mineral Reserves Best Practices" guidelines and are reported in accordance with the Canadian Securities Administrators NI 43-101. Mineral resources are not mineral reserves and do not have demonstrated economic viability. There is no certainty that any mineral resource will be converted into mineral reserve.
Refer to Falchani-NI43-101_Technical_Report_Final_12-14-23 for Plant Feed details.
The generalized mineral resource classification map is shown in Figure 16-4.
Mineral resources for the upper three zones (UBX, LRT and LBX) are classified by distance from nearest valid drill hole sample up to a maximum distance of 250 m for inferred, 160 m indicated, and 80 m measured. Mineral resources for the CFI are within 160 m for inferred, 80 m indicated, and 40 m measured.
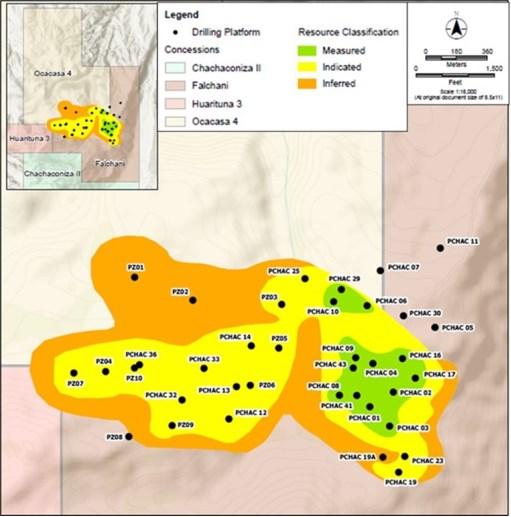
Figure 16-4 Generalized Resource Classification Map (Source: Stantec)
Table 16-5 Mineral resource as of October 2023 (Source: Stantec)
|
Resource
Class
|
Tonnes
(Mt)
|
Li
(ppm)
|
Li₂CO₃
(%)
|
Li2CO3 (Mt)
|
K (%)
|
Cs
(ppm)
|
Rb
(ppm)
|
|
Measured & indicated
|
392
|
2551
|
1.36
|
5.32
|
2.84
|
1021
|
1121
|
|
Inferred
|
348
|
1785
|
0.95
|
3.30
|
3.18
|
886
|
796
|
|
TOTAL
|
740
|
2191
|
1.17
|
8.62
|
3.00
|
958
|
968
|
|
Note: 1,000 Li ppm cut-off applied.
|
|
|
16.8 Open Pit Optimization
16.8.1 Block Models
The open pit optimization has been carried out using Whittle optimization software. Whittle optimization software system use the Lerchs-Grossman Algorithm to maximize gross value of the potential open pit by using appropriate input parameters to estimate the overall project value. The open pit Whittle optimization utilizes the Mineral Resource block model generated in Datamine format by Stantec as the main source of geological information. Table 16-6 summarizes the block model origin and extensions. Key fields used in the block model are detailed in Table 16-7. DRA added additional fields on the block model which are labelled DRA.
Table 16-6 Block Model Origin and Dimensions
| Dimension |
Origin |
Block Size (Parent) |
Number of Blocks |
| X |
317300 |
20 |
166 |
| Y |
8450410 |
20 |
123 |
| Z |
4000 |
5 |
241 |
Table 16-7 Summary of Key Fields in Block Model
|
Field Name
|
Code
|
Coded
|
Description
|
|
Density
|
RRSG/RSG
|
Stantec
|
Coded in Model by Stantec
|
|
Stratum
|
LI1
|
Stantec
|
Upper Breccia
|
|
K1
|
Stantec
|
Upper Breccia
|
|
CS1
|
Stantec
|
Upper Breccia
|
|
RB1
|
Stantec
|
Upper Breccia
|
|
LI2
|
Stantec
|
Lithium-rich Tuff
|
|
K2
|
Stantec
|
Lithium-rich Tuff
|
|
CS2
|
Stantec
|
Lithium-rich Tuff)
|
|
RB2
|
Stantec
|
Lithium-rich Tuff
|
|
LI3
|
Stantec
|
Lower Breccia
|
|
K3
|
Stantec
|
Lower Breccia
|
|
CS3
|
Stantec
|
Lower Breccia
|
|
RB3
|
Stantec
|
Lower Breccia
|
|
LI4
|
Stantec
|
Coarse Felsic Intrusion
|
|
K4
|
Stantec
|
Coarse Felsic Intrusion
|
|
CS4
|
Stantec
|
Coarse Felsic Intrusion
|
|
RB4
|
Stantec
|
Coarse Felsic Intrusion
|
|
Grade Fields
|
LIPPM
|
DRA
|
Lithium Grade (ppm)
|
|
LCE%
|
DRA
|
Converted Lithium Carbonate (LCE) Grade (%)
|
|
K%
|
DRA
|
Potassium Grade (%)
|
|
CSPPM
|
DRA
|
Cesium Grade (ppm)
|
|
RBPPM
|
DRA
|
Rubidium Grade (ppm)
|
|
Class
|
RRSG
|
Stantec
|
Specific Gravity M&I (for Measured and Indicated)
|
|
RRLI
|
Stantec
|
Lithium M&I (for Measured and Indicated)
|
|
RRK
|
Stantec
|
Potassium M&I (for Measured and Indicated)
|
|
RRCS
|
Stantec
|
Cesium M&I (for Measured and Indicated)
|
|
RRRB
|
Stantec
|
Rubidium M&I (for Measured and Indicated)
|
|
RSG
|
Stantec
|
Specific Gravity MIF (for Measured, Indicated and Inferred)
|
|
RLI
|
Stantec
|
Specific Gravity MIF (for Measured, Indicated and Inferred)
|
|
RK
|
Stantec
|
Specific Gravity MIF (for Measured, Indicated and Inferred)
|
|
RCS
|
Stantec
|
Specific Gravity MIF (for Measured, Indicated and Inferred)
|
|
RRB
|
Stantec
|
Specific Gravity MIF (for Measured, Indicated and Inferred)
|
|
Class 2
|
2
|
DRA
|
Combination of CLASS and Stratum for Optimization
|
|
Class 3
|
3
|
DRA
|
Combination of CLASS and Stratum for Optimization
|
16.8.2 Pit Optimization Parameters
A breakdown of the costs and parameters used in the optimization are shown in Table 16-8.
The optimization considered both Indicated and Inferred classified material, but only LRT geological units.
The reader is cautioned that results from the pit optimization are used solely for the purpose of testing the deposit with open pit extraction and do not represent an attempt to estimate Mineral Reserves.
Table 16-8 Pit Optimisation Parameters Base Case
|
Parameter
|
Units
|
Comment
|
Product Price
|
|
Li
|
$/t
|
Lithium Carbonate Li2CO3 (99.5% FOB)
|
$20 000.00
|
|
K
|
$/t
|
Potassium Sulfate K₂SO₄
|
$750.00
|
|
Cs
|
$/t
|
Cesium Sulfate Cs₂SO₄
|
$58 000.00
|
|
Rb
|
$/t
|
Rubidium Sulfate Rb₂SO₄
|
N/A
|
|
Discount Rate
|
%
|
For NPV calculations
|
8.00%
|
|
Royalty % Revenue
|
%
|
Royalty, Mining Tax, Obligation
|
5.50%
|
|
Mining Factors
|
|
Comment
|
Factor %
|
|
Mining Losses
|
%
|
Flat lying, Bulk, Readily Identifiable
|
2%
|
|
Geological Losses
|
%
|
High level of indicated & inferred resource
|
5.80%
|
|
Total PF Losses
|
%
|
|
7.8%
|
|
Mining Plant Feed Parameters
|
|
Plant Feed Period
|
Throughput Rates
|
|
Phase 1
|
Mt/y
|
Year 1-5
|
1.5 Mt/y
|
|
Phase 2
|
Mt/y
|
Year 6-10
|
3.0 Mt/y
|
|
Phase 3
|
Mt/y
|
Year 11 to end
|
6.0 Mt/y
|
|
Operating Costs
|
|
Comment
|
Mining Cost per tonne
|
|
Reference Mining Cost
|
$/tRock
|
April 2023 PEA Fin Model
|
$2.60
|
|
Mining Cost Adjustment Factor
|
$/tRock
|
Reference Elevation = 4650mRL
|
MCAF = $0.006/vert m
|
|
Product
|
Units
|
November 2023 PEA Fin Model
|
Process Costs
|
|
Process Costs - per t Milled
|
$/t Milled
|
1.5Mt/y including G&A $5M/a
|
$74.71
|
|
Process Costs - per t Milled
|
$/t Milled
|
3.0Mt/y including G&A $7M/a
|
$72.24
|
|
Process Costs - per t Milled
|
$/t Milled
|
6.0Mt/y including G&A $9M/a
|
$70.47
|
|
Product Recovery
|
Units
|
Est Grades ANSTO
|
Metallurgical Recovery
|
|
Lithium Carbonate Li2CO3
|
%
|
0.362
|
80.0%
|
|
Potassium Sulfate K₂SO₄
|
%
|
3.300
|
23.8%
|
|
Cesium Sulfate Cs₂SO₄
|
%
|
0.060
|
72.4%
|
|
Rubidium Sulfate Rb₂SO₄
|
%
|
0.146
|
53.4% N/A
|
|
Conversions Element to Salt
|
Units
|
Comment
|
Ratio
|
|
Li
|
Ratio
|
Conversions: Li2CO3: Li ratio
|
x 5.32
|
|
Parameter
|
Units
|
Comment
|
Product Price
|
|
K
|
Ratio
|
Conversions: K to K₂SO₄ ratio
|
x 2.23
|
|
Cs
|
Ratio
|
Conversions: Cs to Cs₂SO₄ ratio
|
x 1.36
|
|
Other Parameters
|
|
Comment
|
Estimate
|
|
Slope Angles
|
°
|
Assumption, based on preliminary analysis
|
52o
|
|
Default Density
|
t/m³
|
Default Density Waste & Mineralized
|
2.4
|
16.8.3 Pit Optimization Results
The Whittle optimization process producing an open pit, pit shell yielding the maximum NPV or maximum profit for a given lithium carbonate price; the method was used to determine a series of optimized pit shells, known as push backs or phases, which utilise the input parameters agreed to determine the projects overall viability.
All Whittle optimisation results and sensitivities were analysed and based on the factors listed below pit shell 3 chosen as the go-forward option for mine planning consideration.
Factor used to select the go-forward pit shell selections are: -
- Increase grade cut-off of <2600ppm lithium cut-off.
- Reduced total plant feed available for processing and resultant LoM.
- Reduce the waste vs. plant feed strip ratio to maintain lower mining costs over the LoM.
The results of the pit optimization evaluation on the cases are summarized in Figure 16-5.
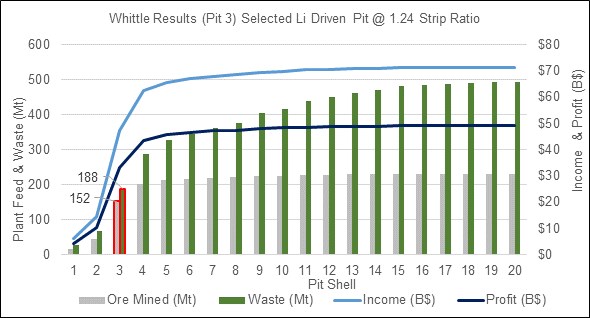
Figure 16-5 Whittle Optimisation Results with Pit Shell 3 Selection
The selected shell contents are shown below, based on a lithium carbonate price of $20,000, potassium sulfate price of $750 and cesium sulfate price of $58,000. Both Indicated and Inferred classified Mineral Resources were used in the conceptual production schedules. Upper Breccia, Lithium-rich bearing tuffs, Lower Breccia, and Coarse Felsic Intrusion namely LI1, LI3, LI2, LI3 and LRT4, are used in the optimisation. All the other lithologies have been excluded owing to lower grades in them. Economic parameters for potential by-products such as potassium and cesium, except rubidium, are included in the Whittle optimization runs. See Table 16-9 for summary of shell contents for each case.
Table 16-9 Summary of Pit Shell 3 In-situ Optimised Shell Content (Li < 2 600ppm)
|
Classification
|
Tonnes
(Mt)
|
Li
(ppm)
|
Li2CO3
(%)
|
Li2CO3
(Mt)
|
K
(%)
|
Cs
(ppm)
|
Rb
(ppm)
|
|
Measured and Indicated
|
134. 1
|
0.332
|
1.77
|
2.4
|
2.96
|
0.057
|
0.129
|
|
Inferred
|
18. 3
|
0.335
|
1.78
|
0.3
|
2.94
|
0.045
|
0.129
|
|
TOTAL
|
152. 4
|
0.332
|
1.77
|
2.7
|
2.96
|
0.056
|
0.129
|
|
Note: 2,600 Li ppm cut-off applied.
|
|
|
16.9 Mine Planning
Post Whittle pit shell selection, production scheduling and push back planning was undertaken on the selected pit shells. The conceptual mine scheduling for the ramping up from 1.5 to 6 Mt/y process plant feed. The mineral resource summary is shown in Table 16-10.
Table 16-10 Base Case Mineral Resource Summary
|
Falchani - Production Scheduled Mineral Resources
|
|
Parameter
|
Unit
|
Value
|
|
Mine Production Life
|
Year
|
34
|
|
High Grade Stockpile Range
|
ppm
|
> 2600
|
|
HG Process Feed Material
|
Mt
|
152.4
|
|
HG Diluted Li grade (mill head grade)
|
ppm
|
3321
|
|
HG Contained LCE (Mt)
|
Mt
|
2.695
|
|
HG Diluted K grade (mill head grade)
|
%
|
2.960
|
|
HG Diluted Cs grade (mill head grade)
|
%
|
0.056
|
|
Low Grade Stockpile Range
|
ppm
|
< 2600 >1600
|
|
LG Process Feed Material
|
Mt
|
24.6
|
|
LG Diluted Li grade (stockpile grade)
|
ppm
|
2287
|
|
LG Contained LCE (Mt)
|
Mt
|
0.299
|
|
LG Diluted K grade (stockpile grade)
|
%
|
2.779
|
|
LG Diluted Cs grade (stockpile grade)
|
%
|
0.117
|
|
Marginal Grade Stockpile Range
|
ppm
|
> 1600 > 1000
|
|
Marginal Process HG Feed Material
|
Mt
|
35.7
|
|
Marginal Diluted Li grade (stockpile grade)
|
ppm
|
1520
|
|
Marginal Contained LCE (Mt)
|
Mt
|
0.289
|
|
Marginal Diluted K grade (stockpile grade)
|
%
|
2.315
|
|
Marginal Diluted Cs grade (stockpile grade)
|
%
|
0.099
|
|
Waste
|
Mt
|
127
|
|
Total Material
|
Mt
|
339.7
|
|
Strip Ratio
|
tw:t total pf
|
0.6
|
|
Strip Ratio
|
tw:H-G pf
|
0.83
|
16.9.1 Dilution and Loss
Since the mining mineralized deposits zones are massive with low strip ratios the following dilution and losses parameters where used:
- Mining losses of only 2% were used due to the limited zones of interaction between waste and mineralized material.
- Geological losses of 5.8% average are derived from the geological resource works which consider the current relatively low drilling density.
16.9.2 Mine Sequencing/Scheduling
The annual mining schedule has been developed based on the three phases (1.5, 3.0 & 6.0 Mt/y) of production ramp up detailed in Table 16-11. Production is planned to be ramped up to a maximum mill feed of 6Mt/y, (≈16,500t/d). The LoM of this Project is approximately 33 years, (including 6 months pre-production), based on the 152.4Mt of Indicated and Inferred Mineral Resources.
Table 16-11 Production Ramp Phases
|
Production Ramp Up
|
Y 1
|
Y 2
|
Y 3 to 7
|
Y 8
|
Y 9 to 12
|
Y 13
|
Y 14 to 32
|
|
Plant Feed Mt/y
|
0.75
|
1.00
|
1.50
|
2.25
|
3.00
|
4.50
|
6.00
|
The results of the planned production ramp up and LoM production schedule are shown in Table 16-12 details the conceptual production rates and Figure 16-6 to Figure 16-10 shows graphs of the conceptual production schedule results. The mine progression (pushback cuts) phased can be seen in Figure 16-11. The annual and LoM stripping ratios and pre-production waste strip has been shown in the mine scheduling. Only 1.02Mt of waste has been identified as predevelopment waste owing to the local topography, orientation of mineralization and the planned phased process plant.
Table 16-12 PEA LoM Production Schedule Summary
|
Field Name
|
Plant Feed tonnes
|
Li
|
Li2CO3
|
K
|
CS
|
Low Grade tonnes
|
Li
|
Li2CO3
|
K
|
CS
|
Marginal Plant Feed tonnes
|
Li
|
Li2CO3
|
K
|
CS
|
Waste tonnes
|
Total Material Mined
|
|
Units
|
(tonnes)
|
%
|
%
|
%
|
%
|
(tonnes)
|
%
|
%
|
%
|
%
|
(tonnes)
|
%
|
%
|
%
|
%
|
(tonnes)
|
(tonnes)
|
|
Year -1
|
0.34
|
0.35
|
1.84
|
2.79
|
0.06
|
0.06
|
0.23
|
1.25
|
2.65
|
0.09
|
0.66
|
0.14
|
0.74
|
1.89
|
0.09
|
1.02
|
2.08
|
|
Year 1
|
0.46
|
0.38
|
2.02
|
2.84
|
0.05
|
0.00
|
0.23
|
1.24
|
2.64
|
0.09
|
0.15
|
0.15
|
0.81
|
1.80
|
0.09
|
1.38
|
1.99
|
|
Year 2
|
1.04
|
0.38
|
2.02
|
2.81
|
0.04
|
0.03
|
0.22
|
1.17
|
2.34
|
0.08
|
0.34
|
0.17
|
0.90
|
1.84
|
0.07
|
2.08
|
3.49
|
|
Year 3
|
1.85
|
0.36
|
1.90
|
2.85
|
0.05
|
0.11
|
0.23
|
1.20
|
2.36
|
0.08
|
2.06
|
0.13
|
0.72
|
1.76
|
0.09
|
0.62
|
4.64
|
|
Year 4
|
1.74
|
0.36
|
1.94
|
2.85
|
0.04
|
0.00
|
0.25
|
1.32
|
2.96
|
0.04
|
0.19
|
0.13
|
0.70
|
1.61
|
0.10
|
2.62
|
4.54
|
|
Year 5
|
1.78
|
0.36
|
1.92
|
2.85
|
0.04
|
0.00
|
0.24
|
1.27
|
2.78
|
0.06
|
0.06
|
0.16
|
0.85
|
1.70
|
0.17
|
3.12
|
4.96
|
|
Year 6
|
1.64
|
0.35
|
1.85
|
2.85
|
0.04
|
0.15
|
0.23
|
1.20
|
2.58
|
0.07
|
1.09
|
0.13
|
0.71
|
2.01
|
0.10
|
4.88
|
7.76
|
|
Year 7
|
3.47
|
0.35
|
1.87
|
2.91
|
0.04
|
0.13
|
0.24
|
1.28
|
3.03
|
0.05
|
2.39
|
0.12
|
0.66
|
1.79
|
0.09
|
2.07
|
8.06
|
|
Year 8
|
3.47
|
0.35
|
1.89
|
2.88
|
0.04
|
0.02
|
0.22
|
1.20
|
3.21
|
0.04
|
0.49
|
0.14
|
0.76
|
1.89
|
0.11
|
3.93
|
7.91
|
|
Year 9
|
3.16
|
0.35
|
1.87
|
2.87
|
0.04
|
0.01
|
0.23
|
1.23
|
2.57
|
0.08
|
0.10
|
0.16
|
0.88
|
1.95
|
0.19
|
4.94
|
8.20
|
|
Year 10
|
3.10
|
0.35
|
1.85
|
2.90
|
0.04
|
0.11
|
0.22
|
1.18
|
2.14
|
0.06
|
1.12
|
0.13
|
0.71
|
2.33
|
0.09
|
4.13
|
8.46
|
|
Year 11
|
4.46
|
0.34
|
1.81
|
2.93
|
0.04
|
0.17
|
0.24
|
1.29
|
2.89
|
0.06
|
1.29
|
0.14
|
0.72
|
2.12
|
0.10
|
3.06
|
8.99
|
|
Year 12
|
5.97
|
0.33
|
1.77
|
2.97
|
0.04
|
0.63
|
0.24
|
1.27
|
2.69
|
0.05
|
2.48
|
0.13
|
0.72
|
2.36
|
0.09
|
5.26
|
14.34
|
|
Year 13
|
6.15
|
0.32
|
1.73
|
3.00
|
0.03
|
0.01
|
0.23
|
1.22
|
3.19
|
0.05
|
0.02
|
0.15
|
0.80
|
2.11
|
0.16
|
9.30
|
15.49
|
|
Year 14
|
5.96
|
0.34
|
1.80
|
3.07
|
0.04
|
0.52
|
0.23
|
1.24
|
2.56
|
0.06
|
1.62
|
0.16
|
0.83
|
2.43
|
0.09
|
7.16
|
15.26
|
|
Year 15
|
4.78
|
0.33
|
1.74
|
3.05
|
0.03
|
0.04
|
0.20
|
1.08
|
2.60
|
0.12
|
0.12
|
0.18
|
0.94
|
2.55
|
0.13
|
10.80
|
15.73
|
|
Year 16
|
5.92
|
0.34
|
1.79
|
3.15
|
0.04
|
0.68
|
0.22
|
1.20
|
3.03
|
0.07
|
1.13
|
0.16
|
0.83
|
2.49
|
0.10
|
8.03
|
15.76
|
|
Year 17
|
6.23
|
0.33
|
1.78
|
3.09
|
0.03
|
0.03
|
0.23
|
1.25
|
3.34
|
0.06
|
0.07
|
0.15
|
0.77
|
2.40
|
0.09
|
8.86
|
15.20
|
|
Year 18
|
6.12
|
0.30
|
1.59
|
2.91
|
0.03
|
0.28
|
0.24
|
1.27
|
2.97
|
0.04
|
0.70
|
0.14
|
0.76
|
1.91
|
0.06
|
8.91
|
16.01
|
|
Year 19
|
6.06
|
0.32
|
1.71
|
3.00
|
0.04
|
0.71
|
0.22
|
1.19
|
2.84
|
0.09
|
0.47
|
0.17
|
0.93
|
2.68
|
0.11
|
8.53
|
15.77
|
|
Year 20
|
6.00
|
0.31
|
1.67
|
2.94
|
0.04
|
1.17
|
0.24
|
1.28
|
2.68
|
0.07
|
1.96
|
0.16
|
0.86
|
2.48
|
0.09
|
7.27
|
16.41
|
|
Year 21
|
6.14
|
0.32
|
1.72
|
2.93
|
0.04
|
0.90
|
0.23
|
1.25
|
2.57
|
0.08
|
1.36
|
0.15
|
0.82
|
2.47
|
0.09
|
4.08
|
12.49
|
|
Year 22
|
6.38
|
0.33
|
1.76
|
2.94
|
0.04
|
0.63
|
0.24
|
1.26
|
2.59
|
0.08
|
0.88
|
0.14
|
0.77
|
2.39
|
0.08
|
2.52
|
10.41
|
|
Year 23
|
7.93
|
0.33
|
1.76
|
2.93
|
0.05
|
0.76
|
0.23
|
1.23
|
2.92
|
0.11
|
1.32
|
0.14
|
0.75
|
2.33
|
0.08
|
2.04
|
12.05
|
|
Year 24
|
6.93
|
0.33
|
1.74
|
3.03
|
0.04
|
1.43
|
0.23
|
1.23
|
2.91
|
0.12
|
1.42
|
0.14
|
0.74
|
2.32
|
0.08
|
2.11
|
11.89
|
|
Year 25
|
6.06
|
0.33
|
1.78
|
3.05
|
0.05
|
1.20
|
0.23
|
1.23
|
2.94
|
0.16
|
1.47
|
0.15
|
0.79
|
2.53
|
0.08
|
1.93
|
10.66
|
|
Year 26
|
7.34
|
0.34
|
1.78
|
3.09
|
0.05
|
1.48
|
0.23
|
1.21
|
3.00
|
0.15
|
1.53
|
0.16
|
0.84
|
2.49
|
0.10
|
1.45
|
11.81
|
|
Year 27
|
7.96
|
0.33
|
1.75
|
3.05
|
0.07
|
1.95
|
0.23
|
1.22
|
2.96
|
0.15
|
1.68
|
0.17
|
0.89
|
2.57
|
0.10
|
1.06
|
12.66
|
|
Year 28
|
7.35
|
0.32
|
1.68
|
2.82
|
0.13
|
1.66
|
0.23
|
1.24
|
2.94
|
0.14
|
1.29
|
0.17
|
0.89
|
2.59
|
0.18
|
0.34
|
10.63
|
|
Year 29
|
6.51
|
0.34
|
1.82
|
2.66
|
0.08
|
0.78
|
0.23
|
1.22
|
2.53
|
0.12
|
0.59
|
0.17
|
0.90
|
2.51
|
0.17
|
0.78
|
8.65
|
|
Year 30
|
4.28
|
0.34
|
1.82
|
2.89
|
0.09
|
2.73
|
0.22
|
1.19
|
2.67
|
0.13
|
2.18
|
0.18
|
0.96
|
2.47
|
0.11
|
1.98
|
11.17
|
|
Year 31
|
2.58
|
0.31
|
1.65
|
2.93
|
0.19
|
4.53
|
0.22
|
1.19
|
2.69
|
0.13
|
3.10
|
0.18
|
0.95
|
2.62
|
0.10
|
0.60
|
10.81
|
|
Year 32
|
3.28
|
0.34
|
1.84
|
3.01
|
0.18
|
1.62
|
0.22
|
1.18
|
2.71
|
0.13
|
0.41
|
0.19
|
0.99
|
2.67
|
0.11
|
0.15
|
5.45
|
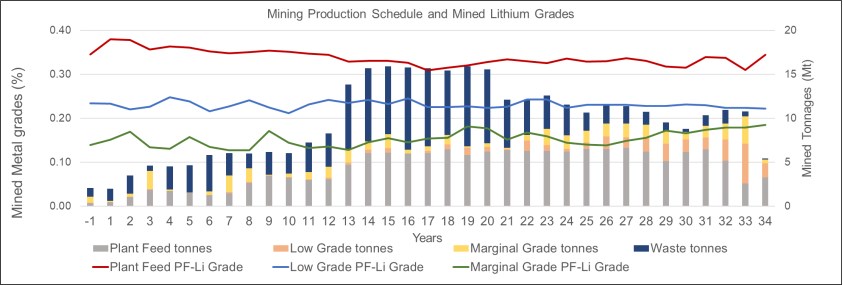
Figure 16-6 Mining Production Schedule and Mined Lithium Grades
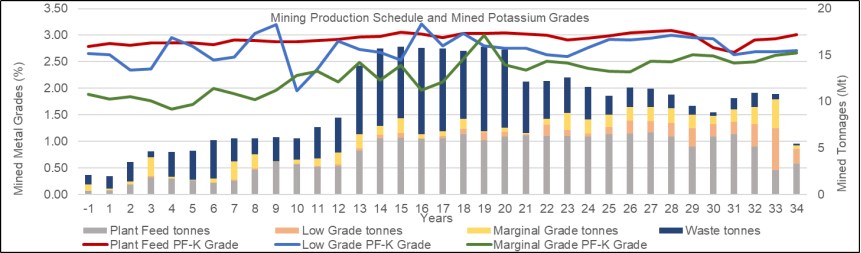
Figure 16-7 Mining Production Schedule and Mined Potassium Grades
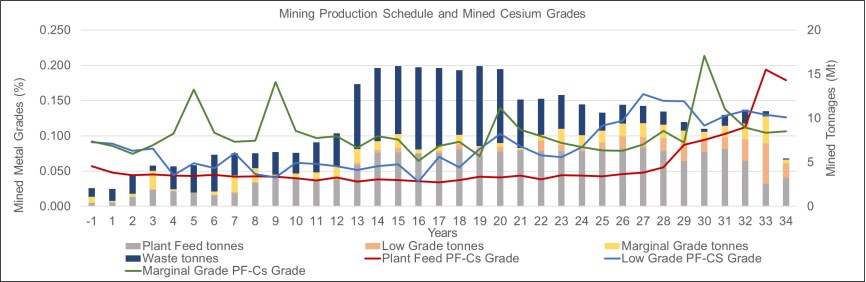
Figure 16-8 Mining Production Schedule and Mined Cesium Grades

Figure 16-9 Mining Production Schedule and Strip Ratios
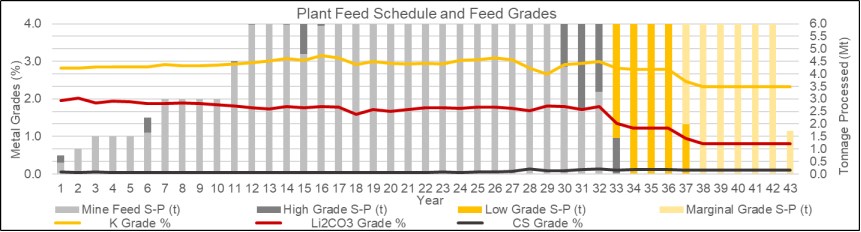
Figure 16-10 Plant Feed Schedule and Feed Grades
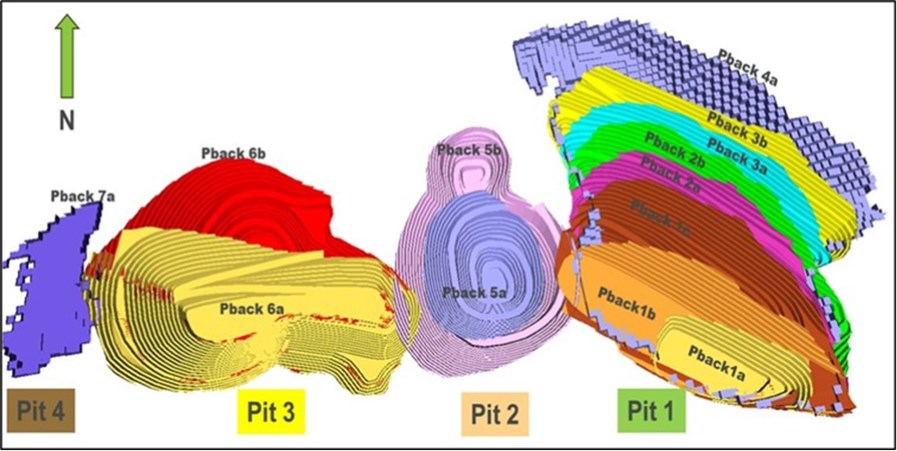
Figure 16-11 Push Back Planning and Progression in the Mine Scheduling
16.10 Open Pit Mine Operations
Open pit mining is planned to use conventional truck and shovel mining methods with drilling and blasting to break the rock mass into manageable particle sizes.
Mining operations are planned to be undertaken by a contractor operated mining fleet, which is the cost basis for this preliminary economic assessment. Mining and processing operations will be conducted 24 hours day, seven (7) days week and 353 days per year.
- Fully mobile production equipment, consisting of medium sized hydraulic shovels and 90 tonne rigid dump trucks has been planned (Figure 16-12).
- Total mining costs of $ 2.60/t and a mining height adjustment factor of $0.06 per vertical meter of all material moved at altitude is the basis for the Project economics.
- A bulk supplies diesel price of $ 1.10/L is incorporate in the mining costs.
- Support equipment will be Front End Loaders, tracked dozers, graders, and water trucks.
- The run-of-mine (RoM) tip and stockpiles near the Process Plants primary crusher will be the mining and process battery limit.
- Operation elevation of 4480 to 4,875masl have been observed and this will require dual turbo charging of all equipment to limit high altitude derating factors.
- The deepest push back planned is 5B at a depth of 305m.
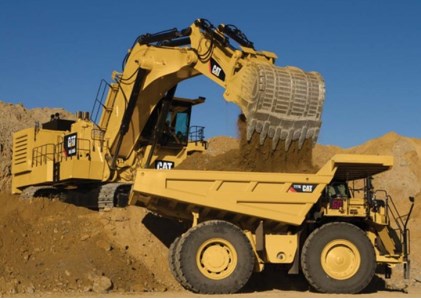
Figure 16-12 Typical Mining Production Fleet
The open pit LoM contains 152Mt of high-grade mineralized material (Li<2600ppm) with an average Li plant feed grade of 3321ppm. The stripping ratio is low at 1.20 to 1 waste to mineralized material, and the total waste mined is 127Mt.
16.11 Waste Dumps
The waste dump will be planned in accordance with environmental constraints and located around the pit edges once it has been confirmed that there are no additional mineral resources in these areas. Backfilling of waste into mined out pit areas should be optimized to reduce haul distances and environmental impacts. Consideration should made to ensure the position of the waste dump will not impact further exploration or mineralisation. Some waste material may be used in the construction for the TSF, however this will only be addressed in the next study phase. Waste rock dumps are generally constructed in 5 to 10m lifts to a maximum of 40 to 60m depending on local geotechnical stability and terrain.
16.12 Mining Shift Cycles and Equipment
The life of mine is estimated to at 34 years, including 6 months pre-production and a relatively slow process plant ramp up to Phase 1 at 1.5Mt/y.
At full steady state an average of 12.5Mt/y rock movement will be required. The maximum rock movement is currently planned for 15.9Mt/y in year 15. The mine operation is planned on two 10-hour shifts per day, 353 days per year. See Table 16-13 for an example of a typical shift roster. The mine plan has been developed based on using one or more mining contractors for all planning and operational aspects of the mining operation.
Table 16-13 Typical Shift Roster
|
Labour Roster
|
A
|
B
|
C
|
Total
|
|
Monday
|
10
|
10
|
|
20
|
|
Tuesday
|
10
|
10
|
|
20
|
|
Wednesday
|
|
10
|
10
|
20
|
|
Thursday
|
|
10
|
10
|
20
|
|
Friday
|
|
10
|
10
|
20
|
|
Saturday
|
10
|
|
10
|
20
|
|
Labour Roster
|
A
|
B
|
C
|
Total
|
|
Sunday
|
10
|
|
10
|
20
|
|
Monday
|
10
|
|
10
|
20
|
|
Tuesday
|
10
|
10
|
|
20
|
|
Wednesday
|
10
|
10
|
|
20
|
|
Thursday
|
10
|
10
|
|
20
|
|
Friday
|
|
10
|
10
|
20
|
|
Saturday
|
|
10
|
10
|
20
|
|
Sunday
|
|
10
|
10
|
20
|
|
Monday
|
10
|
|
10
|
20
|
|
Tuesday
|
10
|
|
10
|
20
|
|
Wednesday
|
10
|
|
10
|
20
|
|
Thursday
|
10
|
10
|
|
20
|
|
Friday
|
10
|
10
|
|
20
|
|
Saturday
|
10
|
10
|
|
20
|
|
Sunday
|
|
10
|
10
|
20
|
|
Monday
|
|
10
|
10
|
20
|
|
Tuesday
|
|
10
|
10
|
20
|
|
Wednesday
|
10
|
|
10
|
20
|
|
Thursday
|
10
|
|
10
|
20
|
|
Friday
|
10
|
|
10
|
20
|
|
Saturday
|
10
|
10
|
|
20
|
|
Sunday
|
10
|
10
|
|
20
|
|
Total
|
190
|
190
|
180
|
560
|
|
Total Hour per Week
|
44
|
44
|
42
|
|
The conceptual mining schedule is used to produce an indicative fleet list for the operations. The equipment estimate was based on a productivity model and experience of similar sized open pit operations. Production fleets utilization and mechanical availability is based on the planned shift cycles above and is detailed in Table 16-14.
Table 16-14 Contractor Operated Mining Hour Summary
|
PRELIMINARY CONTRACTOR OPERATED MINING HOURS
|
|
Description
|
Unit
|
Fact
|
Assumption
|
Calculated result
|
|
Days per year
|
day
|
365
|
|
8760
|
|
Non-working days per year
|
day
|
12 x Public Hols
|
12
|
|
|
Working days
|
day
|
|
|
353
|
|
Average days per week
|
|
|
|
6.79
|
|
Site scheduled working hours
|
h
|
EFF
|
20h/d
|
7 060
|
|
Shift change including Pre-Shift Check
|
h
|
15 mins/s
|
0.5
|
2.5%
|
|
Refuel & top up:
|
h
|
30mins/d
|
0.5
|
2.5%
|
|
Safety Meetings in shift
|
h
|
20mins/d
|
0.33
|
1.7%
|
|
Comfort Break
|
h
|
30mins/s
|
1
|
5.0%
|
|
Standby & idle
|
h
|
30mins/d
|
0.5
|
2.5%
|
|
Survey/Geology/Foreman
|
h
|
20mins/d
|
0.33
|
1.7%
|
|
Blasting
|
h
|
|
|
0.0%
|
|
Relocate (Tramming)
|
h
|
|
1.00
|
5.0%
|
|
Sub total
|
h
|
|
4.17
|
20.8%
|
|
Operational stops per year
|
|
|
|
1 471
|
|
Machine scheduled hours / year
|
|
Utilization
|
79.2%
|
5 589
|
|
Planned Mechanical Availability
|
|
Availability
|
90%
|
|
|
Planned Maintenance stops
|
h
|
|
|
485
|
|
Break Down stops
|
|
|
10%
|
48
|
|
Total stops
|
h
|
|
|
2 004
|
|
Operational stops
|
h
|
|
|
2 004
|
|
Machine operating hours per year
|
h
|
|
|
5 056
|
|
Machine operating hours per month
|
h
|
|
|
421
|
|
Machine operating hours per week
|
h
|
|
|
97
|
|
Machine operating hours per day
|
h
|
|
|
14
|
16.12.1 Blast Hole Drilling
Drilling will be the Mining Contractors responsibility using appropriately sizes track or truck mounted, drill rigs. Drilling is planned for 10m benches, the hole diameter is anticipated to be between 110mm to 140mm depending on local conditions. Drilling penetration rates would be typically between 40 to 50m/h depending on rock hardness and operators' skill levels.
16.12.2 Blasting
Blasting will occur during lunch breaks or between shifts according to drilling pattern and changing plan approved by the Mine Manager.
16.12.3 Explosive Design
Blast holes will be charged with Ammonium Nitrate based explosives with appropriate are initiation systems Explosives will be delivered using an explosive truck which will measure and deliver the planned amount. A powder factor (kg/m3) range of 0.26-0.31, is anticipated, which should limit oversize to be accommodated by the processing plants grizzly spacing on the primary crusher.
16.12.4 Loading and Hauling
Waste loading is undertaken using hydraulic shovels as the primary unit, 140t class (8mᵌ bucket capacity).
The mineralized material will be loaded with front end loader, 100t class (11mᵌ bucket capacity).
Spare front end loaders will act as backups for waste loading, mineralized material loading and RoM tip re-handle.
The specified loading equipment is suitable for loading the 90t rigid dump trucks or other trucks that the mining contractor may recommend in future study phases.
In-pit haulage distances are estimate based on the current planned pit progression. Distance from pit to RoM pad has been planned at 2.0km, based on maximum ex-pit ramp incline of 6 degrees. Pit to waste dumps or backfill locations are based on a 2.0km average distance, based on maximum ex-pit ramp and waste rock dump ramp incline of 6 degrees.
16.12.5 Production Equipment
The following equipment lists in Table 16-15 and Figure 16-13 is planned for the production schedule execution of the Falchani Project LoM.
Table 16-15 Preliminary Production Equipment
|
Equipment Type / Operation
Period (Years)
|
Year
-1 to 2
|
Year
3 to 6
|
Year
6 to 10
|
Year
11 to
12
|
Year
13 to 20
|
Year
21 to 33
|
|
Material Movement (Mt/y)
|
2 - 3.5
|
4.6
|
5.8 - 6.1
|
7.3 - 8.3
|
14 - 16
|
11 - 12.6
|
|
Production Fleet
|
8
|
8
|
8
|
17
|
24
|
18
|
|
Drill Rigs
|
1
|
1
|
1
|
2
|
2
|
2
|
|
Excavator 140t
|
0
|
0
|
0
|
1
|
1
|
1
|
|
Front End Loader 100t class)
|
1
|
1
|
1
|
1
|
2
|
2
|
|
Haul Truck (90t)
|
6
|
6
|
6
|
13
|
19
|
13
|
|
Auxiliary Support Fleet
|
16
|
17
|
25
|
25
|
29
|
29
|
|
Tracked Dozer D8
|
1
|
2
|
3
|
3
|
3
|
3
|
|
Motor Grader
|
1
|
1
|
2
|
2
|
2
|
2
|
|
Water Truck 30,000L
|
1
|
1
|
2
|
2
|
2
|
2
|
|
Fuel Truck
|
1
|
1
|
2
|
2
|
2
|
2
|
|
Service Truck
|
1
|
1
|
2
|
2
|
2
|
2
|
|
Lighting Plant
|
4
|
4
|
4
|
4
|
4
|
4
|
|
Light Vehicles
|
7
|
7
|
10
|
10
|
14
|
14
|
|
TOTAL
|
24
|
25
|
33
|
42
|
53
|
47
|
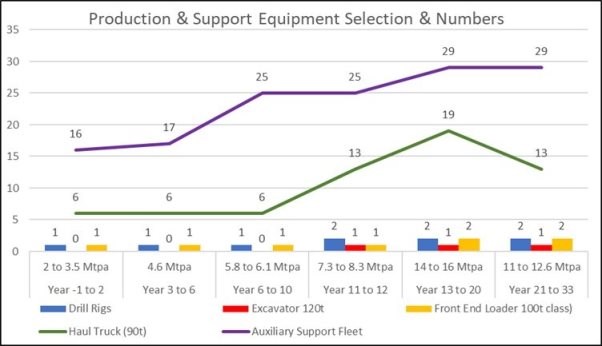
Figure 16-13 Production Fleet per Year per Production Phase
16.12.6 Pit Access
Construction and maintenance of all pit access, pit ramps and in pit roads will be part of the mining contractors' responsibilities and will be executed with the appropriate support equipment.
16.12.7 Mining Personnel Estimate
The maximum mine workforce to be employed is estimated to range in the production phases between 109 and 222 persons for the various stage of the Falchani LoM. The three-crew schedule are planned to work 10h shifts, on a dayshift/nightshift rotation as per the roster detailed previously. Mechanical checks and minor maintenance will use the 2 x 2-hour non-productive shift change times which will also sometimes be used for blasting. Management and technical personnel primarily working dayshift, unless required by operational challenges.
Table 16-16 Table 16-17 Table 16-18 details the preliminary personnel manning structure which will be refined in further study phases based on actual mining contractor budget pricing and or tenders.
Table 16-16 Mining Owners Team Compliment
|
Mining Owner Management
|
Operation Period
|
Year
-1 to 2
|
Year
3 to 34
|
|
General Manager
|
Management
|
1
|
1
|
|
Mine Manager
|
Management
|
1
|
1
|
|
Safety Manager
|
Management
|
1
|
1
|
|
Environmental Manager
|
Management
|
1
|
1
|
|
Security Manager
|
Management
|
1
|
1
|
|
Administrator
|
Management
|
1
|
1
|
|
Mining Owner Management
|
|
6
|
6
|
|
Tech Manager
|
Technical Services
|
1
|
1
|
|
Pit Supervisor
|
Technical Services
|
3
|
3
|
|
Geologist
|
Technical Services
|
2
|
2
|
|
Surveyor
|
Technical Services
|
1
|
1
|
|
Grade Controller
|
Technical Services
|
3
|
3
|
|
Mine Planner
|
Technical Services
|
2
|
2
|
|
Accountant - DS
|
Technical Services
|
2
|
2
|
|
Assistant: Stores & Warehouse
|
Technical Services
|
4
|
4
|
|
Safety Officer
|
Technical Services
|
4
|
4
|
|
General Staff
|
Technical Services
|
10
|
10
|
|
Security
|
Technical Services
|
Outsourced
|
|
|
Mining Owner Tech Servicest
|
|
32
|
32
|
|
Mining Owner Total
|
|
38
|
38
|
Table 16-17 Contractor Mining Team Compliment
|
Mining
Contractor
|
Operation Period
(Years)
|
Year
-1 to 2
|
Year
3 to 6
|
Year
6 to 10
|
Year
11 to 12
|
Year
13 to 20
|
Year
21 to 33
|
|
Job Title
|
Material Movement
|
2 to 3.5 Mt/y
|
4.6 Mt/y
|
5.8 to 6.1 Mt/y
|
7.3 to 8.3 Mt/y
|
14 to 16 Mt/y
|
11 to 12.6 Mt/y
|
|
Contracts Manager
|
Mining Contractor
|
1
|
1
|
1
|
1
|
1
|
1
|
|
Pit Manager
|
Mining Contractor
|
1
|
1
|
1
|
1
|
1
|
1
|
|
Mining
Contractor
|
Operation Period (Years)
|
Year
-1 to 2
|
Year
3 to 6
|
Year
6 to 10
|
Year
11 to 12
|
Year
13 to 20
|
Year
21 to 33
|
|
Pit Superintendents - DS
|
Mining Contractor
|
1
|
1
|
1
|
1
|
1
|
1
|
|
Pit Supervisor
|
Mining Contractor
|
3
|
3
|
3
|
3
|
3
|
3
|
|
Production Foreman
|
Mining Contractor
|
3
|
3
|
3
|
3
|
3
|
3
|
|
Safety / Training Manager
|
Mining Contractor
|
1
|
1
|
1
|
1
|
1
|
1
|
|
Safety Officer
|
Mining Contractor
|
2
|
2
|
2
|
3
|
3
|
3
|
|
Training Officer
|
Mining Contractor
|
3
|
3
|
3
|
3
|
3
|
3
|
|
Miner Blaster
|
Mining Contractor
|
2
|
2
|
2
|
4
|
4
|
4
|
|
Blasting / Grade Assistants
|
Mining Contractor
|
4
|
4
|
4
|
8
|
8
|
8
|
|
Surveyor Assistants
|
Mining Contractor
|
4
|
4
|
4
|
4
|
4
|
4
|
|
Pumping / Cleaning
|
Mining Contractor
|
6
|
6
|
6
|
6
|
6
|
6
|
|
Excavator Operator
|
Mining Contractor
|
0
|
0
|
0
|
3
|
3
|
3
|
|
FEL Operator
|
Mining Contractor
|
3
|
3
|
3
|
3
|
6
|
6
|
|
Truck Operators
|
Mining Contractor
|
18
|
18
|
18
|
39
|
57
|
39
|
|
Drill Operator
|
Mining Contractor
|
3
|
3
|
3
|
6
|
6
|
6
|
|
Dozer Operator
|
Mining Contractor
|
3
|
6
|
9
|
9
|
9
|
9
|
|
Grader Operator
|
Mining Contractor
|
3
|
3
|
6
|
6
|
6
|
6
|
|
Truck W/E Operator
|
Mining Contractor
|
3
|
3
|
6
|
6
|
6
|
6
|
|
Support Operator
|
Mining Contractor
|
4
|
4
|
8
|
8
|
8
|
8
|
|
Relief Operator
|
Mining Contractor
|
3
|
3
|
3
|
5
|
6
|
5
|
|
General Staff
|
Mining Contractor
|
10
|
10
|
10
|
10
|
10
|
10
|
|
|
Total
|
71
|
74
|
87
|
123
|
145
|
126
|
|
Engineering Job
Title
|
Operation Period
(Years)
|
2 to 3.5
Mt/y
|
4.6
Mt/y
|
5.8 to 6.1
Mt/y
|
7.3 to 8.3
Mt/y
|
14 to 16
Mt/y
|
11 to 12.6
Mt/y
|
|
Engineering Planner
|
Mining Contractor Engineering
|
1
|
1
|
1
|
1
|
1
|
1
|
|
Engineering GES
|
Mining Contractor Engineering
|
1
|
1
|
1
|
1
|
1
|
1
|
|
Diesel Mechanic
|
Mining Contractor Engineering
|
7
|
7
|
10
|
11
|
14
|
12
|
|
Electrician
|
Mining Contractor Engineering
|
3
|
4
|
5
|
6
|
7
|
6
|
|
Auto Electrician
|
Mining Contractor Engineering
|
4
|
4
|
6
|
7
|
9
|
8
|
|
Boilermaker
|
Mining Contractor Engineering
|
4
|
4
|
6
|
7
|
9
|
8
|
|
Mining
Contractor
|
Operation Period
(Years)
|
Year
-1 to 2
|
Year
3 to 6
|
Year
6 to 10
|
Year
11 to 12
|
Year
13 to 20
|
Year
21 to 33
|
|
Artisan Assistant
|
Mining Contractor Engineering
|
18
|
19
|
26
|
31
|
37
|
34
|
|
|
Engineering Total
|
38
|
41
|
55
|
65
|
77
|
70
|
|
TOTAL MINING CONTRACTOR STAFF
|
109
|
114
|
142
|
188
|
222
|
196
|
Table 16-18 Total Open Pit Summary Personnel Table
|
Operation Period (Years)
|
Year
-1 to 2
|
Year
3 to 6
|
Year
6 to 10
|
Year
11 to 12
|
Year
13 to 20
|
Year
21 to 33
|
|
Owner Management
|
6
|
6
|
6
|
6
|
6
|
6
|
|
Owner Technical Services
|
32
|
32
|
32
|
32
|
32
|
32
|
|
Contractor Operations
|
71
|
74
|
87
|
123
|
145
|
126
|
|
Engineering
|
38
|
41
|
55
|
65
|
77
|
70
|
|
TOTAL
|
147
|
152
|
180
|
226
|
260
|
234
|
16.13 Contractor Mining Benchmarked Opex
The benchmarked base operation cost of $2.60 was used for the Falchani Project. This results in a range in the production costs between $2.73 and $3.27 for the PEA production schedule. The operating costs are summarized in Table 16-19 and Figure 16-13. Note that a mining height adjustment factor of $0.06 per vertical meter of pit ramp elevation is allowed for.
Table 16-19 Open Pit Summary Personnel Table
|
Contractor - Benchmarked Opex
|
Base Cost
$/t rock
|
LoM Ave Cost
$/t rock
|
|
Fixed Monthly Fee
|
0.50
|
0.50
|
|
Drilling (production, presplit, GC)
|
0.40
|
0.40
|
|
Blasting
|
0.36
|
0.36
|
|
Excavate, Load and Pit Support
|
0.50
|
0.50
|
|
Haulage and Dumping
|
0.76
|
1.12
|
|
Dayworks
|
0.02
|
0.02
|
|
Rehandle and Crusher Feeding
|
0.06
|
0.06
|
|
Mining Contractor
|
2.60
|
2.95
|
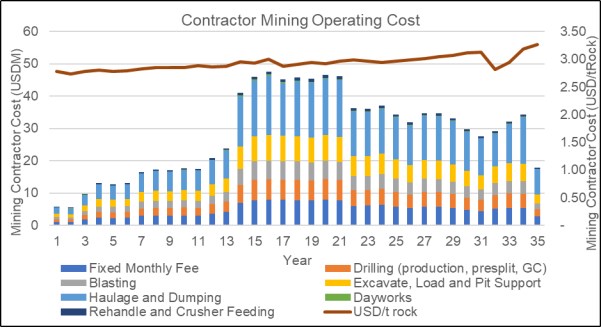
Figure 16-14 Contractor Mining LoM Costs
17 RECOVERY METHODS
17.1 Introduction
The Acid Leach testwork discussed in Section 13 provided the basis and the development of the Base Case block flowsheet shown in Figure 17-1 and the Alternate Case shown in Figure 17-2 and provided key design parameters (Ore requirements, recoveries, reagent consumptions, temperatures) for the process design.
The Project consists of an open pit mine and an associated processing facility along with on-site and off-site infrastructure to support the operation. The design for the process plant is based on achieving a peak milled tonnage of 6 Mt/y over three phases. An overview of the phased production strategy is presented Table 17-1.
Table 17-1 Process Rate and Expansion Phases - Base Case
|
Description
|
Years
|
Milling Rate
|
|
Phase 1 (RoM)
|
1 - 5
|
1.5 Mt/y
|
|
Phase 2 (RoM)
|
6 - 10
|
3.0 Mt/y
|
|
Phase 3 (RoM)
|
11 - 32
|
6.0 Mt/y
|
|
Phase 3 (LG Material)
|
33 - 43
|
6.0 Mt/y
|
A total of 2.6 Mt of LC (minimum purity 99.5%) product is produced over life of mine at a lithium recovery of 80%.
The Falchani Lithium Base Case process plant consists of the following steps:
- Mineralized Material Handling;
- Crushing & Grinding (100/200);
- Acid Leaching (400);
- Pre-neutralisation (500);
- Neutralisation (600);
- Softening (700);
- Evaporation (900);
- Ion Exchange (900);
- Lithium Carbonate Precipitation and Product Handling (900/1000);
- Potassium / Sodium Sulfate Crystallisation (900/1000);
- Dry Stacked Filtered Tailings (1100);
- Services and Utilities.
The Falchani Lithium Alternate Case process plant consists of the following steps (with Area Codes in bold font for the additional plant areas):
- Mineralized Material Handling;
- Crushing & Grinding (100/200);
- Acid Leaching (400);
- Pre-neutralisation (500);
- Neutralisation (600);
- Softening (700);
- Mixed Alum Dissolution (802)
- SOP Neutralization (802)
- SOP Softening (803)
- SOP Evaporation (804)
- 1st SOP Crystallization (805)
- SOP Dissolution (806)
- 2nd SOP Crystallization (807)
- SOP Drying (808)
- Mixed sulfate Crystallization (809)
- Mixed Sulfate Drying (810)
- Evaporation (900);
- Ion Exchange (900);
- Lithium Carbonate Precipitation and Product Handling (900/1000);
- Potassium / Sodium Sulfate Crystallisation (900/1000);
- Dry Stacked Filtered Tailings (1100);
- Services and Utilities.
17.2 Design Criteria
The key Project design criteria are shown in Table 17-2.
Table 17-2 Design Criteria
|
Description
|
Unit
|
Value
|
|
Life of Mine
|
Years
|
43
|
|
Plant Design Throughput (Phase 1 - Year 1 to 5)
|
Tonnes / year
|
1 500 000
|
|
Description
|
Unit
|
Value
|
|
Plant Design Throughput (Phase 2 - Year 6 to 10)
|
Tonnes / year
|
3 000 000
|
|
Plant Design Throughput (Phase 3 - Year 11 to 43)
|
Tonnes / year
|
6 000 000
|
|
Operating Hours Per Year
|
Hours
|
8 000
|
|
Lithium Head grade (Year 1-32)
|
ppm
|
3 380
|
|
Lithium Head grade (Year 33-43)
|
ppm
|
1 841
|
|
Lithium Production (Year 1 - 5 steady state)
|
Tonnes / year
|
23 000
|
|
Lithium Production (Year 6 - 10 steady state)
|
Tonnes / year
|
45 000
|
|
Lithium Production (Year 11 - 32 steady state)
|
Tonnes / year
|
84 000
|
|
Lithium Production (Year 33 - 43 Stockpile)
|
Tonnes / year
|
44 800
|
|
Leach Method
|
|
Acid Leach
|
|
Acid Addition / tonne of mineralized material
|
kg
|
387
|
|
Lithium Recovery - Leach
|
%
|
85
|
|
Lithium Recovery - Overall
|
%
|
80
|
|
Alternate Case (Year 6 - 43)
|
|
|
|
Potassium recovery
|
%
|
20.7
|
|
SOP Produced (Average LoM)
|
Tonnes / year
|
81 556
|
|
Cesium Recovery
|
%
|
74.7
|
|
Cs₂SO₄ Produced (Average LoM)
|
Tonnes / year
|
3 796
|
17.3 Power and Water Consumption
17.3.1 Base Case (Phase 1)
The estimated average running load has been calculated using expected power draw from the equipment and factored (in certain cases) to tonnage throughput. A calculated unit power draw of 76.4 kWh/t mineralized material has been applied. An acid plant co-generation benefit of 18MW has been estimated which realizes a net surplus of power during plant operation and establishes the operation as self-sufficient.
As a contingency, an annual allowance of 5% of normal power consumption (excluding acid plant credit) has been applied to account for the start-up of the sulfur burning plant and this power will be sourced from the grid.
The raw water make-up requirement is 1.92mᵌ/t of feed to the plant. This quantity takes into account the acid plant water requirement and the water recovered from filtering the tailings.
17.3.2 Alternate Case
The additional plant required for the Alternate Case is expected to raise the power draw to 116 kWh/t. The acid plant power generation will not be able to supply sufficient power and power will have to be drawn from the grid.
The raw water make-up requirement with the by-product recovery raises the water demand by 1.14 mᵌ/t to a total of 3.06mᵌ/t of feed to the plant.
17.4 Process Block Flow Sheet & Process Plant Layout
The block flow diagram for the Base Case and the Alternate Case are shown in Figure 17-1 and Figure 17-2. A proposed layout of the of the plant including the Alternate Case, assuming a feed of 1.5m t/y, is shown in Figure 17-3.
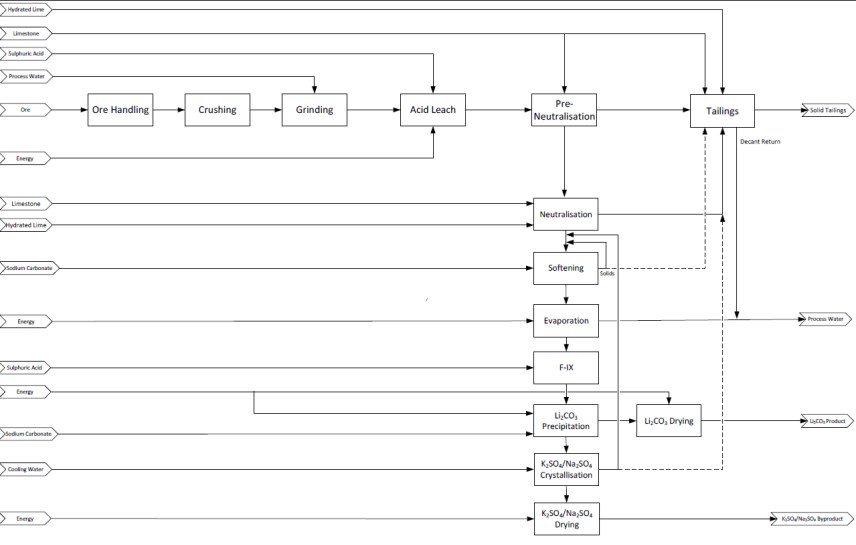
Figure 17-1 Process Block Flow Diagram - Base Case
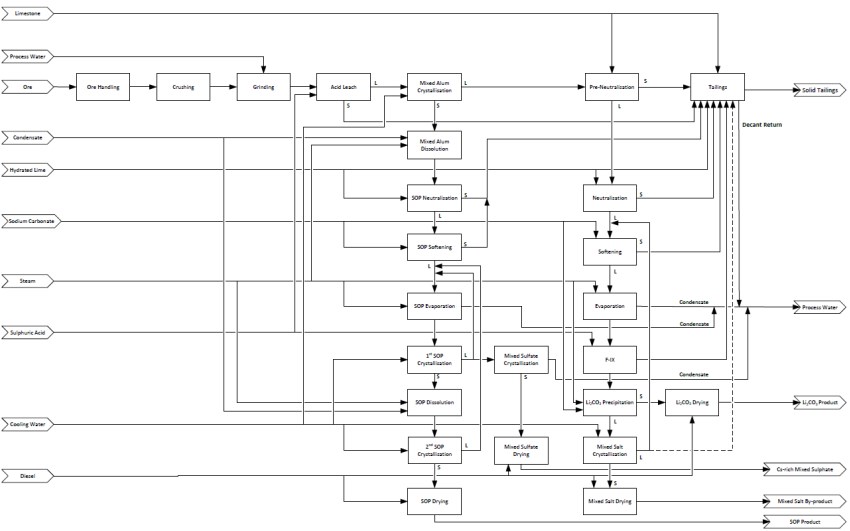
Figure 17-2 Process Block Flow Diagram - Alternate Case
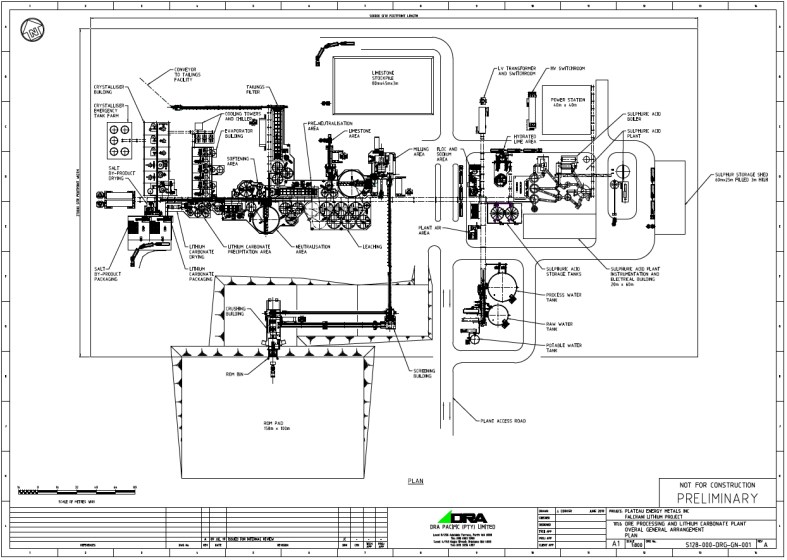
Figure 17-3 Falchani Lithium Overall General Arrangement Plan - Process Plant Phase 1
17.5 Process Description
The work areas described in this section cover both the Base Case and the Alternate Case. Area 800 applies to the Alternate Case and all the other areas are largely common to both the Base Case and the Alternate Case.
17.5.1 Area 100 - Crushing
Mined lithium-bearing tuff mineralized material is stockpiled on the run-of-mine (RoM) pad. The mineralized material is first deposited in the mineralized material feed hopper using a Front End Loader (FEL). From there, the pre-crushed mineralized material passes over a scalping screen where the undersized particles fall through via a chute onto the fresh mineralized material feed conveyor. The scalping screen oversize is fed to the first stage jaw crusher where it is crushed. Both the crushed product and scalping screen undersize is conveyed to the mineralized material feed conveyor where it is combined with the secondary and tertiary cone crusher product to form a vibrating screen feed.
The vibrating screen feed is fed to a double deck screen with the oversize and middling being separately conveyed to the secondary and tertiary cone crusher respectively. Discharge from both the secondary and tertiary crushers reports back to the mineralized material feed conveyor for further screening. The double deck screen undersize falls through a chute and onto the crushed product conveyor where it is conveyed to the crushed mineralized material bin.
17.5.2 Area 200 - Milling
A conveyor feeder at the bottom of the crushed mineralized material bin controls and regulates the flow of mineralized material to the ball mill. With the aid of process water, the crushed mineralized material is ground in the mill. The ball mill slurry discharges into the ball mill cyclone hopper where it is subsequently pumped to the ball mill cyclone. In the ball mill cyclone, the undersize particles exit through the overflow to the acid leach feed tank while the larger, heavier particles exit through the cyclone underflow where it is recycled back to the ball mill feed hopper.
17.5.3 Area 400 - Leaching
The milled slurry is pumped to the acid leach tanks where it is reacted with concentrated sulfuric acid for about 24 hours under atmospheric conditions. During the leach, lithium, among other elements are dissolved in solution. Unleached material remains in the solid phase. The leach slurry is pumped to leach filters to separate the leach liquor from the unleached material. The filtrate containing lithium and other leached metals are collected in a filtrate tank. The filtrate is pumped to feed the mixed alum crystallizer (Area 800). The washate, collected into a washate tank, is pumped into the milling circuit.
17.5.4 Area 500 - Pre-neutralisation
The centrate from the mixed alum centrifuge, from Area 801, is collected in the Alum Centrate Tank. This centrate is depleted in potassium, aluminum, cesium, and rubidium but contains lithium. Centrate from the Alum Centrate Tank is pumped to the pre-neutralisation tank where limestone slurry is added. Transfer of material between the pre-neutralisation tanks is via overflow weirs and launders.
In the pre-neutralisation tank, excess free acid is reacted with the limestone slurry to increase the pH of the slurry from <0 to 4. In doing so, certain salts start to precipitate from solution. The pre-neutralised slurry is then fed onto a pre-neutralisation belt filter to separate the solids from liquids. The lithium bearing filtrate is collected in the pre-neutralisation filtrate tank where it is pumped to the next stage of the process, Impurity Removal.
The precipitated solids undergo a wash using process water to remove any entrained lithium that may still be present. This washate is collected and pumped to the process water tank. The washed solids are repulped with a small amount of process water and pumped to the tailings tank.
17.5.5 Area 600 - Impurity Removal
The pre-neutralized filtrate is then pumped to the first of three Impurity Removal (IR) tanks where slaked lime slurry is added. Transfer of material between each tank is done via overflow weirs and launders. In the tanks, the addition of the slaked lime slurry increases the pH from 4 to about 12. In doing so, more unwanted salts, particularly calcium and aluminum salts start to precipitate out. The IR slurry is then pumped to the IR clarifier where the precipitated salts can settle to the bottom of the clarifier.
The IR clarifier overflow gravity flows into the IR clarifier overflow tank where it is pumped to the next stage of the process, softening.
A portion of the IR clarifier underflow is recycled back to the IR tanks to seed the subsequent precipitation reaction. The remaining underflow solids are pumped to the IR belt filter to separate the solids from liquids. Filtrate obtained from the IR belt filter is pumped back to the neutralisation tanks. The solids undergo a wash with process water to remove any entrained lithium that may still be present. The washate is collected and pumped to the process water tank. The washed solids are repulped with a small amount of process water and pumped to the tailings tank.
17.5.6 Area 700 - Softening
Prior to softening, the IR clarifier overflow is cooled using cooling water. The cooled overflow reports to the first of two softening tanks where it is mixed with sodium carbonate slurry. In the softening tanks, the reaction between the sodium carbonate slurry and the calcium in the solution forms insoluble calcium carbonate precipitates.
The resultant slurry is then pumped to the softening clarifier where the precipitated solids can settle. A portion of the softening clarifier underflow is recycled and pumped back to the first softening tank to act as a seed for the formation of further precipitates. The remaining underflow solids are pumped to the tailings tank.
The softening clarifier overflow gravity flows into the softening clarifier overflow tank where it is subsequently pumped to the next step of the process, Fluoride Ion Exchange.
17.5.7 Area 800 - SulfateSulfate of Potash Separation
17.5.7.1 Area 801 Mixed Alum Crystallisation
Filtrate from the leach filter, collected into the Mixed Alum Crystalliser Feed Tank, will be fed into the Mixed Alum Crystallizer. In this crystallizer, potassium, cesium, and rubidium crystallize as alum. The slurry from the mixed alum crystallizer is pumped out of the crystallizer into a centrifuge to separate mixed alum crystals from the alum barren liquor. The centrate, collected into a centrate tank, is pumped to Area 500, the pre-neutralisation area. The alum crystals report to the mixed alum dissolution tank.
17.5.7.2 Area 802 Mixed Alum Dissolution & K2SO4 Neutralisation
Crystallised mixed alum is dissolved in an agitated tank with condensate to a target potassium concentration. Steam is also added to target temperature. The dissolved alum is pumped into the Dissolved Alum Storage Tank for storage and buffer.
The dissolved alum from the storage tank is pumped into a series of two SOP neutralisation tanks where slaked lime slurry is added to adjust the pH to 10. At this pH, aluminum together with any iron present is removed from the solution as a precipitate. Slurry is transferred by gravity between tanks through an overflow piping. Slurry overflows from the final neutralisation tank into the agitated Neutralisation Filter Feed Tank. Neutralised slurry from the Neutralisation Filter Feed Tank is pumped into a filter to separate the potassium pregnant liquor from the solids. The filtrate is collected in a filtrate tank and the washed cake is sent to the tailings tank.
17.5.7.3 Area 803 K2SO4 Softening
The potassium pregnant liquor from the filtrate tank is pumped into a series of two softening tanks where sodium carbonate is added to remove calcium. The reaction between sodium carbonate and calcium sulfate causes the latter to precipitate as calcium carbonate. Slurry overflows into the Softening Filter Feed Tank from the final softening tank. Softened slurry is pumped from the filter feed tank into a filter to separate the softened potassium pregnant liquor from the solids . The filtrate is collected in the SOP Evaporator Feed Tank while the cake from the filter is sent to the tailings tank.
17.5.7.4 Area 804 SOP Evaporator
Calcium-free potassium pregnant liquor from the potassium sulfate softening stage and centrate from 1st and 2nd stage SOP crystallization are fed into the evaporator. The evaporator removes excess water thereby increasing the concentration of potassium sulfate for crystallisation. The resulting potassium concentrated liquor is pumped into the 1st SOP Crystallizer Feed Tank.
17.5.7.5 Area 805 1st Stage SOP Crystallizer
Concentrated liquor from the evaporator stored in the 1st SOP Crystallizer Feed Tank is pumped into the 1st Stage SOP Crystalliser where potassium sulfate is selectively crystallized as sulfate of potash (SOP). Crystallisation is due to the supersaturation of potassium sulfate within the crystallizer. The resulting slurry is pumped into a centrifuge to separate the liquor from the SOP crystals. The centrate, collected in the 1st SOP Centrate Tank, is pumped back into the SOP evaporator feed to recover remaining potassium sulfate. A portion of the centrate is sent to the mixed sulfate crystallisation to prevent accumulation of impurities and to recover cesium. The SOP cake is fed to the SOP dissolution section.
17.5.7.6 Area 806 SOP Dissolution
Crystallized potassium sulfate or SOP is dissolved using condensate and steam in an agitated SOP dissolution tank. The re-dissolved potassium sulfate from the SOP dissolution tank is pumped to the 2nd Stage SOP Crystallizer Feed Tank.
17.5.7.7 Area 807 2nd Stage SOP Crystallizer
Re-dissolved SOP stored in the 2nd stage SOP Crystallizer Feed Tank is fed into the 2nd stage SOP Crystallizer to re-crystallise potassium sulfate. This process produces higher purity sulfate of potash as compared from the 1st stage. The slurry is then pumped to a centrifuge to separate the crystallized SOP from the liquor. The centrate, collected into the centrate tank, is pumped to the SOP evaporator feed tank for recovery of remaining potassium sulfate in the liquor. The SOP cake is conveyed for drying and packaging.
17.5.7.8 Area 808 SOP Drying and Packaging
Wet SOP cake from the 2nd Stage SOP Centrifuge is conveyed using a screw conveyor into the SOP Dryer Feed Bin. From the SOP Dryer Feed Bin, SOP will be discharged into a screw feeder to feed the SOP Dryer. Dryer removes excess moisture from the cake to 1% w/w. The dried SOP product is conveyed into the SOP product bin. From the SOP bin, SOP product is discharged, packed in 1-ton bulk bags, and stored ready for sale.
17.5.7.9 Area 809 Mixed Sulfate Crystallizer
Liquor from the mixed sulfate crystallizer feed tank is fed into a zero liquid discharge (ZLD) mixed sulfate crystallizer to crystallise cesium-rich mixed sulfate together with potassium and rubidium. The wet cake from the crystalliser is conveyed for drying and packaging.
17.5.7.10 Area 809 Mixed Sulfate Drying and Packaging
Wet cesium-rich mixed sulfate is fed to a dryer to remove excess moisture from the cake to 1 %w/w. Dried cesium-rich mixed sulfate is then discharged into the Mixed Sulfate Bin for packaging. From the bin, dried mixed sulfate is discharged, packed in 1-ton bulk bags, and stored ready for sale.
17.5.8 Area 900 - Fluoride Ion Exchange and Product Precipitation
Water is boiled off from the softening clarifier overflow using an evaporator to not only reduce the volume of the solution, but to also increase the lithium concentration. Following evaporation, the solution is pumped to an ion exchange circuit in a lead-lag-lag configuration where trace fluoride impurities are removed using a La-loaded amino phosphonic resin (TP-260). The purified eluate solution is pumped to the next step in the process, Product Precipitation. The eluate is pumped to the first of three lithium carbonate precipitation tanks where it is reacted with sodium carbonate slurry to form insoluble lithium carbonate solid.
The resultant slurry is then dewatered using a dewatering cyclone followed by a centrifuge. The cyclone overflow and centrifuge centrate report to the salt crystalliser feed tank. A portion of the centrifuge cake is repulped using the feed solution and recycled back to the lithium carbonate precipitation tanks to be used as seed for the reaction. The remaining portion of the lithium carbonate cake reports to the lithium carbonate dryer feed bin.
The lithium free solution in the salt crystalliser feed tank is fed to the salt crystalliser where it is cooled using a combination of cooling and chilled water. As the solution cools, potassium sulfate and sodium sulfate precipitate from the solution.
The potassium and sodium sulfate slurry is fed to the salt clarifier where it is allowed to settle. The salt clarifier underflow is pumped to a belt filter to separate the solids and liquids. The filtrate is collected in the barren solution tank while the washate is collected and recycled back to the evaporator circuit. The washed salt is conveyed to the salt dryer feed bin.
The clarifier overflow flows via gravity to the barren solution tank where a portion of it is pumped to the tailings tank. The remainder is recycled back to the softening circuit.
17.5.9 Area 1000 - Product Drying and Packaging
Wet lithium carbonate centrifuge cake is stored in the lithium carbonate dryer feed bin. From the feed bin, a dryer screw feeder controls and regulates the feed rate into the lithium carbonate dryer. In the lithium carbonate dryer, moisture is removed from the cake. The lithium carbonate dryer product discharges on to the lithium carbonate product conveyor where it is then conveyed to an air classifier. The underflow from the air classifier is compacted in a compactor prior to being micronized in a mill to the required product size. The mill discharge is combined with the air classifier overflow and fed to the bagging plant. The dried product is then bagged in 1 t bulk bags and stored, ready for sale.
Like the lithium carbonate centrifuge cake, the salt cake is stored in the salt dryer feed bin. A screw feeder controls the feed rate of salt from the dryer feed bin to the salt dryer. In the salt dryer, most moisture is removed. The salt dryer product discharges onto the salt conveyor where it is then conveyed onto a stockpile.
17.5.10 Area 1100 - Tailings
Waste slurry from the neutralisation, pre-neutralisation, and softening circuits along with the barren solution bleed report to the first of two tailings neutralisation tanks where both limestone and slaked lime slurry are added to neutralize any remaining acid.
Once the tailings have been neutralized, the slurry is then pumped to the tailings filter to be dewatered. The filtrate and washate from the tailings filter are collected and pumped to the process water tank. The dewatered tailings solid is then conveyed away and deposited onto the tailings stockpile.
17.5.11 Reagents
Sulfur
Pelletized sulfur will be delivered to site in bulk and stored in the sulfur storage shed. A front-end loader will be used to fill the sulfuric acid plant's feed hopper. The solid sulfur will then be converted to sulfuric acid in a double absorption sulfuric acid plant.
The ~98% sulfuric acid produced by the sulfuric acid plant is then pumped and stored in one of two sulfuric acid storage tanks. The storage tanks will hold a minimum of 1,700t of sulfuric acid, the quantity required to start the sulfuric acid plant. As required, the concentrated sulfuric acid will be pumped to the processing plant in a duty/standby configuration.
Sodium Carbonate
Solid sodium carbonate salt will be delivered to site in 1 t bulk bags. Each sodium carbonate bag will then be added to a mixing tank where it will be mixed with water to form a 20% sodium carbonate solution.
Once homogeneously mixed, the 20% sodium carbonate solution is transferred via a pump and stored in the sodium carbonate storage tank. Two sodium carbonate distribution pumps in a duty/standby configuration will continuously pump the slurry through a ring main. As required, actuated valves will control the flow of the sodium carbonate to both the softening and lithium carbonate precipitation circuit.
Limestone
Limestone rock will be delivered to site in trucks and stored on a concrete pad. A front-end loader will be used to fill the limestone feed bin from the limestone stockpile. A feeder at the bottom of the feed bin will control the feed rate of limestone into the dry limestone grinding mill. Once finely ground, the limestone powder is stored in a closed-top limestone storage bin. A screw feeder at the bottom of the storage bin directly feeds the limestone powder to the pre-neutralisation tank.
Quicklime
Quicklime powder will be delivered to site in bulk tankers. Once on site, the quicklime will be pneumatically pumped and stored in the quicklime silo. A feeder at the bottom of the silo controls the feed to the lime slaking mill.
Water is added to quicklime in the lime slaking mill. The quicklime and water react and form a 16% slaked lime slurry. The slaked lime is then pumped and stored in the slaked lime storage tank. Two slaked lime distribution pumps in a duty/standby configuration will continuously pump the slaked lime slurry through a ring main. As required, actuated valves will control the flow of slaked lime to both the neutralisation and tailings circuit.
18 PROJECT INFRASTRUCTURE
18.1 Introduction
The MPA is located approximately 650km east south-east of Lima and about 220km by road from Juliaca to the south. The nearest towns to the MPA are Macusani (25km to the south-east) and Corani (14km to the north-west).
The Interoceanica Highway (IH) is a system of tarred/sealed roads that link the ports of Materani, Molendo and Ilo on the west coast of Peru over the Andes Mountains to the west side of Brazil. The IH passes within 10km to 15km to the east of the MPA. Two unpaved roads connect the Project to the IH and other unpaved roads, generally in good condition, connect the various sites within the MPA to one another. These roads are accessible during the dry season in two-wheel drive vehicles.
The closest airport to the MPA is located at Juliaca. The facility is in good condition and services daily flights from Lima and Cusco.
For the purposes of the PEA, the following infrastructure has been considered necessary for the Falchani site.
- Access road;
- Raw water supply;
- Power transmission line and sub-stations;
- Emergency power;
- General site services;
- Buildings;
- Tailings transportation and storage.
18.2 Access Roads
The existing connecting road between the highway and the Project site is not suitable for heavy vehicle transit. A significant upgrade would be necessary to comply with safety regulations in addition to addressing potential social conflict associated with noise and dust generation. Vice Versa Consulting1 , a third-party consulting firm, have conducted a study on assessing alternative access route options with consideration to safety, social, environmental and economic metrics. A total of three options were considered and are described below:
1 Acceso al Proyecto Falchani, Nov 2019
- Option 1: Starts at the diversion that is currently used to access the area of Project. This alternative takes advantage of the existing section of access to the town of Tantamaco, Isivilla and the accesses built for the communities of Quelccaya and Chaccaconiza.
- Option 2: Starts at the Huiquiza bridge. This alternative starts with an indirect routing to get near the town of Tantamaco.
- Option 3: Starts at the Huiquiza bridge. This alternative starts with a section of a straight tunnel with a route to the town of Tantamaco.
A qualitative analysis was conducted to determine a viable alternative access road solution. The outcomes of the analysis are presented in Table 18-1. The assessment utilizes a three-tier ranking system relative to the options considered. A green, orange or red rating has been allocated to each assessed category indicative of low risk, moderate risk and high risk.
Table 18-1 Access Roads Analysis - Outcomes
|
Option
|
Social
|
Environmental
|
Technical
|
Economic
|
Overall
|
Capital
|
|
1
|

|

|
|
|

|
$ 35m
|
|
2
|
|
|
|
|
|
$ 38m
|
|
3
|
|
|
|
|
|
$ 77m
|
Vice Versa Consulting identified Option 3 as the most viable alternative realizing the least social and environmental impact while demanding a higher capital outlay relative to Option 1 and 2. Option 1 was selected and modelled to assess the potential economic upside if social and technical challenges can be mitigated. A review and validation of this selection would be necessary as part of a follow-on study.
The map in Figure 18-1 shows the proposed route of the paved access road from the IH to site.
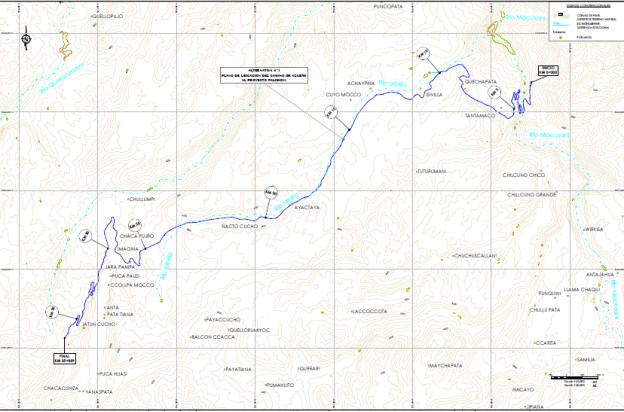
Figure 18-1 Proposed Route of Access Road from Interoceanica Highway to Site (Option 1)
18.3 Raw Water Supply
Water is sourced from local river courses. In its 2014 Preliminary Economic Assessment (PEA) for Plateau Energy Metals' uranium projects, GBM Mining Engineering Consultants Limited (GBM) was of the view that the area has access to sufficient water resources for the purposes of mining operations at a rate of 1Mt/y (Short et al, 2014). The availability of water has not been assessed during the PEA and it is recommended that the availability of suitable water be quantified in later stages of the Project's development.
River water will be pumped to the Raw Water Tank in the plant from the river located in the valley close to the plant. The cost of a suitably sized pump station and pipeline is included in the cost estimate.
18.4 Power Supply
18.4.1 Acid Plant Power Generation
Under normal operation, the plant's primary source of electrical power will be the steam turbine power generator at the acid plant.
The San Gaban II hydro generation station is approximately 40 kms (88 kilometers via the IH) to the north of the MPA and high voltage power lines run adjacent to the MPA. In order for a grid connection to be made an extension of the power line will be required to reach the project site and any connection will be subject to negotiation with the supply authority. An allowance has been made in the capital cost estimate for a transformer at the San Gaban powerline and one at the process plant switchyard. The cost of the powerline is assumed to be included in the tariff structure that the service provider will charge the Project.
18.4.2 Emergency Power
The grid will provide back-up power for emergency lighting and for key process drives (for example, leach tank agitators, scrubber fans, thickener rakes). These matters will need to be taken into account as the project progresses. Connection to the grid will enable surplus electricity from the acid plant power station to be exported.
18.4.3 Diesel Generators
Diesel-fuelled generators will provide power for remotely located equipment (the raw water pumps at the river and equipment located at the TSF.
18.5 Site Services
18.5.1 Fuel Supply, Storage and Distribution
Fuel will be delivered to site in road tankers and stored in a dedicated storage and dispensing facility.
18.5.2 Compressed Air
Compressors will provide compressed and instrument air to the process plant.
18.5.3 Potable Water
A suitable potable water plant will be provided to supply water to the plant and employee housing.
18.6 Buildings
18.6.1 Workshops and Warehouses
Suitably sized workshops and warehouses are included in the plant area.
18.6.2 Office Facilities
An allowance for offices and office equipment is included in the capital cost estimate.
18.6.3 Employee Housing
An allowance for a 300-person permanent village is included in the capital cost estimate.
18.7 Tailings Transport and Storage
Tailings from the plant will be pumped to a belt filter adjacent to the TSF. The filtered tailings will be stacked in the TSF and the filtrate will be pumped back to the process water tank in the plant. Vice Versa Consulting2 have identified a number of suitable locations for the TSF that will be utilised throughout the life of the Project.
2 Report: Determinación de los Costos de Inversión para la Construcción de un Depósito de Relaves, PE-ING-005-2019-VC
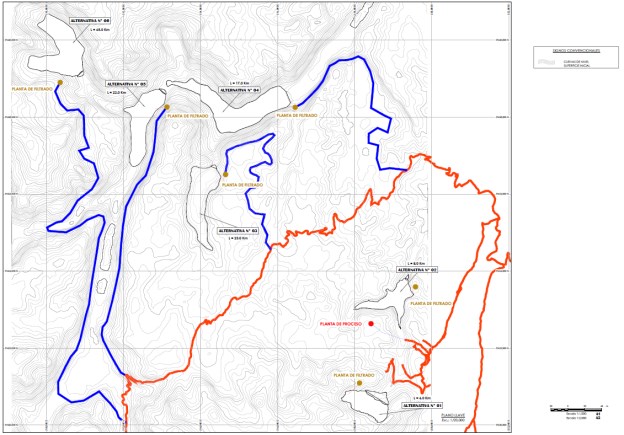
Figure 18-2 Tailings Storage Facility Options (Source: Vice Versa Consulting)
The evaluation included consideration to capacity, geotechnical, economic, environmental and legal requirements. A total of six sites were proposed and evaluated on a capital outlay, operating cost and NPV basis. Capital outlay was based on transportation of slurry to the TSF, TSF construction, water reticulation systems and supporting infrastructure. The cost of a tailings thickening and filtration plant prior to deposition and local to the TSF, is excluded and has been captured under the process plant capital. An overview of capital cost estimates for each option is shown in Figure 18-3.
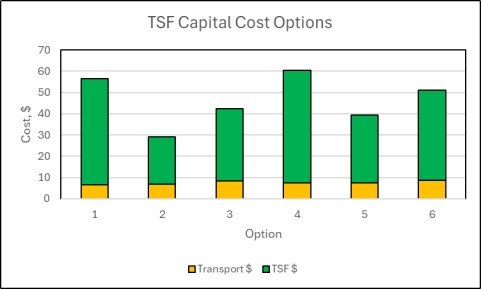
Figure 18-3 TSF Capital Cost Options
A semi-qualitative analysis was conducted to determine an economically viable and practical TSF configuration over LoM. Consideration to social, environmental, technical and economic factors were considered and used to determine a ranking for each option. The outcome of this analysis revealed option 2 as a viable location for the initial phase of the Project. The installed cost for this option amounts to $ 29m. Both the Base Case and Alternate Case utilize Option 2, Option 1 and Option 4 over LoM based on capacity requirements.
19 MARKET STUDIES AND CONTRACTS
19.1 Market Studies
The Falchani Project is not currently in production and has no operational sales contracts in place. To evaluate the market for its lithium product, ALC subscribed to the Lithium Forecast Service of Benchmark Mineral Intelligence. Benchmark Mineral Intelligence, Lithium Forecast, Q4 2023 describes the lithium supply chain, long-term supply forecasts for lithium to 2040 and long-term supply cost curves for lithium to 2040. Forecast prices for the same period for battery grade LC and lithium hydroxide are also provided, and these have formed the basis for the economic analysis undertaken for the PEA Update. The figures contained in this section use data provided by Benchmark Mineral Intelligence.
19.2 Lithium Demand Outlook
The battery sector is the key driver for the growth in lithium demand and this itself is driven primarily by environmental legislation, upheld by government strategies that provide financial incentives to mine developers, producers and end users of battery products.
Prior to the relatively recent uptake in electric vehicles (EV), the bulk of global lithium supply was consumed in industrial applications unrelated to the battery sector. As recently as 2015, more than two thirds of lithium demand came from an assorted group of end uses, including glass, ceramics and lubricants. By contrast, in 2023 88% of lithium demand, just under 800 Kt/y LC, is estimated to come from the battery sector (EVs, portable electronics and stationary storage) and these values are forecast to increase to 95% and over 3.5 Mt/y LC respectively by 2040. Within the battery sector itself, driven by increases in the EV adoption rate, NCM and LFP lithium-ion batteries have been the fastest growing contributor to the increase in demand in recent years and together are forecast to maintain a market share of approximately >90% to 2032.
Looking ahead, Benchmark Mineral Intelligence forecasts EV demand will increase by a CAGR of >15% over the next decade.
Figure 19-1 to Figure 19-3 show overall lithium demand by end use, lithium battery demand by cathode chemistry and end use and the global EV penetration rate.
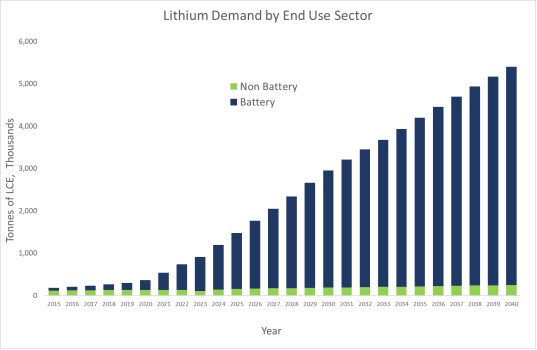
Figure 19-1 Lithium Demand By Sector [Source: Benchmark Mineral Intelligence, Lithium Forecast, Q4 2023]
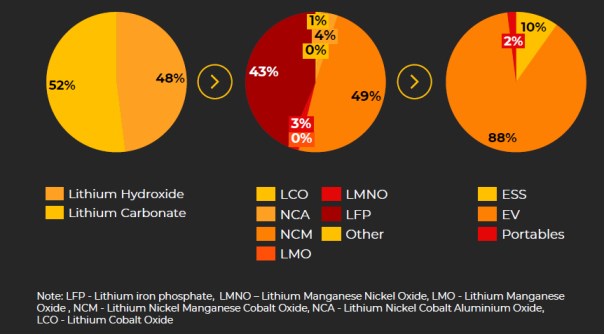
Figure 19-2 Lithium Battery Demand Breakdown by Cathode Chemistry and End Source, 2033 [Source Benchmark Mineral Intelligence, Lithium Forecast, Q4 2023]
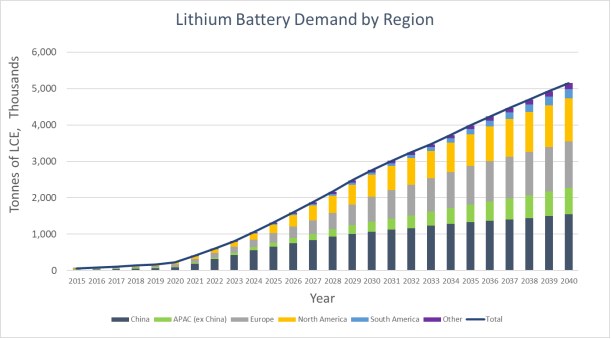
Figure 19-3 Lithium Battery Demand Breakdown by Region [Source Benchmark Mineral Intelligence, Lithium Forecast, Q4 2023 ]
It is noted that battery demand in North America is forecast to increase from ~170 kt/y LC in 2024 to >1 Mt/y LC in 2040.
19.3 Lithium Supply Outlook
At any time, there are several brownfield and greenfield lithium capacity projects announced and undergoing development. Some of that number will either never come to fruition and some will proceed at a faster or slower pace than projected.
Benchmark Mineral Intelligence designates greenfields projects as either 'Highly probable', 'Probable' or 'Possible', based on the criteria below. This is a subjective analysis that aims to identify the relative strengths of each project at a given time, with factors subject to change.
Highly probable: a project that has completed necessary public market requirements and government approvals, is fully funded and expected to place their product in the market in the next 24 months.
Probable: a project that has secured a significant proportion of its funding, and completed certain feasibility milestones that would support production within the next 5 years.
Possible: a project in the earlier stages of development with only a small portion of financing secured.
The following chart details the lithium supply forecast to 2040 for operating plants, greenfields projects and secondary (recycling) sources.
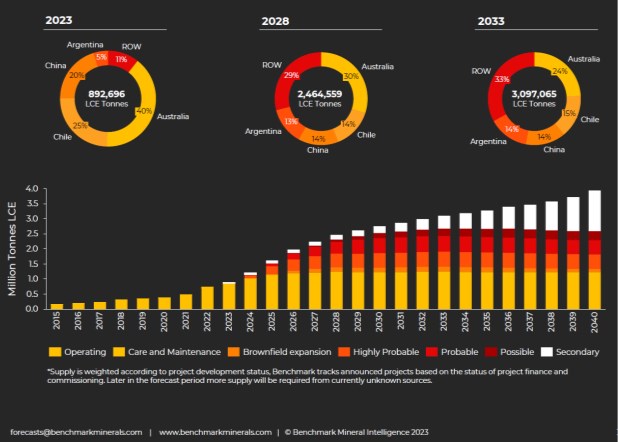
Figure 19-4 Lithium Supply Forecast to 2040 [Source: Benchmark Mineral Intelligence, Lithium Forecast, Q4 2023]
A key source of future supply will come from recycling of end-of-life batteries. The chart that follows illustrates Benchmark Mineral Intelligence's expectations for this supply. Feedstock for recycling will be predominantly composed of process scrap from gigafactories until the mid-2030s, at which point batteries reaching end-of-life will return to the market for recycling as a meaningful source of supply. At present, it is mostly the economics of recovering nickel and cobalt that drives recycling. This is due to the higher success rates of recovering these materials from end-of-life batteries and process scrap. However, increasingly, recyclers are reporting higher recovery rates of lithium via newer hydrometallurgical processes. Lithium available via secondary supplies is forecast to increase across the coming years and decades, in line with the growth of recyclable material. The forecast for the next decade is that lithium supply from recycling will increase from 5% to 14% by 2033.
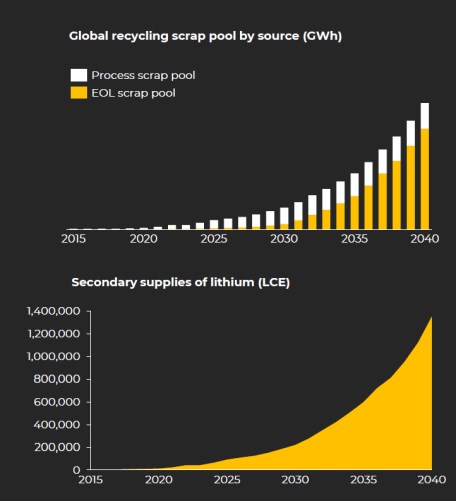
Figure 19-5 Recycled Lithium Supply Forecast, tonnes LC [Source: Benchmark Mineral Intelligence, Lithium Forecast, Q4 2023 ]
19.4 Lithium Supply Demand Balance Forecast
Figure 19-6 outlines Benchmark Mineral Intelligence's supply/demand forecast based on their analysis and assumptions for market demand. In recent years relatively high prices for lithium, coupled with increased awareness of the prospects for lithium-ion battery technology has led to increased investment activity in new lithium supply. Notwithstanding this investment, a significant deficit in supply is forecast from 2028.
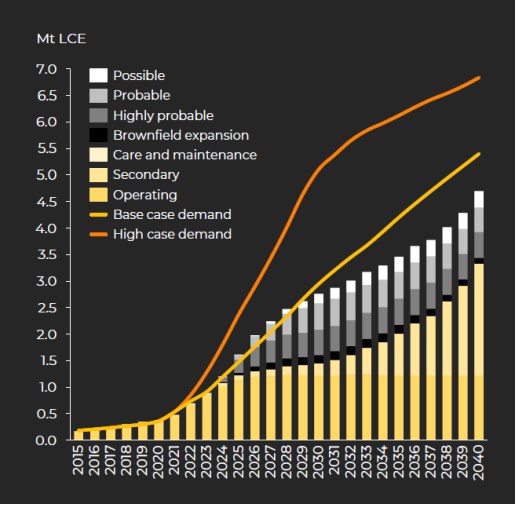
Figure 19-6 Long-Term Supply Forecast [Source: Benchmark Mineral Intelligence, Lithium Forecast, Q4 2023 ]
19.5 Lithium Chemical and Battery Cathode Demand and Capacity Outlook
Figure 19-7 and Figure 19-8 present the outlook for lithium supply and demand by chemical product. As has been discussed previously, most future demand growth will be for EV batteries. As the market for EVs expands and the balance of chemistry shifts towards high-nickel cathodes, cathode manufacturers will increasingly move towards the use of lithium hydroxide. This preference for lithium hydroxide for the manufacture of nickel-rich cathodes results from the faster degradation of hydroxide versus carbonate in the cathode manufacturing process, which requires less energy and is therefore more cost efficient.
Lithium hydroxide also allows for improved material crystallinity, greater structural purity and less mixing of lithium and nickel in the lithium layer relative to LC. When using lithium hydroxide, lithium content is incorporated within the structure of the NCM hydroxide, while use of LC results in excess free lithium, leading to an increase in material pH that can cause gelling of the cathode slurry and swelling of the cell upon cycling. For these reasons it is forecast that lithium hydroxide will contribute a greater portion of the lithium chemical deficit.
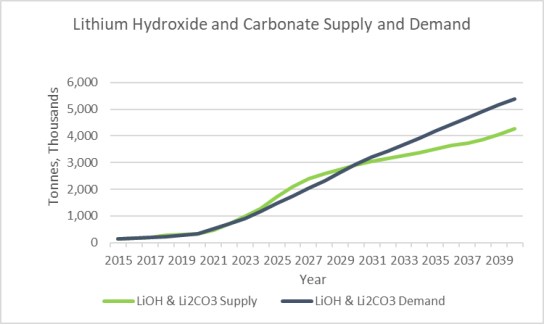
Figure 19-7 Lithium Supply & Demand by Chemical Product [Source: Benchmark Mineral Intelligence, Lithium Forecast, Q4 2023]
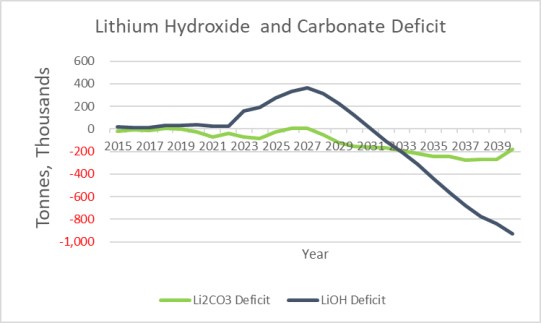
Figure 19-8 Forecast Lithium Chemical Deficit, 2015-2040 [Source: Benchmark Mineral Intelligence, Lithium Forecast, Q4 2023]
As discussed earlier, the lithium market is forecast to go into deficit in 2028 and there is a pronounced risk of a continued deficit in cathode supply in the years thereafter. With China heavily dominant in cathode manufacture, other cell manufacturers, as well as OEMs, are locating new capacity in regions closer to consumption, namely Europe and North America, and this will benefit raw materials projects that are well located to serve these geographies, including Falchani.
19.6 Long-term Supply Cost Curves for Lithium to 2035
Benchmark Mineral Intelligence use a bottom-up cost modelling analysis to reach their industry costs for lithium, and cross-references these with top-down down information sources, including company financial reports and primary research utilising their network of industry contacts and mining and chemical processing engineers. The data is presented as C1 and C3 cost data.
The C1 costs include:
- Mining, processing, reagents, transport, loading & storage, G&A, energy, labor, maintenance and other costs where relevant.
- For non-intergated hard-rock operations, the costs of feedstock to lithium carbonate is included.
- Excludes by-product creditd, extraordinary items, royalties and interest costs.
C2 costs are C1 costs plus depreciation.
C3 costs include C1, C2 costs plus royalties, interest costs and extraordinary items.
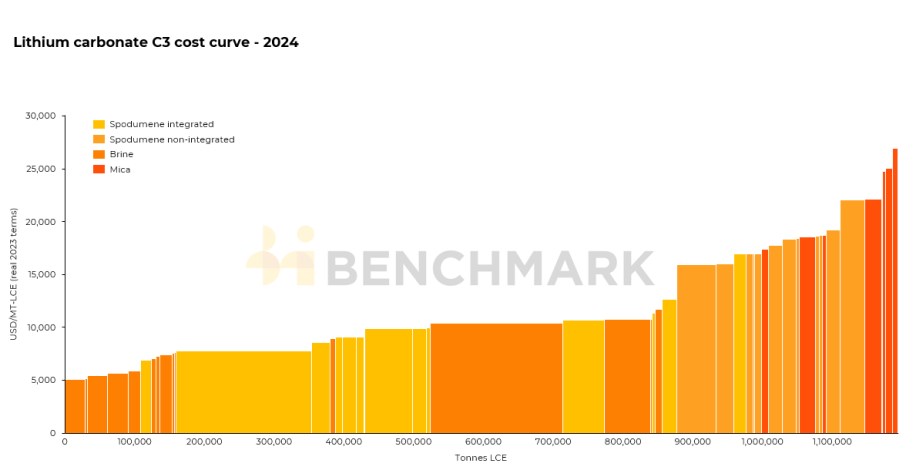
Figure 19-9 C3 Supply Cost for Lithium Carbonate - 2022 [Source: Benchmark Mineral Intelligence, Lithium Forecast, Q4 2023]
19.7 Lithium Price Forecast
Benchmark Mineral Intelligence's forecast is shown in Figure 19-10 In the short-term, market sentiment and supply-demand fundamentals suggest that lithium prices will remain relatively low throughout 2024 and 2025.
Bearish sentiment is expected to reduce over the medium-term as expectations of an emerging deficit in the late 2020s becomes apparent. This is forecast to lead to a gradual rise in prices from 2025 which will eventually peak late in the decade as supply falls short of demand.
From this point, new supply is expected to come into production and bridge the supply gap, which will lead to prices retreating to the long-term incentive price. This new capacity is not yet included in the supply forecast figures as it is currently too early stage to quantify. Increasingly bullish sentiment and rising prices are expected to incentivise this capacity to come online.
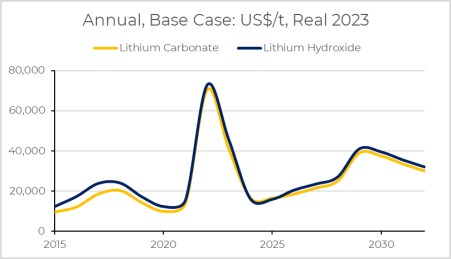
Figure 19-10 Lithium Carbonate Price Forecast [Source: Benchmark Mineral Intelligence, Lithium Forecast, Q4 2023]
19.8 By-Product Pricing
An opportunity exists for the Falchani project to become a significant supplier of potassium sulfate (SOP) as a fertilizer for the local Peruvian market. ALC has advised DRA to use a value of $1,000/t of SOP for the financial modelling of the Alternate Case. No contracts have been entered into so pricing and market size should be considered prospective at this stage.
The potential exists to produce a by-product stream containing cesium sulfate. Cesium is used in high-pressure, high-temperature offshore oil and gas drilling and is used in infrared detectors, optics, photoelectrical cells, scintillation counters and spectrometers. Isotopes of cesium are atomic clocks necessary for aircraft guidance systems, global positioning satellites, and internet and cell phone applications. Cesium sulfate produced at Falchani can be further refined by third parties into desired end-products. ALC has advised DRA to use a value of $58 000/t of Cesium sulfate for the financial modelling of the Alternate Case. No contracts have been entered into so pricing and market size should be considered prospective at this stage.
19.9 Conclusions
There is an ongoing need for capacity investments in lithium raw material extraction, chemical processing and cathode manufacturing throughout the life of the Benchmark Mineral Intelligence forecast to 2040. Given the direction of travel and level of investment in the downstream of the electric vehicle supply chain, at an automobile manufacture and battery cell level, there is an impending shortfall in all areas of the upstream supply chain which needs to be addressed.
The level of financing needed to bridge this gap is relatively small compared to the investment being made in vehicle and battery cell manufacturing, so it is highly likely that actors in these areas of the supply chain will take steps to ensure supply availability, as has started to happen already.
The forecast market deficit will incentivise investment in both raw material and chemical processing capacity. Benchmark Mineral Intelligence's long-term price forecast for LC and LH which reflects an incentive price methodology, places long term prices at approximately $ 29 000/t for LC and $31 000/t for LH.
Lithium raw material projects in stable jurisdictions close to areas of future high demand, namely Europe and North America, are at a distinct advantage in terms of potential for development.
Battery cell manufacturers are planning capacity investments closer to where their key customers, automotive manufacturers, are located, and will wish to source at least part of their supply from regional sources to cut down on lead times, freight costs and default risks.
The outlook for the battery cathode chemistry mix indicates a move towards high-nickel NCM technologies, which favours the use of lithium hydroxide in the production of these cathodes.
20 ENVIRONMENTAL STUDIES, PERMITTING & SOCIAL OR COMMUNITY
20.1 Introduction
Detailed environmental permitting and social impact considerations are not within the scope of a PEA but follow in later stages of a project's development. The following section provides an overview of the environmental requirements and the legislation that may apply to the project depending on the level of its assessed environmental impact.
20.2 Project Permitting Requirements3 4 5
Peru has many environmental laws and regulations that apply to resources sector. These are arranged in a general framework of laws, legislative decrees, supreme decrees, legislative resolutions, ministerial resolutions and decisions. Key among these are: the General Environmental Law (28611-2005) (GEL); the Environmental Impact Assessment (EIA) Law (27446-2001); the Environmental Impact Assessment Regulation (Supreme Decree 019-2009); the Environmental Regulation on Exploration Activities (020-2008-EM) (EREA); the Environmental Regulation for mining exploration activities (020-2008-EM); and the Regulations on the Protection and Environmental Management for exploitation, operation, general labor, transportation and storage (040-2014-EM). The competent environmental authority for the approval of the environmental certificate will be determined by the level of environmental impacts that the activity could generate. Depending on the environmental impacts, the competent authorities are the following: The National Environmental Certification Service for Sustainable Investments (Servicio Nacional de Certificación Ambiental para las Inversiones Sostenibles, SENACE) of the Ministry of the Environment (Ministerio del Ambiente, MINAM) which approves the Detail Environmental Impact Assessment (EIA-d); The Ministry of Energy and Mines which approves the Semi-detail Environmental Impact Assessment (EIA-sd); and, The Regional Government which approves the Environmental Impact Statement (DIA). For mining and mineral exploration, the relevant authority is the Ministry of Energy and Mines (Ministerio de Energía y Minas (MINEM)) through the General Directorate of Mining Environmental Affairs (Dirección General de Asuntos Ambientales Mineros (DGAAM)), Supervisory Agency for Investment in Energy and Mining (Organismo Supervisor de la Inversión en Energía y Minas, OSINERGMIN) and the Environmental Assessment & Control Agency (Organismo de Evaluación y Fiscalización Ambiental, OEFA) are the entities in charge of supervising the development of energy and mining activities. MINEM has monitoring and sanctioning powers over mining activities regarding technical matters whilst OEFA has the same powers regarding the supervision of environmental matters. MINEM plays a major role in the policy making of the energy and mining sector; along with other authorities it also leads the environmental certificate approval procedure. In addition, specific regulations have been approved regarding EIA procedures, comprehensive procedures for citizen participation, and detailed regulations for closure certifications.
3 Environmental Legislation Handbook (Manual de Legislación Ambiental) http://www.legislacionambientalspda.org.pe/. Website accessed 4 March 2020.
4 Environmental Overview Commentary, https://minehutte.com/jurisdiction/peru/ Website accessed 4 March 2020.
5 Ministry of Environment, https://www.gob.pe/minam#normas-legales Website accessed 4 March 2020.
Prior to commencing mine development and operation, Peruvian Environmental Regulations require an EIA-d to be carried out. The EIA-d must be approved by SENACE before mining activities may commence. The environmental impact assessment has to comply with the requirements set out in the Ministerial Resolution N° 092-2014-MEM-DM and Supreme Decree N° 005-2016-MINAM, which includes a very detailed description of all aspects of the project that should be considered to ensure that the environment is adequately protected. This includes a public consultation process involving all interested and affected parties and communities. The project description used as the basis for the environmental impact assessment should be developed to at least feasibility level and must include all aspects of the project including off-site facilities such as electric power source, product transport and shipping. Construction of the project must be initiated within three years after the approval of the environmental impact assessment; otherwise it is deemed invalid and will need to be redone (Peruvian Law No. 27446 and Supreme Decree No. 019-2009-MINAM). Twelve months following the approval of the environmental impact assessment, a detailed closure plan must be submitted for approval and a closure bond must be surrendered within one year of the approval of the closure plan. Following the approval of the environmental impact assessment, the concession holder must demonstrate they have secured the surface rights required to carry out the project. At the same time, the concession holder must also apply for all other necessary regulatory permits and approvals.
20.3 Environmental Baseline
A baseline environmental study (Baseline Study) started by ACOMISA, a Lima-based environmental consulting company, and continued in collaboration with Anddes is ongoing. The Baseline Study was expanded to include each of the Falchani Lithium Project and Macusani Uranium Project areas and now covers the affected areas belonging to the communities of Isivilla, Tantamaco, Corani, Chimboya, Paquaje and Chacaconiza. This expanded Baseline Study was accepted by SENACE and built on previous environmental monitoring that was started by the Company in 2010. The Baseline Study has recently progressed into an EIA that includes community relations and impacts of future development, as well as flora, fauna, water, air and noise sampling and comprehensive archaeological studies.
EIA work continues as a whole for the part of the plateau marked with geological resources. The Company completed and submitted the Semi-Detailed EIA-sd for the Falchani Lithium Project to the Ministry of Energy and Mines ("MINEM") on November 28, 2023. The EIA-sd provides a framework for approval of all major phases required to finalize the development of Falchani from mining reserve definition to completion of mine construction and, when approved, the EIA-sd provides authority to drill multiple holes from up to 420 drill platforms across the Project, with no additional permits required. The EIA-sd is currently within the mandatory public comment period with granting expected by March 2024.
For the Quelccaya exploration area, where a new occurrence of lithium-mineralization was discovered, an exploration permit is being elaborated at this stage, but advancement is dependent on market conditions.
The Falchani Lithium Project lies outside of the Corani-Macusani Area of Cultural and Archaeological Significance (Archaeological Area of Interest). With the assistance of the Ministry of Culture of Peru, the Company has spent the past three years conducting a professional archaeological study, which is still on-going. Archaeological studies completed as part of the exploration program permitting and recent EIA study work have shown that to date, there are no sites of cultural or archaeological significance affecting the Falchani Lithium Project. The local landscape, landforms, higher elevation and rock weathering style at the project was not conducive for hosting, or preservation of, sites of archaeological significance.
20.4 Social, Community and Environmental Impacts
20.4.1 Stakeholder Engagement
In January 2001, MEM published guidance on the management of relations between companies and local communities (Guía de Relaciones Comunitarias). It describes the Social Impact Study (Estudio de Impacto Social) now required as a part of the EIA. The Social Impact Study consists of an analysis of the impacts on persons, interpersonal relationships, economy and culture in the communities living in the area of influence, resulting from the mining operation. The plan also includes mitigation measures to reduce such impacts.
Regarding public participation in the EIA approval process, the law requires a single public hearing to take place and makes the EIA a public document, meaning the applicant must make it available to the public.
20.4.2 Social and Environmental Impacts
An environmental study is required to be completed to fully understand the potential social and environmental impacts due to the implementation of the project. Details of some potential impacts are briefly described in this section.
20.4.2.1 Positive Impacts of American Lithium in The Macusani Region
ALC is working to engage and develop the local community and has undertaken various community programs over the years including:
- Semi-Annual comprehensive medical & nutritional campaign for inhabitants of the five communities of the District of Corani, Carabaya Province, Puno
- Employment of local community members (members from Isivilla, Tantamaco, Chaccaconiza, Quelccaya, Chimboya, Pacaje and Corani)
- Hygiene programs (water sanitation)
- Sports development and sponsorship (community project cooperation and training for the completion of an all-weather football field)
- Alpaca Fiber to Market Program (trained and assisted local neighbourhoods with refurbishment and machine maintenance and connected the weavers with a market in Lima where their products are now sold)
- Monthly milk program contribution; and
- Funding support for in-community teachers, school training programs, including scholarship sponsorship.
20.4.2.2 Health of Workers
Altitude sickness is a health concern for persons at the given Project altitudes. It is anticipated that locally sourced labour or those living and/or working at high altitude will require minimal if any acclimatization. However, personnel living at low altitudes who stay at low altitudes for significant time between rotations will require acclimatization for each period spent at site.
20.5 Rehabilitation and Closure
An allowance of $30 million is included in the capital cost estimate for closure and rehabilitation costs. A preliminary closure management plan should be prepared in the future to detail the requirements and better define costs of rehabilitation and closure. The following describes considerations that were used for cost estimation of rehabilitation and closure.
- Dust control measures would be incorporated in the Project design. Any potential dust on and around the site may require attention during site rehabilitation.
- Allowance has been made to cover the solid tailings with topsoil and /or waste rock.
- The access roads from the IH to the site would remain in place for local community use. All other access and haul roads would be ripped and regraded, where required, to blend in with local topography. Safety berms and drainage infrastructure will be removed or graded, where applicable.
- For the purpose of this PEA, it is assumed that open pits and waste rock dumps will remain as permanent features with egress routes maintained in the event of entry and stormwater diversions maintained around these features. All plant, infrastructure or facilities are to be removed and ingress blocked. Limited re-grading has been allowed for to promote re-vegetation.
- Passive re-vegetation is proposed to promote soil stability and return of local species.
20.5.1 Post-Closure Monitoring and Maintenance
An allowance for routine monitoring including personnel costs and laboratory fees is included within the estimate. A closure management plan, including monitoring plan and time frame, will allow for improved accuracy of the rehabilitation and closure estimate. The monitoring system will also provide an early warning system to identify unforeseen issues post-closure.
20.6 Green Project Initiatives
The development of the Project will include the following Green Initiatives:
- Water Efficiency: Use of filtered tailings enables recycling of up to 90% of process water
- Environmental and Personnel Safety: Use of environmentally responsible dry stacking tailings technology
- Clean Energy Generation: The sulfuric acid plant on site produces sufficient clean energy to power entire process plant and provide excess power
- Future development work to evaluate opportunities such as:
o electric mine fleet with excess clean energy storage on site
o rainwater run off storage and additional water recycling
o low CO2 transport and logistics for consumables.
21 CAPEX AND OPEX
21.1 Capital Cost
21.1.1 Estimate Classification
The prepared estimate is classified by DRA as a Class 4 estimate with a +40% / -40% accuracy, similar to an AACE International Class 4 (+50% / -30%) and deemed suitable for a PEA level study
21.1.2 Assumptions
The following assumptions underlie this estimate:
- The design is as detailed in the relevant sections of this report;
- Suitably qualified and experienced construction labor will be available at the time of execution of the Project;
- All geotechnical design data was assumed due to the lack of geotechnical information at the proposed plant site and access road corridor;
- A capital provision has been included to account for costs associated with plant closure and rehabilitation;
- The Project currently assumes additional land acquisition and surface rights will be obtained in the future to accommodate proposed infrastructure such as access roads, powerline and water servitudes as well as the processing facilities themselves. The potential costs of such an acquisition are not included within the estimate.
21.1.3 Exclusions
The following items are specifically excluded from the estimate at this level of study:
- Owner's Costs prior to Project approval;
- Exploration drilling;
- Permits, licences or legal and administrative costs associated with government mining and environmental regulations. This includes reporting requirements during operation and related administrative costs;
- Cost escalation;
- Currency fluctuations;
- Finance charges and interest during construction;
- Sunk costs;
- Insurance;
- Container demurrage costs;
- Containment, monitoring or treatment of waste rock in the event that acid rock drainage or metal leaching are applicable;
- Hydrogeological monitoring, dewatering or stormwater control measures;
- Allowances for special incentives (schedule, safety or others);
- Force majeure issues;
- Future scope changes;
- Costs for community relations and services;
- Relocation or preservation costs, delays and redesign work associated with any antiquities and sacred sites;
- All duties and taxes;
- All costs associated with weather delays including flooding or resulting construction labor stand-down costs;
All other costs not explicitly mentioned in this report.
21.1.4 Contingency
Contingency is defined by AACE International as "a specific provision for unforeseeable elements of cost within the defined scope of work; particularly important where previous experience relating to estimates and actual costs has shown that unforeseeable events that will increase costs are likely to occur". The contingency is not used for scope changes but for unforeseeable events such as:
- Inaccuracy of material quantities (particularly relevant in early stage studies due to the inherent lack of engineering definition);
- Inaccuracy of material and construction unit rates;
- Buried services ;
- Industrial relations issues;
- HSE issues;
- Approval delays;
- Performance of suppliers and contractors;
- Freight and handling issues;
- Commissioning and start-up delays;
- Inclement weather over and above average weather conditions.
An 11% contingency, relative to total process plant cost and exclusive of non-process infrastructure, has been allocated to the direct and indirect costs.
21.1.5 Mining Costs
A suitably qualified Mining Contractor will be selected for the purposes of the execution of the Falchani Project. The scope of the contract will include all aspects of mining relating to RoM pad re-handle, maintenance, technical services, welfare, and all required mining related infrastructure.
The Mining Contractor capital cost for pre-stripping, equipment mobilisation, bush clearance, topsoil stripping and mining infrastructure. The estimate consists of the contractor site establishment cost and the predevelopment cost to reach a plant capacity of 1.5M Mt/y - Phase I, then 3.0 Mt/y - Phase II and finally 6.0 Mt/y - Phase III.
Initial mining fleet comprises of a blasthole drill rig, front end loader, and six haul trucks. In addition, there is an ancillary mobile fleet including dozers, water trucks, grader, and a compactor. Pre-production waste stripping includes 2.1 million total tonnes of rock mined before the processing plant commences operations.
Total mining capital and sustaining capital amounts to $ 23.8m of which pre-stripping accounts for 24%. Table 21-1 provides a breakdown of mining capital costs.
Table 21-1 Mining Capital Costs
|
Area
|
Cost ($000)
|
% of Total
|
|
Pre-Strip*
|
5,789
|
24%
|
|
Site Establishment Phase I
|
4,500
|
19%
|
|
Site Establishment Phase II
|
4,500
|
19%
|
|
Site Establishment Phase III
|
9,000
|
38%
|
|
Total
|
23,789
|
100%
|
*Pre-Strip volume equals first year of waste mined
Note: Rates and allowances based on database and benchmarked information
21.1.6 Process Costs
A priced mechanical equipment list is the foundation of the capital cost estimate for the processing plant Phase 1. Factors were applied to the equipment cost to derive the other direct costs such as earthworks, civils, structural steel, piping and valves, electrical and instrumentation, freight, equipment installation and indirect costs.
The cost estimate used information from the following sources:
- Current and historical cost information from DRA databases;
- Quotations from equipment suppliers / external consulting firms.
For Phase 2 of the tonnage ramp up it was assumed that the process plant costs would be 90% of the Phase 1 capital cost. For Phase 3 tonnage ramp up it was assumed that the process plant costs would be 90% of two times the Phase 1 costs. Both capital and operating cost estimates were prepared in $.
Process Direct Costs
The breakdown of direct costs for the process plant Phase 1 Base Case is shown in Table 21-2 and the Phase 1 Alternate Case is shown in Table 21-3. The Base Case capital costs associated with the outlay required for reagents, notably the acid plant, form the largest single cost driver accounting for 45% of total direct costs. Capital required for the construction of a sulfuric acid plant has been included in this total.
Table 21-2 Process Direct Capital Costs - Base Case
|
Area Code
|
Plant Area mount
|
$ M
|
% of Total
|
|
100
|
Crushing
|
7.85
|
2.0
|
|
200
|
Milling
|
8.64
|
2.2
|
|
400
|
Leaching
|
27.04
|
6.8
|
|
500
|
Pre-Neutralisation
|
8.82
|
2.2
|
|
600
|
Neutralisation
|
8.70
|
2.2
|
|
700
|
Softening
|
3.05
|
0.8
|
|
800
|
Salt Recovery
|
|
|
|
900
|
Product Precipitation
|
101.51
|
25.4
|
|
1000
|
Product Drying and Packaging
|
18.83
|
4.7
|
|
1100
|
Tailings
|
16.27
|
4.1
|
|
1200
|
Reagents (including acid plant)
|
180.23
|
45.0
|
|
1300 - 1800
|
Services
|
19.32
|
4.8
|
|
|
Total directs
|
400.28
|
100
|
Table 21-3 Process Direct Capital Costs - Alternate Case
|
Area Code
|
Plant Area mount
|
$ M
|
% of Total
|
|
100
|
Crushing
|
7.85
|
1.3
|
|
200
|
Milling
|
8.64
|
1.4
|
|
400
|
Leaching
|
65.5
|
10.6
|
|
500
|
Pre-Neutralisation
|
8.82
|
1.4
|
|
600
|
Neutralisation
|
8.70
|
1.4
|
|
700
|
Softening
|
3.05
|
0.5
|
|
800
|
Salt Recovery
|
180.86
|
29.2
|
|
900
|
Product Precipitation
|
101.51
|
16.4
|
|
1000
|
Product Drying and Packaging
|
18.83
|
3.0
|
|
1100
|
Tailings
|
16.27
|
2.6
|
|
1200
|
Reagents (including acid plant)
|
180.23
|
29.1
|
|
1300 - 1800
|
Services
|
19.32
|
3.1
|
|
|
Total directs
|
619.6
|
100
|
Process Indirect Costs
Indirect costs include all temporary installations, on-site vendor support, initial spares, first fills and EPCM costs. Owner's costs are excluded from this estimate. Total indirect costs for both the Base Case and Alternate Case amount to $ 109.69m.
21.1.7 Bulk Infrastructure (Access Roads) Costs
The existing connecting road between the highway and the Project site is not suitable for heavy vehicle transit. A capital estimate of $ 35m (inclusive of a 15% contingency) has been included for a new access road which starts at the Huiquiza bridge. This option starts at the diversion that is currently used to access the area of Project. This alternative takes advantage of the existing section of access to the town of Tantamaco, Isivilla and the accesses built for the communities of Quelccaya and Chaccaconiza.
21.1.8 Tailings Costs
The TSF has been designed based on the capacity requirements over LoM. To accommodate the LoM tonnage three dams will have to be built over the LoM. The costs for the TSF and the transportation of tailings to the TSF's are the same for both the Base Case and the Alternate Case and are shown in Table 21-4.
Table 21-4 Tailings Capital Cost
|
Facility
|
TSF and Transportation
$ M
|
Years
|
|
TSF1
|
29.20
|
1 - 14
|
|
TSF 2
|
56.65
|
14 - 21
|
|
TSF 3
|
70.76
|
21 - 43
|
|
Total
|
156.6
|
|
21.1.9 Sustaining Capital
The PEA Update economic model includes an allowance for annual sustaining capital of 5.0 % of mining operating cost and 1.5 % of process operating cost providing a LoM cost of 259.9$ M.
21.1.10 Closure Capital
An allowance of $ 36,000,000 has been made for the closure costs.
21.1.11 Capital Cost Summary
The Base Case design for the process plant achieves a peak processes tonnage of 6 Mt/y over three Phases. Phase 1 is designed for 1.5 Mt/y over 6 years and Phase 2 is designed for 3.0 Mt/y over 5 years and 6 Mt/y for the balance of LoM.
The process plant capital for Phase 2 is factored from the Phase 1 capital costs estimate. Similarly, bulk infrastructure capital expenditure has also been factored. Mining costs have been derived from the mobile fleet required to move the volume of material required for both Phases. The tailings capital costs applied to both phases are as described in section 16 of the report. The LoM Capital for the Base Case is presented in Table 21-5 and the Alternate Case in Table 21-6.
Table 21-5 LoM Capital Costs - Base Case
|
Area
|
Phase 1
$ M
|
Phase 2
$ M
|
Phase 3
$ M
|
LoM
$ M
|
|
Mining Capital
|
10.3
|
10.3
|
20.6
|
41.15
|
|
Process Plant - Direct costs
|
399.9
|
359.9
|
720.5
|
1 480.0
|
|
Area
|
Phase 1
$ M
|
Phase 2
$ M
|
Phase 3
$ M
|
LoM
$ M
|
|
Plant/Mine Infrastructure
|
36.3
|
32.7
|
65.5
|
134.0
|
|
Bulk Infrastructure
|
35.1
|
17.6
|
35.2
|
88
|
|
Tailings
|
29.2
|
|
127.4
|
157
|
|
Total Direct Costs
|
510.8
|
420.5
|
969.1
|
1 900
|
|
Indirect Costs
|
109.7
|
98.7
|
197.4
|
406
|
|
Contingency
|
60.1
|
54.1
|
108.2
|
222
|
|
Closure Costs
|
|
|
|
36
|
|
Total Base Case Capital Cost
|
680.6
|
573.3
|
1 274.7
|
2 565.5
|
Table 21-6 LoM Capital Costs - Alternate Case
|
Area
|
Phase 1 $ M
|
Phase 2 $ M
|
Phase 3
$ M
|
LoM
$ M
|
|
Total Base Case Capital Cost
|
680.6
|
573.3
|
1 274.7
|
2 565.5
|
|
Process Plant
|
|
416.8
|
394.9
|
811.6
|
|
Contingency
|
|
45.8
|
43.4
|
89.3
|
|
Total Capital Expenditure
|
680.6
|
1 036.3
|
1 585.6
|
3 466.5
|
21.2 Operating Costs
21.2.1 Estimate Classification
The prepared estimate is classified by DRA as a Class 4 estimate with a +40% / -40% accuracy and deemed suitable for a PEA study.
21.2.2 Mining Operating Costs
The contractor mining operating cost estimate includes all site-related operating costs associated with the open pit mining activities. The mining operating costs are based on a benchmarked contractor operated fleet of equipment to meet the mine production schedule. These costs include maintaining haul roads and work areas, re-handle mineralized material from the RoM pad to the process plant and maintaining the equipment.
The owner labor complement and costs were provided by American Lithium Corp. (ALC) and shift rosters planned by DRA. The labor cost estimate is based on three crews of shift workers working 10-hour shifts: on a two-shift rotation. The G&A costs allowed for the project are shown in Table 21-7.
Table 21-7 ALC G&A Allowance
|
Owner Labour
|
Units
|
Allowance
|
|
G&A Cost (Phase I)
|
$/y
|
5,000,000
|
|
G&A Cost (Phase II)
|
$/y
|
7,000,000
|
|
G&A Cost (Phase III)
|
$/y
|
9,000,000
|
Operational staff have a 15% burden included to personnel, which includes coverage for overtime and leave, sick leave, annual leave, and training. It has been assumed that all workers are based in-country. No allowances are included for expatriate staff and travel to and from their country of origin.
21.2.3 Contractor Mining Benchmarked Operating Costs.
The benchmarked base operation cost of $2.60 was used for the Falchani Project.
This results in a range in the production costs between $2.73 and $3.27 for the PEA production schedule.
The operating costs are summarized in Table 21-8 and Figure 21-1.
Note that a mining height adjustment factor of $0.06 per vertical meter of pit ramp elevation is allowed for.
Table 21-8 Contractor Mining Operating Costs (Benchmarked)
|
Contractor - Benchmarked Opex
|
$/t rock
|
LoM Ave $/t rock
|
|
Fixed Monthly Fee
|
0.56
|
0.56
|
|
Drilling (production, presplit, GC)
|
0.40
|
0.40
|
|
Blasting
|
0.36
|
0.36
|
|
Excavate, Load and Pit Support
|
0.50
|
0.50
|
|
Haulage and Dumping
|
0.76
|
1.13
|
|
Dayworks
|
0.02
|
0.02
|
|
Sub-Total Contractor
|
2.60
|
2.97
|

Figure 21-1 Contractor Mining LoM Costs
In addition, a stockpile reclamation cost of $3.00/t was used for material re-handled and transport from the mineralized material low grade and marginal grade stockpiles to the primary crusher at the end of the LoM.
Open Pit Mining at High Altitudes.
High altitude mining is Peru has a strong history and as can be seen (Table 21-9) by the number of open pit mining operating at high altitude Falchani is in the same zone as many other operations.
Table 21-9 South American High Altitude Mining Operations
|
Project
|
Country
|
Altitude m (amsl)
|
|
Falchani Project
|
Peru
|
4,875
|
|
Aguilucho
|
Chile
|
4,991
|
|
Mina Acumulacion Mariela
|
Peru
|
4,949
|
|
Corihuarmi
|
Peru
|
4,791
|
|
Santa Rosa
|
Peru
|
4,866
|
|
Solitaria
|
Peru
|
4,811
|
|
Project
|
Country
|
Altitude m (amsl)
|
|
Raura
|
Peru
|
4,791
|
|
Toromocho
|
Peru
|
4,813
|
|
Volcan (Dorado / Ojo de Agua)
|
Peru
|
5,121
|
21.2.4 Process Plant Operating Costs
The operating cost estimate is based on a combination of market pricing, client input and DRA database information for similar projects and presented in United States Dollars ($). Costs associated with power, labor, materials and consumables have been included in this estimate. The basis of the estimate has been defined in the sub-sections below. Both capital and operating cost estimates were prepared in $ and reported in $.
Reagents and Services
A summary is presented in Table 21-10 of the expected nominal reagent consumption rates, based on results obtained from test work, vendor specifications and mass balance outcomes. Unless otherwise specified, reagent unit supply costs shown include all clearance charges and taxes that may be incurred.
Table 21-10 Process Reagent and Consumable Costs
|
Description
|
Consumption
Units
|
Consumption
Base Case
|
Consumption
Alternate Case
|
Unit Supply
Cost
|
|
Sulfur
|
kg/t RoM
|
126.7
|
126.7
|
96 $/t
|
|
Sodium Carbonate
|
kg/t RoM
|
27.8
|
28.5
|
150 $/t
|
|
Limestone
|
kg/t RoM
|
195.6
|
195.6
|
32.4$/t
|
|
Quicklime
|
kg/t RoM
|
60.4
|
84.3
|
114 $/t
|
|
Flocculant
|
kg/t RoM
|
0.08
|
0.08
|
4 800 $/t
|
|
|
|
|
|
|
|
Grinding Media
|
kg/t RoM
|
0.43
|
0.43
|
63 $/t
|
|
Liners
|
|
|
|
0.37 $/t
|
| Other Consumables |
|
|
|
|
| Base Case |
|
|
|
0.71 $/t * |
|
Alternate Case
|
|
|
|
0.94 $/t **
|
| Freight (Local) |
|
|
|
25.3 $/t |
|
Freight (From Port)
|
|
|
|
63.2 $/t
|
*Base Case, **Alternate Case
Power
The Base Case Phase 1 estimated power draw for the plant is 14.5 MW. The acid plant will generate approximately 18.0 MW of power allowing for 3.5 MW to be exported as shown in Table 21-11. For the Alternate Case the additional plant power demand will exceed the amount generated by the acid plant by 3.9MW. Although the Alternate Case does not operate in Phase 1 the costs used for the Alternate Case Phase 2 and Phase 3 have been derived from the data calculated as if the Alternate Case ran in Phase 1.
Table 21-11 Process Power Demand
|
Description
|
Base Case
Phase 1
|
Alternate
Case
Phase 1
|
|
Power Generated
|
18.0 MW
|
18.0 MW
|
|
Power Draw
|
14.5 MW
|
21.9 MW
|
|
Export (Import) Power
|
3.5 MW
|
(3.9) MW
|
|
Value of Export/Import Power @ 0.07$/kWh
|
$2.0 M/y
|
$-2.7 M/y
|
Labor
Plant labor costs are based on the organogram developed for the processing plant broken down into operations, maintenance, and laboratory services. Labor costs are based on historic data and compared to similar regional projects. The Phase 1 costs presented in Table 21-11 are the total costs per area and are largely based on 2 shifts of 12 hours per day with certain positions requiring 8- or 12-hour single shifts only. Even though the Alternate Case is only valid from Phase 2 the costs have been derived on the basis of Phase 1 tonnage throughput. Labor requirements for Phase 2 and 3 capacity increase has been factored to allow for additional labor resourcing.
Table 21-12 Phase 1 Labor Costs
| Position |
Base Case
No. Staff |
Base Case
$/t RoM |
Alternate Case
No. Staff |
Alternate Case
$/t ROM |
| Management* |
13 |
0.56 |
13 |
0.56 |
| Operations |
181 |
2.21 |
201 |
2.38 |
| Maintenance |
66 |
0.67 |
78 |
0.77 |
| Laboratory |
32 |
0.48 |
40 |
0.54 |
| Total |
127 |
3.91 |
332 |
4.25 |
* Includes Process, Mining and Geology Technical Management
Maintenance
An annual maintenance cost is estimated as an average of 4.6% of mechanical equipment capital costs.
Consumables
The replacement rates and costs for the consumables have been supplied by the various vendors and are based on typical replacements in the industry. Unit replacements costs are shown in Table 21-13.
Table 21-13 Process Consumable Costs
|
Description
|
Base Case
$/t RoM
|
Alternate Case
$/t RoM
|
|
Crusher and Mill Liners
|
0.37
|
0.37
|
|
Steel Balls
|
0.60
|
0.60
|
|
Filter Cloths
|
0.03
|
0.03
|
|
Bulk Bags
|
0.14
|
0.33
|
|
Water
|
0.38
|
0.61
|
Laboratory
Laboratory costs are based on a proposal submitted by Quality Laboratory Services in 2019 and escalated for 2023 cost base. The estimate covers all laboratory consumables needed to carry out analyses on 1,250 samples per month. An annual fixed cost allowance of $ 432 000 has been assumed. The variable cost component has been recalculated and referenced to mineralized material tonnage over LoM. An overview of fixed and variable costs associated with sample analysis is presented in Table 21-14.
Table 21-14 Process Plant OPEX - Laboratory
|
Description
|
Unit
|
Value
|
Source
|
|
Lab Fixed Cost
|
$/year
|
432 000
|
Assumed
|
|
Lab Variable Cost
|
$/t mineralized material
|
0.07
|
QLS quote
|
Mobile Equipment
Operational expenditure associated with diesel consumption and maintenance of light vehicles, mobile equipment, generators, and small engines has been included. With a diesel supply cost of $1.14/L the total annual estimate is $360 000/y.
21.2.5 Tailings Handling and Storage
All-inclusive operational expenditure associated with the filtration plant, tailings dam, compaction of the filtered tailings and water reticulation systems has been included in the estimate. A cost of $1.12/RoM t, as derived by Vice Versa Consulting, has been used.
21.2.6 General and Administration
General and administration (G&A) costs include allowances for administrative personnel, general office supplies, safety and training, travel (both on site and off site), independent contractors, insurance, permits, fuel levies, security, camp power, camp costs, ICT, relocation and recruitment. The estimated costs for the various phases are shown in Table 21-15.
Table 21-15 G&A Costs
|
G & A Costs
|
Base Case
$/y
|
Alternate Case
$/y
|
|
Phase 1
|
5 000 000
|
5 000 000
|
|
Phase 2
|
7 000 000
|
7 000 000
|
|
Phase 3
|
9 000 000
|
9 000 000
|
21.2.7 Operating Costs Summary
The overall project operating cost estimate is presented in (Table 21-16) for the Base Case. The breakdown shows all the costs associated with mine and plant operation covering costs for contractor mining, labor, power, maintenance, reagents, consumables, and general administration. The Alternate Case unit operating costs are presented in Table 21-17.
Table 21-16 Operating Cost Summary - Base Case
| Description |
Units |
Phase 1
(RoM) |
Phase 2
(RoM) |
Phase 3
(RoM) |
Phase 3
(LG
Stockpile) |
Life of Mine |
| Mining costs - ore waste |
$ M |
55 |
143 |
812 |
0 |
1 010 |
| Mining Costs - rehandle |
$ M |
0.9 |
1.8 |
27 |
185 |
216 |
| Process Labour |
$ M |
28 |
37 |
215 |
103 |
384 |
| Process Power |
$ M |
0 |
0 |
0 |
0 |
0 |
| Process Maintenance |
$ M |
51 |
78 |
494 |
238 |
861 |
| Process Reagents |
$ M |
288 |
658 |
6 024 |
2 849 |
9 819 |
| Process Other |
$ M |
20 |
41 |
354 |
144 |
559 |
| G&A Costs |
$ M |
25 |
35 |
198 |
95 |
353 |
| Tailings Disposal |
$ M |
7 |
16 |
146 |
69 |
238 |
| Total Operating Cost |
$ M |
475 |
1 010 |
8 271 |
3 684 |
13 440 |
| Mining Costs |
$/LCE tonne |
568 |
694 |
462 |
396 |
464 |
| Processing Costs |
$/LCE tonne |
4 010 |
3 805 |
3 865 |
7 185 |
4 403 |
| G&A Costs |
$/LCE tonne |
276 |
166 |
108 |
218 |
134 |
| Tailings Handling |
$/LCE tonne |
72 |
74 |
80 |
148 |
90 |
| Unit Operating Cost |
$/LCE tonne |
4 926 |
4 739 |
4 516 |
7 947 |
5 092 |
|
|
|
|
|
|
|
| Table 21-17 Operating Cost Summary - Alternate Case |
|
|
|
|
|
|
|
| Description |
Units |
Phase 1
(RoM) |
Phase 2
(RoM) |
Phase 3
(RoM) |
Phase 3
(LG
Stockpile) |
Life of Mine |
| Mining costs - ore waste |
$ M |
55 |
143 |
812 |
0 |
1 010 |
| Mining Costs - rehandle |
$ M |
0.9 |
1.8 |
27 |
185 |
216 |
| Process Labour |
$ M |
28 |
38 |
219 |
110 |
395 |
| Description |
Units |
Phase 1
(RoM) |
Phase 2
(RoM) |
Phase 3
(RoM) |
Phase 3
(LG
Stockpile)
|
Life of Mine |
| Process Power |
$ M |
0 |
26 |
236 |
111 |
373 |
| Process Maintenance |
$ M |
51 |
99 |
632 |
305 |
1 088 |
| Process Reagents |
$ M |
288 |
707 |
6 447 |
3 063 |
10 536 |
| Process Other |
$ M |
20 |
61 |
543 |
226 |
850 |
| G&A Costs |
$ M |
25 |
35 |
198 |
95 |
353 |
| Tailings Disposal |
$ M |
7 |
16 |
146 |
69 |
238 |
| Total Operating Cost |
$ M |
475 |
1 128 |
9 292 |
4 164. |
15 059 |
| Mining Costs |
$/LCE tonne |
568 |
694 |
462 |
396 |
464 |
| Processing Costs |
$/LCE tonne |
4 010 |
4 331 |
4 422 |
8 246 |
5 017 |
| G&A Costs |
$/LCE tonne |
276 |
166 |
108 |
218 |
134 |
| Tailings Handling |
$/LCE tonne |
72 |
74 |
80 |
148 |
90 |
| Unit Operating Cost |
$/LCE tonne |
4 926 |
5 265 |
5 072 |
9 008 |
5 705 |
22 ECONOMIC ANALYSIS
22.1 Introduction
The potential economic viability and performance of the Falchani preliminary economic assessment (PEA) has been determined through developing a financial model founded on the results derived from the study and information provided by the American Lithium owners team.
The results tabled in this section have been based on forward looking statements, including (but not limited to) the production profiles, grade profiles, recoveries, capital and operating cost requirements and product pricing profiles. As such, the results presented in this section should be treated with caution and are meant for decision-making purposes only.
A Base Case which considers the production of battery grade lithium carbonate has been evaluated. In addition, the upside potential to produce sulfate of potash (SOP) and cesium sulfate (Cs2SO4) as by-products has been presented as an Alternate Case.
22.2 Methodology
The economic analysis for the study has been carried out using Discounted Cash Flow (DCF) methodologies. The analysis has been based on earnings after taxation modelled in constant terms and does not consider the effects of inflation, interest and escalation.
The economic model has been populated on a 100% equity basis and therefore does not consider alternative financing scenarios. Financing related costs such as interest expense, withholding taxes on dividends and interest income, are excluded from the economic model. Further detail as well as exclusions pertaining to capital and operating costs can be sourced from Chapter 21 of this report.
Cash flows considered in the cash flow model include revenue, capital expenditure (CAPEX), Stay in Business (SIB) capital allowance, operational expenditure (OPEX), mine closure, royalties and taxation presented on a calendar year-by-year basis. The prepared estimate is classified by DRA as a Class 4 estimate with a +40% / -40% accuracy, deemed suitable for a PEA-level study.
The interpretation of the taxation and the associated legislation relevant to Peru has been based on information available in the public domain as well as guidance received from the American Lithium owner's team. DRA does not provide expert advice on taxation matters. Value added tax (VAT) refunds and exemptions have not been considered in the economic model. Any other tax or levy, not explicitly defined, has not been considered in the model. The tax model used should be regarded as conceptual but is deemed to be suitable for this level of study. It is recommended, during the next project phase, to seek validation through a third-party consulting firm who specialise is taxation and legislative conformance in the jurisdiction.
22.3 Key Economic Outcomes
A discount rate of 8% has been applied in the analysis. The outcomes are presented on a post-tax basis in constant terms. Static product pricing of $ 22,500/t lithium carbonate equivalent (LCE), $ 1,000/t SOP and $ 58,000/t Cs₂SO₄ has been applied. Initial capital payback is exclusive of the construction period and referenced to the start of first production. Key financial outcomes are shown in Table 22-1. The Alternate Case considers the production of by-products from year 6 of operation onwards.
Table 22-1 Key Economic Outcomes (Post-tax)
| Parameter |
Unit |
Base Case |
Alternate Case |
| NPV @ 8% |
$ M |
5 109 |
5 585 |
| IRR |
% |
32.0 |
29.9 |
| Peak Cash Funding |
$ M |
681 |
681 |
| Payback (UNDISCOUNTED) - From Production Start |
years |
3.0 |
3.0 |
| Payback of Initial Capital (UNDISCOUNTED) - From PS |
years |
3.0 |
3.0 |
22.4 Source of Information
The basis of the financial evaluation has been founded on information sources from DRA and the American Lithium owner's team. An overview of key sources of information is presented in Table 22-2.
Table 22-2 Source of Information
|
Description
|
Source of Information / Responsible / Notes
|
|
General
|
|
Discount rate
|
American Lithium
|
|
Macro Variables
|
|
Exchange rates
|
American Lithium
|
|
Product pricing
|
American Lithium
|
|
Production Schedules
|
|
Production profile
|
DRA
|
|
CAPEX
|
|
Mining
|
DRA
|
|
Process plant
|
DRA
|
|
Tailings
|
American Lithium
|
|
SIB Capital
|
|
Mining
|
DRA
|
|
Process plant
|
DRA
|
|
OPEX
|
|
Mining
|
DRA
|
|
Process plant
|
DRA
|
|
Tailings
|
American Lithium
|
|
G&A
|
American Lithium
|
|
Revenue
|
|
Product recoveries
|
American Lithium / DRA (testwork interpretation)
|
|
Product pricing
|
American Lithium
|
|
Royalties and Taxation
|
|
Workers Participation Tax Rate
|
Public Domain / American Lithium
|
|
Mining Pension Fund Rate
|
Public Domain / American Lithium
|
|
Modified Mining Royalty
|
Public Domain / American Lithium
|
|
Special Mining Tax
|
N/a
|
|
Income Tax Rate
|
Public Domain / American Lithium
|
22.5 Process Production Profile
The mining schedule has been based on open pit optimisation outcomes, inclusive of measured, indicated and inferred resource. A total of 213 million tonnes (Mt) of mineralized material is delivered to the processing facility, with 127 million tonnes of waste removed over a mining period of 33 years. A strip ratio of 0.60 is achieved with plant feed including low grade and marginal grade material. The average grade over life of mine (LoM) is estimated at 2,899ppm Li. An overview of the phased production strategy is presented in Table 22-3. The milling and expansion phases are common for both the Base Case and Alternate Case.
Table 22-3 Milling Rate and Expansion Phases
|
Description
|
Years
|
Milling Rate
|
|
Phase 1
|
1 - 5
|
1.5 Mt/y
|
|
Phase 2
|
6 - 10
|
3.0 Mt/y
|
|
Phase 3
|
11 - 43
|
6.0 Mt/y
|
The mining and plant feed profile is presented in Figure 22-1. Further detail covering the mining schedule can be sourced from Section 16 of this report.
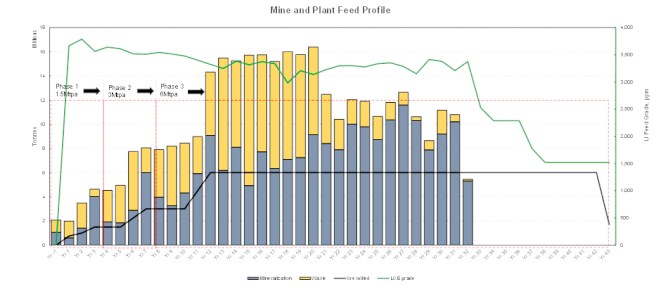
Figure 22-1 Mine and Plant Feed Profile
22.6 Capital Expenditure and Phasing
The total initial capital estimate for the project, which includes pre-stripping for mine development, construction, direct cost, indirect costs and contingency is estimated to be $ 2,565M over LoM for the Base Case. The addition of the by-product recovery increases this capital to $ 3,466 M over LoM for the Alternate Case. A detailed breakdown of the capital cost is discussed in Section 21 and is summarised in Table 22-4 . Mining will be performed using contract mining. All initial mining capital costs, apart from pre-stripping, is included in the mining contractor's rate.
Table 22-4 Capital Expenditure - Base and Alternate Case - Constant Terms (2023)*
| Area |
Phase 1,
$ M |
Phase 2,
$ M |
Phase 3,
$ M |
Total Capital,
$ M |
| Mining |
10 |
10 |
21 |
41 |
| Process Plant inc Indirects |
546 |
492 |
983 |
2021 |
| Tailings |
29 |
|
127 |
157 |
| Bulk Infrastructure |
35 |
18 |
35 |
88 |
| Plant Contingency |
60 |
54 |
108 |
222 |
| Closure Capital |
|
|
36 |
36 |
| TOTAL - Base Case (Li Only) |
681 |
574 |
13110 |
2565 |
| Plant Capex for Cs₂SO₄ + SOP |
|
416 792 |
394 856 |
811 647 |
| Plant Contingency for Cs₂SO₄ + SOP |
|
45 847 |
43 434 |
89 281 |
TOTAL - Alternate Case
(Li + Cs₂SO₄+ SOP) |
681 |
1036 |
1 713 010 |
3466 |
| Note: Costs for closure capital have been estimated. |
* Slight variation in summations may be noted due to rounding.
A summary of capital phasing over LoM is show in Table 22-5.
Table 22-5 Capital Costs Phase - Constant Terms (2023)
| |
|
|
Phase 1 |
Phase 2 |
Phase 3 |
| Description |
Unit |
Total |
Y -2 |
Y -1 |
Y 4 |
Y 5 |
Y 9 |
Y 10 |
Y 13 -
LoM |
| Base Case |
$ M |
2 565 |
335 |
346 |
282 |
292 |
563 |
584 |
163 |
| Alternate Case |
$ M |
3 466 |
335 |
346 |
513 |
523 |
783 |
803 |
163 |
22.7 Stay in Business Capital
SIB capital expenditure has been considered in the cash flow which covers mining and the process plant allowances. Mining and plant SIB has been based on an annual allowance of 5% and 1.5% respectively. This % has been applied to the respective OPEX in the cashflow over LoM. Total SIB costs for the Base Case and Alternate Case are summarized in Table 22-6.
Table 22-6 SIB Capital Cost (LoM) - Constant Terms (2023)
|
Scenario
|
Unit
|
Total (LoM)
|
|
Base Case
|
$ M
|
236
|
|
Alternate Case
|
$ M
|
260
|
22.8 Operating Costs
The operating costs over life of mine include mine operations, process plant operations, estimate for general and administrative costs, product transport costs to port and estimate for tailings disposal and tailings management. The cost reported excludes the cost of capitalized mine pre-stripping. Table 22-7 shows the estimated total and operating cost by area over LoM of the Base Case and Alternate Case. A reduction in unit operating costs for Phase 2 and Phase 3 will be realised due to economies of scale. The mining costs will decrease during the latter part of Phase 3 due to cessation of mining activity with only stockpile reclamation costs incurred. A detailed breakdown of the operating cost is discussed in Section 21 of this report.
Table 22-7 Operating Costs - Constant Terms (2023)
|
|
Base Case
|
Alternate Case
|
|
Description
|
Units
|
Total (LoM)
|
% of Total
|
Total (LoM)
|
% of Total
|
|
Mining Costs
|
$ M
|
1,226
|
9
|
1,226
|
8
|
|
Processing Costs
|
$ M
|
11,623
|
86
|
13,242
|
88
|
|
G&A Costs
|
$ M
|
353
|
3
|
353
|
2
|
|
Tailings Handling
|
$ M
|
238
|
2
|
238
|
2
|
|
Total Operating Cost
|
$ M
|
13,440
|
100
|
15,059
|
100
|
|
Unit Operating Cost
|
$/t LCE
|
5,092
|
-
|
5,705
|
-
|
22.9 Product Recoveries
The processing plant will produce saleable battery grade LCE with by-product potential of SOP and Cs2SO4 considered for the Alternate Case. Recoveries have been based on interpretation of testwork data made available during this assessment with further detail provided in Section 17. These recoveries have been applied as static figures over LoM independent of grade variations. A summary of the recovery inputs is shown in Table 22-8.
Table 22-8 Product Recoveries and Grades
|
Product
|
Recovery, %
|
Product Grade, %
|
|
LCE
|
80.0
|
>99.5
|
|
SOP
|
23.8
|
>99.9
|
|
Cs2SO4
|
72.4
|
>99.9
|
22.10 Product Pricing
The static price model has been applied and based on input received from American Lithium, guided by the Q3 2023 lithium market study conducted by Benchmark Mineral Intelligence (BMI). A price of $ 22,500/t LCE, $ 1,000/t SOP and $ 58,000/t Cs2SO4 has been applied in the financial model which is expected to be on the lower band for forecast pricing.
22.11 Salvage Value
No allowance for asset disposal at the end of life of mine has been included in the financial model.
22.12 Working Capital
No allowance for working capital has been included in the financial model.
22.13 Sunk and On-going Capital
No on-going, historical or sunk costs have been considered in the financial model.
22.14 Reclamation and Closure
A lump sum capital allowance of $ 36 M has been included at end of LoM. Refer to Table 22-4.
22.15 Taxation
The tax model used should be regarded as conceptual but is deemed to be suitable for a PEA level study. VAT refunds and exemptions have not been considered in the economic model, despite some reagent supply costs including VAT. Any other tax or levy, not described below, has not been considered in the model.
22.15.1 Depreciation
Depreciation was calculated using the following asset class assumptions for both initial and phased capital (excluding sustaining capital):
- Mine Development: 3-year straight line method;
- Process Plant and Equipment: 5-year straight line method;
- Buildings: 20-year straight line method;
- Other: 10-year straight line method.
No sunken exploration and Project development costs have been considered in the depreciation calculations. Depreciation is deemed as a deductible from operating income.
22.15.2 Worker's Participation Tax
A labour profit-sharing tax is based on operating income after deduction for depreciation and other expenses write-offs (royalty base) and is assessed on a rate of 8 %.
22.15.3 Pension Fund Contribution
A mining pension rate of 0.5% on the royalty base less deduction for workers participation taxes.
22.15.4 Royalty Tax
The modified mining royalty (MMR) tax is applied at 3.0% to the royalty base less deduction for workers participation taxes and pension fund contributions.
22.15.5 Special Mining Tax
As per input received from American Lithium, this has been considered as optional and not applicable to the operation.
22.15.6 Income Tax
Income taxes are applied at a rate of 29.5% to the royalty base less deduction for workers participation taxes, pension fund contributions and MMR.
22.16 Economic Outcomes
The financial model has been prepared on a 100% equity project basis and does not consider alternative financing scenarios. A discount rate of 8% has been applied in the analysis. The outcomes are presented on a pre-tax and post-tax basis in constant terms. A static pricing model has been applied. Initial capital payback is exclusive of the construction period and referenced to the start of first production. The analysis excludes credits for excess power generation which is fed back into the grid. Key financial outcomes are presented for the Base Case and Alternate Case in Table 22-9
.
Table 22-9 Economic Outcomes
|
Description
|
Units
|
Base Case
|
Alternate Case
|
|
Mining Statistics (LoM)
|
|
Total RoM Tonnes
|
Mt
|
213
|
213
|
|
Cost Estimate Summary (LoM)
|
|
Capital Cost (incl. contingency and closure)
|
|
|
|
|
Phase 1
|
$ M
|
681
|
681
|
|
Total LoM
|
$ M
|
2,565
|
3 466
|
|
SIB Capital Cost
|
$ M
|
236
|
260
|
|
Operating Cost
|
|
|
|
|
Total LoM
|
$ M
|
13 440
|
15 059
|
|
Unit Cost
|
$/t RoM
|
63
|
71
|
|
Unit Cost
|
$/t LCE
|
5 092
|
5 705
|
|
Unit Cost + By-product Credits
|
$/t LCE
|
5 092
|
1 361
|
|
Production and Revenue (LoM)
|
|
LCE
|
tonnes
|
2 639 610
|
2 639 ,610
|
|
SOP
|
tonnes
|
-
|
3 099 126
|
|
Cs2SO4
|
tonnes
|
-
|
144 247
|
|
LoM Revenue
|
|
|
|
|
Total LoM
|
$ M
|
59 391
|
70 857
|
|
Unit Income
|
$/t RoM
|
279
|
333
|
|
Financial Outcomes (Pre-tax, Constant Model Terms)
|
|
NPV @ 8%
|
$ M
|
8 411
|
9 251
|
|
Description
|
Units
|
Base Case
|
Alternate Case
|
|
IRR
|
%
|
40.7
|
38.5
|
|
Peak Cash Funding
|
$ M
|
681
|
681
|
|
Payback of Initial Capital (UNDISCOUNTED) - From PS
|
years
|
2.9
|
2.9
|
|
Financial Outcomes (Post-tax, Constant Model Terms)
|
|
NPV @ 8%
|
$ M
|
5 109
|
5 585
|
|
IRR
|
%
|
32.0
|
29.9
|
|
Peak Cash Funding
|
$ M
|
681
|
681
|
|
Payback of Initial Capital (UNDISCOUNTED) - From PS
|
years
|
3.0
|
3.0
|
22.17 Sensitivity
A sensitivity analysis has been conducted assessing the impact of variations in capital cost, operating cost, key reagent pricing and product selling price. Each variable was assessed in isolation to determine the impact on net present value (NPV) and internal rate of return (IRR). The results of the sensitivity analysis for the project before and after taxes are shown in Figure 22-2. for the Base Case only. The general trend of elasticity is similar for the Alternate Case showing metal pricing or recovery followed by operating cost and then capital cost having the most sensitivity on project economics.
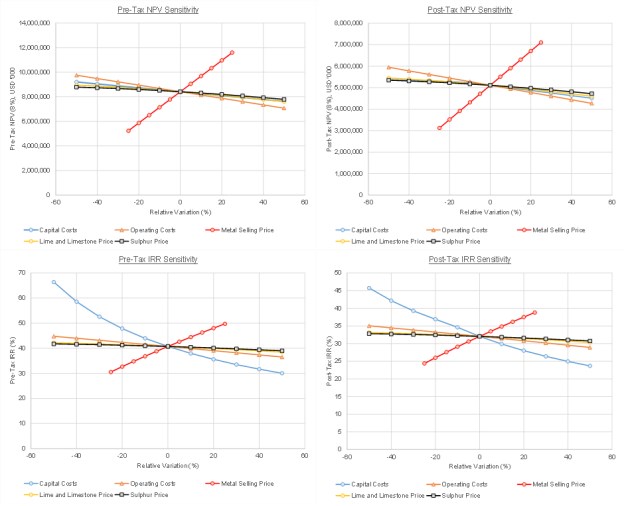
Figure 22-2 Sensitivity Analysis - Base Case
23 ADJACENT PROPERTIES
The Falchani Property is surrounded by other American Lithium controlled concessions as part of the MPA. Other explorers of significance within the region are Fission 3.0 Energy Corporation (Fission), whose portfolio of properties in the Macusani area resulted from a spin-out from Strathmore Minerals in 2007 (Fission Energy Corporation, 2010). In April 2013, Fission announced the arrangement whereby Denison Mines Corporation acquired all the outstanding common shares of Fission and the spin-out of certain assets into a new exploration company, Fission Uranium Corporation. In November 2013, certain properties and assets of Fission Uranium, including the Macusani, Peru property, became properties and assets of Fission 3.0 Corp. Nine claim blocks encompassing 51km2 were held in the Macusani area (Fission 3.0 Uranium Corporation, 201420) (Riordan et al.,2020). Fission 3.0 has subsequently relinquished these concessions after failing to pay their good standing fees in June 2021.
The Qualified Person has not verified the information associated with the adjacent concessions; the information associated with these adjacent concessions may not be indicative of the mineralization on the Property.
24 OTHER RELEVANT DATA AND INFORMATION
24.1 Project Development and Permitting Timeline
As outlined in Sections 13 and 17, process development at Falchani has been significant as the project moved towards selecting sulfuric acid leaching for lithium recovery and the potential for by-product recovery. While focusing on standardized equipment, a great deal of project specific knowledge has been gained and the advancement to pre-feasibility and feasibility levels is planned to be efficient.
Section 20 outlines the major permitting milestones to reach, and in conjunction with the processing progress, the approximate schedule, as shown in Figure 24-1, has been developed.
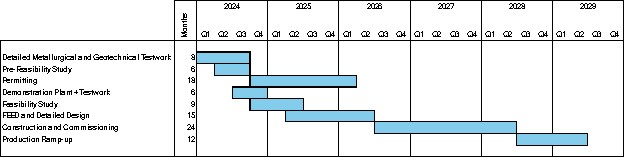
Figure 24-1 Estimated Schedule
25 INTERPRETATION AND CONCLUSIONS
25.1 Mineral Resource Estimate
Exploration of the Falchani property has been successful in identifying a mineral resource of lithium and ancillary cesium, rubidium, and potassium. The Falchani lithium deposit is unique in its host rock and mineralization. The lithium occurrences are hosted in an ash-flow Lithium Rich Tuff (LRT) and volcanoclastic breccias (Upper and Lower Breccia, UBX and LBX, respectively) that bound the LRT. Lithium mineralization is also observed in the basal Coarse Felsic Intrusion (CFI) which is interpreted to be a stratiform felsic intrusion underlying the above lithium host rocks.
Analytical results from the Falchani drilling campaigns indicate a significant high grade lithium distribution throughout the mineralized zones, with the LRT having consistent high grades, > 4,000 ppm Li. The base case cut-off grade of lithium is 600 ppm for the Mineral Resource Estimate. The associated average concentrations of cesium (Cs), potassium (K) and rubidium (Rb) indicate the potential of these analytes to be produced as a biproduct from the processing of lithium.
The structural interpretation of the property consists of nine (9) fault blocks derived from eight (8) faults, two (2) trending N-S, and six (6) NW-SW faults that truncate at the N-S faults. The mineral resource has been interpreted to be constrained in the east by faulting due to the distance from drilling data and observed offsets in drill hole logs. The average thickness of the UBX and LRT mineralized zones are similar in both east (30 m and 60 m respectively) and west fault blocks (20 m and 60 m respectively). The LBX mineralized zone has a true thickness is significantly larger in the west fault blocks (90 m) compared to the east (50 m). The CFI basement zone is observed to a depth of 407 m in drillhole PZ01-TV3, however the true thickness is not constrained from drilling as the unit extends beyond the model resource at depth. The CFI zone mineral resources have been limited by the generated pit depth of 300 m below surface.
Sample collection, analyses and QAQC of the drilling completed at Falchani are well managed and meet industry standards. Mineral resource estimates include 67 drill holes from two drilling campaigns, 2017-18 and 2022-23. The updated MRE is 5.53 Mt LCE (447 Mt at a Li grade of 2,327 ppm) with 1.01 Mt LCE in the measured category and 4.52 Mt LCE as indicated. Inferred resources were calculated at 3.99 Mt LCE. The base case Li cut-off has been lowered to 600 ppm Li from previous 1,000 ppm cutoff as a result of strong project economics specifically updated operating costs and a $20,000/tonne ("t") LC selling price. The updated mineral resource is significantly higher than the previous MRE at 0.96 Mt LCE in the indicated category (Riordan et al., 2020; Nupen, 2019). The increased size and grade of the resource support the potential for long term production at Falchani.
Potential risks that may impact accuracy of the mineral resource estimates are:
- The resource is limited to within two E-W fault blocks east of the Valley Fault as described in Section 14.4.3 that may shift location given further exploration. Should new supporting data support a significant shift in the fault locations this may have a material impact on the resource estimates.
- The CFI basement and the other volcanics around the extremities of the Property are only recognized from 28 drillholes. Future exploration drilling in these areas of the Property may show these intrusions and other volcanics extending into the Property below surface. This may have a material impact on the resource estimates in these regions of the deposit.
- Metallurgical test currently under the control of DRA may indicate that the input costs for the practical extraction of lithium to be higher than anticipated. Since processing costs are a significant component of lithium carbonate (or lithium hydroxide monohydrate) production, the lithium cutoff grade may be higher than the base case cutoff grade of 600 ppm used for the lithium resource estimates.
- Given the uniform densities applied to the mineralized zones, Stantec believes the density to be adequate for resource estimation, however, additional density data would support more accurate mineral resource tonnage estimates.
There is potential for elevated uranium concentrations on Falchani based on proximity of the deposit to the Macusani Yellowcake project located 5-25 km east and north of the property.
25.2 Preliminary Economic Assessment
This PEA Update report, with the current operating costs and product pricing, supports the economic viability of the Falchani Lithium Project. The PEA Update is based upon limited and time-sensitive information, such as LC, fuel, utility and reagent pricing. Changes in the understanding of the Project such as access to power, social/environmental issues, the ability to convert Mineral Resources to Mineral Reserves and market demand conditions could have significant effects on the Project's overall economic viability.
25.2.1 LC Production
The project has a 43-year mine plan that processes 1.5 mt/y for the first 6 years and from year 6 to year 11 to 3.0 Mt/y and there after 6.0 mt/y to year 43. The feed grade is approximately 3 400 ppm lithium for the first 32 years of processing followed by 11 years of 2 100 ppm lithium.
The targeted LC (99.5%) product is averaged at 21 876 t/y for the first 6 years, 49 169 t/y up to year 11, increasing to 84 261 t/y up to year 32, thereafter to year 43 approximately 48 186 t/y.
Mining operations are planned to run for 32 years thereafter treatment of low grade and marginal stockpiles will commence.
25.2.2 Capital and Operating Costs
Base Case
The capital expenditure for the initial stage (1.5 Mt/y) is $681M and an additional cost of $573M for 3Mt/y phase and $1274M for the balance of the years providing a total of $2 565M that includes closure costs of $36M.
The LoM operating costs average is $5092/t LC, with reagents costs making up 73% of the costs.
Alternate Case
The capital expenditure for the initial stage (1.5 Mt/y) is $681M and an additional cost of $1036M for 3Mt/y phase and $1713M for the balance of the years providing a total of $3466M that includes closure costs of $36M.
The LoM operating costs average is $5705/t LC, with reagents costs making up 70% of the costs.
25.2.3 Financial Evaluation
Base Case
Based on a LC price of $22 500/t, the Base Case project economics have revealed an after-tax Net Present Value (NPV) of $511B with an after-tax internal rate of return (IRR) of 32% and an after-tax payback period of 3.0 years on initial capital.
Alternate Case
The Alternate Case project economics have revealed an after-tax Net Present Value (NPV) of $5.58B with an after-tax internal rate of return (IRR) of 29.9% and an after-tax payback period of 3.0 years on initial capital.
25.3 Environment
The 2021 Environmental Assessment has not revealed any sensitive issues or areas that would impede the development of the project.
26 RECOMMENDATIONS
26.1 Recommended Phased Studies
The Falchani mineral resource estimation has relied on exploration drilling results. The following development path is recommended for the Falchani Project.
Phase 1 Work Program Surface Mapping
Surface mapping of the Project area will provide additional information that will enhance the understanding of the structural geology and faulting within the property. This information will greatly improve the accuracy of the current geologic model and resource estimates. Structural mapping will validate and focus the interpolated faults in the geologic model. The Authors site inspection of the property identified areas of exposed rhyolite outcrops on the Property that could be mapped in detail. Costs for a geologist and mapping program is listed in Table 26-1 Phase 1 Surface Mapping Program Costs.
Table 26-1 Phase 1 Surface Mapping Program Costs
|
Activity
|
Unit costs (US$)
|
No.
|
Cost (US$)
|
|
Surface Mapping
|
1,000/day
|
14
|
14 000
|
|
Grab Sample Assay
|
50/sample
|
120
|
6 000
|
|
Structural modeling
|
1,200/day
|
8
|
9 600
|
|
|
|
Total
|
29 600
|
Phase 2 Work Program Infill Drilling and Modeling
The proposed Phase 2 program is not dependent on the successful results of the phase 1 program above. For Phase 2 an infill drilling program of approximately 2,500 m is recommended to improve the mineral resource confidence. Estimated costs for the Phase 2 program is outlined in Table 26-2.
Table 26-2 Phase 2 Infill Drilling Costs
|
Activity
|
Unit costs (US$)
|
No.
|
Cost
(US$)
|
|
Core Drilling
|
200/m
|
2 500
|
500 000
|
|
Core Sample Assay
|
50/sample
|
2 000
|
100 000
|
|
Resource Modeling
|
n/a
|
n/a
|
50 000
|
|
|
|
Total
|
650 000
|
Phase 3 Pre-Feasibility Study
It is recommended that a PFS be completed to further demonstrate the Project's technical and economic viability and to provide a greater degree of confidence in the capital and operating cost estimates. Further definition of the Project is required to allow a PFS to be completed and the following is recommended to further develop the Project and reduce its technical uncertainty and risk:
- Mineralized material characterisation (to better define the design data for the crushing and milling circuits);
- Mineralized material variability (to understand how variability across the orebody may impact on plant performance and to make design allowances accordingly);
- Process optimisation testwork (to optimise operating parameters and reagent consumptions);
- Equipment Sizing (to allow equipment vendors to size their equipment and provide performance guarantees);
- By-product Recovery (to define the design conditions for the recovery of valuable by-products)
- Engage with equipment vendors to carry out testwork (for example, thickeners, filters, crystallisers) to allow them to offer performance guarantees;
- Engage with vendors of the major packages to better define their scope and investigate possibilities for build, own, operate commercial arrangements.
The estimated cost of the Phase 3 PFS work is shown in Table 26-3.
Table 26-3 Estimated Schedule and Costs of Recommended Activities
|
Activity
|
Estimated Duration, months
|
Estimated Cost, $
|
|
Metallurgical Testwork (mineralized material characterisation, mineralized material variability, by-product recovery, process optimisation, equipment vendor)
|
8
|
1 200 000
|
|
Geotechnical (testwork, reporting)
|
6
|
600 000
|
|
Environmental Studies
|
12-18
|
600 000
|
|
Hydrology / Hydrogeology Studies
|
12
|
600 000
|
|
Topography Survey (mine site, access road, powerline)
|
1
|
300 000
|
|
Pre-feasibility Study
|
8
|
920 000
|
|
|
TOTAL
|
4 320 000
|
26.2 Additional Recommendations
Additional studies are required to confirm the PEA results once the Project risks, opportunities and recommendations have been addressed.
26.2.1 Risks
Highly volatile Lithium market supply and demand conditions could have significant effects on the projects overall economic viability.
42% of the conceptual production schedule mineral resources are classified as inferred resources which could pose risks if they cannot be converted to indicated resource at similar grades and tonnages.
26.2.2 Opportunities
Future studies should involve reputable local mining contractors and consider the use of electric excavators and potential use of crushing and conveying of mineralized material and waste as this could decrease safety risks, decrease mining costs and enhance operational efficiencies.
Future studies will re-evaluate the Lithium grade cut-off economics in the mineral resources and should market demand and pricing grow as predicted there could be significant upside to future business case.
It has been reported that there are other mineralisation contents which maybe of economic significance in future studies.
26.2.3 Recommendations
26.3 Environmental
Detailed environmental permitting and social impact considerations are not within the scope of a PEA but will follow in later stages of the Project's development. An environmental impact study (EIA) is currently underway, and it is recommended that it continue as planned.
26.4 Metallurgical and Processing
26.4.1 Testwork
Although a substantial body of metallurgical testwork has been carried out on the Falchani lithium-bearing tuff material, additional testwork is required to better inform the subsequent study phases. The following testwork is recommended:
- Mineralized material characterisation (to better define the design data for the crushing and milling circuits)
- Mineralized material variability (to understand how variability across the orebody may impact on plant performance and to make design allowances accordingly)
- Process optimisation testwork (to optimise operating parameters and reagent consumptions)
- Equipment Sizing (to allow equipment vendors to size their equipment and provide performance guarantees)
- Effective removal of flourine
- Pilot plant scale work
- By-product Recovery (to define the design conditions for the recovery of valuable by-products)
- Site water (to determine the quality of the water).
26.4.2 Equipment vendor Engagement
It is recommended that ALC engage with the vendors of the major items of capital expenditure (for example, the sulfuric acid plant, the evaporators and crystallisers) to discuss beneficial commercial models or terms (for example, build, own, operate (BOO)).
26.4.3 Geometallurgical Model
Detailed lithological and mineralogical domains should be defined to inform the development of a geometallurgical model, which in turn will provide input to the mine development plan. The geometallurgical model should be updated and refined as the Project develops.
26.5 Infrastructure
It is recommended that the final route for the access road and powerline be identified and surveyed so that more accurate pricing be provided for these items in the next phase of the Project.
27 REFERENCES
ANSTO Minerals, "Lithium Recovery from the Macusani Deposit - C1568," ANSTO, 2018.
ANSTO Minerals, "Optimisation of Sulfuric Acid Extraction of Lithium from The Macusani Deposit - C1630," ANSTO, 2019.
ANSTO Minerals, "Alum Processing - Phase II: SOP Preparation - C1818," ANSTO, 27th February 2023.
ANSTO Minerals, Progress Note 1 "Alum Processing - Phase III: Optimisation of Leach and Alum Precipitation Conditions" 14th April 2023.
Bowell, RJ, et al., 2020. Classification and characteristics of natural lithium resources. Elements 16:259-264.
Bradley, DC, et al., 2017. Lithium. In: Schulz KJ, DeYoung JH Jr, Seal RR II, Bradley DC (eds) Chapter K. Critical Mineral Resources of the United States-Economic and Environmental Geology and Prospects for Future Supply. U.S. Geological Survey, Professional Paper 1802-K, pp K1-K21
Cheilletz, A, et al., 1992. Volcano-stratigraphy and 40Ar/39Ar geochronology of the Macusani ignimbrite field: monitor of the Miocene geodynamic evolution of the Andes of southeast Peru. Tectonophysics 205:307-327.
Environmental Legislation Handbook," [Online]. Available: http://www.legislacionambientalspda.org.pe/. [Accessed 4 March 2020].
GBM, "NI 43-101 Report - Preliminary Economic Assessment. 0539-RPT-004 Rev 4," GBM Minerals Engineering Consultants Limited, 2016.
Geology Science, Geology Education Web Portal: www.geologyscience.com (Accessed: November 2023)
Henkle W.R. Jr, 2011. Updated Technical Report of the Macusani Uranium Exploration Project Department of Puno, Peru, Prepared for Minergia S.A.C, October 2011.
Henkle W.R. Jr, 2014. Updated Technical Report of the Macusani and Munani Uranium Exploration Projects Department of Puno, Peru, Prepared for Azincourt Uranium, May 2014.
Instituto Geologico Minero y Metalurgico- INGEMMET- Plataforma del Estado Peruano : www.gob.pe (Accessed : November 2023)
London, D, 2008. Pegmatites. The Canadian Mineralogist, Special Publication 10, 347 pp.
Nupen, S., 2018: Mineral Resource Estimate for the Falchani Lithium Project in the Puno District of Peru, Prepared for Plateau Energy Metals Inc. by The Mineral Corporation, Bryanston, South Africa.
Nupen, S., 2019: Mineral Resource Estimate for the Falchani Lithium Project in the Puno District of Peru, Prepared for Plateau Energy Metals Inc. by The Mineral Corporation, Bryanston, South Africa.
Perez, ND, et al., 2016. Structural inheritance and selective reactivation in the central Andes: Cenozoic deformation guided by pre-Andean structures in southern Peru. Tectonophysics 671:264-280.
Peruvian Mining Concessions and Geological Maps, Public Domain Information: https://ingemmet-peru.maps.arcgis.com/apps/webappviewer/index.html?id=75f200cc1a 0d46c892bb221c3cb244d2 (Accessed : November 2023)
Riordan, J.J., Thompson, D.A., Coetzee V.E. and Nupen, S., 2020: Falchani Lithium Project NI 43-101 Technical Report - Preliminary Economic Assessment, Prepared for Plateau Energy Metals Inc. by DRA Pacific, Effective 4 February 2020.
Torro, L, et al. 2023. Lithium-bearing micas in the 'Lithium-rich Tuff' from the Macusani Volcanic Field, Puno, Peru. SGA 2023 Proceedings Volume 1.
Young, D.R., 2010. Update to Mineral Resource Estimates of the Colibri Project held by Global Gold S.A.C. in the Puno District of Peru, Stantec Report No. C-MYI-COL-731-592, April 2010.
Young, D.R., 2011. Update of the Mineral Resources of the Colibri Project held by Global Gold S.A.C. in the Puno District of Peru, Stantec Report No C-MYI-COL-731-686, 20 September 2010 as amended March 4, 2011.
Young, 2015. Consolidated Mineral Resource estimates for the Kihitian, lsivilla and Corani Uranium Complexes controlled by Plateau Uranium Inc, in the Puno District of Peru. Prepared for Plateau Uranium Inc and published under the Guidelines of the National Instrument 43-101 of the TSX. Report No: C-MYI-MRU-1568-960, June 2015.
American Lithium (NASDAQ:AMLI)
과거 데이터 주식 차트
부터 5월(5) 2024 으로 6월(6) 2024

American Lithium (NASDAQ:AMLI)
과거 데이터 주식 차트
부터 6월(6) 2023 으로 6월(6) 2024
