UNITED STATES
SECURITIES AND EXCHANGE COMMISSION
Washington, D.C. 20549
FORM 6-K
Report
of Foreign Private Issuer Pursuant to Rule 13a-16
or 15d-16 of the Securities Exchange Act of 1934
| For the month of July 2023 |
| |
| Commission File Number 001-40569 |
| Standard Lithium Ltd. |
| (Translation of registrant’s name into English) |
| |
|
Suite 1625, 1075 West Georgia Street
Vancouver, British Columbia, Canada V6E 3C9 |
| (Address of principal executive offices) |
Indicate by check mark whether the registrant files or will file annual
reports under cover of Form 20-F or Form 40-F:
Form 20-F ¨
Form 40-F x
Indicate by check mark if the registrant is submitting the Form 6-K
in paper as permitted by Regulation S-T Rule 101(b)(1): ¨
Indicate by check mark if the registrant is submitting the Form 6-K
in paper as permitted by Regulation S-T Rule 101(b)(7): ¨
DOCUMENTS INCLUDED AS PART OF THIS REPORT
SIGNATURES
Pursuant to the requirements of the Securities
Exchange Act of 1934, the registrant has duly caused this report to be signed on its behalf by the undersigned, thereunto duly authorized.
| |
Standard Lithium Ltd. |
| |
(Registrant) |
| |
|
| Date: |
July 26, 2023 |
|
By: |
/s/ Robert Mintak |
| |
|
|
|
Name: |
Robert Mintak |
| |
|
|
|
Title: |
CEO and Director |
Exhibit
99.1
Standard
Lithium Ltd.
Preliminary
Economic Assessment of
SW
Arkansas Lithium Project
NI
43 – 101 Technical Report
Completed
by:
Rodney
Breuer, P.Eng.
D.
Roy Eccles, M.Sc., P.Geo.
Trotter
Hunt, P.Eng.
David
Anthony (Tony) Boyd, B.A.Sc., PhD., P.Eng.
Ronald
Molnar, P.Eng.
Steve
Shikaze, M.Sc., P.Eng.
Amended
Issue Date: June 16, 2023
Original
Issue Date: November 25, 2021
Effective
Date: November 20, 2021
Document
No. E3580-RP-0200
NORAM
Engineering and Constructors Ltd.
1800
- 200 Granville Street
Vancouver,
BC,
V6C
1S4, Canada

Cautionary
Note Regarding Forward-Looking Information
Information
contained in this report and the documents referred to herein which are not statements of historical facts, may be “forward-looking
information” for the purposes of Canadian Securities laws. Such forward looking information involves risks, uncertainties and other
factors that could cause actual results, performance, prospects and opportunities to differ materially from those expressed or implied
by such forward looking information. The words “expect”, “target”, “estimate”, “may”,
“anticipate”, “should”, “will”, and similar expressions identify forward-looking information.
These
forward-looking statements relate to, among other things, resource estimates, grades and recoveries, development plans, mining methods
and metrics including recovery process and, mining and production expectations including expected cash flows, capital cost estimates
and expected life of mine, operating costs, the expected payback period, receipt of government approvals and licenses, time frame for
construction, financial forecasts including net present value and internal rate of return estimates, tax and royalty rates, and other
expected costs.
Forward-looking
information is necessarily based upon a number of estimates and assumptions that, while considered reasonable, are inherently subject
to significant political, business, economic and competitive uncertainties and contingencies. There may be factors that cause results,
assumptions, performance, achievements, prospects or opportunities in future periods not to be as anticipated, estimated or intended.
There
can be no assurances that forward-looking information and statements will prove to be accurate, as many factors and future events, both
known and unknown could cause actual results, performance or achievements to vary or differ materially, from the results, performance
or achievements that are or may be expressed or implied by such forward-looking statements contained herein or incorporated by reference.
Accordingly, all such factors should be considered carefully when making decisions with respect to the Project, and prospective investors
should not place undue reliance on forward-looking information. Forward-looking information in this technical report is as of the original
issue date, November 25, 2021. Standard Lithium Ltd. assumes no obligation to update or revise forward-looking information to reflect
changes in assumptions, changes in circumstances or any other events affecting such forward-looking information, except as required by
applicable law.
| Standard Lithium Ltd. SW Arkansas Lithium Project PEA | | Page i |
| | | |
Table
of Contents
| Cautionary
Note Regarding Forward-Looking Information |
|
i |
| |
|
|
| Table
of Contents |
|
ii |
| |
|
|
| List
of Figures |
|
vii |
| |
|
|
| List
of Tables |
|
ix |
| 1.1 |
Issuer
and Purpose |
1 |
| 1.2 |
Property
Location and Ownership |
1 |
| 1.3 |
Geology
and Inferred Resource Estimation |
1 |
| 1.4 |
Recovery
Method and Mineral Processing |
3 |
| 1.5 |
Capital
and Operating Cost Estimates |
3 |
| 1.5.1 |
Capital
Expenditure Costs |
3 |
| 1.5.2 |
Operating Expenditure
Costs |
4 |
| 1.6 |
Economic
Analysis |
5 |
| 1.7 |
Conclusions |
7 |
| 1.8 |
Key
Study Recommendations |
7 |
| 1.9 |
SW
Arkansas Project Related Risks and Uncertainties |
8 |
| 2.1 |
Issuer
and Purpose |
11 |
| 2.2 |
Technical
Report Authors and Personal Inspection of Property |
13 |
| 2.3 |
Sources
of Information |
14 |
| 2.4 |
Units
of Measure, Currency, and Acronyms |
16 |
| 3 |
Reliance
of Other Experts |
18 |
| |
|
|
| 4 |
Property
Description and Location |
19 |
| 4.1 |
Property
Description and Location |
19 |
| 4.2 |
Lithium-Brine
Mineral Production Rights |
19 |
| 4.2.1 |
Summary
of the Standard Lithium – TETRA Agreement |
19 |
| 4.2.2 |
Summary of Eight Salt
Water (Brine) Deeds |
20 |
| 4.2.3 |
Summary of 802 Leases |
21 |
| 4.2.4 |
Mineral Brine Right
Distribution on Individual Leases |
21 |
| 4.3 |
Surface
(and Mineral) Rights in Arkansas |
23 |
| 4.4 |
Unitisation |
24 |
| 4.5 |
Potential
Future Royalty Payments to Lessors |
25 |
| 4.6 |
Property
Environmental Liabilities and Permitting |
26 |
| 4.7 |
Risks
and Uncertainties |
27 |
| 5 |
Accessibility,
Climate, Local Resources, Infrastructure and Physiography |
28 |
| |
|
|
| 6 |
History |
31 |
| 6.1 |
Introduction
to Brine Production in Arkansas |
31 |
| 6.2 |
Regional
Assessment of the Lithium Potential of the Smackover Formation Brine (Discussion Extends Beyond the Boundary of the SWA Property) |
34 |
| 6.3 |
SWA
Property Historical Infrastructure Summary |
38 |
| Standard Lithium Ltd. SW Arkansas Lithium Project PEA | | Page ii |
| | | |
| 7 |
Geological
Setting and Mineralization |
40 |
| 7.1 |
Gulf
Coast Tectono-Depositional Framework |
40 |
| 7.2 |
Triassic-Jurassic
Stratigraphy |
43 |
| 7.3 |
Smackover
Formation |
45 |
| 7.4 |
Property
Geology: Characterization of the Smackover Formation |
49 |
| 7.5 |
Structural
Geology |
58 |
| 7.6 |
Upper
and Middle Smackover Formation Aquifer |
58 |
| 7.7 |
Mineralization |
59 |
| 8 |
Deposit
Types |
60 |
| |
|
|
| 9 |
Exploration |
63 |
| 9.1 |
Subsurface
Data Review |
63 |
| 9.1.1 |
Stratigraphic
Surface Interpretation and Definition of the Smackover Formation |
63 |
| 9.1.2 |
Delineation of an Inferred
Fault Zone Within the SWA Project |
66 |
| 9.1.3 |
Core Report Analysis
and Review |
66 |
| 9.2 |
2018
Brine Sampling Program |
68 |
| 10 |
Drilling |
70 |
| |
|
|
| 11 |
Sample
Preparation, Analyses and Security |
71 |
| 11.1 |
Brine
Sample Collection |
71 |
| 11.2 |
Field
Duplicate Samples and Semi-Certified Standard Samples |
72 |
| 11.3 |
Security |
73 |
| 11.4 |
Analytical
Methodology |
74 |
| 11.5 |
Quality
Control/Quality Assurance |
74 |
| 11.5.1 |
Field Duplicate
Samples |
74 |
| 11.5.2 |
Semi-Certified Standard
Sample Comparison |
75 |
| 11.6 |
Other
Data: Core Reports |
76 |
| 11.7 |
Summary |
77 |
| 12.1 |
Metallurgical
Test Data |
79 |
| 13 |
Mineral
Processing and Metallurgical Testing |
80 |
| 13.1.1 |
Process
Selection Rationale |
80 |
| 13.1.2 |
Process Overview |
81 |
| 13.2 |
Historical
Testing |
82 |
| 13.3 |
Brine
Pre-Treatment Testing |
82 |
| 13.4 |
LiSTR
Demonstration Plant Testing |
83 |
| 13.4.1 |
Overview |
83 |
| 13.4.2 |
Findings from Demonstration
Plant Testing |
85 |
| 13.5 |
Lithium
Chloride Conversion Testing |
86 |
| 13.6 |
Process
Testing QA/QC |
86 |
| 13.7 |
Process
Scalability |
87 |
| 13.8 |
Process
Technical Risks and Mitigation Measures |
87 |
| 13.9 |
Conclusions
and Recommendations |
88 |
| Standard Lithium Ltd. SW Arkansas Lithium Project PEA | | Page iii |
| | | |
| 14 |
Mineral
Resource Estimates |
89 |
| 14.1 |
Introduction |
89 |
| 14.2 |
Resource
Estimation Steps |
91 |
| 14.3 |
Data |
91 |
| 14.3.1 |
Subsurface
Geophysical Wireline and Seismic Data |
91 |
| 14.3.2 |
Lithium Analytical Data |
92 |
| 14.3.3 |
Porosity
and Permeability Data |
92 |
| 14.3.4 |
Data QA/QC |
93 |
| 14.4 |
Step
1: Geometry and Volume of the Upper and Middle Smackover Formation Domains |
94 |
| 14.4.1 |
Lateral
Spatial Dimensions and Brine Ownership Within the Potentially Unitised Resource Area |
94 |
| 14.4.2 |
Stratigraphic Surface
Modelling and Construction |
94 |
| 14.4.3 |
Three-Dimensional Modelling
and Volume Calculation |
95 |
| 14.5 |
Step
2 Hydrogeological Characterization of the Upper and Middle Smackover Formations |
101 |
| 14.5.1 |
Porosity |
101 |
| 14.5.2 |
Permeability |
106 |
| 14.5.3 |
Porosity-Permeability
Observations |
107 |
| 14.5.4 |
Dispersivity |
107 |
| 14.5.5 |
Anisotropy |
108 |
| 14.5.6 |
Groundwater Levels in
the Smackover Formation |
109 |
| 14.5.7 |
Specific Storage and
Storativity |
110 |
| 14.5.8 |
Hydraulic Conductivity
and Transmissivity |
111 |
| 14.5.9 |
Summary of Hydrogeological
Conditions |
112 |
| 14.6 |
Step
3: Estimate of Average Porosity in the Upper and Middle Smackover Formations Domain Aquifers |
112 |
| 14.6.1 |
Declustering |
113 |
| 14.6.2 |
Capping |
113 |
| 14.7 |
Step
4: Pore Space Brine Availability |
116 |
| 14.8 |
Step
5: Lithium-Brine Concentration |
119 |
| 14.9 |
Mineral
Resource Estimate |
119 |
| 14.9.1 |
Definition
of Mineral Resource |
119 |
| 14.9.2 |
Resource Classification
Methodology |
119 |
| 14.9.3 |
Market Conditions and
Pricing |
121 |
| 14.9.4 |
Step 6: Evaluation of
Reasonable Prospects for Economic Extraction |
121 |
| 14.9.5 |
Cutoff |
122 |
| 14.9.6 |
Step 7: Mineral Resource
Reporting: SWA Property Inferred Lithium-Brine Resource Estimations |
123 |
| 14.9.7 |
Reconciliation of Mineral
Resources |
125 |
| 15 |
Mineral
Reserve Estimates |
126 |
| |
|
|
| 16 |
Mining
Methods |
127 |
| 16.1 |
Estimated
Brine Production Capacity |
127 |
| 16.1.1 |
Methodology |
127 |
| 16.1.2 |
Production and Injection
Well Network Design |
127 |
| 16.1.3 |
Estimated Brine Production |
128 |
| 16.2 |
Wellfield
Overview |
129 |
| 16.3 |
Wellfield
Configuration |
130 |
| 16.3.1 |
Production
Wells |
130 |
| 16.3.2 |
Injection Wells |
131 |
| 16.4 |
Drilling
Program |
131 |
| 16.4.1 |
Well Details |
131 |
| 16.4.2 |
Rig Details |
133 |
| 16.4.3 |
Drilling Schedule |
133 |
| Standard Lithium Ltd. SW Arkansas Lithium Project PEA | | Page iv |
| | | |
| 17.1 |
Brine
Production and Delivery |
134 |
| 17.2 |
Production
of Purified Lithium Chloride Solution |
134 |
| 17.2.1 |
Preparation
of the Feed Brine |
134 |
| 17.2.2 |
Lithium
Extraction Process |
135 |
| 17.2.3 |
Lithium Barren Brine
Disposal |
137 |
| 17.2.4 |
Lithium Sorbent Stripping
and Regeneration Process |
137 |
| 17.2.5 |
Pregnant Strip Solution
(Lithium Chloride) Purification and Concentration |
137 |
| 17.3 |
Production
of Lithium Hydroxide Monohydrate |
137 |
| 18 |
Project
Infrastructure |
140 |
| 18.1 |
Brine
Supply Wells Infrastructure |
140 |
| 18.1.1.1 |
Water Supply
and Distribution |
141 |
| 18.1.1.2 |
Power Supply |
141 |
| 18.1.1.3 |
Compressed Air |
141 |
| 18.1.1.4 |
Chemicals & Reagents |
141 |
| 18.1.1.5 |
Auxiliary Infrastructure |
142 |
| 18.1.1.6 |
Pipelines |
142 |
| 18.2 |
Central
Processing Facility Infrastructure |
142 |
| 18.2.1 |
Fresh Water
Supply and Distribution |
143 |
| 18.2.2 |
Steam Supply |
144 |
| 18.2.3 |
Power Supply |
144 |
| 18.2.4 |
Compressed Air |
144 |
| 18.2.5 |
Sour Gas Disposal |
144 |
| 18.2.6 |
Auxiliary Facilities |
144 |
| 18.3 |
Barren
Brine/Process Water Injection Wells Network Infrastructure |
145 |
| 18.3.1.1 |
Water Supply
and Distribution |
146 |
| 18.3.1.2 |
Power Supply |
146 |
| 18.3.1.3 |
Compressed Air |
146 |
| 18.3.1.4 |
Auxiliary Infrastructure |
146 |
| 19 |
Market
Studies and Contracts |
148 |
| 19.1 |
Background |
148 |
| 19.2 |
Price |
149 |
| 20 |
Environmental
Studies, Permitting and Social or Community Impact |
151 |
| 20.1 |
Introduction |
151 |
| 20.2 |
Environmental
Considerations |
151 |
| 20.3 |
Permitting |
151 |
| 20.3.1 |
Overview |
151 |
| 20.3.2 |
Air Emissions Permitting |
152 |
| 20.3.3 |
NPDES Permitting |
152 |
| 20.3.4 |
Underground Injection
Control (UIC) Permitting |
152 |
| 20.3.5 |
Resource Conservation
Recovery Act |
152 |
| 20.3.6 |
Construction Permits,
Approvals, and Plans |
153 |
| 20.4 |
Social
Impact |
153 |
| 20.5 |
Environmental
Management and Closure Plan |
154 |
| Standard Lithium Ltd. SW Arkansas Lithium Project PEA | | Page v |
| | | |
| 21 |
Capital
and Operating Expenditure Costs |
155 |
| 21.1 |
Capital
Expenditure Cost Estimate – |
155 |
| 21.1.1 |
Basis of
Estimate |
155 |
| 21.1.1.1 |
General |
155 |
| 21.1.1.2 |
Brine Supply &
Injection Wellfields |
155 |
| 21.1.1.3 |
Brine Supply/Return and
Sour Gas Pipeline Network |
156 |
| 21.1.1.4 |
Central Processing Facility |
157 |
| 21.1.2 |
Capital
Expenditure Cost Estimate |
158 |
| 21.2 |
Operating
Expenditure Cost Estimate |
160 |
| 21.2.1 |
Basis of
Estimate |
160 |
| 21.2.2 |
Direct Operational Expenditures |
160 |
| 21.2.2.1.1. |
Facility Management |
160 |
| 21.2.2.1.2. |
Administration Personnel |
160 |
| 21.2.2.1.3. |
Security Personnel |
161 |
| 21.2.2.1.4. |
Production Personnel |
161 |
| 21.2.2.1.5. |
Shipping & Receiving
Personnel |
161 |
| 21.2.2.1.6. |
Maintenance Personnel |
162 |
| 21.2.2.1.7. |
Quality Control &
Laboratory Personnel |
162 |
| 21.2.2.1.8. |
Manpower Summary |
162 |
| 21.2.2.2 |
Electrical
Power |
163 |
| 21.2.2.3 |
Reagents and Consumables |
164 |
| 21.2.2.4 |
Water |
165 |
| 21.2.2.5 |
Natural Gas |
165 |
| 21.2.2.6 |
Maintenance &
Servicing |
166 |
| 21.2.2.6.1. |
Well Facilities |
166 |
| 21.2.2.6.2. |
Pipelines |
166 |
| 21.2.2.6.3. |
Central Processing Facility |
167 |
| 21.2.2.7 |
Product Transport |
167 |
| 21.2.2.8 |
Solids Disposal |
167 |
| 21.2.2.9 |
Miscellaneous Costs |
168 |
| 21.2.3 |
Indirect
Operational Expenditures |
168 |
| 21.2.3.1 |
Insurance |
168 |
| 21.2.3.2 |
Sales, Marketing, &
Customers Relations |
168 |
| 21.2.3.3 |
Plant Optimizations &
Development |
168 |
| 21.2.3.4 |
Environmental Monitoring |
168 |
| 21.2.3.5 |
Community Benefits |
169 |
| 21.2.3.6 |
Mine Closure Fund |
169 |
| 21.2.4 |
Royalties &
Land Fees |
169 |
| 21.2.4.1 |
Royalty Fees |
169 |
| 21.2.4.2 |
Land Costs |
170 |
| 21.2.4.2.1. |
Well Facilities
and Central Processing Plant |
170 |
| 21.2.4.2.2. |
Pipeline Right-of-Way |
171 |
| 22.1 |
Evaluation
Criteria |
173 |
| 22.2 |
Taxes &
Royalties |
174 |
| 22.2.1 |
Royalties
and Lease Fees |
174 |
| 22.2.2 |
Depreciation |
174 |
| 22.2.3 |
Corporate Taxes |
174 |
| 22.3 |
CAPEX
Spending Schedule |
174 |
| 22.4 |
Production
Revenues |
174 |
| 22.5 |
Cash-Flow
Projection |
174 |
| 22.6 |
Economic
Evaluation Results |
176 |
| 22.7 |
Sensitivity
Analysis |
176 |
| 22.8 |
Conclusions
and Sensitivity Analysis |
180 |
| Standard Lithium Ltd. SW Arkansas Lithium Project PEA | | Page vi |
| | | |
| 23 |
Adjacent
Properties |
181 |
| |
|
|
| 24 |
Other
Relevant Data and Information |
182 |
| |
|
|
| 25 |
Interpretation
and Conclusions |
183 |
| 25.1 |
Opinion
on Standard Lithium’s Exploration Work |
183 |
| 25.2 |
SWA
Property Preliminary Economic Assessment Summary |
183 |
| 25.3 |
Risks
and Uncertainties |
184 |
| 25.3.1 |
Assumption
in the Resource Model and Estimation Process |
184 |
| 25.3.2 |
Risk Assessment Summary |
184 |
| 26 |
Recommendations |
186 |
| |
|
|
| 27 |
References |
187 |
| |
|
|
| 28 |
Certificate
of Authors |
197 |
List
of Figures
| Figure
2-1. General location of the SWA Project discussed in this Technical Report |
|
12 |
| Figure
4-1. SWA Project discussed in this Technical Report |
|
20 |
| Figure
4-2. SWA Property ownership summary |
|
23 |
| Figure
5-1. SWA Property with cities/towns and access routes, including major and secondary U.S. highways and railway lines |
|
29 |
| Figure
5-2. Average temperature and precipitation at Magnolia, AR |
|
30 |
| Figure
6-1. Summary of south Arkansas oil, gas and brine production (1960s up to 2017). Source: AOGC (July 3, 2018) |
|
32 |
| Figure
6-2. Regional Smackover Formation lithium-brine values from the USGS National Produced Waters Geochemical Database. Source: USGS
National Produced Waters Geochemical Database (from Blondes et al., 2016). The H2S-rich belt and fault zones are from Moldovanyi
and Walter,1992 |
|
36 |
| Figure
6-3. Smackover Formation lithium brine values derived within and surrounding the SWA Property. Source: from the USGS National Produced
Waters Geochemical Database, Blondes et al. (2016) |
|
37 |
| Figure
6-4. Well status on the SWA Property (wells with total depth >7,000 feet) |
|
39 |
| Figure
7-1. Tectonic framework of the northern part of the Gulf of Mexico region (from Marcini et al., 2008; who modified the work of MacRae
and Watkins, 1996). The approximate location of the SWA Property is denoted with a red star |
|
42 |
| Figure
7-2. Regional map of Smackover Formation lithofacies belts in the U.S. Gulf Coast basin. Source is Handford and Baria (2007), who
modified the work of Ahr (1973) and Bishop (1968). The approximate location of the SWA Property is denoted with a red star |
|
43 |
| Figure
7-3. Stratigraphic depositional environments of the Smackover Formation. The mineral resource estimated in this Technical Report
includes the Upper Smackover Formation (Reynolds Member on this figure) and the Middle Smackover Formation |
|
48 |
| Figure
7-4. Type Smackover Formation section depicting resource estimation zones that were used in this Technical Report. The ASCII log
file is from Trend Resources Limited Neal Ellis #1 (API: 03-731-0765-00-00). The well is in Section 19, Township 16S Range 23W5
and has a total depth of 2,659 m (8,723 feet) |
|
51 |
| Figure
7-5. Wells selected for study and location of cross-sections |
|
52 |
| Figure
7-6. North-South cross-section A-A’ of the Smackover Formation and associated geological units in the SWA Property area. The
section is hung using the Upper Smackover Formation as a datum |
|
53 |
| Standard Lithium Ltd. SW Arkansas Lithium Project PEA | | Page vii |
| | | |
| Figure
7-7. North-South cross-section B-B’ of the Smackover Formation and associated geological units in the SWA Property area. The
section is hung using the Upper Smackover Formation as a datum |
|
54 |
| Figure
7-8. East-West cross-section E- E’ of the Smackover Formation and associated geological units in the SWA Property area. The
section is hung using the Upper Smackover Formation as a datum |
|
55 |
| Figure
7-9. An example of proprietary 2D seismic data showing the uniform and continuous Smackover Formation geologic horizons |
|
57 |
| Figure
9-1. Structure map of the top of the Upper Smackover Formation |
|
64 |
| Figure
9-2. Structure map of the bottom of the Upper Smackover Formation |
|
65 |
| Figure
9-3. Top of Buckner Formation Structure Map |
|
67 |
| Figure
9-4. Location of brine samples collected by Standard Lithium as part of the 2018 brine sampling program as well as historical lithium
results |
|
69 |
| Figure
11-1. Histogram of the semi-certified sample standard that was analysed at WetLab and ALS-Houston |
|
76 |
| Figure
13-1 SWA Lithium Brine Project Flowsheet Schematic |
|
82 |
| Figure
14-1. Definition of the North and South SWA Property Mineral resource areas. The fault dividing the two resource areas is inferred
from this study, and presently, is the most plausible explanation for the variation of lithium-in-brine values between the south
and north areas |
|
90 |
| Figure
14-2. Orthogonal view of Property boundary (thick black line), drillhole collars (circles), drillhole traces (black lines), and interpreted
Upper Smackover Formation (north - green solid, south – brown solid). The holes in the model show areas that are not under
lease and have therefore been removed from the resource modelling and estimation process. Vertical exaggeration of 3:1 |
|
96 |
| Figure
14-3. Cross-sections to show vertical extent of the Upper and Middle Smackover formations, in the North and South resource areas.
Vertical exaggeration of 5:1 |
|
97 |
| Figure
14-4. Position of the State Line Fault Complex and its influence on the Upper Smackover Formation domain strata. Abbreviations: UpperSMK
– Upper Smackover Formation; MidSmk – Middle Smackover Formation |
|
100 |
| Figure
14-5. Location of the core holes and corresponding well identifiers |
|
104 |
| Figure
14-6. Probability plot of porosity measurements within the Upper Smackover Formation before capping. The global population and outlier
values that are capped are designated by black and red dots, respectively |
|
114 |
| Figure
14-7 Probability plot of porosity measurements within the Middle Smackover Formation before capping. The global population and outlier
values that are capped are designated by black and red dots, respectively |
|
115 |
| Figure
14-8. Histogram of capped porosity measurements within the Upper Smackover Formation. Abbreviations: n – number of observations;
m – mean; σ – standard deviation; CV – Coefficient of variation; xmax – Maximum value; x75 to x25 –
75th to 25th percentile; xmin – minimum value |
|
115 |
| Figure
14-9. Histogram of capped porosity measurements within the Middle Smackover Formation. Abbreviations: n – number of observations;
m – mean; σ – standard deviation; CV – Coefficient of variation; xmax – Maximum value; x75 to x25 –
75th to 25th percentile; xmin – minimum value |
|
116 |
| Standard Lithium Ltd. SW Arkansas Lithium Project PEA | | Page viii |
| | | |
| Figure
14-10. Spatial location of wells with core-plug effective porosity measurements. The number of porosity measurements from core plug
samples from each well are provide beside the well collar (Upper Smackover Formation values on the right, Middle Smackover Formation
values on the left) |
|
118 |
| Figure
16-1. Supply well process |
|
130 |
| Figure
16-2. Well Diagram (Horizontal) |
|
132 |
| Figure
17-1. Overall block flow diagram of lithium hydroxide monohydrate production from Smackover Formation brine |
|
134 |
| Figure
17-2. Block flow diagram of lithium extraction process (lithium chloride plant) |
|
136 |
| Figure
17-3. Block flow diagram of lithium hydroxide monohydrate plant |
|
138 |
| Figure
18-1. Brine supply well pad conceptual layout |
|
140 |
| Figure
18-2. Central production facility conceptual layout |
|
143 |
| Figure
18-3.Brine injection facility conceptual layout |
|
145 |
| Figure
19-1. Lithium Supply and Demand - Historical and forecast from 2016-2027 (used with permission from Global Lithium LLC) |
|
148 |
| Figure
19-2. Lithium Hydroxide Demand - Historical and forecast from 2016-2027 (used with Permission from Global Lithium LLC) |
|
149 |
| Figure
19-3. Lithium Hydroxide Monohydrate price in $US - Historical and forecast from 2016-2027 (used with Permission from Global Lithium
LLC) |
|
150 |
| Figure
22-1. Net present value post tax sensitivity |
|
178 |
| Figure
22-2. Net present value pre-tax sensitivity |
|
178 |
| Figure
22-3. Internal rate of return post-tax sensitivity |
|
179 |
| Figure
22-4. Internal rate of return pre-tax sensitivity |
|
179 |
List
of Tables
| Table
1-1. SWA Project Inferred Resource estimation |
|
2 |
| Table
1-2. Capital cost summary |
|
4 |
| Table
1-3. Operating cost summary |
|
5 |
| Table
1-4. Economic evaluation summary |
|
6 |
| Table
1-5. Lithium Hydroxide Monohydrate sale rice post-tax sensitivity analysis |
|
7 |
| Table
1-6. Risk Assessment Matrix |
|
8 |
| Table
2-1. Qualified Persons and their responsibilities |
|
13 |
| Table
2-2. Abbreviations |
|
16 |
| Table
4-1. SWA Property ownership summary |
|
22 |
| Table
6-1. Southern Arkansas 2017 brine production (US Barrels). Source: AOG Commission |
|
33 |
| Table
6-2. Oil, gas and brine production for McKamie-Patton Smackover Formation wells from 2013 to March 2018. Source: Mission Creek
Resources, LLC |
|
34 |
| Table
7-1. Stratigraphic table of the Late Triassic to Late Jurassic formations of the northern United States Gulf Coast (from Heydari
and Baria, 2005) |
|
44 |
| Table
9-1. Summary of analytical results from 2018 sampling program |
|
68 |
| Table
11-1. Comparison of field duplicate samples from the 2018 sampling program |
|
75 |
| Table
12-1. Comparison of analytical Lithium results from Standard Lithium’s 2018 sampling program (original and field duplicate
samples) and historical results from Moldovanyi and Walter (1992) |
|
79 |
| Table
13-1. Representative Brine Analyses and lithium chloride Product |
|
84 |
| Standard Lithium Ltd. SW Arkansas Lithium Project PEA | | Page ix |
| | | |
| Table
14-1. Spatial extents of the resource areas and Upper and Middle Smackover Formations at the SWA Property |
|
98 |
| Table
14-2. Summary of Smackover Formation porosity (from Manger,1963) |
|
102 |
| Table
14-3. Summary porosity and permeability measurements conducted on historical core samples from wells located within the SWA Property
area |
|
103 |
| Table
14-4. Porosity and permeability measurements conducted by Standard Lithium core samples from select wells located on the SWA Property |
|
105 |
| Table
14-5. Historical porosity and permeability measurements core samples near the SWA Property |
|
105 |
| Table
14-6. Summary of the converted wireline density porosity dataset emphasizing the component of negative values and their influence
on the average total porosity |
|
106 |
| Table
14-7. Summary of historical permeability values for the Smackover Formation. Reynolds Member is part of the Upper Smackover Formation |
|
107 |
| Table
14-8. Summary of horizontal and vertical permeability measurements from the SWA Property and surrounding area |
|
108 |
| Table
14-9. Original reservoir data from Smackover Formation oilfields in southern Arkansas (from Francher and MacKay, 1946) |
|
110 |
| Table
14-10. Representative values of specific storage for various geological materials (from Domenico and Mifflin, 1965; and Batu, 1998) |
|
111 |
| Table
14-11. Summary statistics of un-capped and clustered core porosity measurements for the Upper and Middle Smackover formations |
|
113 |
| Table
14-12. Summary statistics of capped and declustered core porosity measurements for the Upper and Middle Smackover Formations |
|
116 |
| Table
14-13. Summary of 2018 geochemical Lithium data at the SWA Property |
|
120 |
| Table
14-14. The updated (2021) and unitised SWA Property Inferred Lithium-Brine Resource Estimation. The grey-shaded ‘total’
column represents the main resource. The resource is also subdivided by resource area (i.e., North and South resource areas) and
by formation (i.e., Upper and Middle Smackover Formations) |
|
124 |
| Table
16-1. Summary of brine production and injection well networks |
|
128 |
| Table
16-2. Conceptual design details for the proposed supply and injection wells |
|
132 |
| Table
17-1 Lithium content of the produced brine (feed to lithium extraction process) |
|
135 |
| Table
18-1. Power consumption for the brine supply well facilities |
|
141 |
| Table
18-2. Conceptual brine supply & sour gas pipeline details |
|
142 |
| Table
18-3. Power Consumption for the Brine Injection Well Facilities |
|
146 |
| Table
18-4. Barren Brine Pipeline Details |
|
147 |
| Table
20-1. Permit approval estimated timelines |
|
153 |
| Table
21-1. Pipeline material summary |
|
157 |
| Table
21-2. Lang Factors comparison between factors used in the Technical Report and AACE 59R-10 (2011) |
|
158 |
| Table
21-3. SWA Project capital expenditure cost estimate |
|
159 |
| Table
21-4. Management personnel |
|
160 |
| Table
21-5. Administrative personnel |
|
161 |
| Table
21-6. Security personnel |
|
161 |
| Table
21-7. Production personnel |
|
161 |
| Table
21-8. Shipping & receiving personnel |
|
162 |
| Standard Lithium Ltd. SW Arkansas Lithium Project PEA | | Page x |
| | | |
| Table
21-9. Maintenance personnel |
|
162 |
| Table
21-10. Quality control and laboratory personnel |
|
162 |
| Table
21-11. Manpower cost summary |
|
163 |
| Table
21-12. Entergy large power service rate sheet |
|
163 |
| Table
21-13. Electrical use and cost |
|
164 |
| Table
21-14. Average annual reagents cost for 30,000 tonnes LHM per year production |
|
165 |
| Table
21-15. Natural gas use |
|
166 |
| Table
21-16. Well facilities maintenance & servicing |
|
166 |
| Table
21-17. Pipelines ROW maintenance & servicing |
|
167 |
| Table
21-18. CPF Maintenance & Servicing Costs |
|
167 |
| Table
21-19. Solids disposal |
|
168 |
| Table
21-20. Miscellaneous direct operational costs |
|
168 |
| Table
21-21. TETRA brine lease agreement summary |
|
170 |
| Table
21-22. Well facilities and central processing plant land costs |
|
170 |
| Table
21-23. Pipeline right-of-way land costs |
|
171 |
| Table
21-24. Annual OPEX summary |
|
172 |
| Table
22-1. Annual operating cost summary |
|
175 |
| Table
22-2. Economic Evaluation – Case 1 (Base Case) Summary |
|
176 |
| Table
22-3. Sensitivity analysis to CAPEX variation |
|
177 |
| Table
22-4. Sensitivity analysis to OPEX variation |
|
177 |
| Table
22-5. Sensitivity analysis to product price variation |
|
177 |
| Table
25-1. Risk Assessment Matrix |
|
185 |
| Standard Lithium Ltd. SW Arkansas Lithium Project PEA | | Page xi |
| | | |
This
Technical Report has been commissioned by, and completed for, Standard Lithium Ltd. (Standard Lithium), a public company with its corporate
headquarters in Vancouver, British Columbia, Canada. Standard Lithium is focused on unlocking the lithium potential of existing large-scale
United States-based brine operations that include the LANXESS and South West Arkansas Lithium projects in south-central and west-central
Arkansas, respectively.
At
the South West Arkansas Lithium Project (SWA Project or Property), which is the focus of this Technical Report, Standard Lithium has
outlined how it could unitise the underlying Smackover Formation brine aquifer in conjunction with the preparation of a Preliminary Economic
Assessment (PEA). This Technical Report updates the 2019 maiden Inferred Resource estimate and applies a gross acreage with 100% brine
ownership that is consistent with unitisation within the Arkansas Brine Statute. This PEA also outlines a proposed method of extraction
of the brine from the resource, a proposed flowsheet to extract and purify the lithium to potentially produce a marketable product, as
well as other necessary SWA Project information.
| 1.2 | Property
Location and Ownership |
The
centre of the SWA Project is located approximately 24 km (15 miles) west of the City of Magnolia in Lafayette County, south western Arkansas,
United States. The SWA Property encompasses Townships 16-17 South and Ranges 22-24 West of the 5th Meridian and lies wholly
within Lafayette and Columbia counties.
The
SWA Property is comprised of 489 land tracts containing 802 individual leases and eight salt water (brine) deeds that covers 11,033 net
mineral hectares (27,262 net mineral acres). The proposed unitised SWA Property encompasses 14,638 gross mineral hectares (36,172 gross
mineral acres) and forms the updated 2021 resource and project area.
The
leases and deeds are held by TETRA Technologies Inc. (TETRA). Standard Lithium acquired the SWA Project brine production rights to lithium
directly from TETRA through an option agreement providing that Standard Lithium makes annual payments. TETRA began acquiring brine deeds
and/or brine leases in 1992 and added additional brine leases in 1994, 2006 and 2017. The SWA Project brine leases and deeds have yet
to be developed for production of brine minerals.
| 1.3 | Geology
and Inferred Resource Estimation |
The
lithium brine Inferred Resource, as reported, is contained within the Upper and Middle Members of the Smackover Formation, a late Jurassic
oolitic limestone aquifer that underlies the entire Project area. The Upper and Middle Smackover formations aquifer is situated at a
depth of approximately 2,700 m (or about 8,800 feet) beneath ground level. This brine resource is in an area where there is localised
oil and gas production, and where brine is produced as a by-product of hydrocarbon extraction. The data used to estimate and model the
resource were gathered from existing and suspended oil and gas production wells on or adjacent to the SWA Project and surface seismic
information.
| Standard Lithium Ltd. SW Arkansas Lithium Project PEA | Page 1 |
The
resource present in the Smackover Formation below the SWA Project was updated based on the proposed unitized area encompassing 36,172
gross mineral acres (14,638 gross mineral hectares. Using a cut-off criteria of 50 mg/L lithium, the SWA Project resource estimate is
classified as ‘Inferred’ according to the Canadian Institute of Mining (CIM) definition standards (see note 4 after Table
1-1). The total (global) in-situ ‘Inferred’ lithium brine resource is estimated at 225,000 tonnes of elemental lithium, or
1,195,000 tonnes lithium carbonate equivalent (“LCE”); see Table 1-1 below for more detail.
Table
1-1. SWA Project Inferred Resource estimation
| | |
Upper Smackover
Formation | | |
Middle
Smackover
Formation | | |
Total (and
main
resource)[1,2] | |
| Parameter | |
South
Resource
Area | | |
North
Resource
Area | | |
South
Resource
Area | | |
North
Resource
Area | | |
| |
| Aquifer
Volume (km3) | |
| 2.852 | | |
| 4.226 | | |
| 0.704 | | |
| 1.080 | | |
| 8.862 | |
| Brine
Volume (km3) | |
| 0.281 | | |
| 0.416 | | |
| 0.071 | | |
| 0.110 | | |
| 0.878 | |
| Average Lithium concentration (mg/L) | |
| 399 | | |
| 160 | | |
| 399 | | |
| 160 | | |
| 255 | |
| Average Porosity | |
| 10.1 | % | |
| 10.1 | % | |
| 10.3 | % | |
| 10.3 | % | |
| 10.1 | % |
| Total
Li inferred resource (as metal) metric tonnes [4][5] | |
| 112,000 | | |
| 67,000 | | |
| 28,000 | | |
| 18,000 | | |
| 225,000 | |
Total
LCE inferred resource (metric tonnes)[4][5] | |
| 596,000 | | |
| 354,000 | | |
| 152,000 | | |
| 93,000 | | |
| 1,195,000 | |
Notes:
[1]
Mineral resources are not mineral reserves and do not have demonstrated economic viability. There is no guarantee that all or any part
of the mineral resource will be converted into a mineral reserve. The estimate of mineral resources may be materially affected by geology,
environment, permitting, legal, title, taxation, socio-political, marketing, or other relevant issues.
[2]
Numbers may not add up due to rounding to the nearest 1,000 unit).
[3]
The resource estimate was completed and reported using a cut-off of 50 mg/L lithium.
[4]
The resource estimate was developed and classified in accordance with guidelines established by the Canadian Institute of Mining and
Metallurgy (CIM). The associated Technical Report was completed in accordance with the Canadian Securities Administration’s National
Instrument 43-101 and all associated documents and amendments. As per these guidelines, the resource was estimated in terms of metallic
(or elemental) lithium.
[5]
In order to describe the resource in terms of ‘industry standard’ lithium carbonate equivalent (LCE), a conversion factor
of 5.323 was used to convert elemental lithium to LCE.
| Standard Lithium Ltd. SW Arkansas Lithium Project PEA | Page 2 |
The
average lithium concentrations used in the resource calculation are 399 mg/L and 160 mg/L, for the South and North resource areas, respectively.
Resources have been estimated using a cut-off grade of 50 mg/L lithium.
With
respect to reconciliation of resources, the updated 2021 SWA Project resource is 49% larger than the 2019 resource estimate. This difference
is directly related to proposed future unitization of the resource area. More specifically, the total aquifer volume has increased from
7.66 km3 in 2019 to 8.86 km3 (1.84 mi3 to 2.13 mi3) in this Technical Report.
| 1.4 | Recovery
Method and Mineral Processing |
Standard
Lithium’s objective is to produce battery-grade lithium hydroxide monohydrate (LHM) from the brine produced from the Smackover
Formation. A network of 23 brine supply wells would produce from the Smackover Formation in the higher-grade South resource area averaging
about 1,715 m3/day per well for an aggregated total production of 39,452 m3/day (1,644 m3/hr or 7,238
US gallons per minute). Brine from the supply wells would be conveyed to a single combined lithium extraction and lithium hydroxide production
facility by a network of underground fibreglass pipelines totalling approximately 18.3 km (11.4 miles) in length. The brine entering
the processing facility would be pre-treated to remove hydrogen sulphide gas (H2S), suspended solids and hydrocarbons, prior
to processing by the Company’s proprietary direct lithium extraction process (LiSTR). After lithium extraction, the lithium depleted
brine is returned to the lower lithium-grade North resource area by a pipeline system 20.3 km (12.6 miles) in length to a network of
24 brine reinjection wells completed in the Smackover Formation. The project as proposed would produce, on average, 30,000 tonnes of
battery-quality LHM per year, over a 20-year timeframe. The final product lithium recovery is about 90%.
The
production process parameters are supported by bench scale metallurgical testing, mini-pilot plant testing and Demonstration Plant program
results. It is the Company’s plan to take large-scale brine samples from the SWA Property, and test using the LiSTR proprietary
technology, at the Demonstration Plant located at LANXESS’s South Plant. The Demonstration Plant is located about 40 km (25 miles)
east of the SWA Project. It is the Company’s intent to use the information obtained from the large-scale brine samples to gather
specific data related to lithium extraction scalability and economics.
| 1.5 | Capital
and Operating Cost Estimates |
| 1.5.1 | Capital
Expenditure Costs |
At
full build-out, with estimated average production over 20 years of 30,000 tonnes per annum of LHM, the direct capital costs are estimated
to be US$532 million, with indirect costs of US$205 million. A contingency of 25% was applied to direct costs (US$133 million) to yield
an estimated all-in capital cost of US$870 million. A summary of the capital costs is provided in Table 1-2.
| Standard Lithium Ltd. SW Arkansas Lithium Project PEA | Page 3 |
Table
1-2. Capital cost summary
| Description | |
Direct
Costs Million
US$[1] | | |
Indirect
Costs
Million US$[2] | |
| Extraction
and Reinjection Wellfield[3] | |
| 204.9 | | |
| 2.3 | |
| Pipelines[3] | |
| 38.7 | | |
| 2.5 | |
| Receiving/Pre-Treatment | |
| 35.4 | | |
| 28.1 | |
| Lithium Extraction (LiSTR) | |
| 135.0 | | |
| 103.8 | |
| Lithium Hydroxide Conversion | |
| 90.9 | | |
| 39.9 | |
| Utilities/Infrastructure | |
| 26.9 | | |
| 28.5 | |
| Contingency | |
| 133.0 | [4] | |
| - | |
| Total | |
| 664.8 | | |
| 205.1 | |
| CAPEX TOTAL | |
US$869.9 million | | |
| | |
Notes:
[1]
Direct costs were estimated using either vendor-supplied quotes, and/or engineer estimated pricing (based on recent experience) for all
major equipment. Major equipment prices were scaled using appropriate AACE Class 5 Direct Cost Factors (provided by the relevant
QP) to derive all direct equipment costs
[2]
Indirect costs were estimated using AACE Class 5 Indirect Cost Factors multiplied by the direct costs. Indirect costs include all
contractor costs (including engineering); indirect labor costs and Owner’s Engineer costs
[3]
Exceptions to above costing estimate methodology were the wellfield and pipelines, which were based on HGA’s recent project experience
in the local area
[4]
AACE Class 5 estimate includes 25% contingency on direct capital costs
| 1.5.2 | Operating
Expenditure Costs |
The
operating cost estimate includes both direct costs and indirect costs, as well as allowances for mine closure (see Table 1-3). The majority
of the operating cost comprises reagent usage required to extract the lithium from the brine, as well as conversion to LHM and electricity
consumption. Out of this, the greatest amount is related to acid and base consumption (hydrochloric acid and ammonium hydroxide) and
was estimated using information from the operating Demonstration Plant located in Union County, Arkansas. The all-in operating cost of
$2,599 per tonne of LHM is one of the lowest reported in the industry owing to two key factors which are location-specific. The direct
lithium extraction (DLE) processes are reagent intensive; in the case of the LiSTR process, the principal reagent is hydrochloric acid.
A large portion (approximately 50%) of the acid required is produced on-site as a by-product of the electrochemical conversion of lithium
chloride to lithium hydroxide. This results in significant cost-savings during the DLE step. The electrochemical conversion uses a large
quantity of electricity, which would normally (in most jurisdictions around the world) result in a cost disbenefit; however, bulk electricity
pricing in southern Arkansas is favorable (<6 cents/kWh), and hence results in overall lower-than-normal operating costs.
| Standard Lithium Ltd. SW Arkansas Lithium Project PEA | Page 4 |
Table
1-3. Operating cost summary
| Description | |
Operating Cost US$/tonne LHM[1] | |
| Workforce[2] | |
| 190 | |
| Electrical Power[3] | |
| 378 | |
| Reagents and Consumables[4] | |
| 836 | |
| Natural Gas[5] | |
| 39 | |
| Maintenance/Waste Disposal/Misc[6] | |
| 563 | |
| Indirect Operational Costs[7] | |
| 110 | |
| Royalties and Land/Lease Costs[8] | |
| 482 | |
| OPEX Total | |
| 2,599 | |
Notes:
[1]
Operating costs are calculated based on average annual production of 30,000 tonnes of LHM
[2]
Approximately 75 full time equivalent (FTE) positions
[3]
Approximately 40% of electrical energy consumed by wellfield and pipelines; 60% by the processing facilities
[4]
Majority of reagent costs are comprised of hydrochloric acid and ammonium hydroxide consumption. As discussed above, approximately 50%
of the required hydrochloric acid is produced on-site as a by-product of the electrochemical conversion of lithium chloride solution
to lithium hydroxide solution, resulting in a significant cost saving. Additional cost savings can be attributed to the on-site production
of concentrated sodium chloride solution, resulting from pre-concentration of the lithium chloride ahead of conversion. This sodium chloride
solution is used as a regenerant in some of the polishing ion exchange (IX) processes. Other reagents and consumables are air, lithium
titanate make-up (owing to small losses in the process), membrane replacement, nitrogen and scale inhibitors for pumps/wellheads.
[5]
Assumes that all natural gas is purchased from open market and none is co-produced at the wellheads
[6]
Includes all maintenance and workover costs and is based on experience in similar-sized electrochemical facilities, brine processing
facilities and Smackover Formation brine production wellfields
[7]
Indirect costs (insurance, environmental monitoring, community benefits etc.) are factored from other capital and operational costs,
except for mine closure, which is based on known well-abandonment costs
[8]
Based on agreed royalties and expected future lease costs. Does not include future lease-fees-in-lieu-of-royalties which are still to
be determined and subject to regulatory approval (lease-fees-in-lieu-of-royalties have been determined for bromine and certain other
minerals in the State of Arkansas, but have not yet been determined for lithium extraction)
The
SWA Project economics assumed a selling price of battery quality LHM based on an initial price of US$14,500/tonne in 2021, adjusted for
inflation at 2% per annum. The results for internal rate of return (IRR) and net present value (NPV) from the assumed CAPEX, OPEX and
price scenario at full production, are presented in Table 1-4.
| Standard Lithium Ltd. SW Arkansas Lithium Project PEA | Page 5 |
Table
1-4. Economic evaluation summary
| Description | |
Units | | |
Values | |
| Average Annual Production (as LiOH•H2O) | |
tpa[1] | | |
| 30,000 | [2] |
| Plant Operation | |
years | | |
| 20 | |
| Total Capital Cost (CAPEX) | |
US$ | | |
| 869,868,000 | [3] |
| Operating Cost (OPEX) per year | |
US$/yr | | |
| 77,972,000 | [4] |
| OPEX per tonne | |
US$/t | | |
| 2,599 | |
| Initial Selling Price | |
US$/t | | |
| 14,500 | [5] |
| Average Annual Revenue | |
US$ | | |
| 570,076,000 | [6] |
| Discount Rate | |
% | | |
| 8.0 | |
| Net Present Value (NPV) Pre-Tax | |
US$ | | |
| 2,830,190,000 | |
| Net Present Value (NPV) Post-Tax | |
US$ | | |
| 1,965,427,000 | |
| Internal Rate of Return (IRR) Pre-Tax | |
% | | |
| 40.5 | |
| Internal Rate of Return (IRR) Post-Tax | |
% | | |
| 32.1 | |
Notes:
All
model outputs are expressed on a 100% project ownership basis with no adjustments for project financing assumptions
[1]
Metric tonnes (1,000 kg) per annum
[2]
Total production for years 1 to 15 is 30,666 tpa LHM and 28,000 tpa LHM for years 16 to 20
[3]
AACE Class 5 estimate includes 25% contingency on direct capital costs
[4]
Includes all operating expenditures, ongoing land costs, established Royalties, sustaining capital and allowance for mine closure. All
costs are escalated at 2% per annum
[5]
Selling price of battery quality LHM based on an initial price of $14,500/t in 2021, adjusted for inflation at 2% per annum. Sensitivity
analysis modelled the starting price between US$12,500-US$16,500/t.
[6]
Average annual revenue over projected 20 year mine-life.
LHM
battery quality pricing sensitivity assessment was completed. LHM pricing was based upon a current price of $14,500 US/tonne adjusted
for inflation to the start of production in 2025. The sensitivity analysis is provided in Table 1-5 below.
| Standard Lithium Ltd. SW Arkansas Lithium Project PEA | Page 6 |
Table
1-5. Lithium Hydroxide Monohydrate sale rice post-tax sensitivity analysis
LHM
Price in 2021[1]
(US$/t) | | |
Post-Tax
NPV
(US$ Million) | | |
Post-Tax
IRR | |
| | 12,500 | | |
| 1,544.7 | | |
| 27.6 | % |
| | 13,500 | | |
| 1,755.1 | | |
| 29.9 | % |
| | 14,500 | | |
| 1,965.4 | | |
| 32.1 | % |
| | 15,500 | | |
| 2,175.8 | | |
| 34.2 | % |
| | 16,500 | | |
| 2,386.1 | | |
| 36.3 | % |
Note:
[1] 2% annual LHM price escalation from 2021 to
the start of production in 2025 was applied.
| · | The
total SWA Project Inferred Li-Brine Resource estimate is 1,195,000 tonnes of LCE. The volume
of resources will allow the lithium bearing brine extraction operations to continue well
beyond the currently assumed 20 years. |
| · | The
results of the geological evaluation and resource estimates for the PEA of SWA Project justifies
development of the project to further evaluate the feasibility of production of LHM. |
| · | The
experience gained from the long-term operations of the brine extraction and processing facilities
on the LANXESS controlled properties decreases the risk related to sustainability of the
brine extraction from the Smackover Formation. |
| · | Available
infrastructure (roads, rail, power, etc.), qualified work force and access to Gulf Coast
reagent supply will decrease the risks related to construction, and commissioning and operating
of the lithium extraction and LHM processing facilities. |
| · | The
results of the bench scale testing, mini-plant and operating Demonstration Plant at LANXESS
South Plant, increase the level of confidence in the key parameters for the operating cost
estimate. |
| · | Improvements
made to process efficiency, particularly the reduction of reagents and chemicals consumption,
will improve the economics of the SWA Project. |
This
preliminary economic assessment is preliminary in nature and includes inferred mineral resources that are considered too speculative
geologically to have the economic considerations applied to them that would enable them to be categorized as mineral reserves and there
is no certainty that this economic assessment will be realized.
| 1.8 | Key
Study Recommendations |
As
per the CIM guidelines for lithium-brine, and when reporting higher level of resource classification than reported in this PEA (i.e., Indicated
and Measured Brine Resources), the QP’s must consider only those resources that are, or may become, recoverable under reasonably
assumed technical and economic conditions. The logical next steps and work recommendations for Standard Lithium to elevate the SWA Project
to a higher level of resource classification and project definition is to:
| Standard Lithium Ltd. SW Arkansas Lithium Project PEA | Page 7 |
| 1. | Collect
additional brine samples from the Upper and Middle Smackover Formations either from existing
wells on the SWA Property, or recomplete existing/abandoned wells or install new wells (US$1.5mm); |
| 2. | Analyse
available Smackover Formation core at several locations from the Arkansas Geological Survey
at 0.3 m intervals throughout the Upper and Middle Smackover Formations to assess porosity
and permeability (US$0.1mm); |
| 3. | Perform
long-duration pumping tests to confirm aquifer properties (US$0.9mm); |
| 4. | Complete
reservoir and resource modelling (US$0.75mm); |
| 5. | Continue
with ongoing direct lithium extraction pre-commercial demonstration using brines from the
SWA Project (US$0.75mm); |
| 6. | Conduct
lithium chloride to lithium hydroxide conversion at suitable scale (US$1.0mm); |
| 7. | Complete
additional permitting and environmental studies where appropriate (US$0.5mm); and, |
| 8. | Conduct
all additional necessary engineering and pre-feasibility studies to integrate the project
development findings into an updated resource classification and prefeasibility study (PFS)
(US$1.5mm). |
The
authors recommend Standard Lithium approaches accomplishing these tasks over a two year period. The total estimated cost of the recommended
work including contingency is US$7,000,000.
| 1.9 | SW
Arkansas Project Related Risks and Uncertainties |
As
with any development project there exists potential risks and uncertainties. Standard Lithium will attempt to reduce risk/uncertainty
through effective project management, engaging technical experts and developing contingency plans. With respect to access, title, or
the right or ability to perform work on the property, Table 1-6 highlights some risks and uncertainties which have been identified at
this stage of project development.
Table
1-6. Risk Assessment Matrix
| Risk
No. |
Risk
Description |
Existing
Controls |
Initial
Risk (after Existing Controls) |
Risk
Treatment Plan |
Residual
Risk |
| 1 |
Brine
production of 1,800 m3/h and/or lithium concentration of 399 mg/L not available. Includes associated drilling risk. |
A
geological assessment, in addition to testing existing brine supply wells |
Medium |
Additional
testing of existing and new brine supply wells is planned. |
Low |
| Standard Lithium Ltd. SW Arkansas Lithium Project PEA | Page 8 |
| Risk
No. |
Risk
Description |
Existing
Controls |
Initial
Risk (after Existing Controls) |
Risk
Treatment Plan |
Residual
Risk |
| 2 |
If
innovative lithium extraction process does not perform as expected, could result in higher OPEX and CAPEX. |
Extended
pilot tests completed. |
Low |
Continued
operation and process optimization of Demonstration Plant operation.
This
will also not be the first commercial plant of this type |
Low |
| 3 |
If
electrochemical and associated Lithium Hydroxide conversion process does not perform as expected, it could result in higher OPEX
and CAPEX. |
Based
on existing chloralkali industry technology and specific experience with Lithium solutions. |
Medium |
Long-term
membrane testing with representative enriched LiCl solution planned, as well as pilot testing of commercial-scale electrochemical
cells. |
Low |
| 4 |
If
market price of LHM drops, project economics will be negatively affected. |
Demand
is increasing faster than supply is coming to the market.
Sensitivity
analysis shows favourable economics even for significantly lower Lithium Hydroxide price. |
High
|
To
evaluate alternate contracts with vendors to mitigate short term price decline. |
High |
| 5 |
Global
supply chain shortages / delays could influence schedule and CAPEX |
Understanding
long-lead items that would be impacted by supply chain constraints |
Medium |
A
mitigating action plan will be put in place to minimize supply chain risk. |
Low |
| 6 |
If
natural disaster occurs (e.g., tornado, earthquake), could result in loss of production. |
Understanding
of current risks at plant location. |
Medium |
Engineering
of the plant will take into account weather risks.
Provide
shelter for personnel. Design critical facilities to withstand moderate tornados and earthquakes. Carry special insurance. |
Low |
| 7 |
If
unknown infringement of sorbent and process patents occurs, could result in licensing claims. |
Conducted
freedom to operate searches. |
Medium |
Continue
patent research. Ensure contingency funds in place to cover licensing fees. |
Low |
| 8 |
Construction
cost/schedule overruns |
25%
contingency included in current economics.
Sensitivity
analysis shows favourable economics even for higher CAPEX |
Medium |
Work
with experienced EPC contractor; lump-sum turnkey where possible.
PFS
will provide improved cost confidence.
|
Low |
| Standard Lithium Ltd. SW Arkansas Lithium Project PEA | Page 9 |
| Risk
No. |
Risk
Description |
Existing
Controls |
Initial
Risk (after Existing Controls) |
Risk
Treatment Plan |
Residual
Risk |
| 9 |
Lithium
brine royalty assessment by the Arkansas Oil and Gas Commission is not completed in a timely manner and/or the royalty rates overly
impact project economics. |
Established
process completed for bromine and most recently for calcium chloride and magnesium chloride |
Medium |
Work
with experienced and qualified team and engage stakeholders early in the process. |
Low |
| Standard Lithium Ltd. SW Arkansas Lithium Project PEA | Page 10 |
This
Technical Report has been commissioned by, and completed for, Standard Lithium Ltd. (Standard Lithium, or the Company); a public company
with its corporate headquarters in Vancouver, B.C. Standard Lithium is focused on unlocking the lithium potential from brine. As such,
Standard Lithium has established ‘brine access agreements’ with historically/presently permitted and active brine operators
that include:
| § | TETRA Technologies Inc. (TETRA) and National Chloride Company of America (National Chloride) in the Mojave
Desert of California (Standard Lithium’s Bristol and Cadiz Dry Lakes play a Lithium-brine projects). |
| § | LANXESS Corporation (LANXESS) in the Smackover Formation of south-central Arkansas (Standard Lithium’s
LANXESS Lithium-brine project). |
| § | TETRA in the Smackover Formation of southwestern Arkansas (Standard Lithium’s SWA Project and the
focus of this Technical Report). |
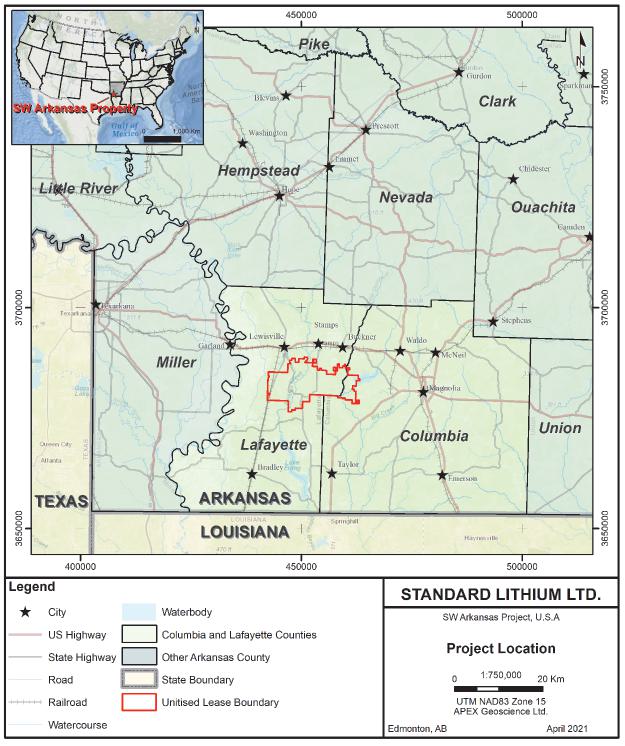
The
centre of SWA Property is located approximately 24 km (15 miles) west of the City of Magnolia in Lafayette County, Arkansas, United States
(Figure 2-1). The SWA Property encompasses Townships 16-17 South and Ranges 22-24 West of the 5th Meridian. The SWA Property
comprises 802 brine leases and eight salt water (brine) deeds from private mineral owners covering 11,033 net mineral hectares (27,262
net mineral acres).
At
the SWA Project, which is the focus of this report, Standard Lithium has outlined how it could unitise the underlying Smackover Formation
brine aquifer in conjunction with the preparation of a PEA. This Technical Report updates the 2019 maiden Inferred Resource estimate
and applies a gross acreage with 100% brine ownership that is consistent with unitisation within the Arkansas Brine Statute. This PEA
also outlines a proposed method of extraction of the brine from the resource, a proposed flowsheet to extract and purify the lithium
to potentially produce a marketable product, as well as other necessary SWA Project information.
| Standard Lithium Ltd. SW Arkansas Lithium Project PEA | Page 11 |
Figure
2-1. General location of the SWA Project discussed in this Technical Report.
Consequently,
this Technical Report provides an updated 2021 mineral resource estimate at the SWA Project in accordance with the Canadian Securities
Administration’s (CSA’s) National Instrument 43-101 (NI 43-101) with the mineral resource being estimated using the CIM “Estimation
of Mineral Resources and Mineral Reserves Best Practice Guidelines” dated November 29th, 2019 and the CIM “Definition
Standards for Mineral Resources and Mineral Reserves” amended and adopted May 10th, 2014. The effective date of
this Technical Report is November 20, 2021.
| Standard Lithium Ltd. SW Arkansas Lithium Project PEA | Page 12 |
| 2.2 | Technical
Report Authors and Personal Inspection of Property |
Table
2-1 presents the list of Qualified Persons (QPs) for the Technical Report and their responsibilities.
Table
2-1. Qualified Persons and their responsibilities
| Report Section | |
Qualified Person | |
Company |
| Section 1 Summary | |
Tony Boyd | |
NORAM |
| Section 2 Introduction | |
Tony Boyd | |
NORAM |
| Section 3 Reliance on Other Experts | |
Tony Boyd | |
NORAM |
| Section 4 Property Description and Location | |
Roy Eccles | |
APEX Geoscience Ltd. |
| Section 5 Accessibility, Climate, Local Resources, Infrastructure and Physiography | |
Roy Eccles | |
APEX Geoscience Ltd. |
| Section 6 History | |
Roy Eccles | |
APEX Geoscience Ltd. |
| Section 7 Geological Setting and Mineralization | |
Roy Eccles | |
APEX Geoscience Ltd. |
| Section 8 Deposit Types | |
Roy Eccles | |
APEX Geoscience Ltd. |
| Section 9 Exploration | |
Roy Eccles | |
APEX Geoscience Ltd. |
| Section 10 Drilling | |
Roy Eccles | |
APEX Geoscience Ltd. |
| Section 11 Sample Preparation, Analyses and Security | |
Roy Eccles | |
APEX Geoscience Ltd. |
| Section 12 Data Verification | |
Roy Eccles | |
APEX Geoscience Ltd. |
| Section 13 Mineral Processing and Metallurgical Testing | |
Ron Molnar | |
METNETH2O Inc. |
| Section 14 Mineral Resource Estimate | |
Roy Eccles | |
APEX Geoscience Ltd. |
| Section 15 Mineral Reserve Estimates | |
N/A | |
N/A |
Section 16 Mining Methods
Subsections 16.1
Subsections 16.2 – 16.4 | |
Steve Shikaze
Trotter Hunt | |
Matrix Solutions Inc.
HGA |
| Section 17 Recovery Methods | |
Tony Boyd | |
NORAM |
| Section 18 Infrastructure | |
Trotter Hunt | |
HGA |
| Section 19 Market Studies and Contracts | |
Tony Boyd | |
NORAM |
| Section 20 Environmental Studies, Permitting and Social or Community Impact | |
Rodney Breur | |
ECCI |
| Standard Lithium Ltd. SW Arkansas Lithium Project PEA | Page 13 |
| Report Section | |
Qualified Person | |
Company |
| Section 21 Capital and Operating Costs | |
Trotter Hunt | |
HGA |
| Section 22 Economic Analysis | |
Trotter Hunt | |
HGA |
| Section 23 Adjacent Properties | |
Roy Eccles | |
APEX Geoscience Ltd. |
| Section 24 Other Relevant Information | |
Tony Boyd | |
NORAM |
| Section 25 Interpretation and Conclusions | |
Tony Boyd | |
NORAM |
| Section 26 Recommendations | |
Tony Boyd | |
NORAM |
| Section 27 References | |
Tony Boyd | |
NORAM |
Note:
[1]
N/A denotes not applicable.
In
accordance with the CIM Best Practice Guidelines for Resource and Reserve Estimation for Lithium Brines (1 November 2012), this
lithium-brine PEA has been prepared by a multi-disciplinary team that includes geologists, hydrogeologists, chemical, process and civil
engineers with relevant experience in the lithium-brine confined aquifer type deposits, Smackover Formation geology and brine processing.
All
authors are independent of Standard Lithium (and TETRA) and are QPs as defined by the CSA’s NI 43-101.
Mr. Eccles
P. Geol. conducted a site inspection of the SWA Property on March 5-9, 2018. The site visit validated the Property and observed
active exploration at the Project in the form of using oil and gas infrastructure to obtain brine samples for analytical testing. The
site inspection validated the Project’s infrastructure including the primary and secondary roads, power, oil and gas wells, pipelines,
and availability of highly skilled labour for brine sampling of oil and gas wells.
Mr. Trotter
Hunt, P.E., visited the SWA Project proposed central processing facility site on November, 20, 2021, where the existing conditions, utilities
and local infrastructure of the property were verified. The area appeared consistent with the Property descriptions detailed herein.
| 2.3 | Sources
of Information |
This
PEA is a compilation of publicly available information, as well as information obtained from the 2018 exploration program. The 2018 exploration
program include core analysis and brine analytical test programs conducted by Standard Lithium at the SWA Property. References in this
Technical Report are made to publicly available reports that were written prior to implementation of NI 43-101, including government
geological publications. All reports are cited in Section 27, References.
Government
reports include those that provide:
| § | Smackover Formation stratigraphic information; |
| § | Arkansas policy and regulation; |
| § | Produced water geochemistry; and, |
| Standard Lithium Ltd. SW Arkansas Lithium Project PEA | Page 14 |
| § | Oil, gas and brine production statistics (e.g., Dickinson, 1968; Arkansas Code, 2016; Blondes et al.,
2016; Arkansas Geological Survey, 2018; AOG Commission, 2018 a to f). |
Miscellaneous
journal articles were used to set the geological setting of southern Arkansas (e.g., Bishop, 1967; Alkin and Graves, 1969; Bishop, 1971a
and b; Buffler et al., 1981; Moore and Druckman, 1981; Moore, 1984; Harris and Dodman, 1987; Salvador, 1991a and b; Troell and
Robinson, 1987; Kopaska-Merkel et al., 1992; Moldovanyi and Walter, 1992; Zimmerman, 1992; Heydari and Baria, 2005; Mancini et
al., 2008). Company information and news releases were used to reference any historical mineral exploration work at the SWA Property
(e.g., Standard Lithium Ltd., 2017, 2018a, b, and c).
Roy
Eccles has reviewed all government and miscellaneous reports related to Sections 7 and 8. Government reports and journal papers were
prepared by a person, or persons, holding post-secondary geology or related degrees. Based on review of these documents and/or information,
the author has deemed that these reports and information, to the best of his knowledge, are valid contributions to this Technical Report.
Therefore, Mr. Eccles takes ownership of the ideas and values as they pertain to the current PEA.
Geochemical
data collected in 2018 presented in this Technical Report were analysed at independent and accredited laboratories: ALS-Houston Environmental
Services (ALS-Houston) in Houston, Texas, and Western Environmental Testing Laboratory (WetLab) in Sparks, Nevada. Historical Smackover
Formation brine geochemical data from a peer reviewed journal were also used (Moldovanyi and Walter, 1992). Historical geotechnical data
presented in this Technical Report include core reports that were prepared by independent petroleum engineering firms that include:
| § | Core Laboratories Inc. in Dallas, TX and Shreveport, LA; |
| § | Delta Core Analysts in Shreveport, LA; |
| § | All Points Inc. in Houston, TX; |
| § | Thigpen Core Laboratories, Inc. in Shreveport, LA; |
| § | O’Malley Laboratories, Inc. in Natchez, Miss; and |
| § | Bell Core Laboratories in Shreveport, LA. |
Roy
Eccles has reviewed all government, manuscripts, and Company news releases, and found no significant issues or inconsistencies that would
cause one to question the validity of the data. Mr. Eccles has no issue with using these data to guide the background, history,
regional geology, and resource evaluation presented in this PEA (related to Sections 5, 6, 7, 14.1 – 14.9).
The
laboratories and/or engineering firms are independent and certified third-party consultants and/or include certified Professional Geologists
or Engineers. The geochemical laboratories for the brine samples collected in 2018 cite National and State accreditations (e.g., ISO/IEC
17025:2005; 2009 TNI Environmental Testing Laboratory Standard; DoD Environmental Laboratory Accreditation Program (DoD ELAP); ISO/IEC
Guide 25-1990; NAC 445A). Historical brine analytical data originated from a peer reviewed journal (American Association of Petroleum
Geologist Bulletin) and is considered a reputable source of information (Moldovanyi and Walter, 1992).
Roy
Eccles has reviewed the geotechnical and geochemical data and found no significant issues or inconsistencies that would cause one to
question the validity of the data (Section 12). Roy Eccles has contacted the geochemical laboratories used in the 2018 brine sampling
program to discuss analytical protocols and accreditations and is satisfied the data were created using standard methodologies in the
field of lithium-brine analytical work. Accordingly, Mr. Eccles has no issue using lithium concentrations provided by certified,
independent laboratories and historical information in the resource estimation presented in this PEA.
| Standard Lithium Ltd. SW Arkansas Lithium Project PEA | Page 15 |

| 2.4 | Units
of Measure, Currency, and Acronyms |
With respect to
units of measure and currency, unless otherwise stated, this Report uses:
| § | Abbreviated
shorthand consistent with the International System of Units (International Bureau of Weights
and Measures, 2006); |
| § | ‘Bulk’
weight is presented in both United States short tons (tons; 2,000 lbs or 907.2 kg) and metric
tonnes (tonnes; 1,000 kg or 2,204.6 lbs); |
| § | Geographic
coordinates projected in the Universal Transverse Mercator (UTM) system relative to Zone
15 of the North American Datum (NAD) 1983; and, |
| § | Currency
in Canadian dollars (CDN$), unless otherwise specified (e.g., U.S. dollars, USD$; Euros,
€). |
| § | Table
2-2 describes the various abbreviations used in the Technical Report. |
Table 2-2. Abbreviations
| Abbreviation | |
Description |
| mm | |
Micrometers |
| AACE | |
American
Association of Cost Engineers |
| ADEQ | |
Arkansas
Department of Environmental Quality |
| AOGC | |
Arkansas
Oil and Gas Commission |
| APEGA | |
Association
of Professional Engineers and Geoscientists of Alberta |
| ASTM | |
American
Society for Testing and Materials |
| BFD | |
Block
Flow Diagram |
| BOE | |
Basis
of Estimate |
| Br2 | |
Elemental
Bromine |
| btu/hr | |
British
Thermal Units per hour |
| CAPEX | |
Capital
Expenditure |
| CIM | |
Canadian
Institute of Mining |
| CIT | |
Corporate
Income Tax |
| CPF | |
Central
Processing Facility |
| CSA | |
Canadian
Securities Administration |
| DCF | |
Discounted
Cash Flow |
| DEQ | |
Division
of Environmental Quality |
| DLE | |
Direct
Lithium Extraction |
| EA | |
Environmental
Assessment |
| EGBC | |
Engineers &
Geoscientists British Columbia |
| EPA | |
Environmental
Protection Agency |
| ESP | |
Electric
Submersible Pump |
| ESS | |
Energy
Storage Systems |
| EVs | |
Electric
Vehicles |
| GPM | |
US Gallons
per Minute |
| H2S | |
Hydrogen
Sulphide |
| HDPE | |
High
Density Polyethylene |
| ICE | |
Internal
Combustion Engine |
| Standard Lithium Ltd. SW Arkansas Lithium Project PEA | Page 16 |
| Abbreviation | |
Description |
| ICP-MS | |
Inductively
Coupled Plasma Mass Spectroscopy |
| ICP-OES | |
Inductively
Coupled Plasma Optical Emission Spectroscopy |
| IRR | |
Internal
Rate of Return |
| ISBL | |
Inside
Boundary Limit |
| LAS | |
Log
ASCII Standard |
| LCE | |
Lithium
Carbonate Equivalent |
| LHM | |
Lithium
Hydroxide Monohydrate |
| Li2CO3 | |
Lithium
Carbonate |
| Li2O | |
Lithium
Oxide |
| LiOH.H2O | |
Lithium
Hydroxide Monohydrate |
| LPS | |
Large
Power Service |
| m/se | |
Meters
per second |
| m3 | |
Cubic
Meter |
| MCC | |
Motor
Control Center |
| mD | |
Millidarcies |
| mg/L | |
Milligrams
per litre |
| MKP | |
McKamie-Patton |
| MMBTU | |
Million
British Thermal Units |
| MW | |
Megawatts |
| MWh | |
Megawatt-hour |
| NAD | |
North
American Datum |
| NI
43-101 | |
National
Instrument 43-101 |
| NPDES | |
National
Pollutant Discharge Elimination System |
| NPV | |
Net
Present Value |
| OAT | |
One-Factor-at-a-Time |
| OEM | |
Original
Equipment Manufacturers |
| OPEX | |
Operating
Expenditure |
| PEA | |
Preliminary
Economic Assessment |
| PEO | |
Professional
Engineers Ontario |
| PFD | |
Process
Flow Diagram |
| ppm | |
Parts
Per Million |
| psi | |
Pounds
per square inch |
| PSS | |
Pregnant
Strip Solution |
| QA/QC | |
Quality
Assurance/Quality Control |
| QP(s) | |
Qualified
Person(s) |
| RCRA | |
Resource
Conservation and Recovery Act |
| RO | |
Reverse
Osmosis |
| ROW | |
Right-of-Way |
| RPD | |
Relative
Percentage Difference |
| RSD | |
Relative
Standard Deviation |
| SM | |
Standard
Methods |
| TDS | |
Total
Dissolved Solids |
| TEC | |
Total
Equipment Cost |
| TPC | |
Total
Plant Cost |
| UIC | |
Underground
Injection Control |
| USGS | |
United
States Geological Survey |
| UTM | |
Universal
Transverse Mercator |
| WetLab | |
Western
Environmental Testing Laboratory |
| Standard Lithium Ltd. SW Arkansas Lithium Project PEA | Page 17 |
| 3 | Reliance
of Other Experts |
The authors are
not qualified to provide an opinion or comment on issues related to legal agreements and royalties. Roy Eccles relied entirely on background
information and details regarding the nature and extent of TETRA’s Land Titles (Sections 4.1 to 4.3). The author has not reviewed
the approximately 802 leases and eight salt water (brine) deeds owned by TETRA or the transactional agreement between Standard Lithium
and TETRA (and/or the agreement between TETRA and the underlying landowners) to obtain mineral brine production rights. The legal and
survey validation of the leases and brine rights is not in our expertise and we are relying on Standard Lithium and TETRA’s land-persons
and lawyers.
Through personal
and written communication with TETRA (Mr. Roman Wolff of TETRA; November 14, 2018), and Standard Lithium’s Arkansas attorney
(Mr. Robert Honea of Hardin, Jesson & Terry PLC of Fort Smith, AR; during report preparation), the author of Section 4
has no reason to question the validity or good standing of the TETRA leases and brine deeds through which Standard Lithium is gaining
access to brine for process test work.
An opinion letter
provided by Standard Lithium’s Arkansas legal counsel, R. Christopher Lawson, P.A. (dated February 5, 2021), provided justification
that 1) the Company intends to implement the Brine Statute unitisation process and 2) the unitisation of the SWA Property provides the
most efficient pathway for the production process by protecting the production rights of the brine operator and the correlative rights
of mineral interest owners.
The QP of Section 4
relied on Standard Lithium’s management and legal representation with respect to the details of the brine option agreement summarized
in Section 4.2. This information was detailed in a press release by Standard Lithium (Standard Lithium Ltd., 2018a).
The QP of Section 4
has tried to adequately summarise the detail of the option agreement for the reader, but in doing so, have simplified the legal language
such that it might not be on par with full legal definition.
The QP of Section 4
relied on verbal information provided by Standard Lithium management regarding permitting and environmental status of the Property. This
information was provided by Standard Lithium during the preparation of the report and is summarised to the best of the author’s
knowledge in Section 4.5.
| Standard Lithium Ltd. SW Arkansas Lithium Project PEA | Page 18 |
| 4 | Property
Description and Location |
| 4.1 | Property
Description and Location |
The SWA Property
encompasses Townships 16-17 South and Ranges 22-24 West of the 5th Meridian. The centre of SWA Project is located approximately
24 km (15 miles) west of the City of Magnolia in Lafayette and Columbia Counties, Arkansas, United States. Coordinates for the Property
centre are:
| · | Latitude
33.2843 and Longitude -93.5135; or |
| · | Universal
Transverse Mercator 452185.15 Easting, 3682922.78 Northing, Zone 15N, North American Datum
83 (Figure 2.1). |
The SWA Property
consists of 11,033 net mineral hectares (27,262 net mineral acres) and covers about 110 km2 (42 square miles) and is comprised
of 489 land tracts containing 802 individual leases and 8 salt water (brine) deeds from private mineral owners, as illustrated in Figure
4.1. The proposed unitised area encompasses the individual leases and consists of 14,638 gross mineral hectares (36,172 gross mineral
acres).
| 4.2 | Lithium-Brine
Mineral Production Rights |
The SWA Project
consists of mineral brine production rights conveyed in 802 leases and eight salt water (brine) deeds. The mineral brine rights for the
leases and deeds are composed of a composite of properties totaling 11,033 net mineral hectares (27,262 net mineral acres) within the
entire SWA Property envelope of 14,638 hectares (36,172 acres).
Standard Lithium
acquired the SWA Project brine rights to produce lithium from TETRA through an option agreement. As part of the agreement between Standard
Lithium and TETRA, Standard Lithium owns the ‘Lithium-brine’ production rights within the SWA Property brine lease holding.
The Standard Lithium-TETRA agreement and a summary of the leases and deeds are discussed in more detail in following sub-sections.
| 4.2.1 | Summary
of the Standard Lithium – TETRA Agreement |
Standard Lithium
owns the rights to produce lithium from TETRA’s brine leasehold for a period of 10-years (the exploratory period) through an option
agreement providing that Standard Lithium makes annual payments on the annual anniversary of the effective date (December 29, 2017)
of the agreement with TETRA, as follows:
| · | US$500,000
before January 28, 2018 (paid) |
| · | An
additional US$600,000 on or before December 29, 2018 (paid) |
| · | An
additional US$700,000 on or before December 29, 2019 (paid) |
| · | An
additional US$750,000 on or before December 29, 2020 (paid) |
| · | Years
4-10: $1,000,000 per year |
When Standard Lithium
commences production of lithium, the option agreement is converted into production and Standard Lithium will pay TETRA a 2.5% royalty
on gross revenue, and not less than $1,000,000 in any year, starting on the date that Standard Lithium exercises the option, or after
the expiration of the 10-year exploratory period.
| Standard Lithium Ltd. SW Arkansas Lithium Project PEA | Page 19 |
Figure 4-1. SWA
Project discussed in this Technical Report.

| 4.2.2 | Summary
of Eight Salt Water (Brine) Deeds |
In 1992, TETRA
acquired the rights to 2,045 acres in the form of eight salt water (Brine) Deeds. The brine deeds are a 35-year term conveyance of brine
within the Smackover Formation limestone. The initial brine deeds were executed from March 23 to April 29, 1992 and will expire
in 2027 unless the term is extended by agreement.
| Standard Lithium Ltd. SW Arkansas Lithium Project PEA | Page 20 |
The Brine Deeds
permit TETRA or its assignee to produce brine attributable to its Grantor’s interest in the covered lands without royalty becoming
due. Thus, with respect to those Grantors’ brine interests, no delay rental or brine royalty payment is required, and no additional
royalty will become due upon commercial extraction of lithium. Instead, TETRA is obligated to make annual promissory note installment
payments of $79,125, in the aggregate, on promissory notes executed by TETRA in favor of the Grantor and its related parties. These notes
provide for 35 annual installments, coinciding with the term of the Brine Deed.
| 4.2.3 | Summary
of 802 Leases |
In 1994, TETRA
implemented a brine leasing strategy and added additional brine leases in 2006 and 2017-2018 bringing their total lease holdings to 802
leases at the Effective Date of this Technical Report. Except for three (3) leases with five-year terms dated 26 September 2018,
representing 240 acres, each lease has a 25-year term and the leases are being renewed prior to the expiration of the original 25-year
term. The SWA Property brine leases have yet to be developed for production of brine minerals.
| 4.2.4 | Mineral
Brine Right Distribution on Individual Leases |
In some instances,
the property encompassed by an individual brine lease may be very small, less than one hectare, or much larger, up to several hundred
hectares. The percentage of brine rights ownership varies from section to section. In some instances, the percentage of the area leased
within an individual brine lease may be small, less than 10%, or up to 100% ownership within any arbitrary section.
Overall, the lease
ownership is complex, however, Standard Lithium has conducted a due diligent compilation of the percentage ownership of the individual
brine leases on a section-by-section basis. That is, Standard Lithium engaged third-party firm R&J Land Services, LLC (R&J Land)
of Bossier City, Louisiana to conduct due diligence of TETRA title of the brine leases and salt water (brine) deeds.
Standard Lithium
also retained Arkansas attorney, Mr. Robert Honea, of Hardin, Jesson & Terry PLC of Fort Smith, AR regarded as having expertise
in Arkansas State brine as well as oil and gas law. Mr. Honea issued an opinion letter to Standard Lithium, prior to Standard Lithium
signing the Option Agreement with TETRA, after reviewing R&J Land’s review into the documentation of title to TETRA leasehold,
confirming his professional opinion that the title due diligence performed by R&J Land was reasonable.
Standard Lithium
previously engaged Mr. Christopher Lawson, an Arkansas lawyer who specialised in brine law as its outside counsel, and received
Mr. Lawson’s confirmation that after reviewing Standard Lithium’s documentation of the title due diligence, the net
acreage total represented by the title to validated leases appeared to be in good-standing. Prior to the publication of this Technical
Report, Mr. Lawson passed away, and the role of outside counsel with respect to Arkansas brine statutes has been taken up by Mr. Robert
Honea.
The resulting section-based
mineral brine lease percentage compilation is presented in Table 4-1 and Figure 4-2. To simplify the brine ownership for the purpose
of reporting, TETRA has amassed a mineral brine rights ownership that encompasses approximately 74% of the total mineral brine rights
at the SWA Property, of which, Standard Lithium has acquired the corresponding Li-brine production rights as described in Section 4.2,
Lithium Brine Mineral Production Rights.
| Standard Lithium Ltd. SW Arkansas Lithium Project PEA | Page 21 |
Table 4-1. SWA
Property ownership summary
| Township | |
Range | |
Section | |
Net
Acres
Leased | |
Total
Gross
Acres within Section1 | |
Percentage
Leased |
|
| |
Township | |
Range | |
Section | |
Net
Acres
Leased | |
Total
Gross
Acres within Section1 | |
Percentage
Leased |
|
| 16 | |
22 | |
31 | |
37.815 | |
200 | |
19 | % |
| |
17 | |
23 | |
10 | |
308.19 | |
640 | |
48 | % |
| 16 | |
23 | |
19 | |
80 | |
80 | |
100 | % |
| |
17 | |
23 | |
11 | |
140 | |
640 | |
22 | % |
| 16 | |
23 | |
24 | |
40 | |
50 | |
80 | % |
| |
17 | |
23 | |
12 | |
315 | |
640 | |
49 | % |
| 16 | |
23 | |
25 | |
80 | |
80 | |
100 | % |
| |
17 | |
23 | |
13 | |
450 | |
640 | |
70 | % |
| 16 | |
23 | |
26 | |
20 | |
80 | |
25 | % |
| |
17 | |
23 | |
14 | |
573.8 | |
600 | |
96 | % |
| 16 | |
23 | |
29 | |
192.5 | |
195 | |
99 | % |
| |
17 | |
23 | |
15 | |
368.32 | |
478.32 | |
77 | % |
| 16 | |
23 | |
30 | |
213.84 | |
516.34 | |
41 | % |
| |
17 | |
23 | |
16 | |
409.38 | |
640 | |
64 | % |
| 16 | |
23 | |
31 | |
610 | |
640 | |
95 | % |
| |
17 | |
23 | |
17 | |
585.46 | |
640 | |
91 | % |
| 16 | |
23 | |
32 | |
511.67 | |
545 | |
94 | % |
| |
17 | |
23 | |
18 | |
570.83 | |
640 | |
89 | % |
| 16 | |
23 | |
33 | |
278.83 | |
335.36 | |
83 | % |
| |
17 | |
23 | |
19 | |
207.497 | |
640 | |
32 | % |
| 16 | |
23 | |
34 | |
255.33 | |
296.6 | |
86 | % |
| |
17 | |
23 | |
24 | |
125 | |
165 | |
76 | % |
| 16 | |
23 | |
35 | |
192.58 | |
499.33 | |
39 | % |
| |
17 | |
23 | |
31 | |
14.92 | |
40 | |
37 | % |
| 16 | |
23 | |
36 | |
160 | |
640 | |
25 | % |
| |
17 | |
24 | |
1 | |
561.489 | |
640 | |
88 | % |
| 16 | |
24 | |
25 | |
586.66 | |
640 | |
92 | % |
| |
17 | |
24 | |
2 | |
551.134 | |
640 | |
86 | % |
| 16 | |
24 | |
26 | |
566.71 | |
640 | |
89 | % |
| |
17 | |
24 | |
3 | |
525.491 | |
640 | |
82 | % |
| 16 | |
24 | |
27 | |
36.67 | |
40 | |
92 | % |
| |
17 | |
24 | |
4 | |
498.78 | |
640 | |
78 | % |
| 16 | |
24 | |
34 | |
136.67 | |
160 | |
85 | % |
| |
17 | |
24 | |
5 | |
562.46 | |
640 | |
88 | % |
| 16 | |
24 | |
35 | |
593.68 | |
640 | |
93 | % |
| |
17 | |
24 | |
8 | |
397.95 | |
640 | |
62 | % |
| 16 | |
24 | |
36 | |
613.33 | |
640 | |
96 | % |
| |
17 | |
24 | |
9 | |
461.46 | |
640 | |
72 | % |
| 17 | |
22 | |
5 | |
407.5 | |
640 | |
64 | % |
| |
17 | |
24 | |
10 | |
594.76 | |
640 | |
93 | % |
| 17 | |
22 | |
6 | |
473.92 | |
640 | |
74 | % |
| |
17 | |
24 | |
11 | |
627.58 | |
640 | |
98 | % |
| 17 | |
22 | |
7 | |
640 | |
640 | |
100 | % |
| |
17 | |
24 | |
12 | |
623.87 | |
640 | |
97 | % |
| 17 | |
22 | |
8 | |
160 | |
160 | |
100 | % |
| |
17 | |
24 | |
13 | |
638 | |
638 | |
100 | % |
| 17 | |
22 | |
17 | |
276 | |
280 | |
99 | % |
| |
17 | |
24 | |
14 | |
525.48 | |
640 | |
82 | % |
| 17 | |
22 | |
18 | |
560 | |
640 | |
88 | % |
| |
17 | |
24 | |
15 | |
535.78 | |
640 | |
84 | % |
| 17 | |
22 | |
19 | |
320.5 | |
320.5 | |
100 | % |
| |
17 | |
24 | |
16 | |
600 | |
640 | |
94 | % |
| 17 | |
22 | |
20 | |
357.5 | |
400 | |
89 | % |
| |
17 | |
24 | |
17 | |
640 | |
640 | |
100 | % |
| 17 | |
23 | |
1 | |
31.27 | |
640 | |
5 | % |
| |
17 | |
24 | |
20 | |
290.846 | |
640 | |
45 | % |
| 17 | |
23 | |
2 | |
405 | |
640 | |
63 | % |
| |
17 | |
24 | |
21 | |
446.53 | |
640 | |
70 | % |
| 17 | |
23 | |
3 | |
556.92 | |
640 | |
87 | % |
| |
17 | |
24 | |
22 | |
498 | |
640 | |
78 | % |
| 17 | |
23 | |
4 | |
270.64 | |
640 | |
42 | % |
| |
17 | |
24 | |
23 | |
614.3 | |
640 | |
96 | % |
| 17 | |
23 | |
5 | |
351.5 | |
640 | |
55 | % |
| |
17 | |
24 | |
24 | |
452.71 | |
640 | |
71 | % |
| 17 | |
23 | |
6 | |
554.17 | |
640 | |
87 | % |
| |
17 | |
24 | |
25 | |
20 | |
40 | |
50 | % |
| 17 | |
23 | |
7 | |
498.83 | |
640 | |
78 | % |
| |
17 | |
24 | |
26 | |
206.39 | |
320 | |
64 | % |
| 17 | |
23 | |
8 | |
541.04 | |
640 | |
85 | % |
| |
17 | |
24 | |
35 | |
240 | |
240 | |
100 | % |
| 17 | |
23 | |
9 | |
429.51 | |
640 | |
67 | % |
| |
17 | |
24 | |
36 | |
40 | |
640 | |
6 | % |
| | |
| |
Total | |
12,040.59 | |
16,398.13 | |
| |
| |
| |
| |
Total | |
15,221.407 | |
20,441.32 | |
| |
| Standard Lithium Ltd. SW Arkansas Lithium Project PEA | Page 22 |
Figure 4-2. SWA
Property ownership summary
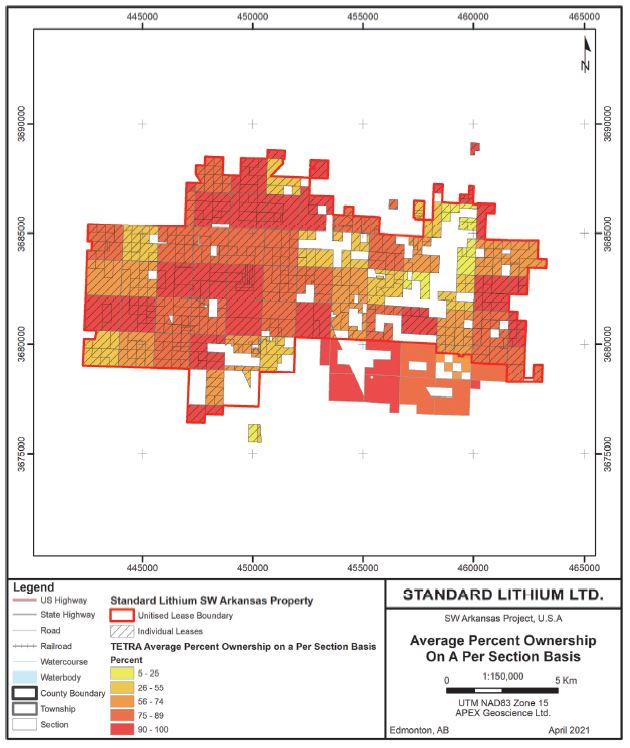
| 4.3 | Surface
(and Mineral) Rights in Arkansas |
The definition
of minerals is established by Arkansas Code Title 15, Natural Resources and Economic Development § 15-56-301 (the Brine Statue),
which has been amended to include salt water, or brine, “whose naturally dissolved components or solutes are used as a source
of raw material for Bromine and other products derived therefrom." The mineral interest owner has the inherent right to develop
the minerals and the right to lease the minerals to others for development. When a company desires to develop the mineral resources in
an area, the company will need to secure mineral lease agreements from the mineral owners. The mineral lease is a legal binding contract
between the mineral owner (Lessor) and an individual or company (Lessee), which allows for the exploration and extraction of the minerals
covered under the lease.
| Standard Lithium Ltd. SW Arkansas Lithium Project PEA | Page 23 |
Payments made to
the Lessor for production of brine are known as “in lieu” royalty payments because the payments are made annually based on
a statutory rate, as opposed to a true royalty based on the amount of the produced brine. The statutory in lieu royalty payment is increased
or decreased annually based on changes in the Producer Price Index.
The Brine Deeds
permit TETRA or its assignee to produce brine attributable to its Grantor’s interest in the covered lands without royalty becoming
due. Thus, with respect to those Grantors’ brine interests, no delay rental or brine royalty payment is required, and no additional
royalty will become due upon commercial extraction of Lithium. Instead, TETRA is obligated to make annual promissory note installment
payments of $79,125, in the aggregate, on promissory notes executed by TETRA in favor of the Grantor and its related parties. These notes
provide for 35 annual installments, coinciding with the term of the Brine Deed. TETRA is also required to pay annual rental of $100 each
to the two surface owners who leased the surface right of ingress and egress to TETRA in documents called “Landowner Agreements.”
With respect to
surface rights, Arkansas law allows the severance of the surface estate from the mineral estate by proper grant or reservation, thereby
creating separate estates. Under the laws of conservation in the State of Arkansas, however, the mineral rights are dominant over the
surface rights. In some cases, when the mineral owner leases the right to produce oil, gas and/or brine, the Lessee succeeds to the mineral
owner’s right of surface use, subject to lease restrictions. Authority of the mineral estate over the surface is a crucial legal
concept for the mineral owner and Lessee because ownership of subsurface minerals without the right to use the surface to explore for
and produce them would be practically worthless. If a Lessor does not want the land surface disturbed a “No Surface Operations
Clause” may be negotiated with the Lessee and included in the mineral Lease agreement. This clause may be used to limit or restrict
the use of the property for drilling activity or long-term production operations. Conflicts arising between the Lessee and surface owner
can be avoided by creating Lease agreements that clearly identify the scope of surface use rights.
The Lessee holding
the Lease has a legal authority to enter the property for exploration and production even if the non-mineral owning surface owner objects
to the intrusion on the property. That does not mean the surface owner will be without compensation. The amount and type of compensation
is strictly a matter of negotiation between the surface owner and the company entering the property. If mutual agreement cannot be reached,
the surface owner always has the right to seek the advice of an attorney and relief through the court system.
In the State of
Arkansas when a person sells a piece of property the mineral rights automatically transfer with the surface rights, unless otherwise
stated in the deed.
The Arkansas Brine
Statute (AR Code § 15-76-301) was adopted by the Arkansas General Assembly in 1979 in response to expanding brine operations in
southern Arkansas. Under the statute, the AOGC can authorise brine production units that contain one or more production/injection wells
within a set amount of acreage to 1) provide a more efficient regulatory structure for the production of brine, 2) to protect the correlative
rights of all mineral interest owners in the unit, and 3) to insulate brine operators from claims of trespass from adjacent mineral interest
owners. Under the Brine Statute, brine owners are paid an annual amount known as an “in lieu royalty” based on a specific
formula in the Brine Statute which is subject to annual adjustments under the applicable Producer Price Index.
| Standard Lithium Ltd. SW Arkansas Lithium Project PEA | Page 24 |
Standard Lithium
has contemplated how it might approach unitising the underlying Smackover Formation brine aquifer in conjunction with the preparation
of this PEA report. The unitised SWA Property encompasses 14,638 gross mineral hectares (36,172 gross mineral acres) and forms the updated
resource and project area.
NOTE, Standard
Lithium has NOT commenced the unitisation process; the exercise described herein is an attempt to estimate the potential integrated
lithium brine resource if Standard Lithium’s existing project leasehold area were to be unitised in the future for production,
as it would need to be.
In order to unitise
a contiguous area of acreage for brine production, the brine operator must file an application with the Commission supported by the following
evidence:
| · | A
description of the proposed brine unit. |
| · | A
proposed plan of development and operation. |
| · | Geological
and engineering data supporting the feasibility of the proposed plan and the efficacy of
the boundary lines of the proposed unit. |
| · | A
plat of the proposed unit indicating the tracts or parcels included in the unit and the proposed
location of production and injection wells. |
| · | A
list of owners within the unit. |
| · | Evidence
that the applicant has valid brine leases covering at least 75% of the net mineral acreage
within the entire area of the unit. |
| · | Evidence
that the operator has made reasonable efforts to lease all of the acreage within the proposed
unit. |
| 4.5 | Potential
Future Royalty Payments to Lessors |
The AOGC, in accordance
with Arkansas law, has established ‘drilling units’ that consist of a set amount of acreage to protect correlative rights
and ensure all mineral owners receive proper payment of production royalties (in the case of oil and gas production), and statutory in
lieu royalty payments (in the case of brine production). Given that future brine production from the Project would be derived from a
common aquifer in the Smackover Formation, the establishment of a unit(s) with defined boundaries would ensure that all mineral
owners potentially impacted by the producing well(s) would receive proper compensation.
The AOGC was given
the jurisdiction and authority to form brine production units in Ark. Code §§ 15-76-301 et seq. (the Brine Statute).
The AOGC's rules and regulations are available on-line at: www.aogc.state.ar.us/ along with its hearing schedule and production
data from 1992 forward. Pertinent provisions of the Brine Statute include:
| · | §15-76-308
which identifies who may make application for the establishment of brine production units
and states that a brine production unit may consist of no fewer that 1,280 contiguous surface
acres (Arkansas Code, 2016a); |
| · | §15-76-309
which prescribes what information must be provided in a petition to form a brine production
unit (Arkansas Code, 2016b); |
| Standard Lithium Ltd. SW Arkansas Lithium Project PEA | Page 25 |
| · | §15-76-312
which permits the owner of an interest in a tract of land that is adjacent to a brine production
unit and is not included in the unit, to petition for inclusion within the unit (Arkansas
Code, 2016c); |
| · | §15-76-314
which requires each owner of an unleased interest in an established production unit to elect
within 60 days from the effective date of the order to either participate affirmatively in
the operation or to transfer his interest in the brine to the participating producers; and |
| · | §
15-76-315, which provides as follows: |
| (c) | (1) In
addition to any other amounts due and owing by the producer or producers of any unit to the
owners therein, the producer or producers shall account separately and on a fair and equitable
basis to each owner in the unit for all substances which are found by the commission to be
profitably extracted from brine by a producer and which were not extracted by a producer
on January 1, 1979. |
(2) Whether
or not any such substance is extracted profitably shall be determined by the Oil and Gas Commission on the basis of the value at the
time of extraction, without interest, after deducting all costs of producing and recovering the same.
It is the expectation
of the AOGC that entities desiring to drill and operate an oil, gas or brine well in Arkansas will attempt in good faith to negotiate
a satisfactory mineral lease with mineral owners before resorting to the integration provisions of Arkansas law. In the case of brine
production, the operator will negotiate a per acre bonus consideration to be paid upon signing of the lease. Under the Brine Statute,
the AOGC will approve a unit for a brine operator when the operator files an application supported by the elements described in Section 4.3.1.
Moreover, pursuant
to Ark. Code Ann. § 15-76-315(c) (as quoted above), the AOGC must approve the royalty rate for any “additional substance”
profitably extracted from brine produced by an operator of a brine unit.
| 4.6 | Property
Environmental Liabilities and Permitting |
Environmental and
cultural impact studies pertaining to the possible future extraction of the Smackover Formation brine resource on the SWA Project are
presented in Section 20.
Several Federal
and State permits, and approvals are required for brine production in Arkansas, for example:
| · | U.S.
Environmental Protection Agency and the AOGC – Underground Injection Control Permit
and the Clean Air Act; |
| · | AOGC
– Operating Agreement; Arkansas Department of Environmental Quality (ADEQ) –
Operating Air Permit; and |
| · | Arkansas
Department of Pollution Control and Ecology – Arkansas Water and Air Pollution Control
Act. |
Currently there
is no brine production occurring on the SWA Project for the express purpose of mineral extraction. Brine is produced from the Smackover
Formation across and immediately adjacent to the Property as a normal part of oil and gas extraction operations, but any brine produced
is removed and disposed of as per normal oilfield activities.
| Standard Lithium Ltd. SW Arkansas Lithium Project PEA | Page 26 |
If Smackover Formation
brine from the SWA Project is to be used in the future for process testing work, some on-site pre-treatment may be required to remove
dissolved hydrogen sulphide (H2S), and all necessary permitting should be implemented accordingly.
| 4.7 | Risks
and Uncertainties |
As with any development
project there exists potential risks and uncertainties. Standard Lithium will attempt to reduce risk/uncertainty through effective project
management, engaging technical experts and developing contingency plans.
The following risks
and uncertainties have been identified at this stage of project development:
| · | Lithium
brine royalty assessment by the AOGC is not completed in a timely manner and/or the royalty
rates overly impact project economics. |
| · | Brine
access at the SWA Property is currently dependent on petroleum operators; hence there is
a risk that the oil and gas companies will shut down well production due to poor oil/gas
recovery. Standard Lithium would then have options such as purchasing the well, renting the
operation of the well, or drilling new wells as appropriate etc. With respect to unitisation,
it is possible that the AOGC recommends changes to the outline of the proposed unit area
used in this Technical Report, which would influence the area of resource estimation. |
| · | Unitisation
in-lieu royalty payments, which are meant to be to fair and equitable as determined by the
Commission, are subject to annual adjustments under the applicable Producer Price Index and
such changes may influence the preliminary economics of the project. |
| Standard Lithium Ltd. SW Arkansas Lithium Project PEA | Page 27 |
| 5 | Accessibility,
Climate, Local Resources, Infrastructure and Physiography |
The SWA Project
has an extensive all-season secondary road network. Access is provided by U.S. and Arkansas state highways. U.S. Highway 82 links the
cities of Lewisville, Stamps and Magnolia, running west-to-east, and U.S. Highway 371 runs just southeast of the Property (Figure 5-1).
Arkansas State Highways 29, 53, 313 and several improved county roads provide access to every section of the Property.
The nearest airport
is Magnolia Municipal Airport, located immediately to the east of the SWA Project, and approximately 5 km (3 miles) south-east of Magnolia
in Columbia County. In addition, there are two airports, one commercial and a small general aviation airport, located in Union County
near the city of El Dorado. El Dorado is approximately 55 km (34 miles) east of Magnolia.
Oil and gas extraction
related infrastructure are present across the SWA Project area, particularly in the northern and southern parts of the Property. This
infrastructure consists of wellheads, collection facilities for various fluids, batteries, gas processing plants and associated pipelines
and cleared easements. Much of the infrastructure is variably in use by junior operators, and the operation thereof can be cyclical depending
on hydrocarbon market conditions (for example, the McKamie Patton gas processing plant though potentially fully functional, is currently
under ‘care and maintenance’ operation).
The project area
climate is generally humid with average temperature and precipitation of 23.6 ºC (74.4 ºF) and 126.7 cm, respectively (49.8
inches; Figure 5-2). Annual rainfall is evenly distributed throughout the year. The wettest month of the year is June with an average
rainfall of 11.7 cm (4.6 inches). Temperatures in Magnolia during summer tend to be in the 30’s ºC (90's ºF), and cool
during winter when temperatures tend to be in the 10’s ºC (50's ⁰F). The warmest month of the year is July with
an average maximum temperature of 34 ºC (93 ºF), while the coldest month of the year is January with an average minimum
temperature of -2 ºC (30 ºF).
Lafayette County
has a total area of 1,430 km2 (545 square miles), of which 1,386 km2 is land-based (528 square miles) and 44 km2
is water-based (17 square miles). Columbia County has a total area of 1,996 km2 (767 square miles), of which 1,984 km2
is land-based (766 square miles), and 12 km2 is water-based (0.7 square miles).
In Arkansas, the
West Gulf Coastal Plain covers the southern portions of the state along the border of Louisiana. This Lowland area of Arkansas is characterized
by pine forests and farmlands. Natural resources include natural gas, petroleum deposits and bromine-rich brine resources. The lowest
point in the state is found on the Ouachita River approximate 90 km (56 miles) east of the Property in the West Gulf Coastal Plain of
Arkansas.
| Standard Lithium Ltd. SW Arkansas Lithium Project PEA | Page 28 |
Figure 5-1. SWA
Property with cities/towns and access routes, including major and secondary U.S. highways and railway lines.
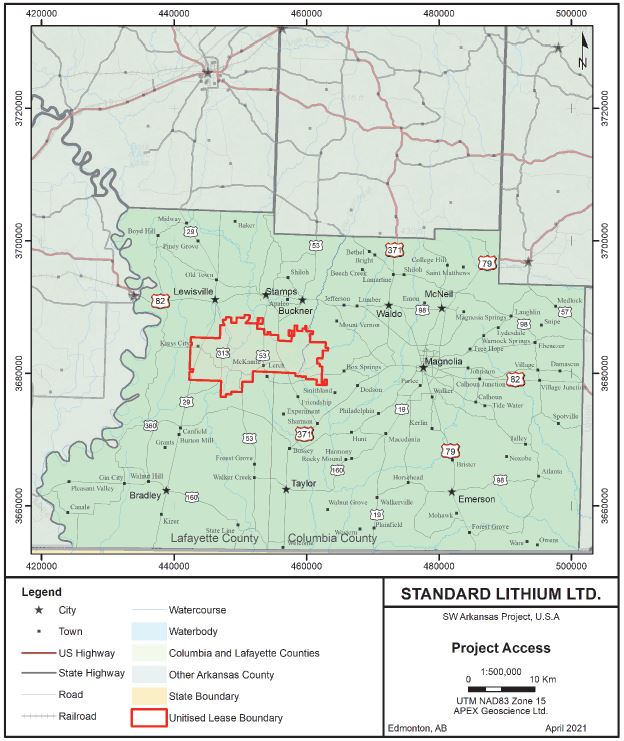
| Standard Lithium Ltd. SW Arkansas Lithium Project PEA | Page 29 |
Figure 5-2. Average
temperature and precipitation at Magnolia, AR.
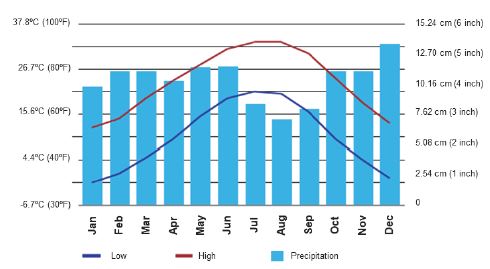
The terrain consists
of rolling hills with large timber farms and is sparsely populated by rural private residences. The largest nearby city is Magnolia,
located about 22 km (15 miles) to the east. Magnolia is the County Seat of Columbia County and has a population of approximately 11,500.
Magnolia is also the location of the main campus for the Southern Arkansas University and houses a student population of approximately
4,600. The combined population of Lafayette and Columbia Counties is estimated at approximately 31,000 based on census data from 2010.
| Standard Lithium Ltd. SW Arkansas Lithium Project PEA | Page 30 |
| 6.1 | Introduction
to Brine Production in Arkansas |
On January 10,
1921 Dr. Samuel T. Busey discovered oil in southern Arkansas with the completion of the well Busey No. 1 about 1.6 km (1 mile)
south of the City of El Dorado, AR. The discovery led to an oil boom that attracted thousands of explorers and workers. By 1923, the
petroleum region had attracted 59 oil contracting companies, 13 oil distributors and refiners and 22 oil production companies (The Encyclopedia
of Arkansas History & Culture). During World War II, El Dorado became a focal point for several chemical and munitions plants,
most of which closed shortly after the war. Oil, chemical, and timber interests continue to play a powerful role in the local economy.
Since the mid-1980s
(oil) and early 2000s (gas), the hydrocarbon industry has been in a steady state of decline in southern Arkansas. Conversely, brine production
steadily increased during the 1980s with consistent production to the present (Figure 6-1). These trends are in large part due to dwindling
petroleum reserves within the Smackover Formation reservoirs, which as they mature, produce more brine than hydrocarbon (Figure 6-1).
Brine production has continued due to the important realisation that the brine contained elements of interest (i.e., bromine).
When oil was first
discovered in south Arkansas, the brine was considered a worthless by-product of drilling/pumping. Industry realised, however, that the
Smackover Formation aquifer brine contained elevated elements such as bromine in addition to hydrocarbon (e.g., 3,000-5,000 mg/L bromine;
versus 65 mg/L in seawater; Mills et al., 2015; USGS, 2016). Accordingly, the commercial potential of bromine-brine gradually became
apparent (McCoy, 2014).
| Standard Lithium Ltd. SW Arkansas Lithium Project PEA | Page 31 |
Figure 6-1. Summary
of south Arkansas oil, gas and brine production (1960s up to 2017). Source: AOGC (July 3, 2018).
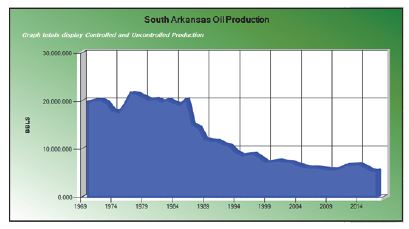
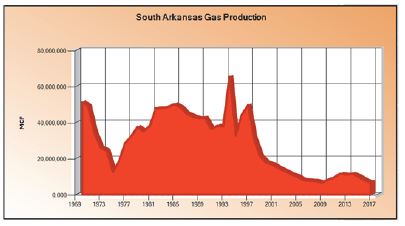

Bromine is one
of two elements that are liquid at room temperature and is found principally as a dissolved species in seawater, evaporitic (salt) lakes,
and underground brine. The primary uses for bromine compounds include brominated flame retardants, intermediates and industrial uses,
drilling fluids, and water treatment.
According to brine
production records maintained by the AOGC, Union and Columbia County’s 2017 brine production was 236 million barrels (37.5 million
m3) (Table 6-1). No brine production, based upon AOGC information, was identified from Lafayette County or within the boundaries
of the SWA Property, though it is known to occur as a by-product (‘produced water’) of oil and gas extraction in the SWA
Project area.
| Standard Lithium Ltd. SW Arkansas Lithium Project PEA | Page 32 |
Table 6-1. Southern
Arkansas 2017 brine production (US Barrels). Source: AOG Commission.
Field | |
County | |
2017
Production
(U.S. Barrels) | |
Cumulative
Production (1979- 2017; U.S. Barrels) |
| ATLANTA | |
Columbia | |
4,031,068 | |
116,873,573 |
| BIG CREEK | |
Columbia | |
2,283,859 | |
104,853,461 |
| BURNS POND | |
Union | |
10,558,813 | |
208,275,556 |
| CAIRO | |
Union | |
6,451,669 | |
337,407,996 |
| CATESVILLE | |
Union | |
23,071,993 | |
1,015,085,713 |
| HIBANK | |
Union | |
11,043,766 | |
240,589,321 |
| HOGG | |
Columbia | |
3,173,086 | |
60,394,390 |
| KERLIN | |
Columbia | |
3,334,437 | |
721,531,613 |
| KILGORE LODGE | |
Columbia | |
34,155,209 | |
1,282,438,515 |
| LISBON | |
Union | |
8,950,522 | |
327,965,505 |
| MAGNOLIA | |
Columbia | |
6,837,463 | |
139,826,117 |
| MARYSVILLE | |
Union | |
42,543,820 | |
959,062,930 |
| SCHULER EAST | |
Union | |
4,252,332 | |
168,143,975 |
| VILLAGE | |
Columbia | |
47,359,049 | |
565,577,752 |
| WARNOCK SPRINGS | |
Columbia | |
17,298,649 | |
476,448,432 |
| WILKS | |
Union | |
10,620,072 | |
935,963,963 |
| | |
| |
235,965,807 | |
7,660,438,812 |
| | |
Union | |
117,492,987 | |
4,192,494,959 |
| | |
Columbia | |
118,472,820 | |
3,467,943,853 |
Based upon a review
of the AOGC database no brine production was available for the Mars Hill, Kress City, McKamie NE, Liberty Church or Lewisville oil and
gas fields within the SWA Property.
Brine production
information is available along with Smackover Formation oil and gas production for the McKamie-Patton field, which is immediately adjacent
to the south of the Property. Table 6-2 summarizes production from six (6) wells that are producing from the Smackover Formation
with total brine production from 2013 to March 2018 of 4,123 m3 (25,930 bbls)
The QP has been
unable to verify AOGC brine production information specifically related to the SWA Property and therefore the analogy of brine production
in neighboring counties or oilfields is not necessarily indicative of potential brine production within the SWA Property. Having said
this, Standard Lithium was able to sample brine from wells on the Property and the Company conducted a hydrogeological characterisation
of the Project area. The reader is directed to Sections 10, Exploration and 14.5, Hydrogeological Characterisation to review this information
as it relates to brine potential at the SWA Property.
| Standard Lithium Ltd. SW Arkansas Lithium Project PEA | Page 33 |
Table 6-2. Oil,
gas and brine production for McKamie-Patton Smackover Formation wells from 2013 to March 2018. Source: Mission Creek Resources,
LLC.
| | |
| |
Oil | |
Gas | |
Water | |
| |
|
| | |
| |
production | |
production | |
production | |
Water/ | |
Water |
| Well name | |
Days on | |
(m3) | |
(m3) | |
(m3) | |
Oil(%) | |
cut(%) |
| McKamie Patton A Unit 2 | |
1,933 | |
806 | |
2,531 ,567 | |
365 | |
45.3 | |
31.2 |
| McKamie Patton A Unit 3 | |
1,842 | |
504 | |
1,853,149 | |
233 | |
46.2 | |
31.6 |
| McKamie Patton A Unit 12 | |
227 | |
118 | |
218,562 | |
52 | |
44.4 | |
30.8 |
| McKamie Patton A Unit 9 | |
1,947 | |
473 | |
1,622,595 | |
212 | |
44.9 | |
31.0 |
| McKamie Patton A Unit 8 | |
1,946 | |
6,963 | |
23,235,671 | |
3,210 | |
46.1 | |
31.6 |
| McKamie Patton A Unit 33 | |
832 | |
117 | |
321,787 | |
51 | |
43.5 | |
30.3 |
| | |
Average | |
1,497 | |
4,963,889 | |
687 | |
45 | |
31 |
| 6.2 | Regional
Assessment of the Lithium Potential of the Smackover Formation Brine (Discussion Extends
Beyond the Boundary of the SWA Property) |
This sub-section
discusses Li-brine that extends beyond the boundary of the SWA Property. The issuer and the QP disclaim adjacent property information
as being not necessarily indicative of the mineralisation on the SWA Property.
Brine aquifers
have different characteristics than, for example, traditional mineral deposits such as precious and base metal deposits. Any given aquifer
can have enormous sub-surface dimensions, and therefore, the scale of the Smackover Formation aquifer is important background information
to relate to the reader. The best way to do this is to provide discussion on the nature and extent of lithium brine potential of the
Smackover Formation.
The United States
Geological Survey (USGS) National Produced Waters Geochemical Database v2.2, contains geochemical information from wellheads across the
U.S. The database includes 165,960 produced water samples that were collected between 1886 and 2013 (Blondes et al., 2016). In addition
to the major element data, the database contains trace element, isotope, and time-series data that provide spatial coverage for specific
formations and/or aquifers. Quality control of the database must be performed by culling the data based on geochemical criteria (Blondes
et al., 2016); however, the authors have not filtered any data and include lithium-brine results directly from the USGS National Produced
Waters Geochemical Database.
The USGS National
Produced Waters Geochemical Database was searched for lithium-enriched brine specifically identified within: “Smackover”,
“Upper Smackover” or “Reynolds Member” of the Smackover Formation. The search was contained throughout southern
Arkansas within Union, Columbia and Lafayette Counties and the results are summarized in Figure 6-2. The highest recorded Lithium brine
in this USGS-compiled database occurs within the LANXESS Property (1,700 mg/L) followed by a sample with 1,430 mg/L in Columbia County
(approximately 5 km north east of the SWA Property) and 740 mg/L in northern Union County. Brine analyses with lithium values between
300 and 500 mg/L occur predominantly in Columbia County with a single recorded sample in Lafayette County located on the SWA Property.
Brine containing 100 to 300 mg/L of lithium occurs across all three counties.
The brine geochemical
data collected from the Moldovanyi and Walter (1992) study are included in the USGS National Produced Waters Geochemical Database. This
was a regional brine chemical study that collected and analysed Smackover Formation brine samples from 87 wells producing from 45 reservoirs
in southwest Arkansas, east Texas, and northern Louisiana. The study allowed these authors to hypothesize/conclude the following points
with respect to the regional distribution of the elevated Smackover Formation lithium brine:
| Standard Lithium Ltd. SW Arkansas Lithium Project PEA | Page 34 |
| · | Boron
and alkali metal (lithium, potassium, and rubidium) concentrations in Smackover Formation
waters exhibit coherent geochemical relations across the southwest Arkansas shelf; |
| · | In
general, the concentration of these elements is greater and more heterogeneous in hydrogen
sulfide-rich (H2S) brine than in hydrogen sulfide-free waters (see the authors’
hydrogen sulfide-rich polygon on Figure 6-2); and, |
| · | Regional
concentration gradients in hydrogen sulfide, boron, lithium, potassium, and rubidium suggest
fluids enriched in these elements may have migrated into the Smackover Formation reservoirs
from large-scale circulation of deep-seated waters along segments of the South Arkansas and
Louisiana State Line graben fault system (Moldovanyi and Walter, 1992). |
With respect to
the SWA Project, the Moldovanyi and Walter (1992) dataset includes four brine analyses within the boundaries of the Property (Figure
6-3). The brine contained lithium from 132 mg/L (Purser 2) to 432 mg/L (Cornelius 2). Based on these data, the brine in the southern
portion of the Property contains higher levels of lithium in comparison to the northern portion of the Property.
The brine from
the northern portion of the Property contains 132 mg/L (Purser 2) to 187 mg/L (Haberyan 1) of lithium for an average of 160 mg/L. Historical
brine samples collected from the southern portion of the Property ranged from 370 mg/L (Cornelius 2) to 423 mg/L (Cornelius 1) lithium
with an average of 397 mg/L.
| Standard Lithium Ltd. SW Arkansas Lithium Project PEA | Page 35 |
Figure 6-2. Regional
Smackover Formation lithium-brine values from the USGS National Produced Waters Geochemical Database. Source: USGS National Produced
Waters Geochemical Database (from Blondes et al., 2016). The H2S-rich belt and fault zones are from Moldovanyi and Walter,1992.
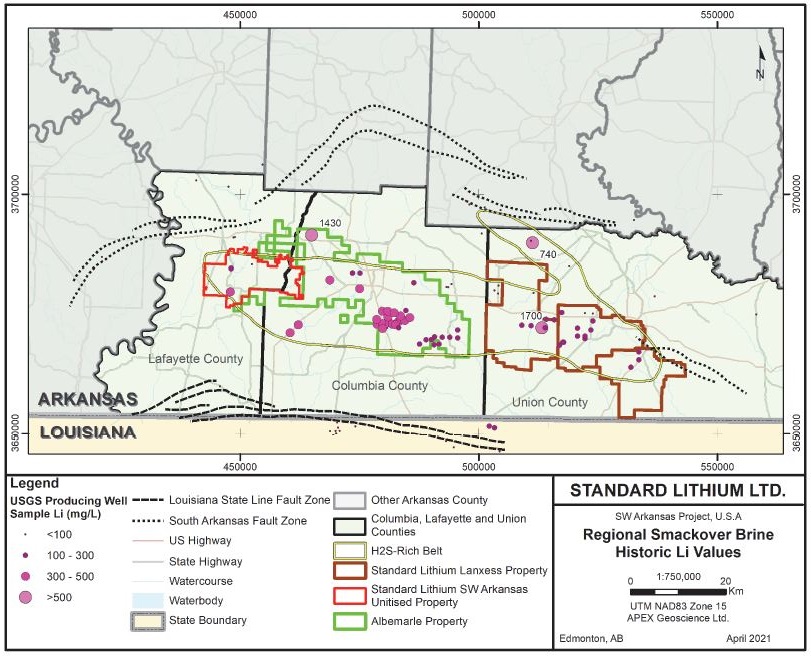
| Standard Lithium Ltd. SW Arkansas Lithium Project PEA | Page 36 |
Figure 6-3. Smackover
Formation lithium brine values derived within and surrounding the SWA Property. Source: from the USGS National Produced Waters Geochemical
Database, Blondes et al. (2016).
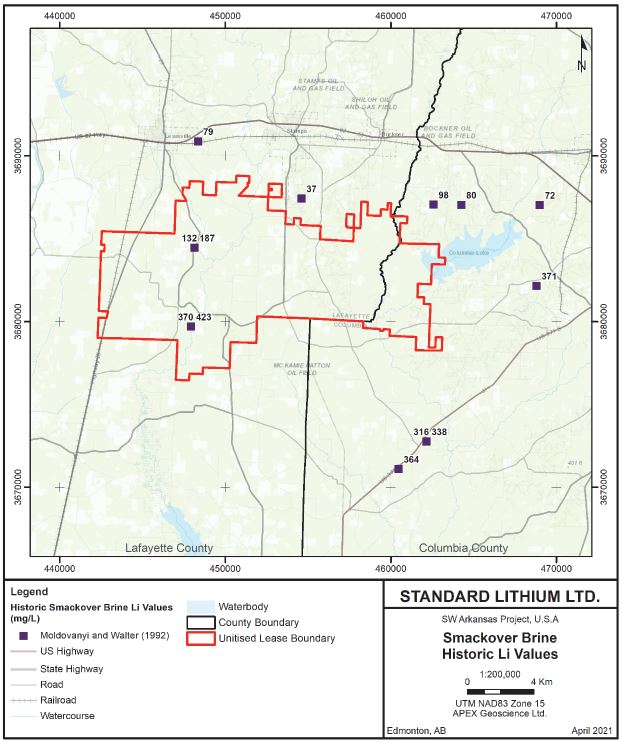
These data provide
independent historical documentation that the Smackover Formation brines contain lithium on the Property as well as the surrounding area.
This brine information on the Property will be used to provide data for resource estimation. Additional Smackover Formation brine samples
that have been collected from the Property by Standard Lithium are discussed further in Section 9.2 and Section 14.8.
| Standard Lithium Ltd. SW Arkansas Lithium Project PEA | Page 37 |
| 6.3 | SWA
Property Historical Infrastructure Summary |
Several Smackover Formation oilfields
were located on the SWA Property and included: Lewisville, McKamie-Patton, McKamie NE, Mars Hill, Mt. Vernon, and Kress City (AOGC, 2016).
Currently only the McKamie-Patton field is operating, and the other two fields were abandoned. On the SWA Property, 81 oil wells were
drilled by oil companies during exploration of the Smackover Formation (Figure 6-4).
All oil wells in
the SWA Property, except for those wells located in the McKamie Patton field, have been plugged-and-abandoned or suspended. The McKamie
Patton oil field is in the south-central portion of the SWA Property. The status of 33 total Smackover Formation wells within the McKamie-Patton
field is as follows:
| · | 11
of the 33 wells are either plugged (suspended) or abandoned; |
| · | 20
wells were completed; and, |
| · | 2
wells are currently producing (wells MKP-20 and MKP-21). |
The hydrocarbon
is collected from the wells and a gathering system of pipelines directs the oil and gas to a process facility owned by Mission Creek
Resources, LLC (Mission Creek). The McKamie Gas Processing Facility is located south of the SWA Property.
| Standard Lithium Ltd. SW Arkansas Lithium Project PEA | Page 38 |
Figure 6-4. Well
status on the SWA Property (wells with total depth >7,000 feet).
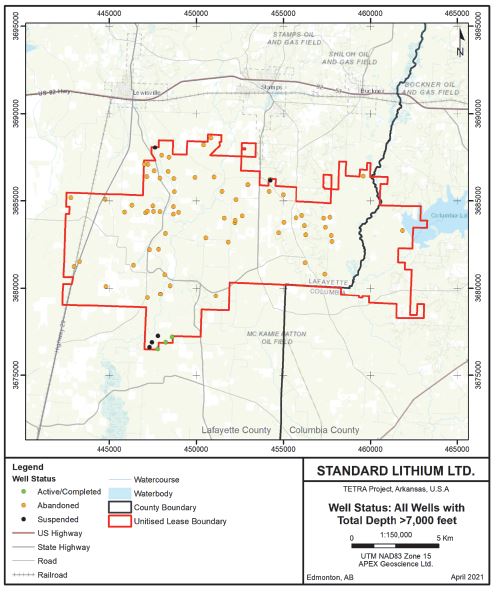
| Standard Lithium Ltd. SW Arkansas Lithium Project PEA | Page 39 |
| 7 | Geological
Setting and Mineralization |
The Gulf Coast
region formed as part of the complex breakup of the mega-continent Pangea starting about 180 million years ago (Ma). Development of one
of the northern supercontinents, Laurentia, involved geological factors that were crucial for the formation of a carbonate platform that
hosts vast reservoirs of lithium bearing brine. To communicate this unique geological environment to the reader, the author provides
a regional through to detailed scale geological review.
The regional geological
information includes a summary of the depositional framework of the Gulf Coast region and the ensuing Triassic-Jurassic stratigraphic
deposition with emphasis on the subject unit, the Smackover Formation. Detailed geological information is at the SWA Project scale and
introduces the geological and hydrogeological characteristics of the Upper and Middle Smackover Formations, which defines the resource
horizon being evaluated in this Technical Report.
| 7.1 | Gulf
Coast Tectono-Depositional Framework |
Deposition of the
Upper Jurassic Smackover Formation is directly linked to the evolution of the Gulf of Mexico. That is, the central Gulf Coast region
experienced Triassic-Jurassic rifting associated with the opening of the Gulf of Mexico and a divergent margin basin characterized by
extensional rift tectonics and wrench faulting (Pilger, 1981; Van Siclen, 1984; Salvador, 1987; Winker and Buffler, 1988; Buffler, 1991).
The history of the interior salt basins in central and eastern Gulf of Mexico includes a phase of: crustal extension and thinning; a
phase of rifting and sea-floor spreading; and a phase of thermal subsidence (Nunn, 1984; Mancini et al., 2008).
A proposed model
for the evolution of the Gulf of Mexico and related basin and arch formation in Mississippi, North Louisiana and Arkansas includes:
| 1. | Late
Triassic-Early Jurassic rifting that developed pronounced half-grabens bounded by listric
normal faults. This phase was accompanied by widespread doming, rifting, and filling of the
rift basin(s) with volcanic and non-marine siliciclastic sedimentary (red beds) rocks
as North America separated from Africa-South America (Buffler et al., 1981; Salvador, 1991a;
Sawyer et al.,1991; Marton and Buffler, 2016). |
| 2. | Middle
Jurassic rifting, crustal attenuation and the formation of transitional crust, characterized
by the evolution of a pattern of alternating basement highs and lows as the Gulf of Mexico
area broke up into a series of separate arches/uplifts and subsiding basins. Some of the
latter became isolated and filled with thick sequences of evaporites (Sawyer et al., 1991;
MacRae and Watkins, 1996; Mancini et al., 2008; Figure 7-1). |
| 3. | Late
Jurassic sea floor spreading and oceanic crust formation in the deep central Gulf of Mexico
characterized by a regional marine transgression related to crustal cooling and subsidence
(Sawyer et al.,1991). |
| 4. | Subsidence
continued into the Early Cretaceous with a ramping up of a Carbonate platform and deposition
of shallow to deep water sedimentary rocks along the margins of the basins. |
| 5. | Evolution
of the Gulf of Mexico region ended with a prominent period of igneous activity and global
sea level fall during the Late Cretaceous (mid-Cenomanian) that produced a major lowering
of sea level in the region and resulted in the exposure of the shallow Cretaceous platform
margin that rimmed the Gulf of Mexico (Salvador, 1991b). This event is defined by a Gulf-wide
unconformity that is most pronounced in the northern Gulf of Mexico area. |
| Standard Lithium Ltd. SW Arkansas Lithium Project PEA | Page 40 |
Given this scenario,
Upper Jurassic evaporite and sedimentary strata that form the integral geological units in this Technical Report, were deposited across
much of the Gulf of Mexico coast basin as part of a seaward-dipping wedge of sediment that accumulated in differentially subsiding basins
on the passive margin of the North American continent. These units include formations of the Louark Group: 1) the major lithium brine
and hydrocarbon reservoir/aquifer known as the Smackover Formation; and 2) the Smackover’s overlying and underlying aquitards,
the Buckner Anhydrite Member of the Haynesville Formation and the Norphlet Formation salt respectively.
The Smackover Formation
in south Arkansas consists of a shoaling-upward cycle capped by ooidal/oncolitic packstone and grainstone (Vestal, 1950), with a maximum
thickness of 365 m (1,200 feet). It has been interpreted as a low-gradient slope (<1°) homoclinal ramp succession due to
its series of strike-oriented, relatively narrow depositional lithofacies belts across Texas, Arkansas, Louisiana, and Mississippi (Ahr,
1973; Bishop, 1968; Handford and Baria, 2007; Figure 7-2). These belts include evaporite and redbed sequences in the north that change
basin-ward into ooidal (inner ramp beaches and shoals) peloidal facies belt (mid-outer ramp), and laminated mudstone (basin).
| Standard Lithium Ltd. SW Arkansas Lithium Project PEA | Page 41 |
Figure 7-1. Tectonic
framework of the northern part of the Gulf of Mexico region (from Marcini et al., 2008; who modified the work of MacRae and Watkins,
1996). The approximate location of the SWA Property is denoted with a red star.
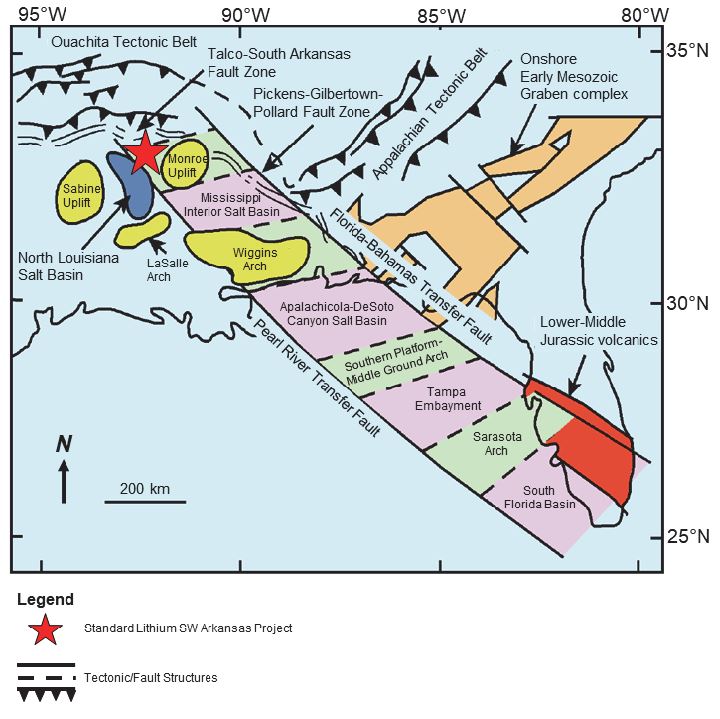
| Standard Lithium Ltd. SW Arkansas Lithium Project PEA | Page 42 |

Figure 7-2. Regional map of Smackover Formation
lithofacies belts in the U.S. Gulf Coast basin. Source is Handford and Baria (2007), who modified the work of Ahr (1973) and Bishop (1968).
The approximate location of the SWA Property is denoted with a red star.

| 7.2 | Triassic-Jurassic Stratigraphy |
A stratigraphic table of the Triassic-Jurassic
stratigraphy is presented in Table 7-1. The Smackover Formation and its surrounding geological formations are described in the text that
follows. During rifting phases, evolving grabens were filled with the earliest Late Triassic-Early Jurassic red-bed sedimentary sequences
of the Eagle Mills Formation (Table 7-1). This unit comprises a variety of terrestrial sedimentary rocks including red, reddish-brown,
purplish, and greenish-gray coloured shale, mudstone, siltstone, and lesser amounts of sandstone and conglomerate. In southern Arkansas,
the Eagle Mills Formation includes conglomeratic sandstone and red shale with igneous fragments (diabase). The Late Triassic-Early Jurassic
age is based on the study of remnant plants and radiometric dating of intrusive material (Scott et al., 1961; Baldwin and Adams, 1971).
| Standard Lithium Ltd. SW Arkansas Lithium Project PEA | Page 43 |
Table 7-1. Stratigraphic table of the Late Triassic
to Late Jurassic formations of the northern United States Gulf Coast (from Heydari and Baria, 2005).
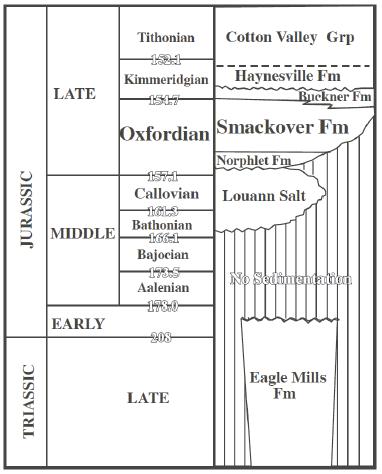
In central-north Louisiana and southern Arkansas,
rifting and continental crustal attenuation resulted in a period of non-deposition as evidenced by a 40-million-year hiatus of the depositional
record. Late Middle Jurassic (Bathonian–Callovian) depositional units include evaporite, red clastic, and basal conglomerate of
the Werner Anhydrite (Hazzard et al., 1947). The Werner-Louann sequence unconformably overlies the Eagle Mills Formation or older ‘basement’
rocks and forms the basal unit(s) for the overlying Late Jurassic Louark Group, which includes the Norphlet, Smackover and Haynesville-Buckner
Formations (Table 7-1). More notably, continued basin-wide restriction resulted in deposition of a thick succession of the Louann Salt
during the Callovian (over 3,050 m thick in some places; 10,000 feet; Salvador, 1990; Zimmerman, 1992). The Louann Salt has been estimated
to cover as much as 466,000 km2 (180,000 square miles) in the Gulf of Mexico region (Hazzard et al., 1947).
The South Arkansas fault system and the Louisiana
State Line graben are approximately parallel to regional strike of the Smackover Formation deposition and were active during the Jurassic,
likely resulting from salt tectonics in the underlying Louann Formation (see Figure 7-1; Bishop, 1973: Troell and Robinson, 1987). The
present up-dip limit of the Louann Salt is generally marked by the South Arkansas fault system; a feature believed to have been produced
during the Late Jurassic by downdip gravity sliding of the Louann Salt (Troell and Robinson, 1987).
The Upper Jurassic Norphlet Formation unconformably
overlies the Louann Salt and older units near the margins of the basin (Hazzard et al., 1947; Bishop, 1967). The Norphlet Formation was
deposited during a regional sea-level low stand. The maximum thickness of the Norphlet Formation is about 45 m (150 feet) and is comprised
of alluvial-fan sandstone and conglomerate, channel and interdune redbed and aeolian sandstone (Wade and Moore, 1993; Mancini et al.,
2008). Norphlet Formation fluvial deposition in southern Arkansas is characterized by gravel with interbedded red and grey mudstone (Mancini
et al., 2008) and is approximately 15 m (50 feet) thick (Zimmerman, 1992; Hunt, 2013).
| Standard Lithium Ltd. SW Arkansas Lithium Project PEA | Page 44 |
Marine deposition resumed during the late Oxfordian,
as the Late Jurassic seas transgressed, initiating the deposition of the Smackover Formation, which conformably overlies the Norphlet
Formation. The Smackover Formation is the focus of this Technical Report and is therefore described in detail in Section 7.3.
Smackover Formation Carbonate rocks are succeeded
by mixed evaporite, siliciclastic, and dolomite of the Buckner Formation, and then by a thick Kimmeridgian–Tithonian succession
of marine, deltaic, and fluvial siliciclastic rocks of the Haynesville Formation and the Cotton Valley Group (Table 7-1).
The Buckner Formation consists of evaporitic deposits
and associated redbeds, reflecting a depositional environment that is less marine, or shallower water marine, than those of the underlying
Smackover Formation (Salvador, 1987). The Buckner Formation is made up of intercalated 2 to 6 m thick salt/anhydrite and marine limestone
and extends from the Florida Panhandle to South Texas (Mann, 1988). Distinct facies change occurs along the crests of a line of anticlines
that extend from the Catesville oilfield in Union County westward to the Dorcheat-Macedonia field in Columbia County. North of this structural
trend, the Buckner Formation consists of, from top to bottom, nonmarine red shale, anhydrite, and dolomite (Akin and Graves, 1969). To
the south, equivalent beds become sandy. The anhydrite facies indicate the presence of a barrier restricting normal flow of seawater during
Buckner Formation deposition.
The Late Jurassic Cotton Valley Group in southern
Arkansas and northern Louisiana lies unconformably on the Haynesville Formation of the Louark Group (Table 7-1). In ascending order, Swain
and Anderson (1993) divided the Cotton Valley Group into the Millerton (siliciclastic, mainly shale, shelf unit), Shongaloo (foreshelf
and shelf edge silty shale and sandstone), and Dorcheat (sandstone and siltstone) Formations. The Millerton Formation, or Bossier marine
shale pinches out updip in southernmost Arkansas (Mancini et al., 2008). The Haynesville Formation conformably underlies the Bossier;
and where the Haynesville Formation is absent, the Bossier rests on the Smackover Formation limestone. In Arkansas, the Dorcheat Formation
contains increasing amounts of sandstone before pinching out (Forgotson, 1954).
The Smackover Formation was named after the Smackover
field, Union County, Arkansas, where oil was first produced. Hydrocarbons were discovered in the Late Jurassic Smackover Formation in
the mid-1920s. Since then, the Smackover Formation has produced large quantities of oil and gas in a production trend that extends over
an area of 100 km (62 miles) by 1,000 km (621 miles) on the margins of the Gulf of Mexico from Texas to Florida (Moore, 1984).
Consequently, the Smackover Formation has been
subject to many investigations that address the unit’s stratigraphy, lithofacies and depositional environment (e.g., Ahr, 1973;
Akin and Graves, 1969; Baria et al., 1982; Bishop, 1968, 1971a, 1973; Budd and Loucks, 1981; Moore and Druckman, 1981; Harris and
Dodman, 1982; Moore, 1984; Troell and Robinson, 1987; Chimene, 1991; Hanford and Baria, 2007; Marcini et al., 2008).
| Standard Lithium Ltd. SW Arkansas Lithium Project PEA | Page 45 |
Based on ammonite studies from the lower portion
of the unit, the Smackover Formation is late Oxfordian in age (Imlay, 1940). The Smackover Formation resulted from Carbonate
deposition under shoaling conditions following a relatively rapid transgression over the Norphlet Formation sandstone and Louann Salt.
The transgression extended as far northwards in the State of Arkansas to Ouachita County (directly north of Columbia County). The distribution
of facies of the ensuing Carbonate deposits was controlled by local paleotopography where high energy facies were deposited in nearshore
areas rimming exposed paleohighs and near the up-dip limit of Smackover Formation deposition. Lower-energy strata were deposited in basin
centres.
The Late Jurassic Smackover Formation in Arkansas
was traditionally divided into two members:
| 1. | An upper ooidal to chalky porous limestone; and |
| 2. | A lower member composed of dense argillaceous limestone and dark calcareous shale (Imlay, 1940; Figure
7-3). |
Jurassic rocks are not exposed in southern Arkansas,
and in southern Arkansas, the Smackover Formation oil and gas reservoir pay zone is situated at depths that range from 2,350 to 3,660
m below ground level (approximately 8,000 to 12,000 feet deep; Moore and Druckman, 1981; Marcini et al., 2008). Accordingly, the two Smackover
Formation members were divided based on their wire-line electric logs where the upper member has high self potential and lower resistivity,
and the lower member has low self potential and high resistivity.
More recently (e.g., Dickinson, 1968), and in
the general context of this Technical Report, the Smackover Formation has been divided into three informal units:
| 1. | The Upper Smackover Formation: An upper, clean, ooidal grainstone that forms the main reservoir rock type
of the region due to its high porosity and is also known as the Reynolds Member; |
| 2. | The Middle Smackover Formation: A middle unit composed of brown, dense, laminated, pelletal, lime-mudstone
and fossiliferous lime-wackestone. Locally the upper portion of this unit is also pelletoid and oolitic (Dickinson, 1968); and, |
| 3. | The Brown Dense: A lower Smackover Formation unit comprised of dark-brown, fine-grained, laminated, argillaceous,
lime-mud sequence (Dickinson, 1968; Moore and Druckman, 1981; Troell and Robinson, 1986). |
The correlating depositional environment and stratigraphic
interpretation of these three Smackover Formation sub-units is shown on Figure 7-3 and from top to bottom as:
| 1. | An ooidal beach complex and/or sand shoal. |
| 2. | A shelf high-stand system tract deposited at and near the time of maximum transgression, and during/after
a period of rapidly increasing water depth. During middle Smackover-time, prolific production of high-energy carbonate sediment on the
flanks of the paleohighs initiated a prograding phase of Smackover Formation deposition. |
| 3. | Transgressive systems tract deposits formed in shallow water during relative sea level standstill. The
ooidal deposits are generally arranged in a succession of stacked, upward-shallowing cycles that grade from subtidal strata at
their bases to shallower subtidal to supratidal strata at their tops (Benson, 1988; Mancini et al., 1990). |
| Standard Lithium Ltd. SW Arkansas Lithium Project PEA | Page 46 |
From southern Arkansas to northern Louisiana,
the Smackover Formation ranges from 0 to 365 m thick (0 to 1,200 feet; Dickinson, 1968). The upper Smackover Formation or Reynolds Member
lime-grainstone maintains a thickness of 90 to 120 m (300 to 400 feet) across southern Arkansas (Aiken and Graves, 1969) and reaches a
maximum thickness of almost 300 m (1,000 feet) near the Arkansas-Louisiana state line (Moore and Druckman, 1981). The Smackover Formation
thickens to the south of a westward-trending series of anticlines that extend from the Catesville oilfield in Union County westward to
the Dorcheat-Macedonia field in Columbia County until it interfingers with the Millerton Formation (Bossier shale) to the south.
Smackover Formation hydrocarbon traps include
structural and stratigraphic traps, and a combination of the two. Evaporites have played a role in Smackover Formation reservoir development.
Evaporites are found in the underlying Louann Salt, the overlying Buckner Formation and within the Smackover Formation itself.
| Standard Lithium Ltd. SW Arkansas Lithium Project PEA | Page 47 |
Figure 7-3. Stratigraphic depositional environments
of the Smackover Formation. The mineral resource estimated in this Technical Report includes the Upper Smackover Formation (Reynolds Member
on this figure) and the Middle Smackover Formation.
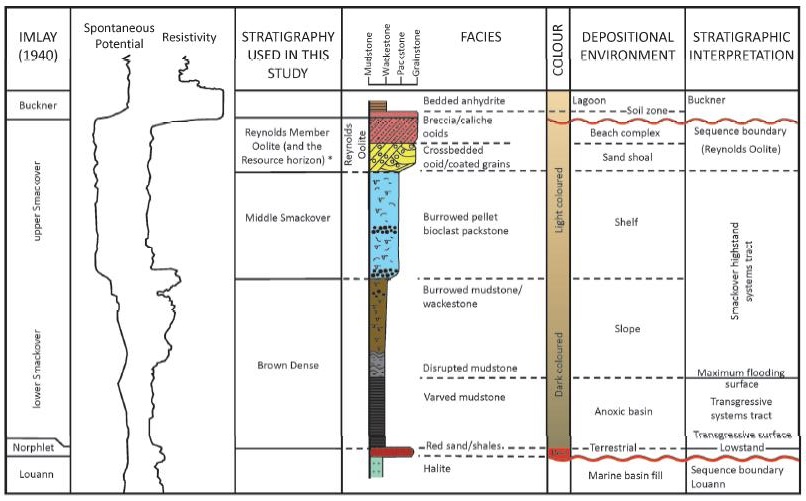
| Standard Lithium Ltd. SW Arkansas Lithium Project PEA | Page 48 |
Smackover Formation diagenesis was dominated by
early cementation, leaching of calcium carbonate allochems and dolomitization; other processes include: pressure solution, late
(post-dolomitization) calcite and anhydrite cementation, and fracturing, both tectonic and caused by collapse of partially dissolved rock
frameworks (Kopaska-Merkel et al., 1992). Early marine phreatic cementation was followed by leaching of ooids and widespread particle
dissolution that vastly increased porosity values (to 40% or more) but had little direct effect on permeability. Early dolomitization
of uppermost Smackover Formation strata by reflux of hypersaline brine was widespread and is responsible for formation and/or preservation
of many permeable Smackover Formation pore systems.
The Upper Smackover and Middle Smackover formations
are the target horizon for the mineral resource evaluation in this Technical Report. Their depositional models have been described as
follows:
| · | The Upper Smackover Formation or Reynolds Member
was deposited in a beach and/or shoal environment and composed of ooids and non-sketelal Carbonate that formed ooidal, chalky limestone
(Vestal, 1950; Tonietto and Pope, 2013). |
| · | The Middle Smackover Formation was deposited
in a high-stand system tract in response to sea level rise. The uppermost portion of the Middle Smackover Formation would have been in
the transition zone to a shallower sea water environment forming laminated, pelletal, lime-mudstone and fossiliferous lime-wackestone
and locally the upper portion of this unit is also pelletoid and oolitic limestone (Dickinson, 1968). |
These carbonate units are widespread, relatively
uniform in thickness and have definite patterns of regional and local lithic changes. The most common Smackover Formation reservoir rocks
occur with the Upper Smackover Formation, which can comprise a variety of grainstone and grainstone/packstone rock-units that often are
dominated by pellet, ooids and oncoids (Akin and Graves, 1969; Moore and Druckman, 1981; Troell and Robinson, 1987).
The occurrence of reservoir-grade rocks (porosity
of at least 6% and permeability of a least 0.1 mD) in the Smackover Formation is dependent on 1) deposition of porous and permeable sediments
in a variety of setting; and 2) diagenetic processes that have preserved, enhanced, or created porosity and permeability in originally
permeable and/or impermeable strata (Kopaska-Merkel et al., 1992).
| 7.4 | Property Geology: Characterization of the Smackover Formation |
To assess the SWA
Property a well review was completed. A summary of the statistics from the well data review include:
| · | 2,444 wells have been drilled into the subsurface
in the general SWA Property area, 2,041 of which were deep enough (2,135 m, or 7,000 feet) to penetrate the Upper Smackover Formation; |
| · | 104 wells had electric logs available within
the SWA Property that included the top of the Upper Smackover Formation; |
| · | 32 wells had electric logs available within the
SWA Property that included the base of the Upper Smackover Formation; |
| · | 19 wells had electric logs available within the
SWA Property that included the base of the Middle Smackover Formation; and, |
| · | 29 wells had density logs and/or porosity logs,
19 of which logged the entire Upper Smackover Formation. |
| Standard Lithium Ltd. SW Arkansas Lithium Project PEA | Page 49 |
These subsurface well data were acquired and entered
into a variety of geological interpretation software systems including PetraTM, Kingdom® and Logscan to evaluate
and show regional trends of the Smackover Formation throughout the SWA Property.
Based on analysis of the subsurface well data,
key geologic formations are relatively easy to correlate within the SWA Property area. The top portion of the Upper Smackover Formation
is comprised of a tight calcarenite-Carbonate mudstone facies. Below the top portion the Upper Smackover Formation is porous oöidal
stratigraphy that is usually well-defined on raster logs and/or log ASCII standard files (LAS).
To illustrate this, a ‘type log’ is
presented in Figure 7-4. The electric log from this well depicts the formation markers for the Buckner Formation, top and base of Upper
Smackover Formation and Lower Smackover Formations. The Reynolds Member ooidal limestone portion of the Upper Smackover Formation is depicted
on the log as having a noticeably lower gamma ray signature and distinct ‘gap’ in resistivity between the medium and deep
induction logs, and the spherically focused log (light blue highlighted zone on Figure 7-4).
To determine the continuity and lateral extent
of the Upper Smackover Formation within the SWA Property, electric logs from 49 wells were used to develop five cross-sections, three
of which are presented in this Technical Report. The locations of the three cross-sections is presented in Figure 7-5. The cross-sections
include:
| · | Two North-South cross-sections labelled A-A’
and B-B’ (Figures 7-6 and 7-7); and |
| · | A single East-West cross section, E-E’,
which transects the entire length of the SWA Property (Figure 7-8). |
| Standard Lithium Ltd. SW Arkansas Lithium Project PEA | Page 50 |
Figure 7-4. Type Smackover Formation section
depicting resource estimation zones that were used in this Technical Report. The ASCII log file is from Trend Resources Limited Neal Ellis
#1 (API: 03-731-0765-00-00). The well is in Section 19, Township 16S Range 23W5 and has a total depth of 2,659 m (8,723 feet).
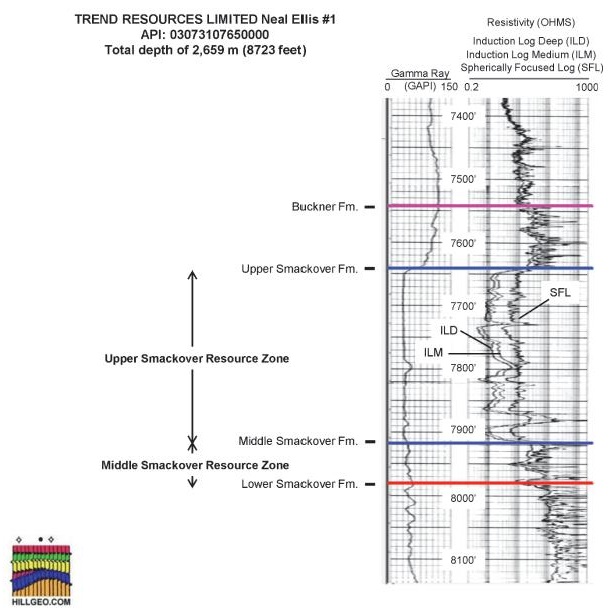
| Standard Lithium Ltd. SW Arkansas Lithium Project PEA | Page 51 |
Figure 7-5. Wells selected for study and location
of cross-sections.
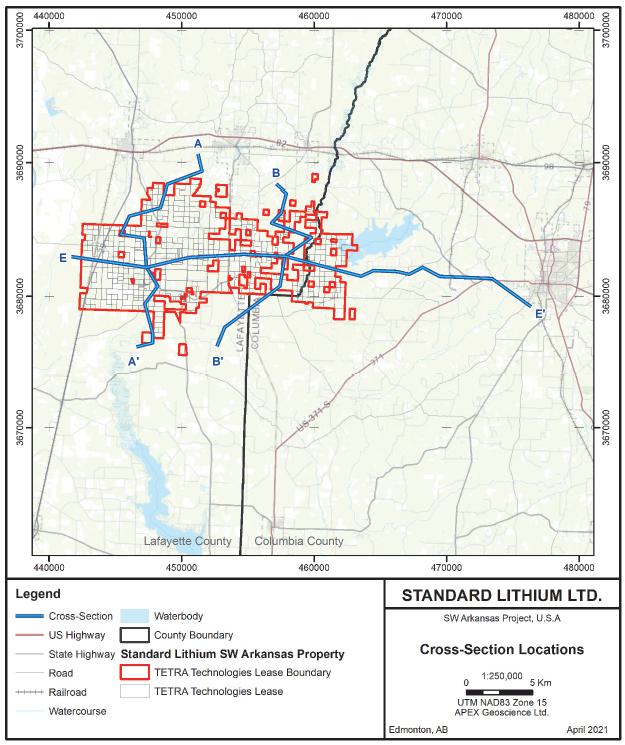
| Standard Lithium Ltd. SW Arkansas Lithium Project PEA | Page 52 |
Figure 7-6. North-South cross-section A-A’
of the Smackover Formation and associated geological units in the SWA Property area. The section is hung using the Upper Smackover Formation
as a datum.
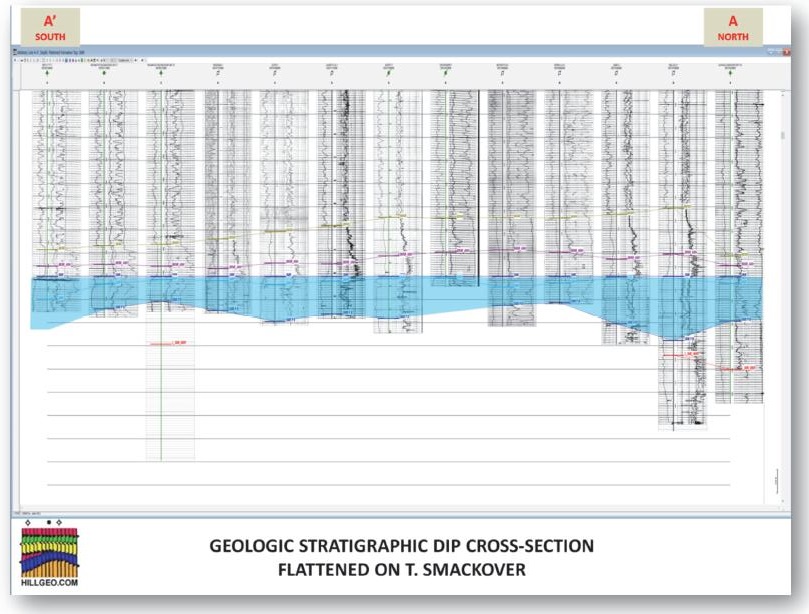
| Standard Lithium Ltd. SW Arkansas Lithium Project PEA | Page 53 |
Figure 7-7. North-South cross-section B-B’
of the Smackover Formation and associated geological units in the SWA Property area. The section is hung using the Upper Smackover Formation
as a datum.
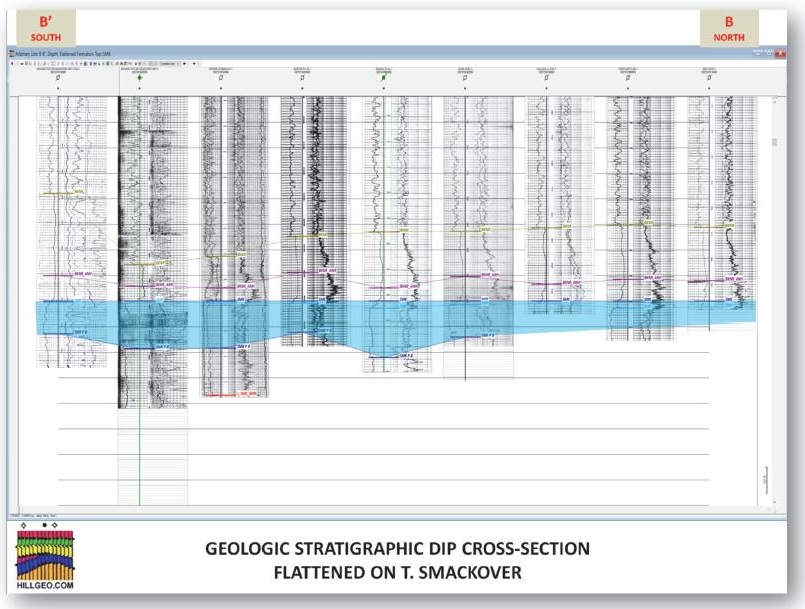
| Standard Lithium Ltd. SW Arkansas Lithium Project PEA | Page 54 |
Figure 7-8. East-West cross-section E- E’
of the Smackover Formation and associated geological units in the SWA Property area. The section is hung using the Upper Smackover Formation
as a datum.
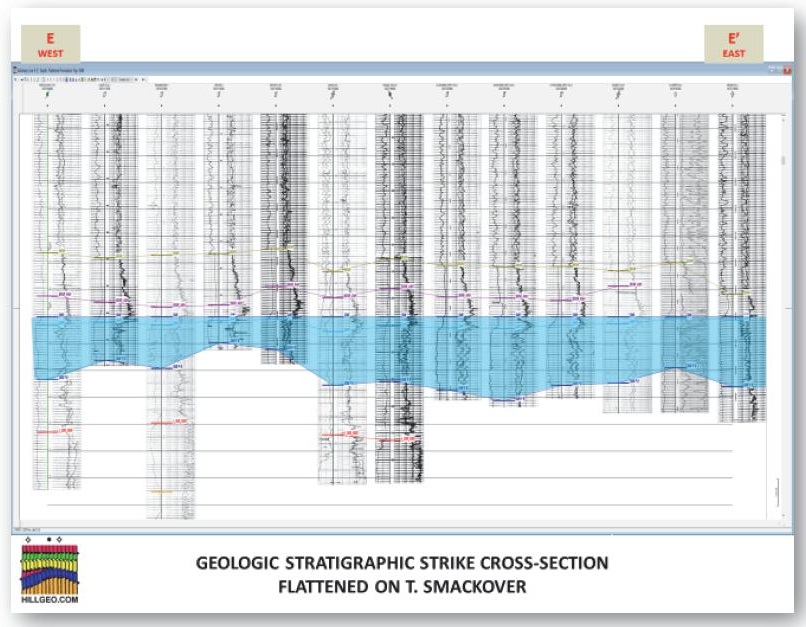
| Standard Lithium Ltd. SW Arkansas Lithium Project PEA | Page 55 |
Observations from the sub-surface interpretations
that are evident on the cross-sections include:
| · | The Upper Smackover Formation is laterally continuous
and underlies the entire SWA Property. |
| · | The thickest section of Upper Smackover Formation
is seen in the north end of cross-section A-A’ (Figure 7.6) where a thickness of 81.4 m (267 feet) is observed. |
| · | Cross-sections A-A’ and B-B’ show
the Upper Smackover Formation present in all wells with a thickness varying from about 30.5 m to 76.2 m (100 to 250 feet). |
| · | The average thickness of the Upper Smackover
Formation within the SWA Property is approximately 47 m (154 feet). |
| · | An east west trending fault appears to be present
in the southern portion of the SWA Property. The Upper Smackover Formation is present on the north and south sides of the fault as discussed
in Section 9. |
In addition to the Upper Smackover Formation,
a second resource horizon occurs directly below the Upper Smackover Formation and is identified as the Middle Smackover Formation. An
analysis of the nine electric logs from wells completed below the Upper Smackover Formation indicate an average resource horizon thickness
of 12.2 m (40 feet). The nine electric logs are located throughout the SWA Property within the Middle Smackover Formation and have similar
electric response signatures to the Upper Smackover Formation.
In addition to the electric logs, 206 line-km
(128 line-miles) of proprietary 2D seismic data were used to create integrated seismic subsurface maps. Synthetic seismograms were generated
in wells with sonic logs to make a tie between the seismic and well data. An excellent tie was established for the top of the Upper Smackover
Formation throughout the SWA Property. A ‘type example’ of the seismic data is presented in Figure 7-9; the Upper Smackover
Formation or Reynolds Member appears as a strong trough on the seismic data directly below the distinct Buckner Formation marker. The
seismic section is located between the cross-section A-A’ and B-B’. To conclude, the subsurface well data and 2-D surface
seismic review supports the authors’ stratigraphic depiction of the Upper and Middle Smackover Formations within the SWA Property.
These stratigraphic horizons have been selected for mineral resource modelling and estimation in this Technical Report. Additional subsurface
detail including stratigraphic surface structural contours is presented in Section 9.1.1, Exploration. The stratigraphic surface
grids define the Upper and Middle Smackover Formations domain used in the resource modelling and estimation process (see Section 14).
| Standard Lithium Ltd. SW Arkansas Lithium Project PEA | Page 56 |
Figure 7-9. An example of proprietary 2D seismic
data showing the uniform and continuous Smackover Formation geologic horizons.
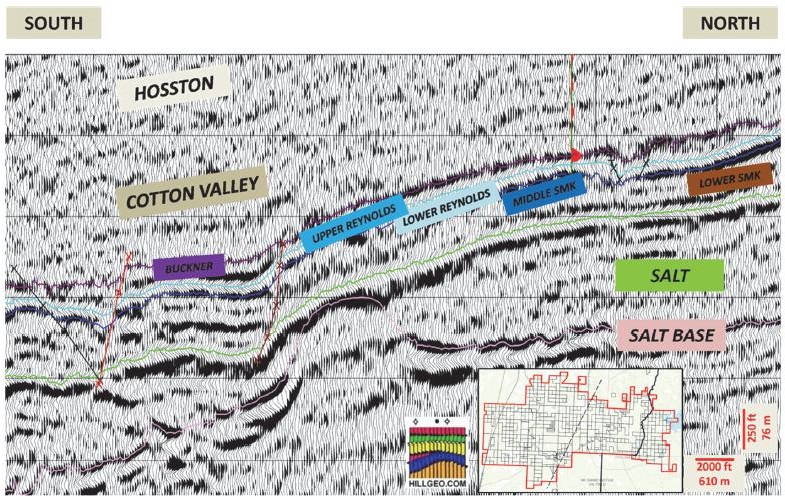
| Standard Lithium Ltd. SW Arkansas Lithium Project PEA | Page 57 |
Fault zones are developed along the northern periphery
of thick salt basins in the eastern Gulf (Mancini et al., 1999). The State Line Fault complex occurs directly south of the SWA Property
and formed near the updip limit of a thick salt basin in northern Louisiana (North Louisiana Salt Basin) and is underlain by the thick
Jurassic Louann salt that extends midway up the South Arkansas shelf before pinching out (Kalbacher and Sartin, 1986). The State Line
Fault complex is associated with salt tectonics during the Smackover-Buckner formations and younger strata deposition (Troell and Robinson,
1987) and the producing Smackover Formation reservoir rocks dip to the southwest across southern Arkansas, likely in relation to the State
Line Fault complex (Troell and Robinson, 1987).
During the subsurface investigation conducted
as part of this report, the author discovered another east-west fault zone that occurs in the south-central part of the SWA Property.
The reader is referred to Section 9.1.2, Delineation of an Inferred Fault Zone Within the SWA Property.
| 7.6 | Upper and Middle Smackover Formation Aquifer |
The aquifer associated
with the Upper and Middle Smackover formations is defined by a distinct stratigraphic horizon that consists of clean, porous, ooidal
grainstone with lime-mudstone and fossiliferous lime-wackestone. Locally, the upper portion of the Middle Smackover Formation is also
pelletoid and oolitic limestone. The Upper Smackover Formation or Reynolds Member forms the main oil, gas, and brine reservoir rock of
the region due to its high porosity and permeability. The Upper and Middle Smackover formations also correlates with the mineral resource
estimate horizon that is the focus of this Technical Report.
The resource horizon
occurs underneath the entire Property at depths of approximately -2,230 to -2,905 m (-7,317 to -9,531 feet) beneath the Earth’s
surface. The target Reynolds Member aquifer has an average thickness of 59 m (193.5 feet; see Section 14.4.2, Geometry and
Volume of the Upper and Middle Smackover formation Domains).
Importantly, the
aquifer within the Upper and Middle Smackover formations is defined as a ‘confined aquifer’. That is, the aquifer is sandwiched
between two aquitards that include the overlying Buckner Formation anhydrite and shale and underlying low permeability Lower Smackover
(Brown Dense) and Louann Salt. The Buckner Formation has been an effective seal or cap as oil and gas fields are present in the
Reynolds Member in Arkansas and on the Property.
In this report, the authors have compiled an extensive
dataset, that for example, includes:
| 1) | Historical porosity analyses (n=1,935 core plug samples); |
| 2) | Historical permeability analyses (from 6 sources); |
| 3) | Property and surrounding area specific permeability and porosity analyses (n=1,643 core plug samples);
and, |
| 4) | 5,143 total porosity values based on LAS density/porosity logs from wells within the SWA Property and
surrounding area. |
These data, together with resource thickness determinations,
were used to make inferences on the hydrogeological characteristics of the Upper and Middle Smackover formations aquifer within the SWA
Property. As per the Canadian Institute of Mining (CIM) Best Practice Guidelines for Resource and Reserve Estimation for Lithium Brines
(1 November 2012), the hydrogeological characterization of the Smackover Formation, is defined and discussed in Section 14.4,
Hydrogeological Characterization of the Upper and Middle Smackover Formations. Sub-sections presented within this section discuss porosity,
permeability, dispersivity, anisotropy, groundwater levels, and hydraulic conductivity and analysis as they pertain to the updated SWA
Property inferred lithium-brine resource estimate presented in this Technical Report.
| Standard Lithium Ltd. SW Arkansas Lithium Project PEA | Page 58 |
The SWA Property is being assessed by Standard
Lithium for its lithium-brine potential. The brine is situated within an aquifer associated with the Late Jurassic Smackover Formation,
which has produced hydrocarbons since the 1940s on the Property and brine to the east of the Property since the late 1950s.
Hyper-saline brine (total dissolved solids of
293,000 to 448,000 mg/L) with elevated lithium has been verified in the 2018 brine sampling programs conducted by Standard Lithium. The
2018 brine sampling programs and their lithium content are discussed in Section 9.2, 2018 Brine Sampling Program.
| Standard Lithium Ltd. SW Arkansas Lithium Project PEA | Page 59 |
Lithium is a silver-grey alkali metal that commonly
occurs with other alkali metals (sodium, potassium, rubidium, cesium). Lithium’s atomic number is three and has an atomic weight
of 6.94 making it the lightest metal and the least dense of all elements that are not gases at 20º C (the density in solid form at
20º C is 534 kg/m3). Lithium has excellent electrical conductivity (i.e., a low electrical resistivity of 9.5 mΩ∙cm),
making it an ideal component for battery manufacturing where lithium ions move from the negative electrode to the positive electrode during
discharge and back when charging. Lithium imparts high mechanical strength and thermal shock resistance in ceramics and glass.
The average crustal abundance of lithium is approximate
17-20 parts per million (ppm) with higher abundances in igneous (28-30 ppm) and sedimentary rocks (53-60 ppm; Evans, 2014; Kunasz, 2006).
It should be noted that 1 mg/L lithium is equal to 1 ppm and 0.0001%. Lithium does not occur in elemental form in nature because of its
reactivity. There are over 100 minerals that contain lithium, but only a few of these are currently economic to extract. Lithium can be
described, priced and quoted as lithium content, Lithium oxide (Li2O; 0.464 lithium content; conversion is Lithium x 2.153),
lithium carbonate (Li2CO3; 0.188 lithium content) and lithium carbonate equivalent (LCE”; conversion is lithium
x 5.323). Resource estimates and production quantities of lithium are often expressed as LCE.
Lithium is extracted from two main categories
of deposits: mineral and brine. With respect to mineral deposits, lithium is extracted only from pegmatite deposits. Pegmatite lithium
deposits are found globally and account for half of the lithium produced today (Benson et al., 2017). Spodumene is the most abundant lithium-bearing
mineral found in economic deposits.
Brine deposits include unconfined (continental)
and confined (i.e., geothermal and subsurface aquifer) brine deposits. Continental brine occurs in endorheic basins where inflowing surface
and groundwater is moderately enriched in lithium. All producing lithium brine operations are unconfined (or partially confined), continental
deposits; this type of deposit shares several first-order characteristics: (1) arid climate; (2) closed basin containing a playa
or salar; (3) tectonically driven subsidence; (4) associated igneous or geothermal activity; (5) suitable lithium source-rocks;
(6) one or more adequate aquifers; and (7) sufficient time to concentrate a brine (Bradley et al., 2006).
Economic continental brine aquifers typically
occur in areas where high solar evaporation results in beneficiating the brine to higher concentrations of lithium. Geothermal and/or
volcanic associations are the favoured mechanisms for introducing lithium into continental basins because lithium-rich brines often exist
in areas of volcanic activity (e.g., Imperial Valley, California; Reykjanes field, Iceland; Taupo Volcanic Zone, New Zealand).
Typical lithium concentrations in commercially developed continental brine deposits are 200 to 1,500 mg/L.
Selected continental brine deposit examples include:
Salar de Uyuni in Bolivia (Bradley et al., 2017); Salar de Atacama in Chile (Garrett, 2004); Salar de Hombre Muerto in Argentina (Meridian,
2008); Salar del Rincon and the Salar del Olaroz in Argentina (Pavlovic and Fowler, 2004; Meridian, 2008; Houston and Gunn, 2011); and
the Zhabuye Salt Lake in the Tibetan Plateau, the DXC Salt Lake, and the Qaidam Basin in China (Shengsong, 1986; Zheng et al., 2007).
The only active lithium mine in North America is in Silver Peak, Nevada. Lithium brine extraction started in 1966. The lithium occurs
in an infilled playa sequence that covers an area of 72 km2 within a closed drainage basin of 1,342 km2 (Munk et
al., 2011). Average lithium content at the initiation of production was 360 ppm in 1966 declining to 230 ppm in 2008 (Garrett, 2004; Meridian,
2008). The mine currently produces 3,500 tonnes of lithium per year, with the theoretical capacity to produce 6,000 tonnes.
| Standard Lithium Ltd. SW Arkansas Lithium Project PEA | Page 60 |
Deep aquifer lithium-brine is frequently pumped
as a waste product of hydrocarbon production from confined aquifers at depths of up to 4,000 m. Lithium enrichment of deep saline brines
is known to occur worldwide in sedimentary basins of various age, including: the Cambrian Siberian Platform, Russia (Shouakar-Stash et
al., 2007); Devonian Michigan Basin (Wilson and Long, 1993); Mississippian–Pennsylvanian reservoirs of the Illinois Basin (Stueber
et al., 1993); Pennsylvanian Paradox Basin, Utah (Garrett, 2004); Triassic strata of the Paris Basin, France (Fontes and Matray, 1993);
and Jurassic Smackover Formation strata from the Gulf Coast, Arkansas and Texas (Moldovanyi and Walter, 1992).
If the aquifer contains elevated concentrations
of lithium or other minerals associated with a mature (or dwindling or dormant) oil and gas field, it can be converted to brine production.
A good example is the current bromine production from the LANXESS Smackover Formation in southern Arkansas located 40 km to the east of
the SWA Property. At the LANXESS Property, hydrocarbon production ceased in favour of bromine production in 1957. Bromine production from
The LANXESS Property has continued for over 50 years. Thus, these deep, confined aquifer resources present an enormous opportunity for
extracting minerals such as lithium from the brine.
The source of lithium in hypersaline brine aquifers,
including the Smackover Formation, remains subject to debate. Theories specific to the Smackover Formation include, but are not limited
to:
| · | Smackover Li-brine could be a result of the continental
drainage of lithium-enriched solutions into the sea where the lithium stems from Triassic age volcanic rocks in the Gulf coast (Collins,
1976). Continental water from springs or other hydrothermal fluids along fault systems could have leached lithium from Triassic aged volcanic
rocks. These lithium-enriched fluids then drained into the Smackover Sea and the water was then concentrated by evaporation. |
| · | In the Smackover Formation brine, radiogenic
Sr87/Sr86 are significantly higher than Late Jurassic seawater suggesting significant strontium contribution from
detrital sources such as the Bossier Formation, which overlies and/or interfingers with the Upper Smackover Formation, or were acquired
during brine migration (Stueber et al., 1984). |
| · | Lithium was mobilized from the Alleghenian-sourced
volcaniclastics (including plutonic rocks) and then concentrated in the underlying Norphlet Formation. These fluids could have originated
in the Louann salt and migrated upward through faults or from shallower circulation through the alluvial and wadi facies of the Norphlet
Formation (from Chuchla, unpublished, via Daitch, 2018). |
| · | The association between boron, lithium, potassium,
and rubidium, coupled with a general lack of clastic sediments in the upper Smackover Formation in southwest Arkansas, suggest that the
Smackover Formation brines are mixing with deeper-seated waters that may have been geochemically modified by siliciclastic diagenesis
at higher temperature (Walter et al., 1990). |
| · | Regional trends between hydrogen sulphide (H2S)
and boron, lithium, potassium, and rubidium support the association of a higher temperature, deeper-seated fluid end member; these fluids
may have migrated into Smackover Formation reservoirs via major fault systems, the South Arkansas fault system and the Louisiana State
Line graben, and their associated fractures (Moldovanyi and Walter, 1992). |
| Standard Lithium Ltd. SW Arkansas Lithium Project PEA | Page 61 |
With respect to resource modelling of confined
aquifer lithium-brine deposits, important criteria include defining the boundaries of the subsurface aquifer; brine chemistry; and understanding
of the hydrology of the brine. The reader is referred to the CIM Best Practice Guidelines for Resource and Reserve Estimation for Lithium
Brine (1 November 2012). While the guidelines define issues specific to unconfined continental brine deposits (i.e., salars), they
do provide general direction for reporting on confined aquifer deposits.
| Standard Lithium Ltd. SW Arkansas Lithium Project PEA | Page 62 |
During 2018, Standard Lithium conducted: 1) a
2018 review of subsurface data as supplied by third-party well and 2-D surface seismic information suppliers; 2) analysis of porosity
and permeability from available core; and 3) 2018 geochemical brine sampling program. These programs are discussed in the text that follows.
| 9.1 | Subsurface Data Review |
| 9.1.1 | Stratigraphic Surface Interpretation and Definition of the Smackover Formation |
During the preparation of this report, Hill Geophysical
Consulting (in collaboration with the author) reviewed subsurface well log information from a variety of sources: 1) Depth registered
logs from IHS Markit (a software program that allows users to access raster and digital logs); 2) the Arkansas Oil and Gas Board; and
3) the ARK-LA-TEX Log Library Inc. a summary of the statistics from the well data review and description, interpretation of these data
is provided in Section 7.4, Property Geology: Characterization of the Smackover Formation.
These data were used to define the Upper Smackover
Formation type section and to formulate the upper and lower stratigraphic surfaces of the Upper Smackover Formation and Middle Smackover
Formation domain for the resource model used in this Technical Report. This information is presented in Sections 14.1, 14.2 and 14.3 of
the Resource Section, and summarized here as the work was part of Standard Lithium’s 2018 exploration workplan at the SWA Property.
Structure maps of
the top and bottom of the Upper Smackover Formation were constructed using the information from the logs together with the seismic data
(Figures 9-1 and 9-2). Industry standard methods for interpreting the data included loading well locations, raster, and digital logs into
a PetraTM workstation and picking the key geologic formation tops. The well data were then imported into a Kingdom®
seismic workstation where well data was tied to the 2D seismic data. Seismic reflectors, where they existed, were interpreted for the
same geologic picks. The time-depth relationship was established using Kingdom’s depth conversion. Review of the time-depth conversion
showed no issues, and the resulting structure maps fit all well data. The interval isopach of the Upper Smackover Formation shows that
the interval is too thin to resolve on the seismic data. Therefore, an isopach map of the well information was created.
| Standard Lithium Ltd. SW Arkansas Lithium Project PEA | Page 63 |
Figure 9-1. Structure map of the top of the
Upper Smackover Formation.
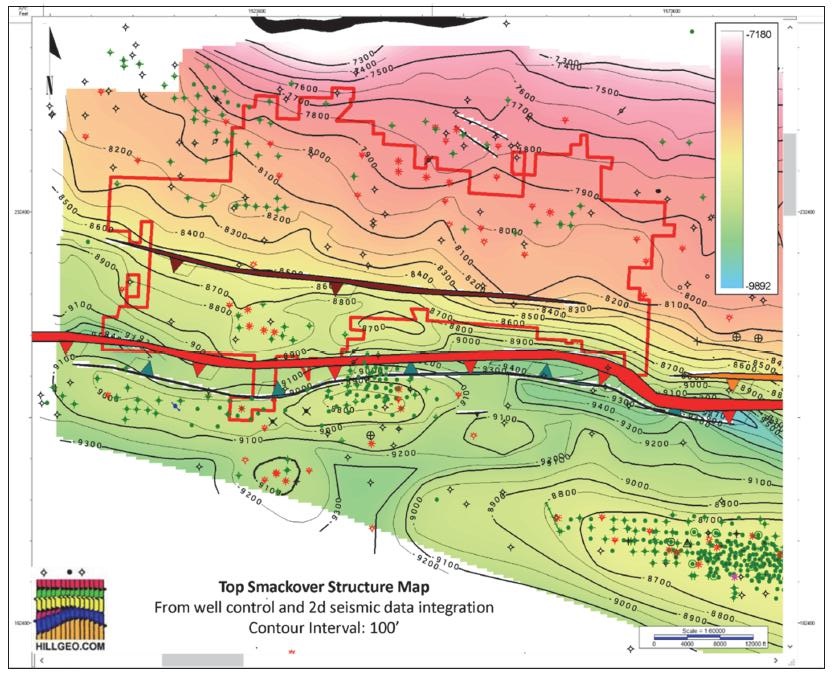
| Standard Lithium Ltd. SW Arkansas Lithium Project PEA | Page 64 |
Figure 9-2. Structure map of the bottom of the
Upper Smackover Formation.
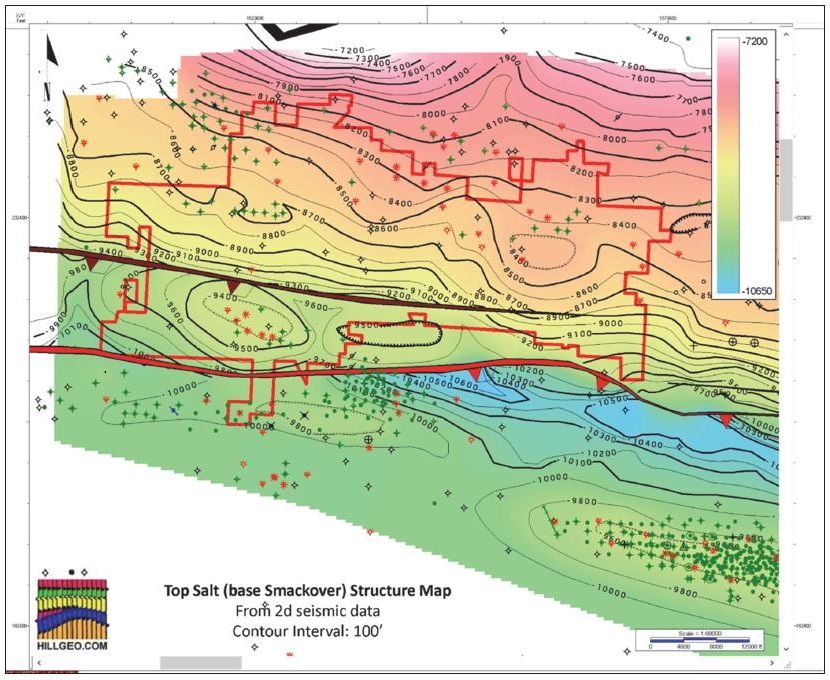
| Standard Lithium Ltd. SW Arkansas Lithium Project PEA | Page 65 |
Depth structure maps to the top, and bottom,
of the Upper Smackover Formation are presented in Figures 9-1- and 9-2. On the figures, the red outline represents the Project limits
within the regional study area, which was extended beyond the boundaries of the SWA Project to observe regional trends. The depth structure
maps show that the general dip of the Upper Smackover Formation is to the southwest and strike is generally northwest-southeast (Figures
9-1 and 9.2). The shallowest top of the Upper Smackover in the area is -2,230 m (-7,317 feet), and the deepest is -2,893 m (-9,491 feet).
The structure maps show that the Upper Smackover Formation upper and lower surfaces are uniform and generally correlate with one another.
The stratigraphic uniformity between the top and base is what one would expect in a shelf environment of this nature.
| 9.1.2 | Delineation of an Inferred Fault Zone Within the SWA Project |
A review of the top of the Buckner Formation and
top and bottom of the Smackover Formation structure maps were critical in the definition of a new inferred fault zone that trends east-west
in the south-central part of the SWA Project (Figures 9.1, 9.2 and 9.3).
The authors propose that the inferred fault zone
represents an important regional stratigraphic deposition transition zone in the region although it is important to point out that the
Upper and Middle Smackover Formations are evenly distributed across the fault zone and hence the Smackover Formation aquifers are interconnected
across the zone (see Figure 14.4 in Section 14.4.2, Three-Dimensional Modelling and Volume Calculation). The authors propose, however,
that the inferred fault zone is presently the most plausible explanation for the variation of lithium concentrations between the southern
and northern parts of the SWA Project (see Section 14.1).
| 9.1.3 | Core Report Analysis and Review |
During the preparation of this Technical Report,
APEX reviewed the laboratory certificate core reports for 10 wells from the SWA Project and an additional 22 in the Project area (See
Section 14.5). Standard Lithium also analysed cores from five wells stored at the Arkansas Geological Survey in Little Rock, Arkansas.
Based upon the review of the core, Standard Lithium selected 18 samples for porosity and permeability analysis to verify historical measurements.
The core analytical test work was conducted over
the course of 4-decades from 1942 to 1987. Geotechnical data presented in this Technical Report include core reports that were prepared
by independent petroleum engineering firms that include: Core Laboratories Inc. in Dallas, TX and Shreveport, LA; Delta Core Analysts
in Shreveport, LA; All Points Inc. in Houston, TX; Thigpen Laboratories, Inc. in Shreveport, LA: O’Malley Laboratories, Inc.
in Natchex, MS; and Bell Core Laboratories in Shreveport, LA.
The average porosity and permeability measurements
from the Property of 515 core plug samples are 10.2% and 53.3 millidarcies (mD), respectively. Measurements from the 1,110 core plugs
from the 22 wells surrounding the SWA Property yielded an average porosity and permeability measurements from the Property of 8.6% and
64.6 mD, respectively.
| Standard Lithium Ltd. SW Arkansas Lithium Project PEA | Page 66 |
Figure 9-3. Top of Buckner Formation Structure
Map.
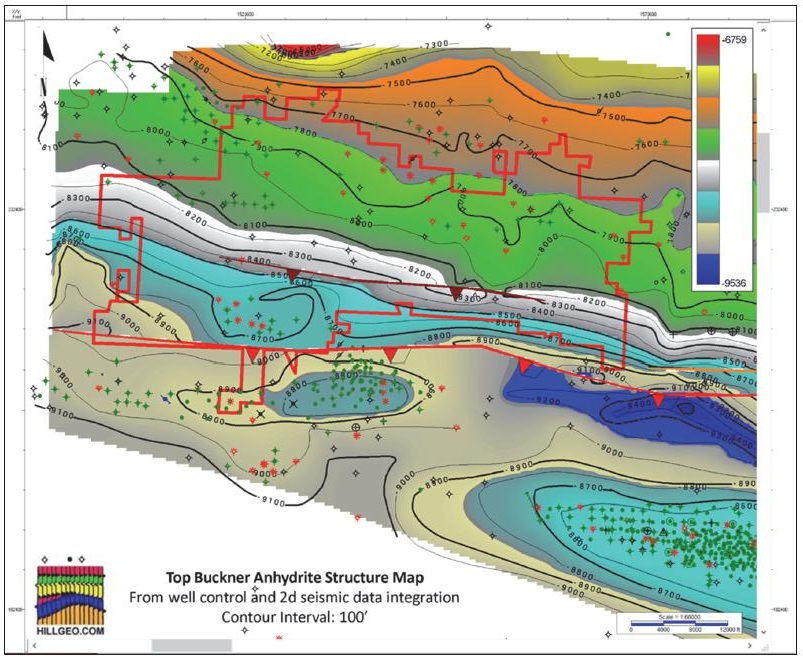
| Standard Lithium Ltd. SW Arkansas Lithium Project PEA | Page 67 |
| 9.2 | 2018 Brine Sampling Program |
To verify the historical lithium concentrations
in the brine (Section 6.2) Standard Lithium conducted a brine sampling program at the following McKamie-Patton wells: MKP#20 brine
sample collected on June 22, 2018; and MKP#21 brine sample collected on July 23, 2018.
The locations of the McKamie-Patton wells are
shown on Figure 9-4 and Table 9-1 summarizes the lithium laboratory analytical results. Two of these wells, MKP#20 and MKP#21, are completed
in the Upper Smackover Formation.
Table 9-1. Summary of analytical results from
2018 sampling program.
Well/Sample ID | |
Latitude | | |
Longitude | | |
Dominion
Land System | |
Total well depth (m) | | |
Well
status | |
Lab | |
Li
(mg/L) | |
| MKP-20-1B | |
| 33.23241 | | |
| -93.55148 | | |
35-17S-24W | |
| 2,885 | | |
Prod. | |
WetLAB | |
| 347 | |
| MKP-20-1B | |
| 33.23241 | | |
| -93.55148 | | |
35-17S-24W | |
| 2,885 | | |
Prod. | |
WetLAB | |
| 352 | |
| MKP-20-1 | |
| 33.23241 | | |
| -93.55148 | | |
35-17S-24W | |
| 2,885 | | |
Prod. | |
ALS-H | |
| 265 | |
| MKP-20-1B | |
| 33.23241 | | |
| -93.55148 | | |
35-17S-24W | |
| 2,885 | | |
Prod. | |
ALS-H | |
| 302 | |
| MKP-21 | |
| 33.22617 | | |
| -93.56029 | | |
35-17S-24W | |
| 2,860 | | |
Prod. | |
WetLAB | |
| 461 | |
| MKP-48 (dup of MKP-21) | |
| 33.22617 | | |
| -93.56029 | | |
35-17S-24W | |
| 2,860 | | |
Prod. | |
WetLAB | |
| 439 | |
| MKP-21 | |
| 33.22617 | | |
| -93.56029 | | |
35-17S-24W | |
| 2,860 | | |
Prod. | |
ALS-H | |
| 380 | |
| MKP-48 (dup of MKP-21) | |
| 33.22617 | | |
| -93.56029 | | |
35-17S-24W | |
| 2,860 | | |
Prod. | |
ALS-H | |
| 425 | |
| | |
| Average (all data) | |
| 371 | |
| Prod. - Well is currently producing oil | | |
Average MKP-20 (all data) | |
| 317 | |
| | |
| | | |
| | | |
Average MKP-21 (all data) | |
| 426 | |
| | |
| | | |
| | | |
Average MKP-20 (WetLab) | |
| 350 | |
| | |
| | | |
| | | |
Average MKP-21 (WetLab) | |
| 450 | |
Standard Lithium uses WetLab and ALS-Houston as
their primary and secondary laboratories (see discussion in Section 11). The reader is referred to Section 11.5, Quality Assurance
– Quality Control, for discussion on the designation of WetLab as the primary laboratory, and rationale for WetLab analytical results
being deemed appropriate by the author for use in the resource estimation.
WetLab laboratory analyses of the brine samples
measured an average lithium content of 350 mg/L and 450 mg/L, from wells MKP#20 and MKP#21, respectively (Table 9-1). The lithium concentrations
obtained by Standard Lithium in the brine from wells MKP#20 and MKP#21 are similar to the historical Property results from Cornelius 1
(432 mg/L) and Cornelius 2 (370 mg/L; Moldovanyi and Walter, 1992). Cornelius 1 and 2 are located approximately 3 kms (2 miles) to the
north of MKP#20 and #21 as shown in Figure 9-4.
The 2018 Standard Lithium laboratory results validates
the historical data of Moldovanyi and Walter (1992) and verifies the presence of lithium-enriched brine within the Smackover Formation
underlying the SWA Project.
| Standard Lithium Ltd. SW Arkansas Lithium Project PEA | Page 68 |
Figure 9-4. Location of brine samples collected
by Standard Lithium as part of the 2018 brine sampling program as well as historical lithium results.
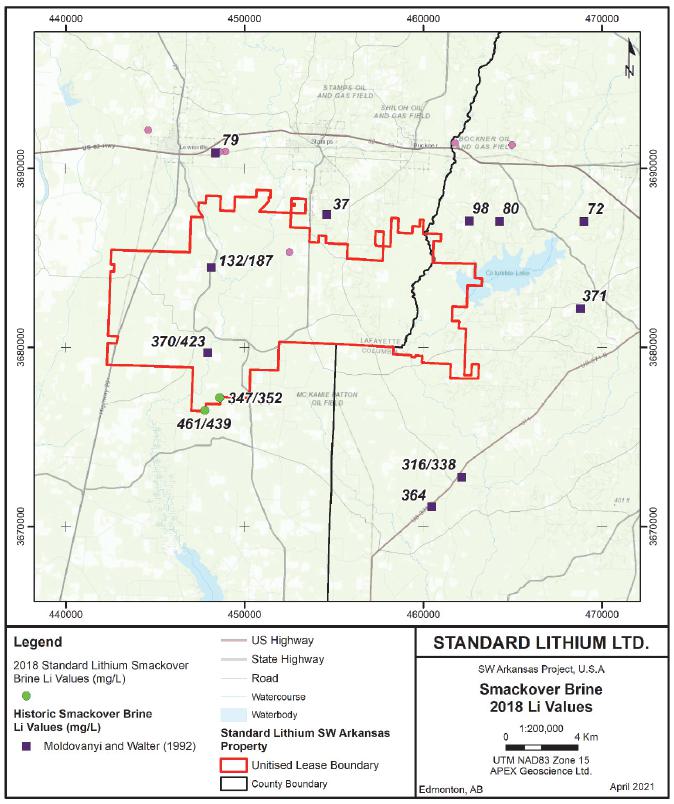
| Standard Lithium Ltd. SW Arkansas Lithium Project PEA | Page 69 |
10 Drilling
The issuer of this Technical Report, Standard
Lithium, has yet to drill any wells at the SWA Project. Standard Lithium does, however, have access to Mission Creek Resources oil wells
located on the Property and two wells, MKP#20 and MKP#21 were accessed by Standard Lithium to obtain brine samples. As this work is directly
related to geochemical exploration work, the reader is referred to Section 9.2, 2018 Brine Sampling Program to view the sample locations
(Figure 9-6) and analytical results. Additional well information and brine access points is discussed in the text that follows.
The wells MKP#20 and MKP#21 were drilled by The
Carter Oil Company as oil wells in 1955 and 1956, respectively. The AOGC list that both wells are currently active and producing oil from
within the McKamie Patton Smackover Unit (AOGC, 2019). In September 2018, the operator changed from Bonanza Creek Energy Resources,
LLC to Mission Creek OPCO, LLC. Both wells (MKP#20 and MKP#21) were drilled vertically with an orientation and dip of 0º and -90º.
The Mission Creek oil well completion intervals
– and brine collection access points – are as follows:
| · | MKP#20 – 2,840 to 2,871 m (9,317 to 9,419
feet) below ground surface; and |
| · | MKP#21 – 2,825 to 2,831 m (9,270 to 9,287
feet) below ground surface and the well was perforated in September 2018 at 2,825 to 2,786 m (9,267 to 9,139 feet; AOGC, 2019). |
The total depths of MKP#20 and MKP#21 wells are
2,885 and 2,860 m, respectively (AOGC, 2018). Hence the brine was taken close to the total depth of each well. This is not unusual in
southern Arkansas because the oil and gas essentially produced, and hence targeted, the porous portions of the Upper Smackover Formation.
As per the cross-sections presented in Section 9.1, the Middle Smackover Formation was penetrated less seldom, but can comprise oil-bearing
porous reservoirs.
The author concludes the MKP#20 and MKP#21 well
sample points were in Upper Smackover Formation. A review of the well log data supports this hypothesis (e.g., see Figure 7-6 and the
MKP#21 well on cross-section A-A’). Lastly, the horizontal location of the Standard Lithium brine samples was confirmed as Upper
Smackover Formation in the 3D model created as part of the resource estimation presented in this Technical Report (Section 14.3,
Geometry of the Upper and Middle Smackover Formation Domain).
| Standard Lithium Ltd. SW Arkansas Lithium Project PEA | Page 70 |
11 Sample Preparation, Analyses and Security
11.1 Brine Sample Collection
Brine samples were collected from existing oil
wells from Mission Creek Resources (Section 10). A critical step to sampling brine for geochemical analysis is to ensure that the
brine collected is considered “fresh brine” representative of Upper or Middle Smackover Formation and has not been stagnant
in the wellbore.
During the 2018 sampling programs conducted by
Standard Lithium, Mission Creek staff assisted with the sample collection. The sample collection methodology included:
| · | Review the well construction schematic to assess
total depth, perforation zone, and production casing diameter. The existing production tubing and packer assembly was removed. A new packer
assembly was installed immediately above the perforated zone. New production tubing was also installed in the well. All the work was completed
by a workover rig as shown in Photo 11-1. |
| · | The volume of brine in the production casing
below the packer and within the production tubing was calculated. The volume of brine in the production casing and tubing represents the
stagnant brine within the well that must be removed to allow fresh formation brine to enter the well prior to sample collection. |
| · | Fluids (brine>>>oil) were removed from
the well by swabbing the production tubing. Swabbing involves lowering swab cups on steel wireline inside the production tubing from above
the perforations. Once the wireline and swab cups were lowered to the desired depth through a fluid column of approximately 100 m (300
ft) there were raised, and the entire 100 m (300 ft) column of fluid was brought to wellhead and conveyed to a mud tank for storage through
a piping system. The volume of fluid removed from the well was calculated based upon the volume measured at regular intervals in the mud
tank. Swabbing of the well was continued until approximately 2 volumes of stagnant fluid/brine was removed. |
| · | Field measured parameters were collected onsite
by a Baker Petrolite representative to assess brine density and chloride concentration at regular intervals after 1.5 volume of stagnant
fluid had been removed from the well. Field measured parameters were compared to known values of the Smackover Formation. The formation
has a brine density of about 1.20 grams/cubic centimeter (10.2 lbs/gallon) and contains 170,000 to 200,000 mg/L of chloride. Brine was
removed from the production tubing by swabbing. Swabbing continued until at least 2 stagnant volumes had been removed and field measured
parameters were within the typical range of the Smackover Formation. |
| · | Brine established to be from the Smackover Formation
(based on density and chloride content) was collected by filling two 20 L (4.4 imperial gallons) plastic carboy containers from a valve
installed at the wellhead. Safety protocols were exercised on site due to the hydrogen sulphide (H2S) gas content associated
with the produced Smackover Formation fluids. The carboy containers were kept still for about 1 to 5 hours to allow oil and brine to separate
if oil was present. In all cases only a very thin film of oil was observed in the carboys attesting to the high brine to oil ratio. |
| · | New laboratory-supplied 1-litre plastic sample
containers with screw-on caps were labelled using Standard Lithium’s label procedure that includes recording the: sample identification;
date and time of sample collection; and sampler’s initials. |
| Standard Lithium Ltd. SW Arkansas Lithium Project PEA | Page 71 |
| · | The plastic sample containers were placed under
the well sample spigot and a small amount of brine was captured, swirled in the container and discharged. Rinsing the sample containers
was completed twice to ensure that the container is clean and free of any residue that might affect the analysis. The procedure also established
a ‘brine flow’ such that stagnant brine was discharged prior to the sample collection. |
| · | The plastic sample container was filled to capacity,
or near-capacity where it was immediately capped tightly with a screw-on cap. |
| · | The physical attributes of the brine sample were
recorded (e.g., colour, smell, contaminants, etc.). The sampling process is completed by recording any comments that might be significant
to the sampling site, the sample collection or the sample itself. |
| · | Three 1-litre sample containers were taken by
Standard Lithium at each sample point; 2 containers for geochemical analysis at independent laboratories, and 1 sample container for Standard
Lithium’s archival storage (at a locked storage centre in El Dorado, AR). |
| · | The sample containers were checked to verify
that all sample label information was correct, and the sample container was properly closed. All sample containers were then stored in
a cooler for shipping to the laboratories. |
11.2 Field Duplicate Samples and Semi-Certified Standard Samples
A field duplicate sample was collected for every
sample (n=4 original and 4 duplicate samples). The field duplicate sample was taken at the same time as the original sample (i.e., back-to-back
samples from the brine sample spigot). Random identifiers were given to the duplicate sample; i.e., the original and duplicate field samples
were never in sequential order and randomly presented to the laboratories.
To the best of the author’s knowledge, Certified
Lithium-Brine Sample Standards, which have a special classification and are subject to rigorous international testing, do not currently
exist. As part of Standard Lithium’s Quality Assurance/Quality Control (QA/QC) measures, the Company commissioned the University
of British Columbia to prepare a ‘semi-certified sample standard’ by adding a measured amount of elemental lithium (in this
test, 250 mg/L of lithium) to saline brine with a TDS content of 250,000 mg/L (TDS to simulate brine). The semi-certified standards were
inserted randomly into the sample stream. The purpose of the semi-certified sample standard samples was to measure the accuracy of the
laboratories and the results are discussed in Section 11.5, QA/QC.
| Standard Lithium Ltd. SW Arkansas Lithium Project PEA | Page 72 |
Photo 11-1. Sampling setup at Mission Creek
MKP#20 well.

11.3 Security
Coolers full of sample containers were taken from
the field to a secured location to double check the sample IDs and make sure all containers are in good condition prior to shipment to
the laboratory. Chain of Custody forms for the respective laboratories were filled out and included with the sample cooler.
The cooler was taped closed and hand-delivered
to the local courier company (Fed-Ex in El Dorado, AR) for rush delivery to the laboratories, which include: ALS-Houston in Houston, TX;
and WetLab in Sparks, NV. The laboratories were instructed to confirm receipt of the samples and provide a statement pertaining to the
condition of the samples upon receipt. The samples were then coded into the respective laboratories sample stream for analysis.
| Standard Lithium Ltd. SW Arkansas Lithium Project PEA | Page 73 |
11.4 Analytical Methodology
Standard Lithium has prepared its own internal
analytical protocols for the independent laboratories to follow. These include the following analytical work (with the associated American
Society for Testing and Materials (ASTM), Standard Methods (SM) and Environmental Protection Agency (EPA) international and national method
code):
“Limited Lithium Brine Analytical Suite”
| · | General chemistry: density, pH, carbonate, bicarbonate,
total dissolved solids (ASTM 1963, SM 4500-H+B, SM 2320B and SM 2540C). |
| · | Anions by Ion Chromatography: chloride, sulfate
(EPA 300.0) |
| · | Sample preparation: trace metal digestion (EPA
200.2) |
| · | Trace metals by inductively coupled plasma optical
emission spectroscopy (ICP-OES): Li, Ba, B, Ca, Fe, Mg, Mn, K, Na, Sr (EPA 200.7) |
“Expanded Lithium Brine Analytical Suite”.
| · | General chemistry: density, pH, temperature,
carbonate, bicarbonate, total dissolved solids, total organic carbon (ASTM 1963, SM 4500-H+B, SM 2550B, SM 2320B, SM 2540C and SM 5310B). |
| · | Anions by Ion Chromatography: chloride, sulfate,
bromide, fluoride (EPA 300.0) |
| · | Sample preparation: trace metal digestion (EPA
200.2) |
| · | Trace metals by ICP-OES: Li, Al, Sb, As, Ba,
Be, B, Cd, Ca, Cr, Co, Cu, Ga, Fe, Pb, Mg, Mn, Mo, Ni, P, K, Sc, Se, silicon, silica, Ag, Na, Sr, Sn, Ti, V and Zn (EPA 200.7) |
ALS-Houston completed this analysis using the
following corresponding methods: ICP-MS Metals by SW 6020A; Conductivity by E120.1; anions by E300.0; total dissolved solids by SM 2540C;
alkalinity by SM 2320B; density by 2710F; dissolved silica by SM 4500-SID; and pH by SW 9040C.
WetLab completed these analyses using the following
corresponding methods: sample preparation by EPA 200.2; density by gravimetric; pH by SM 4500-H+B; temperature at pH by SM 2550B, carbonate
and bicarbonate by SM 2320B; chloride and sulfate by EPA 300.0; total dissolved solids by SM 2540C; anions by ion chromatography by EPA
300.0; trace metal digestion by EPA 200.2; and trace metals by ICP-OES by EPA 200.7.
It is notable that the two labs used different
analytical ICP instrumentation: ALS-H used inductively coupled plasma mass spectrometry (ICP-MS) and WetLab used inductively coupled plasma
optical emission spectroscopy (ICP-OES). ICP-MS: measures an atom’s mass by mass spectrometry; detection limit can extend to parts
per trillion (ppt). ICP-OES measures excited atoms and ions at the wavelength characteristics; lower limit is parts per billion (ppb).
In the U.S., the regulatory compliance monitoring for ICP-OES is governed by EPA Methods 200.5 and 200.7. EPA Method 200.7 was approved
for use as axial view of ICP-OES and is therefore the EPA method for compliance monitoring by ICP-OES. EPA Method 200.8 governs regulatory
compliance using ICP-MS.
11.5 Quality Control/Quality Assurance
11.5.1 Field Duplicate Samples
Brine samples were collected from MKP#20 and MKP#21
wells in 2018. Of the four total field duplicates, two were sent to ALS-Houston and two to WetLab. The lithium results of the duplicate
sample analyses are presented in Table 11-1. The duplicate sample relative percentage difference (RPD) for WetLab was 1.4 % to 4.9 % and
ALS was 11.2% to 13.4%. These results indicate that WetLab had a higher level of precision in their internal ICP metal analysis in comparison
to ALS. It should be noted that any result with an RPD less than 20% is considered acceptable.
| Standard Lithium Ltd. SW Arkansas Lithium Project PEA | Page 74 |
Table 11-1. Comparison of field duplicate samples
from the 2018 sampling program.
A) WetLab duplicate pair analytical results
| Well/Sample ID | |
Li
(mg/L) | | |
Well/Sample ID | |
Li
(mg/L) | |
| MKP-20-1B | |
| 347 | | |
MKP-21 | |
| 461 | |
| MKP-20-1B | |
| 352 | | |
MKP-48 | |
| 439 | |
| Mean | |
| 350 | | |
Mean | |
| 450 | |
| Standard deviation | |
| 4 | | |
Standard deviation | |
| 16 | |
| RSD% | |
| 1.01 | | |
RSD% | |
| 3.46 | |
B)
ALS-Houston duplicate pair analytical results
| Well/Sample ID | |
Li
(mg/L) | | |
Well/Sample ID | |
Li
(mg/L) | |
| MKP-20-1 | |
| 265 | | |
MKP-21 | |
| 380 | |
| MKP-20-1B | |
| 302 | | |
MKP-48 | |
| 425 | |
| Mean | |
| 284 | | |
Mean | |
| 403 | |
| Standard deviation | |
| 26 | | |
Standard deviation | |
| 32 | |
| RSD% | |
| 9.23 | | |
RSD% | |
| 7.91 | |
Field duplicate results provide important information
about the homogeneity of the sample medium and the representativeness of the sampling method employed. Data quality of the duplicate pairs
is assessed using average percent relative standard deviation (also known as the % coefficient of variation or average RSD%) as an estimate
of precision or reproducibility of the analytical results. The average RSD% is determined from the duplicate results by calculating the
mean and standard deviation of each duplicate pair and then by dividing the standard deviation by the mean.
Generally, average RSD% values below 30% are considered
to indicate very good data quality; between 30 and 50%, moderate quality and over 50%, poor quality. The higher an average RSD% value
is, the less likely it is to be able distinguish real patterns from noise.
The duplicate pair analysis conducted at WetLab
yielded excellent RSD% values of 1.0 and 3.5% (Table 11-1). Albeit having slightly higher RSD% values, ALS-Houston duplicate pair analytical
results was also excellent (<9.2%).
11.5.2 Semi-Certified Standard Sample Comparison
To further evaluate brine analytical accuracy,
Standard Lithium conducted a laboratory comparison using a semi-certified sample standard. The semi-certified sample standard was designed
to be similar to Smackover Formation brine from the SWA Project. The semi-certified standard sample was prepared by the University of
British Columbia, on behalf of Standard Lithium, and has a lithium content of 250 mg/L in a high TDS brine. The salts used were >99%
analytical purity and include (with cation concentration equivalents): calcium chloride (CaCl2 · 2H2O - 30,000
mg/L Ca); lithium chloride (LiCl 250 mg/L lithium); magnesium chloride (MgCl2 · 6H2O - 2,500 mg/L Mg); potassium
chloride (KCl - 2,000 mg/L K); sodium chloride (NaCl - 60,000 mg/L Na); and strontium chloride (SrCl2 · 6H2O
- 2,000 mg/L Sr) (Dr. J. Hein, personal communication, 2018).
| Standard Lithium Ltd. SW Arkansas Lithium Project PEA | Page 75 |
A total of six semi-certified sample standards
were randomly inserted into the sample stream by Standard Lithium; three standards to WetLab and three to ALS-Houston. A single semi-certified
sample standard was inserted by Roy Eccles as part of the QP site inspection brine samples (analysed at ALS).
Figure 11-1 shows that WetLab ICP-OES analyses
performed better on the semi-certified sample standard in comparison to ALS ICP-MS. The WetLab data were within 1% to 6% of the semi-certified
sample standard. Alternatively, the ALS-Houston data underestimated the semi-certified sample standard lithium content by 12% to 32%.
This test supports the use of WetLab as the primary lab and WetLab data as the primary dataset used in this resource estimate.
Figure 11-1. Histogram of the semi-certified
sample standard that was analysed at WetLab and ALS-Houston.
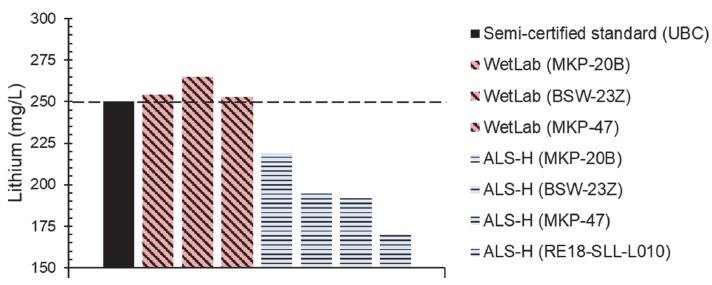
11.6 Other Data: Core Reports
Historical core reports include pertinent information
on Upper and Middle Smackover formations core measurements conducted by independent engineering consultants (Core Laboratories Inc. in
Dallas, TX and Shreveport, LA; Delta Core Analysts in Shreveport, LA; All Points Inc. in Houston, TX; Thigpen Laboratories, Inc.
in Shreveport, LA: O’Malley Laboratories, Inc. in Natchex, MS; and Bell Core Laboratories in Shreveport, LA). These reports
included core measurements that included porosity (%) and permeability (mD) on 1,625 core samples from throughout and immediately surrounding
the SWA Project. Some of the core report data also includes: data for oil% in pore space; water% in pore space; bulk oil%; bulk gas%;
bulk water%; and vertical permeability.
In general terms, the historical porosity and
permeability measurements were obtained for every foot of conventional core. Horizontal permeabilities were measured on each drilled plug
using a steady state permeameter with nitrogen as the measuring media and a confining pressure of 350 psi. Two wells also measured vertical
permeability on a total of 51 samples.
| Standard Lithium Ltd. SW Arkansas Lithium Project PEA | Page 76 |
11.7 Summary
These analytical brine and core report data were
prepared by independent and accredited third-party companies. The resulting quantitative data are used to make inferences on the brine
analytical values and hydrogeological characteristics of the Upper and Middle Smackover formations aquifer. The analytical methods carried
out by the laboratories is standard and routine in the field of lithium brine geochemical analytical and petrophysical core characterization
test work.
The author has reviewed the adequacy of the sample
preparation, security and analytical procedures and found no significant issues or inconsistencies that would cause one to question the
validity of the data. While the number of sample data are presently minimal, the QA/QC protocol adopted by Standard Lithium helped the
author to evaluate and validate the laboratory data as discussed in Section 12, Data Verification.
| Standard Lithium Ltd. SW Arkansas Lithium Project PEA | Page 77 |
12 Data Verification
Data verification procedures were applied by the
QP on all data pertaining to the resource model and estimate (Section 14) presented in this Technical Report. This information as
it pertains to the SWA Project includes: 1) historical and/or publicly available data; 2) new interpretations derived from historical
and/or publicly available data; and 3) new information such as laboratory analysis. These data and our data verification procedures are
discussed under the following titles (in bold; non-headers).
Subsurface LAS
Logs: Subsurface well data were acquired from three different third-party and Government sources: 1) IHS Markit; 2) Arkansas
Oil and Gas Board; and 3) ARK-LA-TEX Log Library Inc. A total of 104 wells had electric logs in the SWA Property and surrounding area.
Once geocoded into the proper coordinates space, the existing stratigraphic picks were reviewed for accuracy on a well-by-well basis.
The top of Smackover Formation picks was usually precise, where the stratigraphic picks were off, the picks were revised by Hill Geophysical
Consulting in collaboration with Mr. Eccles. The bottom of the Upper Smackover Formation was almost never picked, and hence, this
was newly created information specific to this Technical Report.
Subsurface Core
Report Total Porosity and LAS Total Porosity Logs: The individual core reports were reviewed against the original LAS logs
to confirm that the depths of the core intervals matched the depth of the Upper and Middle Smackover formations on the log files. No errors
were found. Pertinent data such as porosity and permeability information from the core reports were converted from hardcopy to electronic
files by APEX under the supervision of the author.
With respect to the LAS porosity logs, 29 wells
had density logs that could be used for total porosity calculations of the Upper and Middle Smackover formations. Nineteen of the density
logs penetrated then entire thickness of the Upper Smackover Formation. The LAS porosity logs were not used in this evaluation as a large
percentage of total porosity values were negative. See Sections 24.3.2 and 25.3 for an analysis of the total porosity derived from the
density logs and recommendations for Standard Lithium to utilize the LAS porosity logs in the future.
SWA Property
Infrastructure: Roy Eccles P. Geol. conducted a site inspection of the SWA Property on March 5 to 9, 2018. The site visit
validated the Property and observed active exploration at the Property in the form of using oil and gas infrastructure to obtain brine
samples for analytical testing. Roy Eccles also viewed the existing oil and gas infrastructure including primary and secondary road network
and the McKamie-Patton oil and gas field including well sites, pipeline corridors and gas plant.
Laboratory Analytical
Data: The author investigated Standard Lithium’s 2018 analytical results. It is the author’s opinion that the ICP-OES
method EPA 200.7 is best suited for brine analysis and use in the resource estimate presented in this Technical Report. ICP-OES has a
higher tolerance for total dissolved solids (up to 30%). ICP-MS has a lower tolerance for total dissolved solids (about 0.2%; although
there are ways to increase the tolerance such as high matrix introduction / aerosol dilution; e.g., Wahlen, 2011; ThermoFisher Scientific,
2018). ICP-MS can have a limited tolerance to total dissolved solids where: frequent calibrations are required; long-term stability can
be compromised; and samples must be diluted significantly prior to analysis. If samples with very high total dissolved solids levels are
run, the orifices in the cones will eventually become blocked, causing decreased sensitivity and detection capability, and requiring the
system to be shut down for maintenance; consequently, several sample media types must be diluted before running on the ICP-MS (Wolf, 2005).
This collectively can cause greater likelihood in bias in results.
| Standard Lithium Ltd. SW Arkansas Lithium Project PEA | Page 78 |
The author has reviewed all geotechnical and geochemical
data and has found no significant issues or inconsistencies that would cause one to question the validity of the data. In addition, the
2018 brine sampling conducted by Standard Lithium provides verification of the historical brine analytical results of Moldovanyi and Walter
(1992). In fact, a comparison between the two datasets yields an RSD% value of 12% that indicates good correlation (Table 12-1).
Table 12-1. Comparison of analytical Lithium
results from Standard Lithium’s 2018 sampling program (original and field duplicate samples) and historical results from Moldovanyi
and Walter (1992).
| Well/Sample ID | |
Li
(mg/L) | | |
Source |
| MKP-20-1B | |
| 347 | | |
Standard Lithium (this report) |
| MKP-20-1B | |
| 352 | | |
Standard Lithium (this report) |
| MKP-21 | |
| 461 | | |
Standard Lithium (this report) |
| MKP-48 | |
| 439 | | |
Standard Lithium (this report) |
| Cornelius 1 | |
| 423 | | |
Moldovany and Walter (1992) |
| Cornelius 2 | |
| 370 | | |
Moldovany and Walter (1992) |
| Mean | |
| 399 | | |
|
| Standard deviation | |
| 49 | | |
|
| RSD% | |
| 12.17 | | |
|
The review of third-party, government and/or data
was conducted or discussed during team working sessions. The QP’s of this Technical Report can confirm that the data was generated
with proper procedures, has been accurately transcribed from the original source and is suitable for use in this Technical Report.
Lastly, based on Roy Eccles’ previous experience
and research of lithium-brine deposits, and sampling and analytical protocols, Mr. Eccles, P. Geol. is satisfied to include these
data in resource modelling, evaluation and estimations as part of SWA Project lithium-brine resource estimate presented in this Technical
Report. This opinion includes a QP acceptance of using the historical geochemical data of Moldovanyi and Walter (1992) in the resource
estimation process.
12.1 Metallurgical Test Data
NORAM’s preliminary design of the processing
facility (described in Sections 13 and 17) is based on results obtained from Standard Lithium’s operating Demonstration Plant testing
their DLE process. Samples produced in the Demonstration Plant, were analysed with the same methods described in Sections 11.4.
NORAM reviewed the sample analyses provided by
WetLab and ALS-Houston, laboratory procedures and certifications, where applicable. The test procedures are appropriate for the testwork
requirements, and the results support the development of the preliminary process design. The testwork results were sufficiently detailed
and the reported selectivity for lithium and rejection of other metallic species were in-line with expectations when compared to that
of competing technologies.
| Standard Lithium Ltd. SW Arkansas Lithium Project PEA | Page 79 |
| 13 | Mineral Processing and Metallurgical Testing |
13.1 Introduction
Standard Lithium is developing a flowsheet that
can selectively extract lithium from Smackover Formation brine at the Company’s SWA Project and produce battery-quality lithium
chemicals. The mineral processing and hydrometallurgical flowsheet consists of three process areas:
| 1. | Pretreatment of the brine to remove separate gaseous and non-aqueous phase liquids (oils and/or natural
gas condensates) from the brine at the wellhead, combined with any suspended solids removal prior to lithium extraction. These processes
are industry-standard when handling produced waters from oil and gas fields and require minimal project tailoring or process adaptations; |
| 2. | Selective extraction of lithium from the brine using the Company’s proprietary Direct Lithium Extraction
(DLE) technology known as LiSTR to produce a purified and concentrated lithium chloride solution; and, |
| 3. | Conversion of the lithium chloride solution to lithium hydroxide through an electrochemical process, followed
by evaporation and crystallisation of a high-purity lithium hydroxide solid product. |
With regards to Process Area 1, the SWA Project
is located in a region with abundant current oil and gas operations, and as such, there are multiple service providers who can tailor
existing service offerings to effectively pre-treat the brine prior to delivery into the LiSTR DLE plant. Therefore, no additional technological
development or proof is required at this stage of the project.
With respect to Process Area 2, the Company has
been successfully running a LiSTR pre-commercial Demonstration Plant at the nearby Lanxess facility since May 2020. As a result,
it has gathered significant data regarding the performance of the LiSTR technology on Smackover brines and has produced significant quantities
of purified and concentrated lithium chloride solution.
With respect to Process Area 3, the Company is
relying on previous hydrometallurgical and electrochemical testwork completed by NORAM. The process has been tested for over 1,000 hours
with brines at small scale and will be operated in an electrolyser used at commercial scale for lithium sulphate electrolysis and now
being modified for lithium chloride. The electrolysis process is similar to the conventional chloralkali technology for converting sodium
chloride to sodium hydroxide.
13.1.1 Process Selection Rationale
Standard Lithium’s SWA lithium-brine project
has several unique aspects that require a different approach to processing lithium-bearing brine, as compared to traditional South American
salar-based projects. The factors, which affect the selected approach, include the following:
| § | The
climate and terrain in south western Arkansas are not conducive to the construction and operation
of traditional solar evaporation ponds. Despite the high average annual temperature (23.5°C),
the average humidity is too high (annual rainfall of 126.7 cm [50 in]); hence, the net solar
evaporation rate is inadequate for operation of a traditional solar evaporation pond system.
In addition, because there is little flat ground in the area, high capital investment costs
for evaporation pond construction would be required; |
| Standard Lithium Ltd. SW Arkansas Lithium Project PEA | Page 80 |
| § | Tail-brine
re-injection into the Smackover Formation is needed to maintain aquifer pressurization. Bromine
recovery from the aquifer brine has been taking place in the general southern Arkansas region
for over 60 years. As a result, changing the process to solar evaporation ponds would negatively
affect the water balance in the Smackover Formation beneath the Project area; and |
| § | The
Smackover Formation brines have much higher background levels of alkaline earth elements
compared to brines typically found in salars exploited for lithium recovery in South America. |
Conversely, the Southern Arkansas area and the
project site have several attributes that are not commonly found at lithium brine development locations; these allow a wider range of
lithium extraction and conversion processes to be considered. These project attributes include the following:
| § | Existing
brine processing businesses (LANXESS and Albemarle bromine plants). There is a local workforce
well versed in pumping, processing and reinjecting very large volumes of brine, combined
with a well-understood regulatory framework; |
| § | Access
to abundant fresh water for use in chemical processes; |
| § | Immediate
access to stable, high capacity and relatively inexpensive electricity; |
| § | Excellent
access to low-cost, standard chemical reagents (acids, bases etc.); and, |
| § | Excellent
access to low-cost gas for any required thermal processes. |
13.1.2 Process Overview
As discussed above, the initial pretreatment of
the brine to remove dissolved gasses, any co-produced liquid hydrocarbons and any suspended solids will use industry-standard techniques,
similar to those already used at large scale in southern Arkansas at the active brine processing businesses (e.g. at LANXESS or Albemarle’s
operations), or as part of produced-water management associated with oil and gas production in the region.
Based on the work completed by Standard Lithium
to date, the company expects to use its proprietary LiSTR DLE technology to extract lithium from the Smackover Formation brine and produce
a concentrated and purified intermediate lithium chloride solution. This technology has been in pre-commercial operation and optimization
since May 2020 at the Company’s Demonstration Plant located on one of LANXESS’s facilities in Union County, AR. This
technology is sufficiently tested and validated that it can be reasonably considered for use in the SWA Project. The conversion of the
intermediate lithium chloride solution into a lithium hydroxide solution using an electrochemical process is based on technology developed
and tested by NORAM at their testing facilities in Richmond, BC. Final concentration and crystallisation of lithium hydroxide monohydrate
(LiOH·H2O) will use industry standard equipment and process technology.
| Standard Lithium Ltd. SW Arkansas Lithium Project PEA | Page 81 |
Figure 13-1 is a simplified schematic showing
the main process steps proposed for the SWA Project.
Figure 13-1 SWA Lithium Brine Project Flowsheet
Schematic
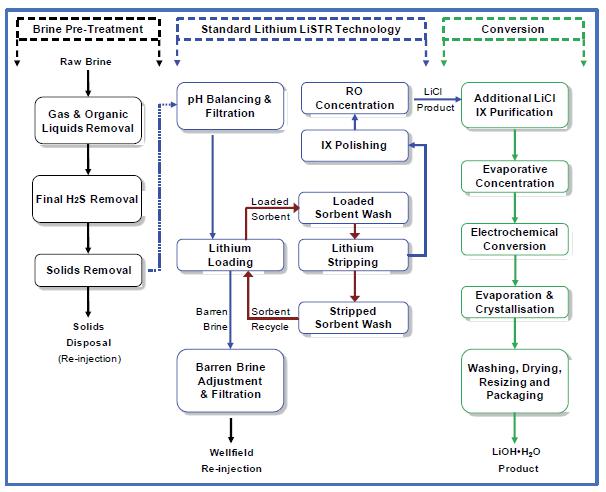
The intent of this Section is to discuss
the South West Arkansas Li-brine mineral processing test work in accordance with CIM Best Practice Guidelines for Mineral Processing (2011).
The level of definition is appropriate to the confidence categories of mineral resources being supported and the current stage of project
development.
It is the opinion of the author preparing this
section, that the discussion includes an objective level of reasonableness and demonstrates competence and due care in the execution of
the metallurgical testwork and lithium-brine recovery process steps.
13.2 Historical Testing
To the best of the author’s knowledge, no
historical testing regarding lithium recovery from the SWA Project has been performed. All testing discussed below was performed for Standard
Lithium as part of the current development program.
13.3 Brine Pre-Treatment Testing
As part of operating the pre-commercial Demonstration
Plant at the LANXESS South Plant facility, several of the proposed pre-treatment processes have been demonstrated as part of normal operations
at the facility. These include all wellhead operations to remove non-aqueous phases, removal of residual dissolved hydrogen sulphide (H2S)
prior to processing, bulk pH control, temperature adjustment and final filtration (prior to lithium extraction) using submerged membrane
units.
As such, no additional pre-treatment testing is
required for assessing the SWA Project.
| Standard Lithium Ltd. SW Arkansas Lithium Project PEA | Page 82 |
13.4 LiSTR Demonstration Plant Testing
13.4.1 Overview
Standard Lithium has independently developed a
technology to directly extract lithium from high TDS brines using a selective solid sorbent based on lithium titanate. This technology
was initially developed in 2017 and went through two main scale-ups (each approximately a 100× scale-up) during 2018 and 2019. A
large-scale Demonstration Plant, designed to be operated continuously, was designed and constructed in Ontario, Canada in 2019 by Zeton
Inc. The plant, which consisted of 18 modules, was dismantled and transported to its current location at LANXESS’ South Plant facility
in Union County. To erect this operational brine processing facility, approximately 1 acre of land was levelled and prepared for installation
(with all utility and brine connections) in late 2019. The plant was installed/connected and enclosed in late 2019/early 2020 and underwent
commissioning in early 2020. The official start-date for the plant was during the second week of May 2020. The plant has been operating
continuously (with the exception of normal or enforced shut-downs) since then. For this roughly 18-month period, the plant has been extracting
lithium from Smackover Formation brine and producing a purified and concentrated lithium chloride solution. Some optimizations were made
to the plant during December 2020, and in August 2021, an additional high pressure reverse osmosis (HPRO) unit was installed
at the plant (the HPRO unit operation had, until that point, been completed off-site as an occasional batch process).
The Demonstration Plant has a dedicated team of
engineers and operators who run the plant 24/7, as well as a separate analytical laboratory and chemist to complete all on-site process
control assays. As the plant has abundant instrumentation and automation, large amounts of data are continuously generated. This is supplemented
by a large and systematic sample and data collection schedule executed by the operators.
The Demonstration Plant has been continuously
processing a slipstream of the tail-brine produced by the LANXESS South facility. The lithium-barren tail-brine and the vast majority
of the lithium chloride produced, as well as added process water are continuously transferred back to the LANXESS brine disposal system.
Representative analyses of two feed brines and the Demonstration Plant product raw lithium chloride (LiCl) solution are provided in Table
13-1.
| Standard Lithium Ltd. SW Arkansas Lithium Project PEA | Page 83 |
Table 13-1. Representative
Brine Analyses and lithium chloride Product
| | |
Demonstration
Plant brine
supply | | |
SWA Lithium
Project | | |
LiCl Product from
Demonstration
Plant | |
| Lithium | |
| 245 | | |
| 415 | | |
| 5,390 | |
| Boron | |
| 195 | | |
| 302 | | |
| 251 | |
| Sodium | |
| 85,042 | | |
| 71,700 | | |
| 18,700 | |
| Potassium | |
| 2,775 | | |
| 6,670 | | |
| 304 | |
| Calcium | |
| 37,114 | | |
| 38,366 | | |
| 16 | |
| Magnesium | |
| 2,368 | | |
| 2,506 | | |
| ND | |
| Strontium | |
| 2,377 | | |
| 2,990 | | |
| ND | |
| Chloride | |
| 189,143 | | |
| 210,000 | | |
| 66,700 | |
| Sulphate | |
| ND | | |
| ND | | |
| ND | |
| Total Dissolved Solids | |
| 316,428 | | |
| 344,000 | | |
| 130,000 | |
Notes:
[1] All units are mg/L
[2] Demonstration Plant brine composition is
average of 7 samples collected from 27th May to 2nd June 2020
[3] SWA Lithium Project brine is average of MKP#20
and MKP#21 analytical results
[4] ND; not detected
[5] All samples were analysed at WetLab, NV
As can be seen from Table 13-1, the major element
composition of the brine that has been processed through the Demonstration Plant is very similar to representative brines from the South
resource area in the SWA Project. The brine that is provided by LANXESS to the Demonstration Plant is normally de-brominated (by LANXESS).
However, there have been several periods when bromine extraction has not been occurring (for normal operational reasons), and the Demonstration
Plant has received brine with >4,000 mg/L bromide; this is relevant for assessing how the SWA Project brines may behave in the LiSTR
process.
As of the end of Q3 2021, the Demonstration Plant
had processed 30,895 m3 (8,161,350 US gallons) of brine.
Operations within the Demonstration Plant can
be systematically varied, and as such, the effect of changing operating parameters on operational metrics such as degree of lithium recovery
from the incoming brine, sorbent washing efficiency, the concentration of the strip solution or the composition of the final lithium chloride
concentrate that is being produced by the LiSTR process can all be studied in a controller manner. As with any industrial process, there
are many competing factors, and the optimal operation is typically a trade-off between the various inputs. For reference, a representative
lithium chloride analysis is provided in Table 13-1, though this can be modified by varying the processes in the Demonstration Plant.
| Standard Lithium Ltd. SW Arkansas Lithium Project PEA | Page 84 |
13.4.2 Findings from Demonstration Plant Testing
Key findings and outcomes from the LiSTR Demonstration
Plant testing are:
| § | The
process works well to selectively extract lithium from the Smackover Formation brine to produce
a solution in which the lithium content has been significantly enriched relative to the other
components of the feed tail-brine |
| § | Pre-treatment
of the incoming brine is necessary to remove dissolved gasses, non-aqueous phases and suspended
solids; |
| § | Initial
bulk pH control can be performed upstream of the loading reactors; |
| § | Continuous
and accurate pH control in the loading reactors is critical to good performance; |
| § | Loading
efficiency (lithium extraction efficiency) is a direct function of sorbent capacity and mass
flux vs brine flow in the loading reactors – this is a variable that can be controlled; |
| § | Submerged
membranes can be used effectively in the loading reactors to extract barren (lithium-free)
brine, but their utility is limited at very high solids concentrations in the sorption slurries; |
| § | The
lithium-specific titanate-based sorbent has demonstrated excellent chemical and physical
stability and has undergone several hundred loading and stripping cycles; |
| § | Lithium
loading capacity of fresh sorbent initially decreases over a few cycles but then has been
found to remain stable with no further capacity loss over many operating cycles; |
| § | Industry-standard
counter current decantation (CCD) circuits can be used to wash the sorbent in either loaded
or stripped (reactivated) state; |
| § | Continuous
and accurate pH control in the stripping reactor is critical to good performance and sorbent
stability; |
| § | The
initial strip solution can be efficiently purified via standard (off the shelf) ion exchange
(IX) resins, but using a novel and proprietary adaptation; |
| § | Boron
has been shown to be easily removed from the concentrated lithium chloride solution by third
party work using OEM industry-standard IX technology; |
| § | The
barren brine is suitable for reinjection, and over 30,283 m3 (8,000,000 US gallons)
of barren brine have been successfully reinjected; |
| § | The
lithium extraction process is not measurably affected by the presence or absence of bromide
in the incoming brine; |
| § | The
final lithium chloride concentrate is suitable for further conversion and has been converted
to battery quality lithium carbonate via two different processes; and, |
| § | Work
is well underway to commercialise the production of the lithium titanate-based sorbent. |
| Standard Lithium Ltd. SW Arkansas Lithium Project PEA | Page 85 |
Design work is currently underway to scale-up
the flowsheet and design a commercial facility.
13.5 Lithium Chloride Conversion Testing
The lithium chloride produced by LiSTR will undergo
additional purification (by IX) and concentration (thermal/evaporation) prior to being converted to lithium hydroxide solution in an electrochemical
process. The lithium hydroxide solution will then be concentrated to saturation and lithium hydroxide monohydrate crystals formed in the
evaporator/crystalliser will be separated, dried (± resizing) and packaged in an inert atmosphere.
To date, no direct conversion of lithium chloride
solution produced from the LiSTR process into lithium hydroxide has been carried out by the Company or by its technical consultants. However,
NORAM have conducted several previous laboratory programs in a scalable electrolyser for other prospective lithium producers where similar
lithium hydroxide (LiOH) conversion flowsheets have been tested. NORAM have completed several previous studies of lithium chloride to
hydroxide conversion in a scalable reactor, and have achieved good results, in accordance with their expertise in electrochemical conversions.
It should be noted that the final concentration
and evaporation/crystallisation of lithium hydroxide monohydrate is an industry-standard process and is practiced extensively at commercial
scale.
13.6 Process Testing QA/QC
During the operation of the LiSTR Demonstration
Plant, routine daily chemical analyses are conducted in the internal laboratory using standard solution analysis instrumental techniques;
principally, atomic absorption spectrometry. For more important determinations, duplicate samples are submitted to SGS Canada Inc. (SGS)
for analysis using their standard protocols (ISO 9000 compliant), developed based on their experience working on numerous lithium projects;
principally, ICP-OES. Additional brine and solid samples are also periodically sent to other third-party analytical laboratories
in order to provide suitable independent verification of data generated by the Demonstration Plant.
SGS Canada’s laboratories and other qualified
subcontractors have also provided services to characterize the sorbent used in the plant. The services included particle size analysis
(Malvern Laser Particle Size Analyser), optical and scanning electron microscopy to look at particle morphology, and X-ray diffraction
to determine crystal structure.
Other metallurgical testing, specifically settling
tests, filtration tests and pulp rheology measurements, were carried out by SGS, Pocock Industrial, and on-site at the laboratory.
Other instrumentation in the Demonstration Plant
undergoes a rigorous maintenance schedule to ensure accurate collection of data from the plant.
Throughout the process test work described, the
author has had the following interactions:
| § | Visited
the Zeton facility several times during construction of the LiSTR Demonstration Plant; |
| § | Visited
the installed Demonstration Plant during installation and early commissioning; |
| § | Participated
in twice-weekly video meetings throughout the entire operating period of the Demonstration
Plant; |
| Standard Lithium Ltd. SW Arkansas Lithium Project PEA | Page 86 |
| § | Received
daily data summaries regarding the operation of the Demonstration Plant and all analytical
output; |
| § | Participated
in and oversaw much of the initial piloting and bench-scale testwork carried out at SGS; |
| § | Involved
in technical discussions and data sharing with the sorbent supplier for the commercial plant;
and, |
| § | Involved
in scale-up discussions to date with engineering counterparties. |
13.7 Process Scalability
As noted above, the pre-treatment portion of the
flowsheet is industry standard technology and is already used at commercial scale in the southern Arkansas region. As such minimal scale-up
risk is envisaged for this unit operation.
The LiSTR process has now been operated continuously
for approximately 18 months at a pre-commercial Demonstration Plant scale. Whilst there is still considerable engineering work to complete
to scale this to commercial operation, based on initial discussions with competent engineering and construction businesses, it is understood
that all of the operations involved in the DLE process can be reasonably scaled-up.
Based on input from NORAM, referencing other lithium
and sodium chemistries and test data, no significant issues are envisaged for scale-up of the electrochemical conversion and evaporation/crystallisation
of lithium hydroxide monohydrate.
To date, no issues with process scale-up have
been identified. It is feasible, and should not present any processing challenges, to divide the large flows into smaller parallel flows,
should that be required for the full-scale plant.
13.8 Process Technical Risks and Mitigation Measures
Similar to all lithium brine processing projects
(including those using ‘conventional’ evaporation ponds), there exist several risks that will need to be addressed or resolved
as the project moves through the usual development stages:
| § | Security
of sorbent supply – a large commercial supplier has been identified, and production
of large batches of improved sorbent using commercial-scale production equipment are underway; |
| § | Sorbent
robustness – so far, the robustness and selectivity of the sorbent has been very encouraging,
and operational parameters during the running of the Demonstration Plant (approximately 18
months) have and continue to be tuned to optimise its performance. However, the entire lithium
recovery process is reliant on the long-term performance of this material, so its behaviour
should be carefully monitored, preferably through longer-term operation of the Demonstration
Plant. The Company is sourcing sorbent material domestically to be used in the Demonstration
Plant; |
| § | Effect
of varying feed composition on loading – to date, the Demonstration Plant at the LANXESS
facility has been operated with the South Plant brine feed (as shown in Table 13-1). However,
the proposed brine feed (see also Table 13-1) does vary sufficiently that its effect on lithium
loading and selectivity should be confirmed. The LiSTR process will be tested on brine from
the SWA Project; and, |
| § | Lithium
chloride to hydroxide conversion – whilst the technology required to convert lithium
chloride to hydroxide is well understood, and analogous chlor-alkali technology has been
operated at very large commercial scale for many decades, there are still likely hydrometallurgical
and electrochemical subtleties that will need to be fully worked through for the Project’s
LiSTR feed composition. As such, a rigorous pilot programme to test this part of the flowsheet
using real LiSTR lithium chloride solutions should be completed in the near term. |
| Standard Lithium Ltd. SW Arkansas Lithium Project PEA | Page 87 |
13.9 Conclusions and Recommendations
Standard Lithium has completed substantial testwork,
and many aspects of the proposed flowsheet at the SWA Project are either normal industrial processes, have been demonstrated at substantial
pre-commercial scale, or have been verified by pilot scale work on similar solutions. As such, it is felt by the author that sufficient
testwork has been completed to support the flowsheet proposed for the SWA Project at this stage of evaluation.
Recommendations are:
| § | Continue
to test and secure commercial-scale production of domestically produced sorbent material; |
| § | Continue
to operate and collect data from the existing LiSTR Demonstration Plant; |
| § | Process
large volumes of feed brine from the SWA Project location through the Demonstration Plant,
and run the brine through the LiSTR process; |
| § | Complete
a Pilot testing program at sufficient scale to verify that lithium chloride to hydroxide
conversion is reasonable. This should be completed using real LiSTR lithium chloride solutions;
and, |
| § | Complete
any necessary OEM testing to ensure that lithium hydroxide solution can be reasonably concentrated
and evaporated/crystallised to a battery-quality lithium hydroxide monohydrate product. |
| Standard Lithium Ltd. SW Arkansas Lithium Project PEA | Page 88 |
14 Mineral Resource Estimates
14.1 Introduction
Standard Lithium’s SWA Project is an early-stage
exploration project. Spatially, the SWA Project has been divided into four sections for the resource modelling and estimation process.
In plan view, the Property has been divided into North and South resource areas (Figure 14-1). The resources have been divided based on:
| 1) | The authors geological evaluation of Jurassic stratigraphy underlying the SWA Project and discovery of
an east-west-trending fault in the south-central part of the Project that has been used to divide the two resource areas (Figure 14-1;
and see Section 7.4, Property Geology: Characterization of the Smackover Formation and Section 9.1, Subsurface Data Review);
and, |
| 2) | Geochemical variations on either side of the fault zone, in which the South resource area has significantly
higher lithium concentrations in comparison to the North resource area (Figure 14-1). |
Horizontally, the
resources are further divided into the Upper Smackover and Middle Smackover formations. Justification to split the two adjoining units
is based on: 1) by stratigraphic nomenclature and definition such that the two units can be distinguished in electronic log profiles (see
Section 7.4 Property Geology: Characterization of the Smackover Formation); and 2) both formations exhibit uniquely representative
porosities, which is not atypical of a carbonate reservoir (Mazzullo and Chilingarian, 1992).
Accordingly, the SWA Property resource areas modelled
and estimated a total (or main) updated SWA Property inferred lithium-brine resource estimate that considered, on an individual basis,
the collective contribution from the:
| · | North Upper Smackover SWA lithium-brine resource
area; |
| · | North Middle Smackover SWA lithium-brine resource
area. |
| · | South Upper Smackover SWA lithium-brine resource
area; and the |
| · | South Middle Smackover SWA lithium-brine resource
area. |
The updated SWA Project inferred lithium-brine
resource estimations were conducted in consideration of, and accordance with, NI 43-101 and: 1) CIM “Estimation of Mineral Resources
and Mineral Reserves Best Practice Guidelines” dated November 29th, 2019; 2) CIM “Definition Standards for
Mineral Resources and Mineral Reserves” adopted May 10th, 2014; and 3) CIM Best Practice Guidelines for Resource
and Reserve Estimation for Lithium Brine (November 1st, 2012).
| Standard Lithium Ltd. SW Arkansas Lithium Project PEA | Page 89 |
Figure 14-1. Definition of the North and South
SWA Property Mineral resource areas. The fault dividing the two resource areas is inferred from this study, and presently, is the most
plausible explanation for the variation of lithium-in-brine values between the south and north areas.
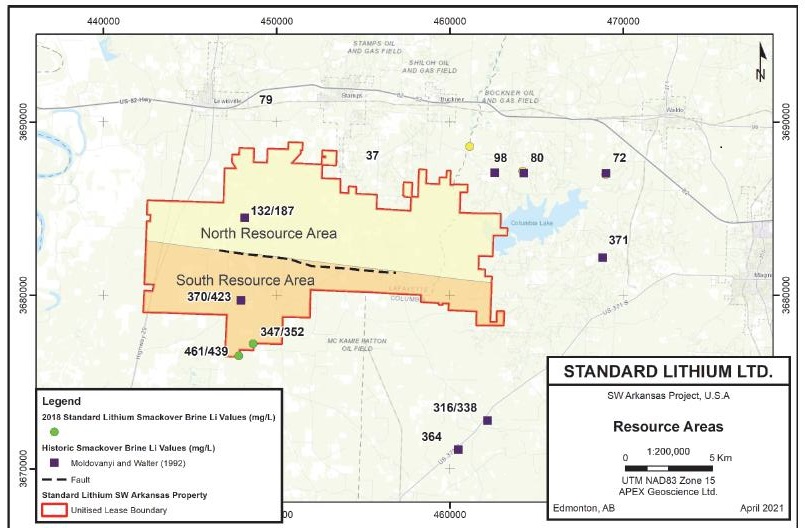
| Standard Lithium Ltd. SW Arkansas Lithium Project PEA | Page 90 |
14.2 Resource Estimation Steps
Statistical analysis, three-dimensional (3-D)
modelling and resource estimation was prepared by Mr. Black, M.Sc. P. Geo. of APEX (under direct collaboration and supervision of
Mr. Eccles, M.Sc. P. Geol.). The workflow implemented for the calculation of the updated SWA Property inferred lithium-brine resource
estimate was completed using: the commercial mine planning software MICROMINE (v 20.5).
Critical steps in the determination of the inferred
North and South SWA Property lithium-brine resources include:
Step 1: Definition of the geometry and unitised
volume of the Upper and Middle Smackover formations domain aquifers;
Step 2: Hydrogeological characterization of the
confined Upper and Middle Smackover formations domain aquifers;
Step 3: A statistical calculation of the average
effective porosity within the Upper and Middle Smackover formations;
Step 4: Consideration of the pore space fluid
modal abundances (i.e., hydrocarbon versus brine);
Step 5: Determination of the concentration of
lithium in the brine;
Step 6: Demonstrate that reasonable prospects
of economic extraction are justified; and
Step 7: Estimate the in-situ lithium resources
of Upper and Middle Smackover formations brine underlying the SWA Property Resource areas using the relation:
Lithium Resource = Total Volume of the Brine-Bearing
Aquifer X Average Effective Porosity X Percentage of Brine in the Pore Space X Average Concentration of Lithium in the Brine.
14.3 Data
14.3.1 Subsurface Geophysical Wireline and Seismic Data
Subsurface well data were used to model the extent
of the Upper and Middle Smackover formations. The information was acquired from three different sources: 1) Depth registered logs from
IHS Markit (a software program that allows users to access raster and digital logs); 2) the AOGC; and 3) the ARK-LA-TEX Log Library Inc.
The logs were scanned, and depth registered.
Summary statistics of the well data include:
| · | 2,444 wells have been drilled into the subsurface
in the general SWA Property area. |
| · | 2,041 wells were deep enough (2,135 m, or 7000
feet) to penetrate the Upper Smackover Formation. |
| · | 104 wells had electric logs available within
the SWA Property that included the top of the Upper Smackover Formation. |
| · | 32 wells had electric logs available within the
SWA Property that included the base of the Upper Smackover Formation. |
| · | 19 wells had electric logs available within the
SWA Property that included the base of the Middle Smackover Formation. |
| · | 29 wells had density logs and/or porosity logs,
19 of which logged the entire Upper Smackover Formation. |
| Standard Lithium Ltd. SW Arkansas Lithium Project PEA | Page 91 |
Hardcopy prints
of 20 proprietary regional seismic lines totaling over 200 line-km (over 125 line-miles) were procured, scanned, rasterized, and loaded
into Kingdom® seismic and geological interpretation software. The seismic lines were corrected for time, phase,
and amplitude.
14.3.2 Lithium Analytical Data
Lithium-brine analytical data pertinent to calculating
an average lithium value for the Upper Smackover Formation include:
| · | North resource area: two historical analytical
results in the North resource area (Moldovanyi and Walter, 1992); and |
| · | South resource area: two historical analytical
results in the North resource area (Moldovanyi and Walter, 1992) and eight analytical results from 2018 brine sampling programs conducted
by Standard Lithium. |
The sampling programs and the analytical results
are discussed in detail in Section 6.2, Regional Assessment of the Lithium Potential of the Smackover Formation, and Section 9.2,
2018 Brine Sampling Programs.
To the best of the authors knowledge, the Middle
Smackover Formation brine has not been sampled to determine its lithium content. The authors assume that because there is no evidence
of a hydraulic barrier between the Upper and Middle Smackover formations, and the widespread nature of lithium-enrichment in the Smackover
Formation in southern Arkansas (and in the high H2S polygon of Moldovanyi and Walter (1992) that the brine composition of the
Upper and Middle Smackover formations is similar.
14.3.3 Porosity and Permeability Data
Porosity and permeability data available to the
authors included:
| · | Historical effective porosity measurements of
more than 1,935 Smackover Formation core samples that yielded an average effective porosity of 14.3% (Manger, 1963); |
| · | Historical permeability data that vary from <0.01
to >5,000 millidarcies (mD) with an average of 338 mD (Manger, 1963); |
| · | 515 core plug samples from oil and gas wells
within the Upper and Middle Smackover formations at the SWA Property were analysed for permeability and porosity and yielded an overall
average permeability of 53.3 mD and a total porosity of 10.2%; and, |
| · | 5,143 Smackover Formation total porosity values
based on LAS density/porosity logs from 29 wells within, and/or adjacent to, the SWA Property that have an average total porosity of 9.2%
(with negative total porosity values removed). |
Sections 14.5.1 and 14.5.2 provide a detailed
discussion of porosity and permeability for the SWA Property and surrounding area.
| Standard Lithium Ltd. SW Arkansas Lithium Project PEA | Page 92 |
14.3.4 Data QA/QC
Roy Eccles P. Geol.
conducted a site inspection of the SWA Property on March 5 to 9, 2018. The site visit validated the Property and observed
active exploration at the Property in the form of using oil and gas infrastructure to obtain brine samples for analytical testing.
The well locations were vetted using aerial photos
and survey plots (where required). The well logs were loaded into the Petra workstation and vetted to ensure that the proper logs were
attached to the well. Three wells from IHS Markit were incorrect and fixed. Logs from other sources were vetted before being loaded into
the workstation. Formation tops were made by Tom Wyche of Hill Geophysical Consulting in collaboration with Mr. Eccles. The picks
were vetted by making grid maps and looking for outlier points. The few outliers that were found were corrected before importing the picks
back into the working subsurface model.
Twenty-nine wells had density logs, which is representative
of total porosity. These logs were digitized using Logscan software by Hill Geophysical Consulting staff, in collaboration with Mr. Eccles.
Logscan allows digitization of raster log images. The raster image is placed in the background as the software traces the log’s
curve in automatic mode. The operator then corrects any errors using a manual picker. The density porosity logs from the study area were
effective images and easy to digitize.
The seismic data
were vetted upon loading into the Kingdom® software. This involved assigning shot point numbers, as seen on the
paper prints, to the digital data traces once they were loaded. No problems were encountered.
The author has reviewed all geotechnical and geochemical
data and the author of this section of the Technical Report has found no significant issues or inconsistencies that would cause one to
question the validity of the wireline logs and seismic profiles used to make stratigraphic picks; core report porosity and permeability;
and historical and current lithium-brine analytical results. Third-party geochemical laboratory reports, engineering core measurement
reports, government information and/or publicly available well log information was generated using the proper procedures, has been accurately
transcribed from the original source and is suitable for use in this Technical Report.
The authors did note an issue in converting the
wireline density logs to total porosity, and therefore, do not use total porosity to determine the volume of brine within the Upper or
Middle Smackover formations domain aquifer. As an alternative, the authors use the engineering core measurement reports and total porosity
to quantify the average porosity of the Upper and Middle Smackover formations underlying the SWA Property. The reader is directed to additional
discussion on total porosity involving the density logs in:
| 1. | Section 14.5, Hydrogeological Characterization; |
| 2. | Section 14.6, Estimate of Average Porosity; and |
| 3. | Section 25.3 Risks and Uncertainties. |
| Standard Lithium Ltd. SW Arkansas Lithium Project PEA | Page 93 |
14.4 Step 1: Geometry and Volume of the Upper and Middle Smackover Formation Domains
14.4.1 Lateral Spatial Dimensions and Brine Ownership Within the Potentially Unitised Resource Area
The previous 2019 resource estimations were conducted
using only the leases that are currently under agreement to Standard Lithium (see Section 4.1, Property Introduction). All areas
that were not under lease by Standard Lithium were excluded from the 2019 resource estimation process and reporting. This exclusion of
lands includes those ‘islands’ of leases that are not under TETRA/Standard Lithium ownership but occur within the generalized
boundaries of the SWA Property.
Consequently, the
2019 mineral resources were estimated by applying a net acreage of 11,033 net mineral hectares (27,262 net mineral acres) together
with an ownership percentage of between 73% and 79% under lease value for each section of Arkansas Public Land Survey System.
In this updated 2021 resource estimate, which
supersedes and replaces the 2019 mineral resource, the author used a unitised area to calculate the resource. The unitised SWA Property
encompasses 14,638 gross mineral hectares (36,172 gross mineral acres) and forms the updated resource area. In addition, the 2021 resource
estimate applies a 100% brine ownership that is consistent with accessing all brine within the potentially unitised aquifer.
14.4.2 Stratigraphic Surface Modelling and Construction
The geographic land grid used to format and interpret
the well data were from U.S. Geological Survey Topography using NAD27 Arkansas South 302 projection. The well data were loaded and interpreted
in PetraTM geological interpretation software. Once all subsurface data were loaded and vetted, the author used best practice
industry interpretation methods to depict the stratigraphic top and base of the Upper Smackover Formation domain and create contoured
surface grid files for insertion into the 3D model.
Multiple cross-sections were generated in the
study area to understand and define the key geological horizons (see Section 7.4, Property Geology: Characterization of the Smackover
Formation) and the entire log was viewed/interpreted for each well. Shallow and deep horizons were picked, and geological correlations
were straight forward for defining the top and bottom surfaces of the Upper and Middle Smackover formations.
The top of the Smackover Formation and the base
of Upper Smackover Formation have distinct, sharp log changes that were consistently picked throughout the study area. The base of the
Middle Smackover Formation has fewer well stratigraphic picks (n=19 wells) and is mapped using the electric log picks. Once the stratigraphic
horizons in the logs were picked to the satisfaction of the loggers, grid maps were constructed to check the picks. Questionable picks
were studied and fixed if needed.
The geological information
(logs and formation ‘top’ and ‘base’ picks) was loaded into a Kingdom® software. As a complementary
approach to mapping the Upper and Middle Smackover formations, the author used proprietary seismic data within the boundary of the SWA
Property to support the regional dip of the reflectors and overall delineation of the top of the Upper Smackover Formation domain. Converting
seismic time values to depth values was accomplished using Kingdom’s depth conversion routine. The well formation tops were contoured
with the seismic data to establish velocity fields. The velocity fields in this area were simple due to the general nature of gentle regional
dip.
| Standard Lithium Ltd. SW Arkansas Lithium Project PEA | Page 94 |
The contouring of
the linear (seismic) and random (well) data stratigraphic picks in Kingdom® resulted in a sufficient representation
of the top of the Upper Smackover Formation. Some minor editing of the contours was made to reduce any ‘spikes’ in the surface
grids (which were minimal).
With respect to
structural features, the SW Property is directly north of a major fault system known as the State Line Fault Complex. In addition to the
State Line Fault, a newly defined east-west-trending fault zone was discovered in the south-central part of the SWA Property during the
modelling of the Smackover Formation and adjacent formations (see Section 9.1, Subsurface Data Review). The author conclude
the SWA Property fault has some local modification of the strata, but in general, do not disrupt the Property-scale stratigraphic continuity
and interpretation of the Smackover Formation.
Once the data were properly input, reviewed, and
interpreted, the following surface contour files were generated:
| 1. | The top of the Upper Smackover Formation as defined by log data from 104 wells and seismic data; and |
| 2. | The base of the Upper Smackover Formation (equivalent to the top of the Middle Smackover Formation) as
defined by log data from 32 wells. |
14.4.3 Three-Dimensional Modelling and Volume Calculation
APEX used the surface contour files representing
the top and bottom surfaces of the Upper Smackover Formation at 3.1 m (10 foot) intervals (Figures 9-1 and 9-2) to construct a 3-D wireframe
of the Upper Smackover Formation that is used to define the SWA Upper Smackover Formation aquifer domain in the North and South resource
areas (Figures 14-2 and 14-3). The base of the Middle Smackover Formation was modelled at a continuous depth interval of 12 m (40 feet)
below the top of the Middle Smackover Formation.
The Upper and Middle Smackover formations aquifer
domains were clipped to the Property boundary and to the Lease boundaries and provides the starting point to evaluate the volume of the
Upper and Middle Smackover formations domain aquifer underlying the SWA Property. Any non-lease areas, including those that are situated
within the general boundary of the SWA Property, were removed from the resource areas and resource estimation process used in this Technical
Report.
The spatial extent and vertical thicknesses of
the Upper and Middle Smackover formations in the North and South SWA Property resource areas is summarized in Table 14-1. Pertinent unit
thickness information includes the following:
| · | The Upper Smackover Formation occurs underneath
the entire Property at depths of approximately -2,893 to -2,230 m below sea level (-9,491 to -7,317 feet). |
| · | The average thickness of the Upper Smackover
Formation is 50.8 and 47.7 m in the South and North resource areas, respectively. |
| · | The Middle Smackover Formation aquifer occurs
underneath the entire Property at depths of approximately -2,905 to -2,276 m below sea level (-9,531 to -7,277 feet). |
| · | The average thickness of the Middle Smackover
Formation was reasonably set based on the author’s review of the unit at an assigned thickness of 12.2 m (40 ft) through the entire
SWA Property area. |
| Standard Lithium Ltd. SW Arkansas Lithium Project PEA | Page 95 |

Figure 14-2. Orthogonal view of Property boundary
(thick black line), drillhole collars (circles), drillhole traces (black lines), and interpreted Upper Smackover Formation (north - green
solid, south – brown solid). The holes in the model show areas that are not under lease and have therefore been removed from the
resource modelling and estimation process. Vertical exaggeration of 3:1.
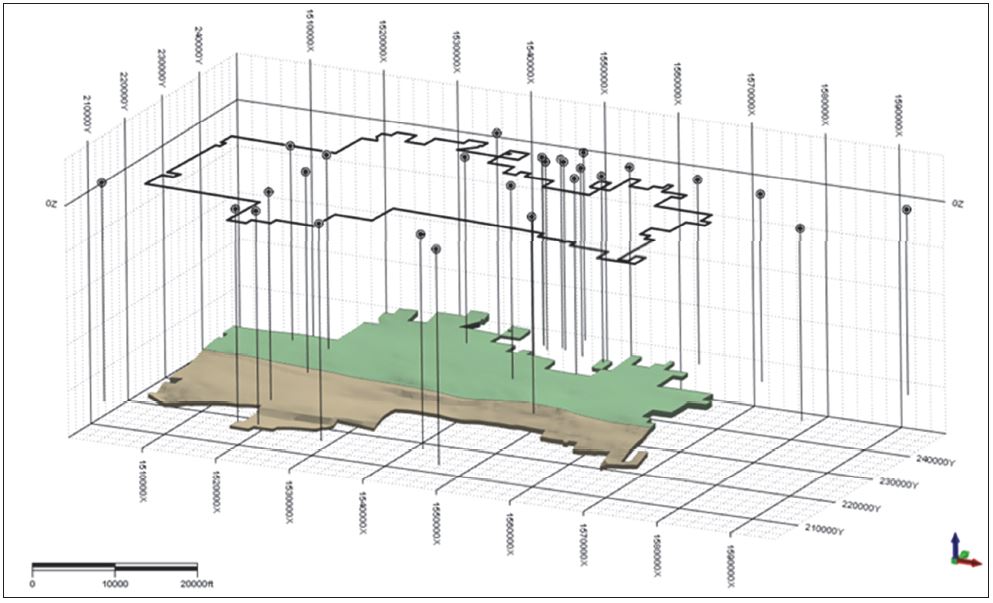
| Standard Lithium Ltd. SW Arkansas Lithium Project PEA | Page 96 |
Figure 14-3. Cross-sections to show vertical
extent of the Upper and Middle Smackover formations, in the North and South resource areas. Vertical exaggeration of 5:1
| A) | North resource area along 230000N looking north |
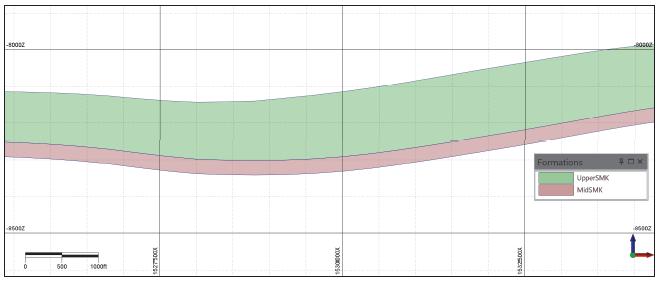
| B) | South resource area along 220000N looking north |
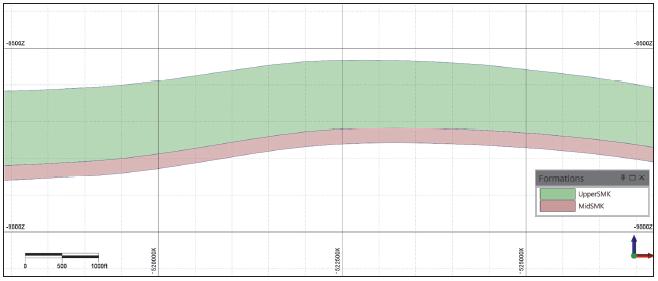
| Standard Lithium Ltd. SW Arkansas Lithium Project PEA | Page 97 |
The spatial extent and vertical thicknesses of
the Upper and Middle Smackover formations in the North and South SWA Property Resource areas is summarized in Table 14-1. Pertinent unit
thickness information includes the following:
| · | The Upper Smackover Formation occurs underneath
the entire Property at depths of approximately -2,893 to -2,230 m below sea level (-9,491 to -7,317 feet). |
| · | The average thickness of the Upper Smackover
Formation is 50.8 and 47.7 m in the South and North resource areas, respectively. |
| · | The Middle Smackover Formation aquifer occurs
underneath the entire Property at depths of approximately -2,905 to -2,276 m below sea level (-9,531 to -7,277 feet). |
| · | The average thickness of the Middle Smackover
Formation was reasonably set based on the authors review of the unit at an assigned thickness of 12.2 m (40 ft) through the entire SWA
Property area. |
Table 14-1. Spatial extents of the resource
areas and Upper and Middle Smackover Formations at the SWA Property.
| | |
South Resource Area | | |
North Resource Area | |
| | |
Upper Smackover | | |
Middle Smackover
1 | | |
Upper Smackover | | |
Middle
Smackover 1 | |
| Area (km2) | |
| 57.769 | | |
| 57.769 | | |
| 88.613 | | |
| 88.613 | |
| Thickness: SW corner (m) | |
| 47.3 | | |
| 12.192 | | |
| 60.0 | | |
| 12.2 | |
| Thickness: SEcorner (m) | |
| 46.9 | | |
| 12.192 | | |
| 61.0 | | |
| 12.2 | |
| Thickness: NE corner (m) | |
| 61.0 | | |
| 12.192 | | |
| 75.5 | | |
| 12.2 | |
| Thickness: NW corner (m) | |
| 60.0 | | |
| 12.192 | | |
| 43.3 | | |
| 12.2 | |
| Thickness: east-center (m) | |
| 60.9 | | |
| 12.192 | | |
| 49.8 | | |
| 12.2 | |
| Thickness: west-center (m) | |
| 62.0 | | |
| 12.192 | | |
| 43.6 | | |
| 12.2 | |
| Thickness: average (m) | |
| 50.8 | | |
| 12.192 | | |
| 47.7 | | |
| 12.2 | |
| Volume (km3) | |
| 2.852 | | |
| 0.704 | | |
| 4.226 | | |
| 1.080 | |
1 The Middle Smackover had an assigned thickness
of 12.2 m throughout the TETRA Property.
The author has investigated the stratigraphic
continuity of the Upper and Middle Smackover formations in the 3D model. As per the quantitative summary in Table 14-1, the Smackover
Formation rock units have generally uniform thicknesses throughout the Property but do decrease and dip sharply in thickness and orientation
in the southernmost part of the Property. To explore this, we modelled the fault zones in their appropriate 3-D orientation such that
the juxtaposition of Smackover Formation strata near the faults is correctly accounted for.
As a result, the author proposes that the thickness
and dip of the southernmost Smackover Formation strata is being influenced locally by the Arkansas-Louisiana State Line Fault Complex,
which occurs directly south of the Property and strikes in an east-west orientation (Figure 14-1).
While the influence of the State Line Fault on
stratigraphy is evident, there is only minor stratigraphic variation observed in Smackover Formation strata near the central SWA Property
fault zone (Figure 14-4). Despite the structural influence on the Smackover strata, Figure 14.4 shows that the Upper and Middle Smackover
formations strata are still continuous in all directions around the fault zones.
| Standard Lithium Ltd. SW Arkansas Lithium Project PEA | Page 98 |
Accordingly, the authors conclude the State Line
Fault does influence the proximal orientation and thickness of the Smackover Formation units, but the fault zones do not, in any way,
separate the overall stratigraphic continuity of the strata at the SWA Property. We assume this would also apply to hydraulic interconnectivity
of Upper and Middle Smackover formations domain aquifers, both horizontally and vertically, across the Property.
Based on this review of the subsurface stratigraphy
and structural features within the 3D model, and conclusion of stratigraphic and aquifer continuity, the authors calculated the volumes
of the Upper and Middle Smackover formations as they relate to the resource estimation reported in this Technical Report. The aquifer
volumes of the four resource estimation areas include:
| · | North Upper Smackover aquifer volume = 4.226
km3; |
| · | North Middle Smackover aquifer volume = 1.080
km3; |
| · | South Upper Smackover aquifer volume = 2.852
km3; and |
| · | South Middle Smackover aquifer volume = 0.704
km3 (Table 14.1). |
| Standard Lithium Ltd. SW Arkansas Lithium Project PEA | Page 99 |
Figure 14-4. Position of the State Line Fault
Complex and its influence on the Upper Smackover Formation domain strata. Abbreviations: UpperSMK – Upper Smackover Formation; MidSmk
– Middle Smackover Formation

| Standard Lithium Ltd. SW Arkansas Lithium Project PEA | Page 100 |
| 14.5 | Step 2 Hydrogeological Characterization of the Upper and Middle Smackover Formations |
The Upper and Middle
Smackover formations represent a large-scale confined aquifer that is bounded by two aquitards. The basal aquitard is defined by the Lower
Smackover Formation, or Brown Dense, which underlies the Middle Smackover and Reynolds Members. The Lower Smackover Formation is composed
of fine-grained lime mud (Section 7.3, Smackover Formation). Underlying the Brown Dense, basin-wide restriction resulted in
deposition of a thick succession of the Louann Salt that covers much of the Gulf of Mexico region (Section 7.1, Gulf Coast Tectono-Depositional
Framework).
Cross-formational fluid movement above the Smackover
Formation is restricted by the overlying Buckner Formation, which consists of anhydrite and shale (Moore & Druckman, 1981; Vestal,
1950). The Buckner Formation acts as a top seal for hydrocarbons and brine (Parker, 1973). The oil, gas and brine are contained within
the Upper and Middle Smackover formations creating a confined aquifer.
For this Technical
Report two resource units, the Upper and Middle Smackover formations, have been identified. As discussed in Sections 7.4 (Property Geology:
Characterization of the Smackover Formation) and 14.1 (Introduction), the justification to split into two adjoining units is based on:
1) by stratigraphic nomenclature and definition such that the two units can be distinguished in electronic log profiles (see Section 9.2);
and 2) both formations exhibit uniquely representative porosities, which is not atypical of a Carbonate reservoir (Mazzullo and
Chilingarian, 1992). However, based upon the porosities and permeabilities within the Upper and Middle Smackover formations act as one
hydrogeologic unit. That is, there isn’t a laterally continuously low permeability layer or confining unit that divides the hydrogeological
parameters of the Upper Smackover Formation from the Middle Smackover Formation.
Because the Smackover Formation has been subject
to decades of hydrocarbon and brine exploration, hydrogeological conditions are well documented in the public domain. The hydrogeological
properties of the Upper and Middle Smackover formations are discussed in more detail in the following sections.
Multiple sources of information were used to assess
the porosity of the Upper and Middle Smackover formations, including: LAS density porosity logs; published Government, academic and journal
literature; and independent laboratory analysis conducted on well cores from the SWA Property and surrounding area.
As discussed previously, the Smackover Formation
has economic quantities of oil, gas and brine. Over the years, core samples have been collected and analysed for porosity and permeability
to understand these properties. One extensive study by the United States Geological Survey (USGS) summarized more than 1,935 Smackover
Formation core samples over southern Arkansas and analysed for porosity (Manger, 1963; Table 14-2).
The porosity of the more than 1,935 core samples
from the Smackover Formation oil fields varied from 2% to 23.9% with an average of 14.3% (Table 14-2). According to the USGS study, porosity
measured was either effective porosity or very likely to be effective porosity (these data are referred to as effective porosity in this
Technical Report). Typically, effective porosity is calculated from the core laboratory analysis or through field testing. Effective porosity
is an important parameter when assessing lithium-brine resources in a confined aquifer as it is a measure of the interconnectedness of
pores through which the brine would flow to production wells.
| Standard Lithium Ltd. SW Arkansas Lithium Project PEA | Page 101 |
The McKamie-Patton oil field is located on the
southern portion of the SWA Property and included in the USGS study (Manger, 1963). The average effective porosity of the McKamie-Patton
field from 1,767 core-plug samples was 14.2% (Manger, 1963; Table 14-2). Additionally, 14 core-plug samples from the same field had an
average effective porosity of 7.5% (Manger, 1963). These effective porosities were enough to allow the economic extraction of oil from
the Smackover Formation since the 1940s to present day.
Table 14-2. Summary of Smackover Formation porosity
(from Manger,1963).
| Location | |
Distance
to Property (km and direction) | |
Approximate
Depth (m) | |
Number
of Samples | | |
Minimum Effective Porosity
(%) | | |
Maximum Effective Porosity
(%) | | |
Average Effective Porosity
(%) | |
| Reynolds Unit, Cairo Field, Arkansas* | |
45 km East | |
≈2,377 | |
| NA | | |
| NA | | |
| NA | | |
| 17 | |
| Reynolds Unit, Dorcheat Pool, Arkansas* | |
70 km East | |
2,749 - 2,771 | |
| NA | | |
| 2 | | |
| 20 | | |
| 12 | |
| Reynolds Unit, Schuler Field, Arkansas* | |
45 km East | |
2,332 - 2,365 | |
| NA | | |
| NA | | |
| 23 | | |
| 16.7 | |
| Reynolds Unit, Various Fields, Arkansas | |
| |
2,210 - 2,332 | |
| 4 | | |
| 16.4 | | |
| 20.0 | | |
| 18.0 | |
| Smackover Formation, Various Fields, Arkansas | |
| |
≈2,393 | |
| 150 | | |
| 0 | | |
| 23.9 | | |
| 14.5 | |
| Smackover Formation, McKamie-Patton pool, Arkansas* | |
On Property | |
≈2,835 | |
| 1,767 | | |
| NA | | |
| NA | | |
| 14.2 | |
| Smackover Formation, McKamie-Patton pool, Arkansas | |
On Property | |
2,780 - 2,860 | |
| 14 | | |
| 0 | | |
| 16.4 | | |
| 7.5 | |
| | |
| |
| |
| | | |
| | | |
| Average Total | | |
| 14.3 | |
Notes
[1] NA denotes not available.
[2] * denotes very likely to be effective porosity.
Historically core samples were collected and analysed
from wells drilled within the SWA Property. A summary of core analyses is provided in Table 14-3. Figure 14-5 shows the locations of the
wells where core samples were analysed and used to assess the properties of the Smackover Formation. A total of 165.4 m (542.5 feet) of
core has been collected and analysed mostly at 0.3 m (1 foot) intervals from 10 different wells. From these wells, 515 core plug samples
from the Smackover Formation were analysed for porosity and permeability. The average effective porosity ranged from 0.7 to 31.0%. All
within SWA Property Smackover Formation measurements combined yield an overall average effective porosity of 10.2%.
Of the 515 core plug measurements from the SWA
Property, 219 measurements were from two wells (MKP#17 and MKP#19) located in the McKamie-Patton field. The core plug analyses for these
wells were completed in 1954. The porosity measurements were likely included in the USGS study published in 1963 that identified the porosity
measured from the McKamie-Patton field as very likely effective porosity (Manger, 1963).
| Standard Lithium Ltd. SW Arkansas Lithium Project PEA | Page 102 |
Table 14-3. Summary porosity and permeability
measurements conducted on historical core samples from wells located within the SWA Property area.
| | |
| | |
| | |
| | |
Porosity (%) | | |
Permeability (mD) | |
| | |
Number of | | |
Continuously cored interval | | |
Continuously cored interval | | |
| | |
| | |
| | |
| | |
| | |
| |
| Well ID | |
samples | | |
(m) | | |
(feet) | | |
Min. | | |
Max. | | |
Avg. | | |
Min. | | |
Max. | | |
Avg. | |
| Lester 1 | |
| 34 | | |
| 13.1 | | |
| 43.0 | | |
| 1.2 | | |
| 17.4 | | |
| 5.1 | | |
| 0.0 | | |
| 43 | | |
| 2.6 | |
| Carter Moore 1 | |
| 45 | | |
| 13.9 | | |
| 45.5 | | |
| 1.8 | | |
| 22.5 | | |
| 14.3 | | |
| 0.0 | | |
| 270 | | |
| 45.5 | |
| Lowery 1 | |
| 47 | | |
| 9.0 | | |
| 29.5 | | |
| 0.7 | | |
| 14.0 | | |
| 5.5 | | |
| 0.0 | | |
| 1368 | | |
| 93.7 | |
| Cornelius 1 | |
| 13 | | |
| 2.4 | | |
| 8.0 | | |
| 1.3 | | |
| 9.2 | | |
| 4.3 | | |
| 0.0 | | |
| 3.7 | | |
| 0.3 | |
| Vera Dixon 1 | |
| 44 | | |
| 6.4 | | |
| 21.0 | | |
| 0.9 | | |
| 26.7 | | |
| 10.1 | | |
| 0.0 | | |
| 76 | | |
| 3.3 | |
| Neal Ellis 1 | |
| 64 | | |
| 18.6 | | |
| 61.0 | | |
| 1.9 | | |
| 24.5 | | |
| 18.3 | | |
| 0.0 | | |
| 115 | | |
| 13.3 | |
| Big Six Oil Company | |
| 21 | | |
| 6.1 | | |
| 20.0 | | |
| 1.2 | | |
| 17.6 | | |
| 11.9 | | |
| 0.0 | | |
| 24.0 | | |
| 3.6 | |
| Fina McGoogan 1 | |
| 28 | | |
| 10.5 | | |
| 34.5 | | |
| 1.4 | | |
| 14.6 | | |
| 6.7 | | |
| 0.0 | | |
| 259 | | |
| 15.2 | |
| MKP#17 | |
| 113 | | |
| 41.8 | | |
| 137.0 | | |
| 4.0 | | |
| 31.0 | | |
| 13.0 | | |
| 0.0 | | |
| 2330 | | |
| 146.1 | |
| MKP#19 | |
| 106 | | |
| 43.6 | | |
| 143.0 | | |
| 1.9 | | |
| 20.4 | | |
| 12.4 | | |
| 0.0 | | |
| 2590 | | |
| 209 | |
| Totals | |
| 515 | | |
| 165.4 | | |
| 542.5 | | |
| | | |
| Averages | | |
| 10.2 | | |
| | | |
| | | |
| 53.3 | |
As part of the 2018 exploration program, Standard
Lithium reviewed core from the SWA Property stored at the Arkansas Geological Survey Core Laboratory in Little Rock, Arkansas (see Section 9.1.3
Core Report Analysis and Review.). Based upon the review of the core, Standard Lithium collected 18 select Smackover Formation core plugs
and analysed the core for porosity and permeability to verify the historical results. A total of 15.1 m (49.5 feet) of core was analysed
at select intervals from five different wells. The sample process simulated a grab-sampling approach and therefore is not representative
of the collection of a continuous core sample.
The laboratory analytical results from Standard
Lithium’s core plug testing program is summarized in Table 14-4. The effective porosity ranged from 12.1% to 22.4% and have an overall
average effective porosity of 17.8%.
As part of the historical compilation, core sample
porosity measurements were reviewed from wells that directly surround the SWA Property. A summary of permeability and porosity data is
presented in Table 14-5 and Figure 14-5. A total of 379 m (1243 feet) of core has been collected and analysed mostly at 0.3 m (1 foot)
intervals from 22 different wells. From these wells, 1,110 core plug samples from the Smackover Formation were analysed for porosity and
permeability. The average porosity ranged from 0.2 to 28.5%. All historical porosity measurements in the general area of the SWA Property
yield a combined average effective porosity of 8.6%.
Of the 1,110 core plug measurements from the SWA
Property area, 673 measurements were from six wells (MKP#2, MKP#4, MKP#7, MKP#8, MKP#10 and MKP#23) located in the McKamie-Patton field.
The core plug analyses for these wells were completed between 1942 and 1956. The porosity measurements were likely included in the USGS
study published in 1963 that identified the porosity measured from the McKamie-Patton field as very likely effective porosity (Manger,
1963; see Table 14.2).
| Standard Lithium Ltd. SW Arkansas Lithium Project PEA | Page 103 |
Figure 14-5. Location of the core holes and
corresponding well identifiers.
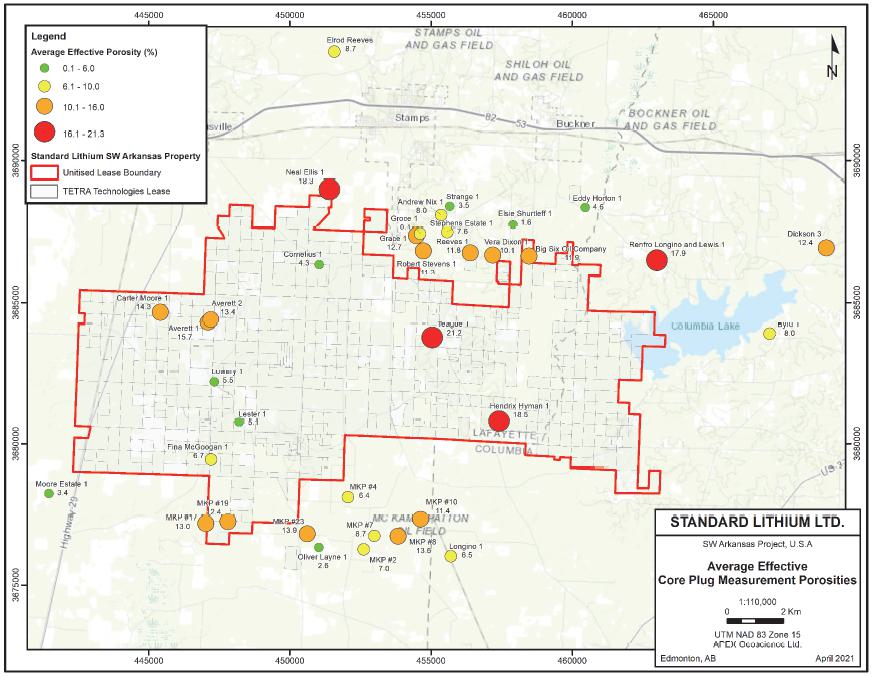
| Standard Lithium Ltd. SW Arkansas Lithium Project PEA | Page 104 |
Table 14-4. Porosity and permeability measurements
conducted by Standard Lithium core samples from select wells located on the SWA Property.
| | |
| | |
| | |
| | |
Porosity (%) | | |
Permeability (mD) | |
| | |
Number
of | | |
Grab sample
cored interval | | |
Grab sample
cored interval | | |
| | |
| | |
| | |
| | |
| | |
| |
| Well ID | |
samples | | |
(m) | | |
(feet) | | |
Min. | | |
Max. | | |
Avg. | | |
Min. | | |
Max. | | |
Avg. | |
| Averret 1 | |
| 8 | | |
| 10.1 | | |
| 33.0 | | |
| 13.1 | | |
| 19.2 | | |
| 15.7 | | |
| 2.8 | | |
| 505.0 | | |
| 196.0 | |
| Averret 2 | |
| 3 | | |
| 1.5 | | |
| 5.0 | | |
| 12.1 | | |
| 14.5 | | |
| 13.4 | | |
| 299.0 | | |
| 712.0 | | |
| 524.7 | |
| Vera Dixon
1 | |
| 1 | | |
| 0.2 | | |
| 0.5 | | |
| 20.3 | | |
| 20.3 | | |
| 20.3 | | |
| 1.6 | | |
| 1.6 | | |
| 1.6 | |
| Teague 1 | |
| 3 | | |
| 1.4 | | |
| 4.5 | | |
| 20.0 | | |
| 22.4 | | |
| 21.2 | | |
| 91.0 | | |
| 488.0 | | |
| 229.7 | |
| Hendrix
Hyman 1 | |
| 3 | | |
| 2.0 | | |
| 6.5 | | |
| 15.3 | | |
| 20.4 | | |
| 18.5 | | |
| 146.0 | | |
| 1183.0 | | |
| 783.0 | |
| Totals | |
| 18 | | |
| 15.1 | | |
| 49.5 | | |
| | | |
| Averages | | |
| 17.8 | | |
| | | |
| | | |
| 347.0 | |
Table 14-5. Historical porosity and permeability
measurements core samples near the SWA Property.
| |
|
|
|
|
|
|
|
|
|
|
|
|
Porosity (%) |
|
Permeability (mD) |
|
| Well
ID |
|
Spatial
reference to the
TETRA Property |
|
Number
of samples |
|
|
Continuously
cored interval
(m) |
|
|
Continuously
cored interval
(feet) |
|
|
Min. |
|
|
Max. |
|
|
Avg. |
|
|
Min. |
|
|
Max. |
|
|
Avg. |
|
| Elrod Reeves |
|
North |
|
|
34 |
|
|
|
5.0 |
|
|
|
16.5 |
|
|
|
1.8 |
|
|
|
15.7 |
|
|
|
8.7 |
|
|
|
0.0 |
|
|
|
173 |
|
|
|
33.5 |
|
| Grace 1 |
|
North |
|
|
8 |
|
|
|
2.1 |
|
|
|
7.0 |
|
|
|
2.9 |
|
|
|
19.5 |
|
|
|
12.7 |
|
|
|
0.0 |
|
|
|
412 |
|
|
|
133.1 |
|
| Groce 1 |
|
North |
|
|
61 |
|
|
|
6.1 |
|
|
|
20.0 |
|
|
|
1.7 |
|
|
|
22.3 |
|
|
|
8.4 |
|
|
|
0.0 |
|
|
|
168 |
|
|
|
30.4 |
|
| Stephens Estate 1 |
|
North |
|
|
16 |
|
|
|
4.4 |
|
|
|
14.5 |
|
|
|
3.8 |
|
|
|
10.8 |
|
|
|
7.6 |
|
|
|
0.0 |
|
|
|
4 |
|
|
|
0.3 |
|
| Robert Stevens 1 |
|
North |
|
|
15 |
|
|
|
4.0 |
|
|
|
13.0 |
|
|
|
3.6 |
|
|
|
18.8 |
|
|
|
11.3 |
|
|
|
0.0 |
|
|
|
250 |
|
|
|
55.6 |
|
| Andrew Nix 1 |
|
North |
|
|
36 |
|
|
|
5.5 |
|
|
|
18.0 |
|
|
|
1.3 |
|
|
|
15.7 |
|
|
|
8.0 |
|
|
|
0.0 |
|
|
|
90 |
|
|
|
6.2 |
|
| Reeves 1 |
|
North |
|
|
20 |
|
|
|
4.1 |
|
|
|
13.5 |
|
|
|
7.4 |
|
|
|
15.8 |
|
|
|
11.8 |
|
|
|
0.0 |
|
|
|
56 |
|
|
|
9.8 |
|
| Strange 1 |
|
North |
|
|
18 |
|
|
|
2.7 |
|
|
|
9.0 |
|
|
|
1.0 |
|
|
|
9.4 |
|
|
|
3.5 |
|
|
|
0.0 |
|
|
|
0 |
|
|
|
0.0 |
|
| Elsie Shurtleff 1 |
|
North |
|
|
5 |
|
|
|
3.7 |
|
|
|
12.0 |
|
|
|
0.7 |
|
|
|
2.7 |
|
|
|
1.6 |
|
|
|
0.0 |
|
|
|
0 |
|
|
|
0.0 |
|
| Eddy Horton 1 |
|
North |
|
|
42 |
|
|
|
7.9 |
|
|
|
26 |
|
|
|
0.2 |
|
|
|
11.3 |
|
|
|
4.6 |
|
|
|
0.0 |
|
|
|
111 |
|
|
|
3.0 |
|
| Renfro Longino and Lewis 1 |
|
North |
|
|
62 |
|
|
|
17.4 |
|
|
|
57 |
|
|
|
5.4 |
|
|
|
28.5 |
|
|
|
17.9 |
|
|
|
0.0 |
|
|
|
2,670 |
|
|
|
198.1 |
|
| Byrd 1 |
|
East |
|
|
8 |
|
|
|
13.7 |
|
|
|
45 |
|
|
|
2.5 |
|
|
|
16.4 |
|
|
|
8 |
|
|
|
0.0 |
|
|
|
675 |
|
|
|
126.9 |
|
| Dickson 3 |
|
East |
|
|
34 |
|
|
|
6.6 |
|
|
|
21.5 |
|
|
|
2.1 |
|
|
|
19.4 |
|
|
|
12.4 |
|
|
|
0.0 |
|
|
|
198 |
|
|
|
34.5 |
|
| Moore Estate 1 |
|
South |
|
|
70 |
|
|
|
10.5 |
|
|
|
34.5 |
|
|
|
0.8 |
|
|
|
12.8 |
|
|
|
3.4 |
|
|
|
0.0 |
|
|
|
4.08 |
|
|
|
0.3 |
|
| Oliver Layne 1 |
|
South |
|
|
5 |
|
|
|
1.2 |
|
|
|
4 |
|
|
|
1.4 |
|
|
|
6.1 |
|
|
|
2.6 |
|
|
|
0.0 |
|
|
|
0 |
|
|
|
0.0 |
|
| Longino 1 |
|
South |
|
|
3 |
|
|
|
0.6 |
|
|
|
2 |
|
|
|
3.9 |
|
|
|
11 |
|
|
|
6.5 |
|
|
|
0.8 |
|
|
|
37 |
|
|
|
13.5 |
|
| MKP#2 |
|
South |
|
|
101 |
|
|
|
30.5 |
|
|
|
100 |
|
|
|
1.2 |
|
|
|
19.3 |
|
|
|
7 |
|
|
|
0.0 |
|
|
|
30 |
|
|
|
1.4 |
|
| MKP#4 |
|
South |
|
|
136 |
|
|
|
41.8 |
|
|
|
137 |
|
|
|
1.5 |
|
|
|
16 |
|
|
|
6.4 |
|
|
|
0.0 |
|
|
|
1765 |
|
|
|
108.6 |
|
| MKP#7 |
|
South |
|
|
161 |
|
|
|
48.5 |
|
|
|
159.0 |
|
|
|
1.2 |
|
|
|
18.3 |
|
|
|
8.7 |
|
|
|
0.0 |
|
|
|
5980 |
|
|
|
227.7 |
|
| MKP#8 |
|
South |
|
|
69 |
|
|
|
67.1 |
|
|
|
220.0 |
|
|
|
1.9 |
|
|
|
23.1 |
|
|
|
13.6 |
|
|
|
0.0 |
|
|
|
2292 |
|
|
|
180.2 |
|
| MKP#10 |
|
South |
|
|
106 |
|
|
|
36.9 |
|
|
|
121.0 |
|
|
|
1.6 |
|
|
|
21.8 |
|
|
|
11.4 |
|
|
|
0.0 |
|
|
|
2730 |
|
|
|
113.5 |
|
| MKP#23 |
|
South |
|
|
100 |
|
|
|
58.8 |
|
|
|
193.0 |
|
|
|
4.4 |
|
|
|
26.8 |
|
|
|
13.9 |
|
|
|
0.0 |
|
|
|
997 |
|
|
|
144.1 |
|
| |
|
Totals |
|
|
1110 |
|
|
|
379.0 |
|
|
|
1243.5 |
|
|
|
Averages |
|
|
8.6 |
|
|
|
|
|
|
|
|
|
|
|
64.6 |
|
Within, or directly adjacent to the SWA Property,
29 wells contained LAS density porosity logs. These logs were digitized in stratigraphic sections including, and directly adjacent to
the Upper and Middle Smackover formations. In total, there were 5,143 total porosity measurements that have an average total porosity
of 9.2% when negative porosities were removed (Table 14-6).
To end, the reader is referred to Section 14.6
to review a statistical assessment of effective porosity that is used in the resource estimation. Total porosity from the LAS density
logs were not used in the resource estimation (until a proper assessment of the negative values can be conducted and potentially rectified).
| Standard Lithium Ltd. SW Arkansas Lithium Project PEA | Page 105 |
Table 14-6. Summary of the converted wireline
density porosity dataset emphasizing the component of negative values and their influence on the average total porosity.
| | |
All porosity data
(including negative
values) | | |
A subset of the porosity
data with all negative
values removed | |
| | |
Porosity
record
count | | |
Average
porosity | | |
Porosity
record
count | | |
Average
porosity | |
| All total porosity measurements | |
| 5143 | | |
| 3.2 | | |
| 3194 | | |
| 9.2 | |
Upper Smackover Fm. total
porosity measurements | |
| 1975 | | |
| -3.7 | | |
| 511 | | |
| 7.7 | |
Middle Smackover Fm. total
porosity measurements | |
| 518 | | |
| 4.8 | | |
| 365 | | |
| 9.5 | |
A summary of the published permeability values
for the Smackover Formation in southern Arkansas is presented in Table 14-7. Historical published permeability values varied from 0.0
millidarcies (mD) to 5,520 mD with an average of 338 mD.
Fortunately, and specific to the SWA Property,
historical permeability measurements were conducted on core plugs from the Smackover Formation from 10 wells presented in Table 14-3.
Core plug permeability data includes measurements from the 515 samples that yielded values ranging from 0 to 2,590 mD with an average
permeability of 53.3 mD (see Table 14-3).
In 2018, Standard Lithium completed permeability
measurements from five wells located on the SWA Property (see Table 14-4 and Figure 14-5). Core plug permeability data from the 18 samples
yielded values ranging from 1.6 to 1,183 mD with an average permeability of 347.0 mD.
Historical core sample permeability results were
available from 22 wells located surrounding the SWA Property (Table 14-5 and Figure 14-5). The permeability ranged from 0.0 mD to 5,980
mD. The overall average permeability for wells surrounding the SWA Property was 64.6 mD.
Standard Lithium’s core sampling program
confirmed the historical results that high permeabilities are present on the SWA Property. Additionally, the permeabilities were confirmed
to be variable within the Smackover Formation. To end, as discussed previously, these permeabilities were enough to allow the economic
extraction of hydrocarbons from various fields within the Smackover Formation, particularly the Lewisville, Mars Hill, McKamie NE, McKamie-Patton,
Mt Vernon and Kress City Fields that are present within the SWA Property.
| Standard Lithium Ltd. SW Arkansas Lithium Project PEA | Page 106 |
Table 14-7. Summary of historical permeability
values for the Smackover Formation. Reynolds Member is part of the Upper Smackover Formation.
| | |
Permeability (mD) | |
|
| Formation Name (Field/Pool) | |
Minimum | |
Maximum | |
Average | |
Source |
| Reynolds Member | |
38 | |
5520 | |
1686 | |
Fancher and Mackay (1946) |
| Smackover | |
/ | |
/ | |
100 | |
Harris and Dodman (1987) |
| Upper Smackover (Mt. Vernon Field) | |
/ | |
/ | |
120 | |
Harris and Dodman (1987) |
| Smackover | |
1 | |
100 | |
NA | |
Mancini et al. (2012) |
| Upper Smackover (Southern Zone) | |
< 0.01 | |
100(?) | |
NA | |
Moore and Druckman (1981) |
| Smackover (Dolograinstones) | |
/ | |
839 | |
69.1 | |
Prather (1992) |
| Smackover (Sucrosic Dolostones) | |
/ | |
417 | |
25.7 | |
Prather (1992) |
| Smackover (Walker Creek Field) | |
0.1 | |
>5000 | |
30 | |
Bliefnick and Kaldi (1996) |
| Smackover | |
1 | |
100 | |
/ | |
Mancini et al. (2008) |
| 14.5.3 | Porosity-Permeability Observations |
No direct statistical correlation between porosity
and permeability exists in the Smackover Formation. However, if permeability is high, porosity is generally high. The same appears not
to be true if the porosity is high. The highest porosity and permeability values are seen in the oölitic sections of the Smackover
Formation (the Reynolds). Oömoldic intervals are usually lower permeability. There are both oölitic and oömoldic intervals
with porosity reaching 10-15% with little to no permeability. Permeability often fluctuates greatly within an interval, exceeding 50 mD
in a one-foot interval and dropping to almost zero in the next. Core intervals classified as ‘probably brine productive’ by
the core report have permeability values exceeding 0.5mD.
Crystalline limestone (non-oölitic) has overall
low porosity and permeability. Dolomite porosity and permeability varies, which can probably be attributed to it often being interlayered
with limestone with varying thickness.
Regionally, oömoldic porosity occurs along
the updip margins of the Smackover Formation and primary preserved porosity is found in downdip areas near the salt-basin margins (Moore,
1984).
Hydrodynamic dispersion is a phenomenon of groundwater
of different solute concentrations mixing through a process of molecular diffusion and mechanical dispersion (Fetter, 1988). Mechanical
dispersion is a product of the flow velocity (rate of groundwater movement in the aquifer) and the dispersivity (a property of the aquifer).
In a potential production scenario at the SWA Property, mixing would occur when injected tail-brine, free of lithium, combines with in-situ
lithium containing brine in the Upper and Middle Smackover Formations. The reinjected lithium free brine would mix with brine containing
lithium as described by a process of hydrodynamic dispersion.
As the Upper and Middle Smackover formations represents
a permeable aquifer, the hydraulic head differences within the unit will result in fluid migration. Based upon the upper and lower layers
that bound and restrict vertical flow within the Upper and Middle Smackover formations, most of the flow within the aquifer will be lateral
(i.e., the upper and lower bounding surfaces include the overlying Buckner Formation anhydrite and underlying Brown Dense and/or Louann
Salt). Hydrodynamic dispersion occurs within the conventional oil and gas production system but is not currently taking place with respect
to lithium at the SWA Property.
| Standard Lithium Ltd. SW Arkansas Lithium Project PEA | Page 107 |
During future operation of any lithium brine extraction
plant, however, injected brine, free of Lithium, would mix with in-situ lithium-containing brine. In the case of the Upper and
Middle Smackover formations, the large lateral extent and restricted vertical dimension, means the lithium mixing zone would vary laterally
in the aquifer. Dispersivity will result in an increase of the length of the mixing zone along the aquifer as the lithium free brine finds
velocity differences at the pore level within the flow system as well as different flow paths (highest velocities in the largest pore
throats and lowest velocities near the grains).
Predicting the migration of brine with different
lithium concentrations due to reinjected tail-brine, is beyond the scope of this Technical Report. It should be noted that dispersivities
have been measured on the order of 10s of metres (Fetter, 1988). Based upon brine extraction and reinjection volumes that may be associated
with potential brine production at the SWA Property, dispersivity variations of 10s of metres is not an important brine concentration
variability factor within the Upper and Middle Smackover formations. That is, the lateral difference between the injected tail-brine and
in-situ brine will likely be on the order of 10s of meters due to dispersivity alone.
An assessment was completed of the Upper Smackover
Formation (Reynolds Member) anisotropy or the hydraulic properties varying by direction (horizontal versus vertical). A review of published
literature indicated the average Upper Smackover Formation horizontal and vertical permeabilities were reported to be 675 mD and 650 mD,
respectively, for the McKamie-Patton Field (Shreveport Geological Society, 1945). Two wells (MKP#8 and MKP#23) measured both horizontal
and vertical permeability from selected core plugs (Table 14-8). The average horizontal and vertical permeabilities from a total of 51
samples were 285.9 mD and 212.6 mD, respectively.
Therefore, the horizontal permeability is slightly
higher than the vertical permeability based upon the literature information and core analysis in the immediate vicinity of the SWA Property.
A slightly higher horizontal permeability would result in more horizontal flow of brine to production wells; however, the vertical movement
of brine would also be occurring due to the small difference in horizontal and vertical permeability.
Table 14-8. Summary of horizontal and vertical
permeability measurements from the SWA Property and surrounding area
| | |
| |
| | |
| | |
| | |
Permeability (mD) | |
| | |
| |
| | |
| | |
| | |
Horizontal | | |
Vertical | |
| Well
ID | |
Spatial reference
to the
TETRA Property | |
Number
of samples | | |
Continuously cored
interval
(m) | | |
Continuously cored
interval
(feet) | | |
Min. | | |
Max. | | |
Avg. | | |
Min. | | |
Max. | | |
Avg. | |
| MKP#8 | |
South | |
| 21 | | |
| 34.4 | | |
| 113.0 | | |
| 1.0 | | |
| 2292.0 | | |
| 387.0 | | |
| 1.0 | | |
| 1419 | | |
| 273.0 | |
| MKP#23 | |
South | |
| 30 | | |
| 42.1 | | |
| 138.0 | | |
| 1.0 | | |
| 875.0 | | |
| 184.8 | | |
| 0.0 | | |
| 501 | | |
| 152.2 | |
| | |
Totals | |
| 51 | | |
| 76.5 | | |
| 251.0 | | |
| | | |
| Averages | | |
| 285.9 | | |
| | | |
| | | |
| 212.6 | |
| Standard Lithium Ltd. SW Arkansas Lithium Project PEA | Page 108 |
| 14.5.6 | Groundwater Levels in the Smackover Formation |
Fluid levels at wells MKP#20 and MKP#21 were measured
during Standard Lithium’s 2018 exploration program and the collection of brine samples for lithium analysis. The method of fluid
level measurement consisted of lowering the swabbing equipment into the production tubing and detecting a change in the rate of descent
thus indicating the formation water +/- oil fluid level. The depth to the fluid was then recorded. The fluid levels were measured at wells
MKP#20 and MKP#21 were 1,829 and 1,585 m (6,000 and 5,200 feet) below ground surface, respectively.
It should be noted that wells MKP#20 and MKP#21
were not operational at the time of sampling and are currently shut in. (i.e., they were re-opened for the sole intent of sampling the
brine by Standard Lithium).
For comparative purposes we have compiled reservoir
data for the Smackover Formation from nearby fields in southern Arkansas. These data are the ‘original’ reservoir pressure
obtained between 1933 to 1943 (Fancher and MacKay, 1946). The average calculated groundwater depth was 326 m (1,070 feet) below the ground
surface, assuming a water density of 1.2 g/mL (Table 14.9). The original reservoir groundwater depth in the McKamie-Patton Field was calculated
to be 284 m (932 feet) below ground surface.
Therefore, with the extraction of hydrocarbons,
gas and brine from the McKamie-Patton Field since 1940s the reservoir groundwater level has been lowered by approximately 1,423 m (4,668
feet). In the area of wells MKP#20 and MKP#21 the top of the Smackover Formation is about 2,743 m (9,000 feet) below ground level. Thus,
the groundwater level is approximately 1,036 m (3,400 feet) above the top of the Smackover Formation and confirms the aquifer is a confined
aquifer.
| Standard Lithium Ltd. SW Arkansas Lithium Project PEA | Page 109 |
Table 14-9. Original reservoir data from Smackover
Formation oilfields in southern Arkansas (from Francher and MacKay, 1946)
Field name | |
Reservoir pressure | | |
Elevation OWC contact | | |
P/D Ratio | | |
Assumed
ground elevation (feet) | | |
Head Metres | | |
Calculated
water depth (m) | |
| Atlanta | |
| 3821 | | |
| -8000 | | |
| 0.46 | | |
| 256 | | |
| -200.39 | | |
| 278 | |
| Big Creek | |
| 3733 | | |
| -7731 | | |
| 0.46 | | |
| 361 | | |
| -169.95 | | |
| 280 | |
| Buckner | |
| 3195 | | |
| -7010 | | |
| 0.44 | | |
| 292 | | |
| -265.30 | | |
| 354 | |
| Calhoun | |
| 3450 | | |
| -8006 | | |
| 0.42 | | |
| 138 | | |
| -419.52 | | |
| 462 | |
| Columbia | |
| 3750 | | |
| -7817 | | |
| 0.46 | | |
| 256 | | |
| -186.20 | | |
| 264 | |
| Magnolia | |
| 3465 | | |
| -7293 | | |
| 0.45 | | |
| 341 | | |
| -193.41 | | |
| 297 | |
| Mckamie Patton | |
| 4365 | | |
| -9042 | | |
| 0.47 | | |
| 279 | | |
| -199.37 | | |
| 284 | |
| Midway | |
| 2920 | | |
| -6225 | | |
| 0.41 | | |
| 889 | | |
| -187.10 | | |
| 458 | |
| Mt. Holly | |
| 3180 | | |
| -6943 | | |
| 0.44 | | |
| 272 | | |
| -253.66 | | |
| 337 | |
| Shuler | |
| 3550 | | |
| -7420 | | |
| 0.46 | | |
| 249 | | |
| -182.34 | | |
| 258 | |
| Texarkana | |
| 3296 | | |
| -7062 | | |
| 0.44 | | |
| 364 | | |
| -221.99 | | |
| 333 | |
| Village | |
| 3350 | | |
| -7123 | | |
| 0.45 | | |
| 302 | | |
| -208.96 | | |
| 301 | |
| Average | |
| 3506 | | |
| | | |
| 0.45 | | |
| | | |
| | | |
| 326 | |
Note:
Reservoir pressure in pounds per square inch.
| 14.5.7 | Specific Storage and Storativity |
As the Upper and Middle Smackover formations are
a confined aquifer, the specific storage was estimated based on the compressibility of water and the compressibility of the aquifer. The
relationship between specific storage (Ss) and compressibility is described by Kruseman and de Ridder (1994) as follows:
Ss = ρw
g (α + n β)
Where:
ρw = density of the brine (M/L3);
g = acceleration due to gravity (Force/L3);
α= compressibility of aquifer skeleton (L2/Force);
n = porosity; and
β = compressibility of the brine (L2/Force).
Based on the overall porosity of 10.0%, brine
density of 1.200 g/cm3 (see Sections 9.1 and 9.3, 2018 Brine Sampling Program), aquifer compressibility of 2.63 x 10⁻¹¹
m2/N, and brine compressibility of 6.59 x 10⁻¹¹ m2/N (Earlougher, 1977), the specific storage of the
Upper and Middle Smackover formations is estimated to be 3.87 x 10⁻⁷ m-1.
Due to the relatively low compressibility of the
Upper and Middle Smackover formations, the calculated specific storage is at the lower end of typical aquifer materials as shown in Table
4.10.
| Standard Lithium Ltd. SW Arkansas Lithium Project PEA | Page 110 |
Table 14-10. Representative values of specific
storage for various geological materials (from Domenico and Mifflin, 1965; and Batu, 1998).
| Material |
|
Specific storage (ft-1) |
| Plastic clay |
|
7.8x10⁻⁴ to 6.2x10⁻³ |
| Stiff clay |
|
3.9x10⁻⁴ to 7.8x10⁻⁴ |
| Medium hard clay |
|
2.8x10⁻⁴ to 3.9x10⁻⁴ |
| Loose sand |
|
1.5x10⁻⁴ to 3.1x10⁻⁴ |
| Dense sand |
|
3.9x10⁻⁵ to 6.2x10⁻⁵ |
| Dense sandy gravel |
|
1.5x10⁻⁵ to 3.1x10⁻⁵ |
| Rock, fissured |
|
1.0x10⁻⁶ to 2.1x10⁻⁵ |
| Rock, sound |
|
<1.0x10⁻⁶ |
Storativity (S) of the aquifer was determined
by multiplying the average aquifer thickness (Section 14.3) by the specific storage. Using an average combined Upper and Middle Smackover
formations thickness of 61.5 m (202 ft; see Table 14.1) the storativity (dimensionless) of the aquifer is 2.4 x 10⁻⁵.
| 14.5.8 | Hydraulic Conductivity and Transmissivity |
Hydraulic conductivity of the aquifer was calculated
from the permeability measurements of the Upper and Middle Smackover formations core analysis on the property and the physical properties
of the brine (density of 1,200 kg/m3). The relationship between hydraulic conductivity (K) and permeability is described
by Fetter (1988) as follows:
K = Ki (ρw
g / μ)
Where:
Ki = permeability of the aquifer (L2);
ρw = density of the brine (M/L3);
g = acceleration due to gravity (L/T2);
and
μ = dynamic viscosity of the brine (M/(T L)).
The dynamic viscosity
of the brine is 1.4 centipoise at a temperature of 70ºC and density of 1,200 kg/m3 (Cabot Corporation, 2014).
The maximum hydraulic conductivity measured from
the core on the SWA Property was 2.1 x 10⁻⁵ m/s. The average hydraulic conductivity on the SWA Property from the analysis of
515 core samples was 4.4 x 10⁻⁷ m/s. The average hydraulic conductivity is typical of limestone (Freeze and Cherry, 1979).
Transmissivity of the aquifer was determined by
multiplying the average aquifer thickness by the average hydraulic conductivity of the Property. Using an average Upper and Middle Smackover
formations thickness of 61.5 m (202 feet) the average transmissivity of the aquifer is 2.7 x 10⁻⁵ m2/s.
| Standard Lithium Ltd. SW Arkansas Lithium Project PEA | Page 111 |
| 14.5.9 | Summary of Hydrogeological Conditions |
The aquifer associated with the Upper and Middle
Smackover formations is a confined aquifer situated between upper- and lower-bounding aquitards. The brine levels within wells operated
by Mission Creek are about 1,036 m (3,400 feet) above the top of the Smackover Formation based on Standard Lithium’s 2018 brine
sampling program and discussions with Mission Creek (Mr. J. Young, pers. comm., 2018).
The occurrence of reservoir-grade rocks (porosity
and permeability of at least 6% and 0.1 mD) in the Smackover Formation is dependent on: 1) deposition of porous and permeable sediments
in a variety of settings; and 2) diagenetic processes that have preserved, enhanced, or created porosity and permeability both in originally
permeable strata and in originally impermeable or poorly permeable strata (Kopaska-Merkel et al., 1992).
The average effective porosity and permeability
at the SWA Property is 10.2% and 53.3 mD, respectively (Table 14.3). Using an average combined Upper and Middle Smackover formations thickness
of 61.5 m (202 feet) the:
| · | hydraulic conductivity of the aquifer is 4.4
x 10-7 m/s; |
| · | transmissivity of the aquifer is 2.7 x 10⁻⁵
m2/s; and |
| · | storativity of the aquifer is 2.4 x 10⁻⁵. |
These aquifer characteristics were collected from
wells located in the oilfields that have or are currently operating on the SWA Property.
It is the opinion of the author of this Section that
the Upper and Middle Smackover formations (aquifers) at the SWA Property appear to have reservoir and hydrogeologic properties that demonstrate
and meet the criteria for reasonable prospectivity for economic extraction. This supposition is supported by the author who ties this
hydrogeological conclusion together with other points and/or assumptions to further demonstrate the prospect for economic extraction of
lithium-brine at the SWA Property in Section 14.7.4, Evaluation of Reasonable Prospects for Economic Extraction.
| 14.6 | Step 3: Estimate of Average Porosity in the Upper and Middle Smackover Formations Domain Aquifers |
In this sub-section, the authors assess the effective
porosity data (core plug measurements) toward defining the total amount of in-situ brine within the Upper and Middle Smackover
formations domain aquifers within the North and South resource areas. We assessed 1,474 effective measurements from 33 wells, 28 of which
(n=776 measurements) were representative of the Upper and Middle Smackover formations.
Of the 33 wells, 10 were located within the boundary
of the SWA Property and the other 23 wells occur at a maximum horizontal distance of approximately 7,000 m (23,000 feet) from the Property
boundary. All core plug samples were located within the interpreted Upper and Middle Smackover formations domain aquifer described in
Section 14.5.1 (Porosity). The following subsections describe the processing of the data to ensure the calculated effective porosity
values are representative and appropriate for use in the resource calculation. Summary statistics of the un-capped and clustered core
porosity measurements are detailed in Table 14.11.
| Standard Lithium Ltd. SW Arkansas Lithium Project PEA | Page 112 |
Table 14-11. Summary statistics of un-capped
and clustered core porosity measurements for the Upper and Middle Smackover formations.
| | |
Upper Smackover | |
Middle Smackover |
| count | |
368 | |
408 |
| mean | |
10.304 | |
11.312 |
| standard deviation | |
5.891 | |
7.253 |
| variance | |
34.701 | |
52.613 |
| coefficient of variation | |
0.572 | |
0.641 |
| minimum value | |
0.200 | |
0.500 |
| 25th percentile | |
5.100 | |
3.775 |
| 50th percentile | |
10.300 | |
12.200 |
| 75th percentile | |
14.125 | |
17.300 |
| maximum value | |
26.700 | |
31.000 |
Note: The total porosity from the wireline density
logs from 29 wells (n=5,143 total porosity values) was not used to assess the average porosity because there is not enough compatible
data between the effective and total porosity datasets to make meaningful comparisons, and therefore, the authors do not have the confidence
level to:
| 1) | Use the total porosity data from the density logs to develop a block model of the SWA Property Smackover
Formation to estimate the total in-situ brine within the aquifer; or |
| 2) | Depict the average porosity of the SWA Property Smackover Formation based on the total porosity data from
the density logs. |
It is typical to collect data in a manner that
preferentially samples low or high valued areas. This is acceptable practice; however, it produces closely spaced measurements that are
likely statistically redundant. In this case, a simple average of all measurements that does not consider the closeness of data produces
a spatially biased (i.e., clustered) value that does not adequately represent the overall volume of interest. It is therefore desirable
to have spatially representative (i.e., declustered) statistics for global resource assessment and to check estimated models.
Cell declustering calculates a weight for each
datum used to calculate declustered summary statistics and distributions that are spatially representative of the volume of interest,
such as a declustered mean. The calculated weights for data that are close are lower, while data that are far apart are higher. Cell declustering
was performed for core plug porosity measurements from the Upper and Middle Smackover formations.
To ensure porosity is not overestimated, outlier
values that appear higher than expected, relative to the global population, are replaced with a maximum cap value. Extreme outlier values
are valid measurements; however, their spatial continuity is limited compared to the global population, and without treatment, they unreasonably
influence the calculated average value.
| Standard Lithium Ltd. SW Arkansas Lithium Project PEA | Page 113 |
A probability plot illustrating all raw porosity
measurements is used to identify outlier values. Figures 14.6 and 14.7 illustrate a probability plot for core porosity measurements from
the Upper and Middle Smackover formations, respectively. In the Figures, the global population is represented by dense black points while
outliers that breakaway at the high end of the distribution are coloured red. The probability plot of raw porosity values within the Upper
and Middle Smackover (Figures 14.6 and 14.7) formations suggests there are four outlier measurements from the Upper Smackover and six
outlier measurements from the Middle Smackover Formation greater than 24 %.
Hence, a capping level of 24% was applied to raw
porosity measures used to calculate the average effective porosity value. The resulting capped and declustered histogram distributions
of the core porosity measurements from the Upper and Middle Smackover formations are illustrated in Figures 14.8 and 14.9, respectively.
Summary statistics of the capped and declustered core porosity measurements are detailed in Table 14.12. The distribution of porosity
measurements in the Upper and Middle Smackover formations is shown on Figure 14.10.
Figure 14-6. Probability plot of porosity measurements
within the Upper Smackover Formation before capping. The global population and outlier values that are capped are designated by black
and red dots, respectively.
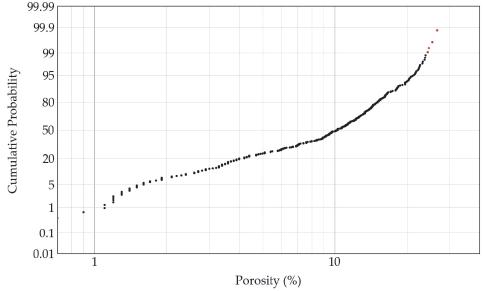
| Standard Lithium Ltd. SW Arkansas Lithium Project PEA | Page 114 |
Figure 14-7 Probability plot of porosity measurements
within the Middle Smackover Formation before capping. The global population and outlier values that are capped are designated by black
and red dots, respectively.

Figure 14-8. Histogram of capped porosity measurements
within the Upper Smackover Formation. Abbreviations: n – number of observations; m – mean; σ – standard deviation;
CV – Coefficient of variation; xmax – Maximum value; x75 to x25 – 75th to
25th percentile; xmin – minimum value
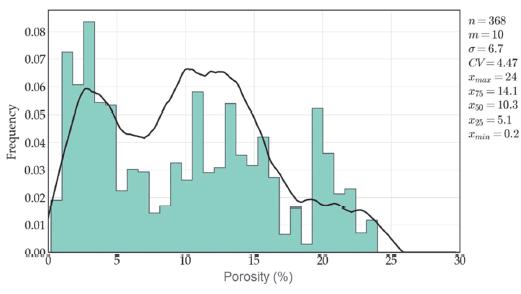
| Standard Lithium Ltd. SW Arkansas Lithium Project PEA | Page 115 |
Figure 14-9. Histogram of capped porosity measurements
within the Middle Smackover Formation. Abbreviations: n – number of observations; m – mean; σ – standard deviation;
CV – Coefficient of variation; xmax – Maximum value; x75 to x25 – 75th
to 25th percentile; xmin – minimum value
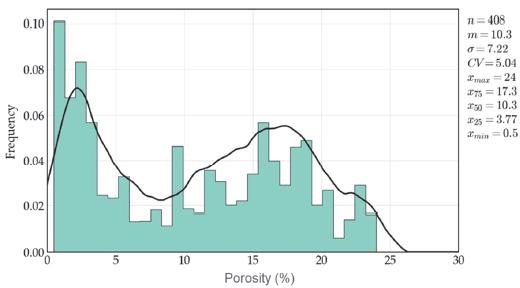
Table 14-12. Summary statistics of capped and
declustered core porosity measurements for the Upper and Middle Smackover Formations.
| | |
Upper Smackover | |
Middle Smackover |
| count | |
368 | |
408 |
| mean | |
10.045 | |
10.343 |
| standard deviation | |
5.856 | |
7.145 |
| variance | |
44.889 | |
52.107 |
| coefficient of variation | |
0.583 | |
0.691 |
| minimum value | |
0.2 | |
0.5 |
| 25th percentile | |
5.1 | |
3.775 |
| 50th percentile | |
10.3 | |
12.2 |
| 75th percentile | |
14.125 | |
17.3 |
| maximum value | |
24 | |
24 |
| 14.7 | Step 4: Pore Space Brine Availability |
Brine within the SWA Property is currently being
pumped from the subsurface Smackover Formation as a waste by-product of oil and gas production. Consequently, the modal abundance of hydrocarbon
and brine must be considered as a component of a resource estimation that is interdependent (at least temporarily) on petro-production.
The authors assume 98% of the pore space in the
Smackover Formation contains brine. This assumption includes both Upper and Middle Smackover Formations and is based on:
| 1. | Personal communication with oil and gas companies in the area (e.g., John Young, Mission Creek Opco LLC,
pers. comm., 2018); |
| 2. | On personal observation of the Smackover Formation brine-oil ratio by the author; |
| Standard Lithium Ltd. SW Arkansas Lithium Project PEA | Page 116 |
| 3. | Smackover Formation oil reservoirs being limited to structural highs with the assumption that only the
uppermost portion of the Smackover Formation reservoir contains production-worthy oil; and |
| 4. | The observation that known oil reservoirs account for less than a roughly estimated 15% of the surface
area at the SWA Property, and hence, the remaining non-oil productive portions of the Smackover Formation should, in theory, be dominated
by brine. |
Aquifer and reservoir conditions underlying the
SWA Property, therefore, support a high brine to oil ratio in the Smackover Formation.
| Standard Lithium Ltd. SW Arkansas Lithium Project PEA | Page 117 |
Figure 14-10. Spatial location of wells with
core-plug effective porosity measurements. The number of porosity measurements from core plug samples from each well are provide beside
the well collar (Upper Smackover Formation values on the right, Middle Smackover Formation values on the left).
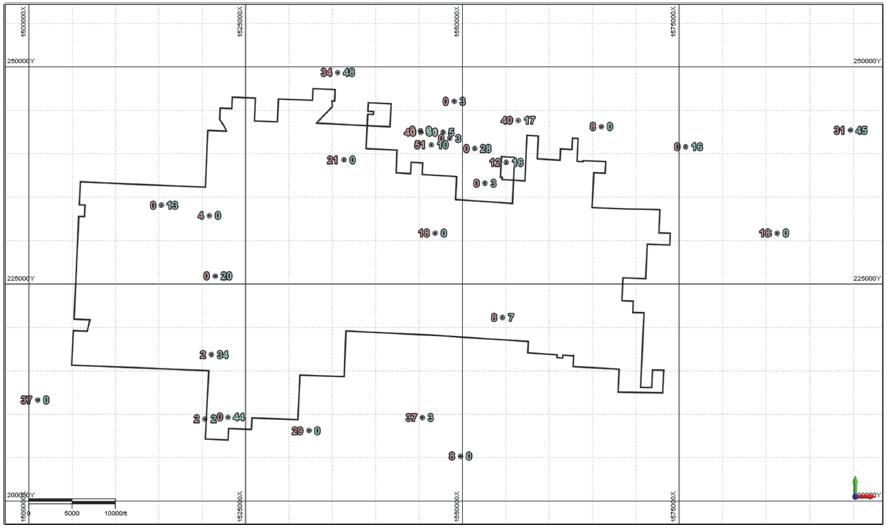
| Standard Lithium Ltd. SW Arkansas Lithium Project PEA | Page 118 |
| 14.8 | Step 5: Lithium-Brine Concentration |
The reader is referred to Section 6, History
and Section 9.2, 2018 Brine Sampling Program for a complete discussion on lithium-brine geochemical results at the SWA Property.
Standard Lithium WetLab results were chosen based on analytical results of the semi-certified standard sample spikes (see Section 11.5.2,
Semi-Certified Standard Sample Comparison).
The average lithium-in-brine concentration used
in the resource estimations presented in this Technical Report are:
| · | 160 mg/L lithium for the North resource area
defined by two historically published analytical results (from Moldovanyi and Walter (1992); and |
| · | 399 mg/L lithium for the South resource area
defined by using two historically published analytical results (from Moldovanyi and Walter (1992) together with WetLab analytical results
from 4 analytical results obtained from 2018 brine sampling conducted by Standard Lithium (Table 14.13). |
| 14.9 | Mineral Resource Estimate |
| 14.9.1 | Definition of Mineral Resource |
The updated SWA
Property inferred Lithium-brine resource estimate has been classified in accordance with guidelines established by the CIM “Estimation
of Mineral Resources and Mineral Reserves Best Practice Guidelines” dated November 29th, 2019, and the CIM “Definition
Standards for Mineral Resources and Mineral Reserves” amended and adopted May 10th, 2014. By definition,
“An Inferred
Mineral Resource is that part of a Mineral Resource for which quantity and grade or quality are estimated on the basis of limited geological
evidence and sampling. Geological evidence is sufficient to imply but not verify geological and grade or quality continuity”.
| 14.9.2 | Resource Classification Methodology |
APEX has classified the SWA Property lithium-brine
resources as an Inferred Mineral Resource. The SWA Property is an early-stage exploration project and there has limited geological sampling
and the geological evidence is sufficient to imply but not verify geological grade or quality continuity.
| Standard Lithium Ltd. SW Arkansas Lithium Project PEA | Page 119 |
Table 14-13. Summary of 2018 geochemical Lithium
data at the SWA Property.
A)
North TETRA
| Well ID | |
Latitude | | |
Longitude | | |
Dominion Land System | |
Total well depth (m) | | |
Well status | |
Lab | |
Li (mg/L) | | |
Br (mg/L) | | |
B
(mg/L) | | |
Na (mg/L) | | |
K (mg/L) | | |
Ca (mg/L) | | |
Mg (mg/L) | | |
Sr (mg/L) | | |
Cl (mg/L) | | |
TDS (mg/L) | | |
Source | |
| Haberyan
1 | |
| 33.29596 | | |
| -93.55113 | | |
2-17S-24W | |
| 2,580 | | |
P&A | |
na | |
| 187 | | |
| 6,856 | | |
| 155 | | |
| 75,625 | | |
| 2,928 | | |
| 43,275 | | |
| 4,538 | | |
| 2,949 | | |
| 204,588 | | |
| 341,953 | | |
| M&W,
1992 | |
| Purser
2 | |
| 33.29984 | | |
| -93.55113 | | |
2-17S-24W | |
| 2,580 | | |
P&A | |
na | |
| 132 | | |
| 5,746 | | |
| 137 | | |
| 62,500 | | |
| 2,285 | | |
| 37,100 | | |
| 3,798 | | |
| 2,483 | | |
| 173,532 | | |
| 288,472 | | |
| M&W,
1992 | |
| | |
| | | |
| | | |
| |
| | | |
| |
Average | |
| 160 | | |
| | | |
| | | |
| | | |
| | | |
| | | |
| | | |
| | | |
| | | |
| | | |
| | |
B) South TETRA
| | |
| | |
| | |
| | |
Total | | |
| | |
| | |
| | |
| | |
| | |
| | |
| | |
| | |
| | |
| | |
| | |
|
| | |
| | |
| | |
Dominion | | |
well | | |
| | |
| | |
| | |
| | |
| | |
| | |
| | |
| | |
| | |
| | |
| | |
|
| | |
| | |
| | |
Land | | |
depth | | |
Well | | |
| | |
Li | | |
Br | | |
B | | |
Na | | |
K | | |
Ca | | |
Mg | | |
Sr | | |
Cl | | |
TDS | | |
|
| Well
ID | |
Latitude | | |
Longitude | | |
System | | |
(m) | | |
status | | |
Lab | | |
(mg/L) | | |
(mg/L) | | |
(mg/L) | | |
(mg/L) | | |
(mg/L) | | |
(mg/L) | | |
(mg/L) | | |
(mg/L) | | |
(mg/L) | | |
(mg/L) | | |
Source |
| Cornelius
1 | |
| na | | |
| na | | |
| 23-17S-24W | | |
| 2,747 | | |
| P&A | | |
| na | | |
| 423 | | |
| 4,276 | | |
| 358 | | |
| 72,500 | | |
| 7,100 | | |
| 29,300 | | |
| 2,243 | | |
| 2,258 | | |
| 176,679 | | |
| 296,891 | | |
M&W,
1992 |
| Cornelius
2 | |
| na | | |
| na | | |
| 23-17S-24W | | |
| 2,756 | | |
| P&A | | |
| na | | |
| 370 | | |
| 3,752 | | |
| 319 | | |
| 63,525 | | |
| 6,150 | | |
| 25,450 | | |
| 1,902 | | |
| 1,964 | | |
| 155,618 | | |
| 260,593 | | |
M&W,
1992 |
| MKP-20-1B | |
| 33.23241 | | |
| -93.55148 | | |
| 35-17S-24W | | |
| 2,885 | | |
| Prod. | | |
| WetLAB | | |
| 347 | | |
| 5,940 | | |
| 260 | | |
| 91,600 | | |
| 6,760 | | |
| 37,700 | | |
| 2,340 | | |
| 2,900 | | |
| 212,000 | | |
| 293,000 | | |
Standard
Lithium, 2018 |
| MKP-20-1B | |
| 33.23241 | | |
| -93.55148 | | |
| 35-17S-24W | | |
| 2,885 | | |
| Prod. | | |
| WetLAB | | |
| 352 | | |
| / | | |
| 255 | | |
| 74,500 | | |
| 5,140 | | |
| 39,400 | | |
| 2,400 | | |
| 2,720 | | |
| 200,000 | | |
| 322,000 | | |
Standard
Lithium, 2018 |
| MKP-20-1 | |
| 33.23241 | | |
| -93.55148 | | |
| 35-17S-24W | | |
| 2,885 | | |
| Prod. | | |
| ALS-H | | |
| 265 | | |
| 4,680 | | |
| 298 | | |
| 59,100 | | |
| 4,090 | | |
| 29,400 | | |
| 2,230 | | |
| 2,050 | | |
| 213,000 | | |
| 365,000 | | |
Standard
Lithium, 2018 |
| MKP-20-1B | |
| 33.23241 | | |
| -93.55148 | | |
| 35-17S-24W | | |
| 2,885 | | |
| Prod. | | |
| ALS-H | | |
| 302 | | |
| / | | |
| bld | | |
| 63,100 | | |
| 4,560 | | |
| 36,200 | | |
| 2,650 | | |
| 2,660 | | |
| / | | |
| 369,000 | | |
Standard
Lithium, 2018 |
| MKP-21 | |
| 33.22617 | | |
| -93.56029 | | |
| 35-17S-24W | | |
| 2,860 | | |
| Prod. | | |
| WetLAB | | |
| 461 | | |
| 6,400 | | |
| 325 | | |
| 66,700 | | |
| 6,800 | | |
| 38,100 | | |
| 2,560 | | |
| 3,010 | | |
| 210,000 | | |
| 348,000 | | |
Standard
Lithium, 2018 |
| MKP-48
(dup of MKP-21) | |
| 33.22617 | | |
| -93.56029 | | |
| 35-17S-24W | | |
| 2,860 | | |
| Prod. | | |
| WetLAB | | |
| 439 | | |
| 6,360 | | |
| 322 | | |
| 56,800 | | |
| 6,450 | | |
| 39,300 | | |
| 2,620 | | |
| 3,070 | | |
| 208,000 | | |
| 391,000 | | |
Standard
Lithium, 2018 |
| MKP-21 | |
| 33.22617 | | |
| -93.56029 | | |
| 35-17S-24W | | |
| 2,860 | | |
| Prod. | | |
| ALS-H | | |
| 380 | | |
| 4,750 | | |
| 310 | | |
| 52,200 | | |
| 5,940 | | |
| 28,500 | | |
| 2,840 | | |
| 1,790 | | |
| 210,000 | | |
| 368,000 | | |
Standard
Lithium, 2018 |
| MKP-48
(dup of MKP-21) | |
| 33.22617 | | |
| -93.56029 | | |
| 35-17S-24W | | |
| 2,860 | | |
| Prod. | | |
| ALS-H | | |
| 425 | | |
| 4,960 | | |
| 342 | | |
| 59,600 | | |
| 6,370 | | |
| 32,900 | | |
| 3,030 | | |
| 2,300 | | |
| 221,000 | | |
| 377,000 | | |
Standard
Lithium, 2018 |
| | |
| | | |
| | | |
| | | |
| | | |
| | | |
| Average | | |
| 399 | | |
| | | |
| | | |
| | | |
| | | |
| | | |
| | | |
| | | |
| | | |
| | | |
|
M&W, 1992 - Moldovany and Walter (1992)
| P&A |
- |
Well is plugged and abandoned |
| Prod. |
- |
Well is currently producing oil |
| bld |
- |
Below the limit of detection |
| / |
- |
Analysis not completed |
| na |
- |
Information not available |
|
| Historical
and 2018 primary-lab (WetLAB) analytical data used to define the average lithium concentration used
in the resource estimation. Note: ALS-H was used as a check-lab. |
| Standard Lithium Ltd. SW Arkansas Lithium Project PEA | Page 120 |
| 14.9.3 | Market Conditions and Pricing |
See Section 19 for an in-depth analysis of
future lithium chemical pricing.
| 14.9.4 | Step 6: Evaluation of Reasonable Prospects for Economic Extraction |
A Mineral Resource is a concentration or occurrence
of a material of economic interest in or on the Earth’s crust in such form, grade or quality and quantity that there are reasonable
prospects for eventual economic extraction. Evaluation of the SWA Property and lithium-brine information associated with the updated SWA
inferred lithium-brine resource estimate has demonstrated and defined prospects for economic extraction. To support this contention, the
reasonable prospect for economic extraction is supported by the following points and/or assumptions:
| · | Property geometry: The unitisation of the SWA
Property would provide the most efficient pathway for the production process by protecting the production rights of the brine operator
and the correlative rights of mineral interest owners (R.C. Lawson, personal communication, 2021). |
| · | Aquifer geometry: The subsurface well data review
shows that the target stratigraphic horizons, the Upper and Middle Smackover formations, are laterally continuous and underlie the entire
SWA Property. |
| · | Hydrogeological characterization: The Smackover
Formation aquifer represents a large-scale aquifer that is bound above and below by two aquitards. The average effective porosity and
permeability on the SWA Property is 10.2 % and 53.3 mD, respectively. The average hydraulic conductivity is 4.4 x 10⁻⁷ m/s,
transmissivity is 2.7 x 10⁻⁵ m2/s and storativity of the aquifer is 2.4 x 10⁻⁵. |
| · | Brine access: Standard Lithium has signed an
agreement with TETRA to access the brine, with an overarching goal to develop commercial extraction of lithium from brine beneath the
SWA Property. |
| · | Brine volume and flow rate: Over the last five
years (2013 to 2017) six Smackover Formation production wells have produced approximately 687 m3 of brine as a waste product
of oil and gas exploration and production. |
| · | Brine grade: The average lithium concentration
of the brine underlying the North and South resource areas is 160 mg/L Li and 399 mg/L, respectively. |
| · | Recoverability: Standard Lithium has
successfully completed the conversion of its Arkansas-produced lithium chloride into 99.985% pure lithium carbonate using OEM technology.
The work was completed by Veolia Water Technologies (Veolia) at their facility in Plainfield, Illinois, and demonstrates that the
lithium chloride intermediate product produced by Standard Lithium’s industrial scale LiSTR DLE Demonstration Plant in Arkansas
can be converted into better-than battery quality lithium carbonate using established OEM carbonation technology (Standard Lithium Ltd.,
2021). |
| · | Product value: Lithium-brine demand is anticipated
to increase due to its large potential resource(s), longer life, lower operating cost and higher margins (Salier, 2018). As global demand
for lithium increases, production technology has evolved to reduce the processing time of lithium from brine. The resulting technology
invites the opportunity to consider lithium production from lower concentration, but large source, confined aquifer brine deposits. |
| Standard Lithium Ltd. SW Arkansas Lithium Project PEA | Page 121 |
This lithium-brine Technical Report has been prepared
by a multi-disciplinary team of QPs that include geologists, hydrogeologists, and chemical engineers with relevant experience in the Smackover
Formation brine geology and brine processing.
Numerous examples of lithium cutoff values for
resource estimation are available in the public domain for continental brine deposits (i.e., unconfined or surficial salar deposit models;
e.g., Spanjers, 2015; Reidel, 2017; Rosko, 2017; Burga et al., 2018). To the best of the author’s knowledge, however, there are
no analogous lithium-based cutoff values for subsurface, confined, aquifer-hosted lithium-brine.
Rather, other authors have assigned atypical cutoff
definitions for this type of lithium-brine deposit such as “Production Factor” to the resource estimate (e.g., MacMillan and
Binks, 2018), or have avoided a lithium cutoff (in favour of an in-situ estimate) due to the infancy of, and/or evolving technological
development associated with, confined, aquifer-hosted lithium-brine exploration plays.
In establishing a cutoff grade, the QP must realistically
reflect on the location, deposit scale, continuity of mineralization, assumed mining method, metallurgical processes, costs and reasonable
long-term metal prices appropriate for any deposit. The cutoff value must be relevant to the grade distribution modelled for the mineral
resource, and represent the lowest grade, or quality, of mineralized material that qualifies as being economically mineable.
This Technical Report has shown:
| 1. | Standard Lithium has established brine access agreements with a historically/presently permitted and active
hydrocarbon operator. |
| 2. | The SWA Property is in southern Arkansas, a region that has over 50-years of brine processing and production
experience (e.g., LANXESS and Albemarle; albeit for bromine extraction from the brine). |
| 3. | The Smackover Formation aquifer from which the brine is being produced is massive; it underlies parts
of 6 U.S. States (Alabama, Arkansas, Florida, Mississippi, Louisiana, and Texas) and Bromine production occurs in three separate counties
within southern Arkansas (Union, Columbia, and Lafayette). |
| 4. | The brine access method is straight-forward; no traditional mining is required as the brine is accessed
from: 1) existing and operating active wells, or 2) by scrubbing out and perforating suspended and/or abandoned wells. |
| 5. | While predicting future lithium prices is challenging, the demand for lithium in batteries, and therefore
lithium pricing, has increased since the early 2000s. |
With respect to assigning a cutoff, it is worth
assessing the lithium content of the brine at the SWA Property, which ranges from 132 mg/L (well Purser 2) to 461 mg/L (well MKP#21).
Because of the limited number of brine analytical results and fact that if Standard Lithium produces brine from the SWA Property it will
represent a ‘blended’ brine mixture, it is reasonable to justify a cutoff that represents the lower grade wells in the resource
model and/or Standard Lithium’s southern Arkansas properties.
A cutoff of 50 mg/L lithium was used in Standard
Lithium’s LANXESS lithium-brine resource estimate (Eccles et al., 2018), and this value is believed to represent the lowest grade,
or quality, of mineralized material in Standard Lithium southern Arkansas lithium-brine projects. It is the opinion of the author that
a cutoff of 50 mg/L lithium is acceptable. It is possible that this cutoff will be adjusted in future Technical Reports with higher levels
of resource/reserve classification.
| Standard Lithium Ltd. SW Arkansas Lithium Project PEA | Page 122 |

14.9.6 Step 7: Mineral Resource Reporting: SWA Property Inferred Lithium-Brine Resource Estimations
The SWA Property lithium-brine resource estimate
is classified as ‘inferred’ according to the CIM definition standards. It is the opinion of the author that the project requires
further detail to elevate the resource to a higher classification level. This work includes additional brine sampling and ongoing brine
processing test work toward the development of a modern lithium extraction technology. The resource estimations presented in this Technical
Report are based on the classical Lithium-brine equation, Lithium Resource = A × T × P ×
C, where, A = area of aquifer; T = thickness of aquifer; P = porosity of aquifer; and C = concentration
of Lithium in brine (e.g., Collins, 1976; Gruber et al., 2011).
Where possible, due diligent effort was considered
to obtain the best-use values for these parameters. As such, the updated SWA Property inferred lithium-brine resource estimation which
is presented as a total (or global value), was estimated using a unitised resource area and the following relation in consideration of
the North and South resource areas, and the Upper and Middle Smackover Formations within those resource areas:
Lithium Resource = Total Volume of the Brine-Bearing
Aquifer X Average Effective Porosity X Percentage of Brine in the Pore Space X Average Concentration of Lithium in the Brine.
Resources have been estimated using a cut-off
grade of 50 mg/L lithium. With respect to units of measurement, 1 mg/L = 1g/m3. If concentration is in mg/L and volume in m3,
then the calculated resource has units of grams. (1 g/m3 x 1 m3 = 1 gram or 0.001 kg).
The main updated 2021 SWA Property inferred lithium-brine
resource estimation, which supersedes and replaces the 2019 mineral resource, is estimated at 225,000 tonnes of elemental Li (248,000
tons elemental Li; Table 14-14). The total lithium carbonate equivalent (LCE) for the main resource is 1,195,000 tonnes LCE (1,318,000
tons LCE). Mineral resources are not mineral reserves and do not have demonstrated economic viability. There is no guarantee that all
or any part of the mineral resource will be converted into a mineral reserve.
| Standard Lithium Ltd. SW Arkansas Lithium Project PEA | Page 123 |
Table 14-14. The updated (2021) and unitised
SWA Property Inferred Lithium-Brine Resource Estimation. The grey-shaded ‘total’ column represents the main resource. The
resource is also subdivided by resource area (i.e., North and South resource areas) and by formation (i.e., Upper and Middle Smackover
Formations).
| | |
Upper Smackover
Formation | | |
Middle Smackover
Formation | | |
| |
Reporting parameter | |
South
Resource
Area | | |
North
Resource
Area | | |
South
Resource
Area | | |
North
Resource
Area | | |
Total
(and main
resource) | |
| Aquifer volume (km3) | |
| 2.852 | | |
| 4.226 | | |
| 0.704 | | |
| 1.080 | | |
| 8.862 | |
| Brine volume (km3) | |
| 0.281 | | |
| 0.416 | | |
| 0.071 | | |
| 0.110 | | |
| 0.878 | |
| Average lithium concentration (mg/L) | |
| 399 | | |
| 160 | | |
| 399 | | |
| 160 | | |
| 256 | |
| Average effective porosity | |
| 10.045 | | |
| 10.045 | | |
| 10.343 | | |
| 10.343 | | |
| 10.105 | |
| Total elemental Li resource (tonnes) | |
| 112,000 | | |
| 67,000 | | |
| 28,000 | | |
| 18,000 | | |
| 225,000 | |
| Total elemental Li resource (tons) | |
| 123,000 | | |
| 73,000 | | |
| 31,000 | | |
| 19,000 | | |
| 248,000 | |
| Total LCE (tonnes) | |
| 596,000 | | |
| 354,000 | | |
| 152,000 | | |
| 93,000 | | |
| 1,195,000 | |
| Total LCE (tons) | |
| 657,000 | | |
| 391,000 | | |
| 167,000 | | |
| 103,000 | | |
| 1,318,000 | |
Notes:
[1] Mineral resources are not mineral reserves
and do not have demonstrated economic viability. There is no guarantee that all or any part of the mineral resource will be converted
into a mineral reserve. The estimate of mineral resources may be materially affected by geology, environment, permitting, legal, title,
taxation, socio-political, marketing, or other relevant issues.
[2] The weights are reported in metric tonnes
(1,000 kg or 2,204.6 lbs) and United States short tons (2,000 lbs or 907.2 kg).
[3] Numbers may not add up due to rounding of
the resource values percentages (rounded to the nearest 1,000 unit).
[4] In a ‘confined’ aquifer (as reported
herein), porosity is a proxy for specific yield.
[5] The grey-shaded ‘Total’ volume
and weights are estimated at average effective porosities as geostatistically-derived for the North and South resource areas. The brine
in pore space is assumed to be 98% brine.
[6] The SWA Property lithium brine project estimation
was completed and reported using a cutoff of 50 mg/L Li.
[7] In order to describe the resource in terms
of industry standard, a conversion factor of 5.323 is used to convert elemental Li to Li2CO3, or lithium carbonate
equivalent (LCE).
With respect to specific parameters in the total
(and main) resource column in Table 14-14:
| ● | The Total Aquifer Volume, Total Brine volume,
Total Li Resource, Total LCE Resource is the sum of all 4 sub-resources (i.e., North and South resource areas and Upper and Middle Smackover
formations). |
| ● | The total average porosity was calculated using
the equation: |
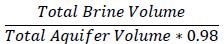
| Standard Lithium Ltd. SW Arkansas Lithium Project PEA | Page 124 |
| ● | The total average Li concentration (mg/L) was
calculated using the equation: |
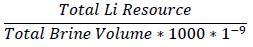
Where,
| ● | ‘Total Li Resource’ is in tonnes; |
| ● | ‘Total Brine Volume’ is in m3;
and |
| ● | the ‘1,000’ is used to convert m3
to Litres. |
The total (and main) resource in Table 14-14 includes
the breakdown of how the resource was calculated by area (i.e., North and South resource areas) and by formation (i.e., Upper and Middle
Smackover formations). The information shows that the:
| ● | Upper Smackover Formation in the South resource
area contains the highest amount of LCE (596,000 tonnes; 657,000 tons), or more than double the next sub-resource area, which include
the following estimations from highest to lowest LCE; |
| ● | Upper Smackover Formation - North resource area
(354,000 tonnes LCE; 391,000 tons LCE); |
| ● | Middle Smackover Formation - South resource area
(152,000 tonnes LCE; 167,000 tons LCE); and finally, the |
| ● | Middle Smackover Formation - North resource area
(93,000 tonnes LCE; 103,000 tons LCE). |
| 14.9.7 | Reconciliation of Mineral Resources |
With respect to
reconciliation of resources, the updated 2021 SWA Property resource is 49% larger than the 2019 resource estimate. This difference is
directly related to the contemplated unitisation of the resource area, which changed from 11,033 net mineral hectares (27,262 net
mineral acres) to a unitised area that encompassed 14,638 gross mineral hectares (36,172 gross mineral acres). The change in resource
area yielded total aquifer volumes that increased from a net acreage of 7.661 km3 in 2019 to a gross acreage of 8.862 km3.
The other defining factor is a change from the net ownership value of approximately 74% in 2019 to a gross ownership value of being able
to access 100% of the brine via the unitised area.
The updated resources do not represent a 100%
or greater change in the total mineral resources at the SWA Property, and no new scientific or technical information was provided by Standard
Lithium, or considered, during the preparation of the SWA Property 2021 Inferred Lithium-Brine Resource Estimations.
| Standard Lithium Ltd. SW Arkansas Lithium Project PEA | Page 125 |
15 Mineral Reserve Estimates
Mineral reserves have not been estimated.
| Standard Lithium Ltd. SW Arkansas Lithium Project PEA | Page 126 |
16 Mining Methods
16.1 Estimated Brine Production Capacity
16.1.1 Methodology
The inferred lithium brine resource estimate presented
in Table 14.14 represents the brine resource present on the SWA Property that is potentially available for extraction. The lithium-rich
brine from the Upper and Middle Smackover formations is proposed to be pumped from a network of production wells to ground surface and
processed to remove the lithium and produced LHM. The lithium-depleted brine exiting the central processing plant could then be re-injected
back into the same aquifer system through a network of brine injection wells, which are located distally from the brine supply well network.
The actual recoverable amount of lithium will depend on the hydraulics of Upper and Middle Smackover formations and the design of the
production and injection well networks. A key constraint on the lithium brine production rate and projected project lifespan is the requirement
to minimize the breakthrough of lithium-depleted injection brine being pumped from the production brine supply well network, which would
in turn reduce the lithium grade of the produced brine.
A numerical groundwater flow model was developed
using the industry standard FEFLOW groundwater modelling platform to design the well networks for extracting the lithium-rich brine from
the formation and to re-inject lithium-depleted brine from the central processing facility back into the formation. The numerical model
was constructed using site data and interpreted hydrostratigraphic maps over the SWA Property (discussed in Sections 7 and 9) and published
geological maps over the regional scale (AGC (1950); USGS (1968)). The model was parameterized using estimates of hydraulic conductivity
and storativity discussed previously (Section 14.5).
Particle tracking is a numerical modelling tool
that can be used to show the area from which brine originates to supply a well network extracting brine at specified pumping rates (i.e.,
the capture zone of the production well network). Particle tracking can also be used to show the advective front of brine depleted in
lithium that is introduced into the aquifer through a network of injection wells. The particle tracking approach accounts for the advective
component of transport – the transport of solutes moving with the flow of brine. It does not account for the transport mechanisms
of dispersion and diffusion or transport attenuation processes such as adsorption or decay. Particle tracking was used to determine the
simulated extraction area (i.e., the footprint over which the lithium-rich brine is targeted for extraction) of the SWA Property.
16.1.2 Production and Injection Well Network Design
The Upper and Middle Smackover formations are
capable of producing very large volumes of brine as evidenced by decades of production data from the Albemarle and LANXESS brine operations
immediately east of the SWA Property. Records from the Arkansas Oil and Gas Commission indicate brine production rates from southern Arkansas
are generally on the order of 250 to 300 million US barrels annually (Figure 6-1, Table 6-1).
Factors that influence an aquifer’s yield,
or its ability to supply brine to a pumping well network, include transmissivity (the hydraulic parameter that describes the resistance
to brine movement when a hydraulic gradient is applied), storativity (the parameter that describes the amount of brine released from storage
when the hydraulic head is decreased) and the available hydraulic head (the height of the formation’s hydraulic head above the top
of the aquifer).
| Standard Lithium Ltd. SW Arkansas Lithium Project PEA | Page 127 |
The targeted brine supply area of the SWA Project
is the South resource area which has been interpreted to have an average lithium grade of 399 mg/L (Section 14.8) and an estimated
brine volume of 0.352 km3 (Table 14-14).
The rationale for supplying all of the brine from
the South resource area and to reinject it back into the North resource area is to:
| 1. | Simplify the modelling exercise as a uniform, high brine grade area that can be used for supply; and, |
| 2. | Maintain all brine related pumping and disposal activities within the proposed footprint of utilisation. |
The general strategy for placing wells in the
numerical model was to space production wells throughout the southern portion of the South resource area and injection wells throughout
the northern area of the North resource area. Through an iterative set of simulations, a configuration for the placement of production
and injection wells was developed which maximized the size of the area capturing brine from the South resource area without injection
water reaching the production wells over an operation lifespan of 20 years.
16.1.3 Estimated Brine Production
Table 16-1 summarises the brine production and
reinjection simulated with the final optimized numerical model.
Table 16-1. Summary of brine production and
injection well networks
| Summary
of Brine Production Well Network |
| Number of brine production wells |
23 |
- |
| Total brine production rate from all wells – continuous operation |
39,450 |
m3/day |
| Total brine production rate from all wells – operating 8,000 hours annually |
1,800 |
m3/hour |
| Range in individual brine production well pumping rates |
200 to 2,100 |
m3/day |
| Average brine production well pumping rate per well – continuous pumping |
1,715 |
m3/day |
| Average
production well pumping rate per well – pumping 8,000 hours annually |
78 |
m3/hour |
| Summary
of Injection Well Network |
| Number of brine injection wells |
24 |
- |
| Total brine injection rate from all wells – continuous operation |
43,390 |
m3/day |
| Total brine injection rate from all wells – operating 8,000 hours annually |
1,980 |
m3/hour |
| Range in individual brine injection well pumping rates |
Same rate for all wells |
| Individual brine injection well pumping rate – continuous pumping |
1,810 |
m3/day |
| Individual brine injection well pumping rate – pumping 8,000 hours annually |
86 |
m3/hour |
Results from the optimized brine supply and injection
well network design simulation are summarised as:
| ● | the Upper and Middle Smackover formations in
South resource area are capable of supplying brine for the 20-year operational life assumed for the simulation; |
| Standard Lithium Ltd. SW Arkansas Lithium Project PEA | Page 128 |
| ● | the Upper and Middle Smackover formations in
the North resource area are capable of reinjecting brine depleted in lithium for the 20-year operational life assumed for the simulation; |
| ● | at the end of the 20-year operation simulation
a buffer of at least 500 m separates the furthest edge of the production well network capture area and the advective front of the injected
brine depleted in lithium. This indicates no breakthough of reinjected brine depleted in lithium being captured by the brine supply well
network; |
| ● | dispersive mixing between the capture area of
production wells and the injected brine is expected to be minor due to the width of the separation buffer; |
| ● | the production wells rates are highest in the
western portion of Property and the lowest simulated brine supply production rates correspond to the east-central portion of the South
resource area where the property width is the narrowest. |
Assumptions used in developing the numerical model
included the following:
| ● | the model was run in steady-state mode, implying
pumping and injection hydraulic stresses represent long-term, average conditions; |
| ● | pumping and injection rates were assigned for
the Albemarle and LANXESS operations based on historical data from the Arkansas Oil and Gas Commission |
| ● | any hydraulic stresses caused by oil and gas
operations were not included and would be considered insignificant; |
| ● | a uniform porosity value of 10% was assigned,
consistent with average porosity measured over the SWA Property (Table 14-3). |
16.2 Wellfield Overview
Brine extraction and disposal will occur using
a conventional brine supply and injection wellfield as outlined in Section 16.1. A network of twenty-three (23) brine supply wells
will produce from the Smackover Formation in the South resource area. The brine supply wells will produce between 200 m3/day
and 2,100 m3/day with an average rate of 1,715 m3/day. The average brine production rate will be 1,800 m3/hr
(7,925 US gallons per minute) during the 8,000 hours in the operational year. The supply wells, as modelled, are grouped into five (5) multi-well
pad facilities to minimize initial capital expenditure and improve long-term maintainability. Brine from the supply facilities will be
conveyed from the five multi-well pads to the single processing facility by a network of underground fiberglass pipelines totaling approximately
18.3 km (11.4 miles) in length. After processing, the lithium-depleted brine will be returned to the North resource area by a pipeline
system 20.3 km (12.6 miles) in length to a network of 24 brine injection wells completed in the Smackover Formation. As with the supply
wells, the injection wells are proposed to be grouped into five (5) multi-well pad facilities. All extraction and reinjection will
occur in the single unitized area to maintain reservoir pressures.
| Standard Lithium Ltd. SW Arkansas Lithium Project PEA | Page 129 |
16.3 Wellfield Configuration
16.3.1 Production Wells
The brine supply wells will extract the raw brine
from the Smackover Formation on a continuous, 24-hour, 365 days per year operation. Operational time has been estimated to be 8,000 hours
per year to account for ongoing maintenance, system upsets, weather outages, etc. An 800 HP electric submersible pump (ESP) will
be installed in each production well that will pump the brine to the surface through a 17.8 cm (7 inch) tubing as depicted below in Figure
16-1.
Figure 16-1. Supply well process
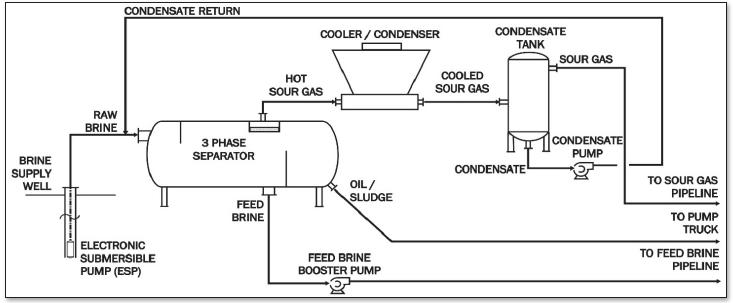
As the brine is pumped to the surface, natural
gas (usually sour in the project area) will degas out of the brine as the pressure drops. The brine, sour gas, and trace amounts of oil
and solids (sludge) will be separated from one another at the wellheads using three-phase separators. The brine and sour gas streams produced
will be sent from the separators to the main processing facility in pipelines. The oil/sludge mixture that is separated from the brine
will be stored in tanks on the well pad and periodically removed via a pump truck for further processing at a local refinery or by a 3rd
party.
Brine from the brine supply wells will be combined
prior to leaving the well pad into single headers and “boosted” with pumps to deliver it to the central processing facility
via a common brine pipeline. Brine variability is reduced by combining and mixing all the brine streams at the well pads and from all
the well pads in the brine pipelines. Brine pumped from production wells and well pads through the brine pipeline is discharged to a large
capacity brine receiving tank at the main processing facility.
Pressurized hot sour natural gas, containing light
hydrocarbons (i.e., ethane, propane and butane), hydrogen sulfide, carbon dioxide and water vapor, separated from the brine in the three-phase
separators will be cooled to condense out higher boiling point condensable hydrocarbons and water. The liquids (condensate) will be separated
and returned to the three-phase separator feed. The “dried” sour gas from all of the brine supply wells will be collected
into a single sour gas pipeline and delivered to the central processing facility (CPF). At the CPF, the sour gas will be transferred into
an existing sour natural gas gathering pipeline supplying sour gas to the nearby Mission Creek Dorcheat Gas Plant where it will be sweetened
for beneficial re-use.
| Standard Lithium Ltd. SW Arkansas Lithium Project PEA | Page 130 |
16.3.2 Injection Wells
Once the lithium is removed from the brine, barren
brine (or lithium-free brine) is then disposed of through the injection wellfield in the North resource area. A network of pipelines connects
the CPF to the injection (or disposal) wells. Like the supply wells, the injection wells will be grouped into five (5) multi-well
pad facilities. Barren brine is delivered from the main processing facility by brine pumps to the well pads. The barren brine is pumped
down through the injection wells into the Smackover Formation. The reinjection of the barren brine is necessary to maintain the pressure
in the Smackover Formation aquifer.
16.4 Drilling Program
16.4.1 Well Details
The supply and injection facility/well locations
and drilling methodologies used for each were chosen in an effort to maximize production and minimize costs and environmental impacts.
The well design and drilling methodologies included in the wellfield plan for this project are detailed below.
| § | Vertical Wells – Vertical wells are drilled
at a near vertical approach angle to the target location in the Smackover Formation. These wells have the lowest capital cost but will
only be used for access to targets in the Smackover Formation directly below the multi-well pads. |
| § | Directional Wells – Directional wells are
initially drilled at a near vertical angle, but they eventually deviate with an angled approach to the target well location. These wells
typically carry a greater capital and maintenance cost but allow multiple wells to be drilled from one surface location which reduces
the overall environmental impact at the surface and minimizes costs by sharing the required surface resources and infrastructure. Directional
wells also typically provide additional bore length in the “pay zone” than vertical wells which usually results in increased
production/injection rates from the well. |
| § | Horizontal Wells – Horizontal wells are
similar to directional wells but are unique in that they continue their bend or “build” at the end of the well to allow the
well tubing to approach the target well location at an angle that is in line with target formation. This allows the horizontal wells to
provide an elongated “horizontal” stretch of well boring directly in the “pay zone” providing increased production
and flexibility for the well location. |
Figure 16-2 provides an illustration of the typical
components for wells (in this case a horizontal well).
| Standard Lithium Ltd. SW Arkansas Lithium Project PEA | Page 131 |
Figure 16-2. Well Diagram (Horizontal)
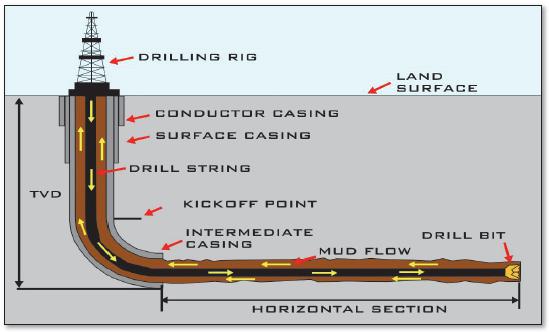
Additional details for each of the supply (production)
and injection wells are provided in Table 16-2.
Table 16-2. Conceptual
design details for the proposed supply and injection wells
| |
|
Supply Wells |
|
Injection Wells |
| Well Details |
|
Vertical |
|
Directional |
|
Horizontal |
|
Vertical |
|
Directional |
| Quantity of Wells |
|
4 |
|
14 |
|
5 |
|
5 |
|
19 |
| Average Depth (m / ft) |
|
|
|
|
|
|
|
|
|
|
| - Target Depth from Sea Level |
|
2,652/ 8,700 |
|
2,721/ 8,925 |
|
2,652/ 8,700 |
|
2,530/ 8,300 |
|
2,530/ 8,300 |
| - Wellhead Surface Elevation |
|
92/ 300 |
|
92/ 300 |
|
91/ 300 |
|
92/ 300 |
|
92/ 300 |
| - True Vertical Depth (TVD) |
|
2,744/ 9,000 |
|
2,812/ 9,225 |
|
2,744/ 9,000 |
|
2,622/ 8,600 |
|
2,622/ 8,600 |
| - Measured Depth (MD) |
|
2,744/ 9,000 |
|
3,643/ 11,950 |
|
4,164/ 13,660 |
|
2,622/ 8,600 |
|
3,109/ 10,200 |
| Casing Details (cm / in) |
|
|
|
|
|
|
|
|
|
|
| - Conductor Casing |
|
60.690/ 24.000 |
|
60.690/ 24.000 |
|
60.690/ 24.000 |
|
50.800/ 20.000 |
|
50.800/ 20.000 |
| - Surface Casing |
|
40.640/ 16.000 |
|
40.640/ 16.000 |
|
40.640/ 16.000 |
|
33.973/ 13.375 |
|
33.973/ 13.375 |
| - Intermediate Casing |
|
27.305/ 10.750 |
|
27.305/ 10.750 |
|
27.305/ 10.750 |
|
Not Req’d |
|
27.305/ 10.750 |
| - Production Casing |
|
17.780/ 7.000 |
|
17.780/ 7.000 |
|
17.780/ 7.000 |
|
24.448/ 9.625 |
|
24.448/ 9.625 |
| Standard Lithium Ltd. SW Arkansas Lithium Project PEA | Page 132 |
16.4.2 Rig Details
The brine supply and injection wellfields will
require heavy-duty, rotary-type, well drilling rigs due to the large well bore size and depths required for each of the wells (see Table
16.1 for supply and injection well bore size details). Multiple drilling rigs will be deployed to complete the drilling operations in
the required timeframe (schedule duration). Local drilling service providers will be used, as far as possible, to minimize the mobilization
costs associated with the drilling rigs.
16.4.3 Drilling Schedule
The total drilling effort for the wellfields will
require approximately 12 months to complete for a 10 rig/crew arrangement or 24 months for a 5 rig/crew arrangement. A 10 rig/crew arrangement
was assumed for the purposes of this assessment. Further evaluation should be included in the next phase of work to understand the feasibility
of the current approach.
| Standard Lithium Ltd. SW Arkansas Lithium Project PEA | Page 133 |
17 Recovery Methods
Standard Lithium will produce battery-quality
LHM (LiOH●H2O) from Smackover Formation brine. Lithium-containing brine will be produced from brine supply wells, as discussed
in Section 16. The produced brine will be pipelined to the CPF for further processing to the final product. Average LHM production
will be 30,000 tonnes/year over a 20-year operating timeframe. The lithium recovery from the brine to the final product is about 90%.
The overall process Block Flow Diagram (BFD) is shown in Figure 17-1. The production process includes the following major unit processes:
| ● | lithium chloride extraction from the brine |
| ● | lithium chloride purification and concentration |
| ● | lithium chloride electrolysis to convert to lithium
hydroxide |
| ● | LHM crystallization and drying |
These processes are described below.
Figure 17-1. Overall block flow diagram of lithium
hydroxide monohydrate production from Smackover Formation brine
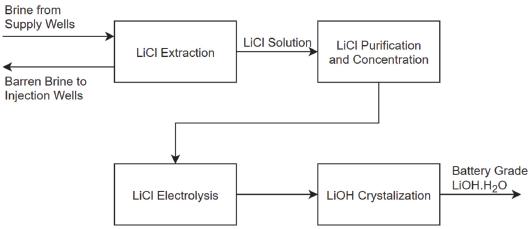
17.1 Brine Production and Delivery
Brine will be delivered from the wellfield via
pipelines to the brine receiving tank at the CPF as discussed in Section 16.
17.2 Production of Purified Lithium Chloride Solution
The first step in producing LHM will be the production
of purified and concentrated lithium chloride solution in the CPF. The process to be used is shown in Figure 17-2 and discussed below.
17.2.1 Preparation of the Feed Brine
Produced brine from the brine receiving tank will
be delivered by pipeline to the lithium chloride plant in the CPF. The blended produced brine is estimated to have a lithium concentration
of about 400 mg/L as lithium (see Table 17-1). The brine will be hot (>70°C), highly saline (TDS of about 300,000 mg/L), low in
sulfate, and will have a density of about 1.2 g/cm3. Sodium and calcium chlorides are the main constituents of the brines.
| Standard Lithium Ltd. SW Arkansas Lithium Project PEA | Page 134 |
Prior to lithium extraction, the brine will be
pre-treated. Suspended solids, dissolved gas, and crude oil will be removed, and the pH of the brine increased to near-neutral through
the addition of caustic soda and/or ammonium hydroxide.
The brine will be vacuum-degassed to remove dissolved
gases, including: hydrogen sulfide (H2S), carbon dioxide (CO2), methane (CH4), other low-boiling-point
hydrocarbons, and nitrogen (N2). Gases separated from the brine in the vacuum-degassing process will be compressed and combined
with the sour gas from the production wells that is separated in the field and pipelined to the Mission Creek Dorcheat Gas Plant.
The degassed brine can then be filtered using
a submerged microfiltration membrane filter to remove fine particulates. The membrane brine filter will be backwashed periodically to
remove captured solids. The fine solids removed from the incoming brine are disposed with the lithium free barren brine in the brine injection
wells (see Section 17.2.3).
Table 17-1 Lithium content of the produced brine
(feed to lithium extraction process)
| Units |
|
Component |
|
Feed
Brine |
| mg/L |
|
Li |
|
399 |
17.2.2 Lithium Extraction Process
The key unit process for the production of lithium
chloride solution is the lithium-selective sorption extraction process. The process starts with sorbent loading.
In the loading process, pre-treated brine will
be mixed with fine-grained, solid, lithium-selective sorbent creating a slurry in the loading reactor tanks. The sorbent selectively sorbs
lithium ions from the brine in two counter-current loading reactors. A simplified BFD of the lithium extraction process is presented in
Figure 17-2.
Ammonium hydroxide will be added to the loading
reactors during the lithium extraction process to maintain the desired pH conditions.
The lithium-barren brine will be separated from
the loaded sorbent slurry using submerged microfiltration membrane units inside the loading reactor tanks. The membranes used are fine
hollow tubes arranged in vertical, multi-tube modules. Lithium-barren brine (permeate) is drawn through the walls of membranes from outside
to inside and the lithium-loaded sorbent solids are left on the outside of the tubes as the brine passes through.
The lithium-loaded sorbent solids will be continuously
removed from the outside of the membrane tubes by scouring with submerged aeration and periodic backwashing of the membranes using permeate.
The loaded sorbent slurry is pumped from the loading process to the loaded sorbent washing process.
In the loaded sorbent washing process, the lithium-loaded
sorbent slurry is washed with water in three (3) stages of counter-current decantation thickeners. The washed and thickened sorbent
will then be pumped as a slurry to the stripping reactor for separation of the lithium from the sorbent.
| Standard Lithium Ltd. SW Arkansas Lithium Project PEA | Page 135 |
Figure 17-2. Block flow diagram of lithium extraction
process (lithium chloride plant)
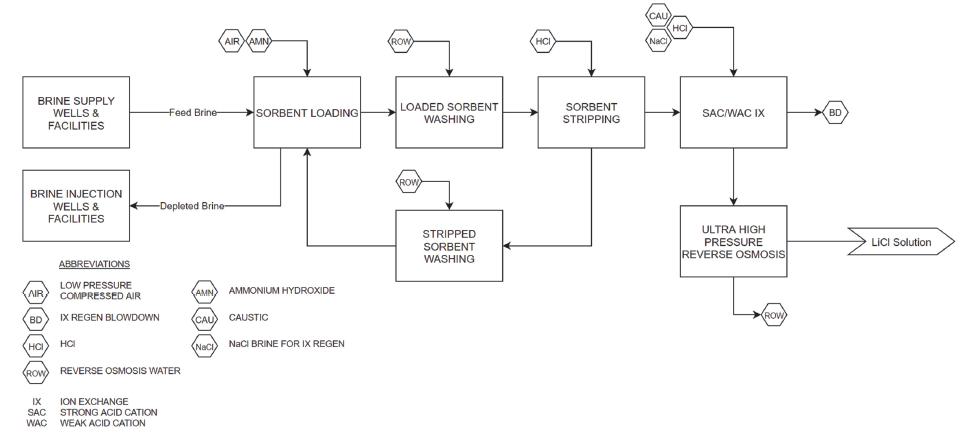
| Standard Lithium Ltd. SW Arkansas Lithium Project PEA | Page 136 |
17.2.3 Lithium Barren Brine Disposal
The lithium-barren brine (tail-brine) separated
from the sorbent in the loading reactors using the submerged membranes will be pumped to the tail-brine tank where the pH will be adjusted,
to achieve a final discharge pH of approximately 5.5. This pH is required to:
| § | avoid any precipitation issues in the brine injection
wells; |
| § | conform with anticipated discharge criteria of
the regulatory agency (Arkansas Oil and Gas Commission); and |
| § | meet best-practice guidelines for reinjection
of tail-brine into the Smackover Formation. |
Tail-brine from the lithium extraction process
will be pumped via pipelines to brine injection wells for disposal. Twenty-four brine injection wells located in the North resource area
are proposed to be used for disposal of lithium barren tail-brine (see Section 16).
17.2.4 Lithium Sorbent Stripping and Regeneration Process
In the proposed process, washed lithium-loaded
sorbent is stripped to separate the lithium from the sorbent for recovery. Lithium-loaded and washed sorbent is contacted with dilute
hydrochloric acid in a mixed stripping reactor. The stripping process generates lithium pregnant strip solution (PSS). The PSS will be
separated from the barren sorbent in a thickener tank. The stripped sorbent is washed with fresh water in three (3) stages of counter-current
decantation thickeners. The stripped and washed lithium-depleted sorbent will be then recycled back to the loading stage.
After washing, the PSS has a high ratio of lithium
to the sum of the other dissolved metals and will contain 3-5 g/L of lithium. This enriched lithium chloride solution will then be further
purified and concentrated.
17.2.5 Pregnant Strip Solution (Lithium Chloride) Purification and Concentration
The PSS from the stripping stage will undergo
removal of residual divalent ions, including, calcium (Ca+2) and magnesium (Mg+2), using industry-standard ion exchange
treatment. The treatment includes two stages of ion exchange.
The purified lithium chloride solution is then
further concentrated to produce a lithium chloride concentrate using an ultra high-pressure reverse osmosis process and pumped to the
LHM process facility.
17.3 Production of Lithium Hydroxide Monohydrate
The LHM production process includes the following
steps:
| ● | an additional stage of ion exchange to remove
any residual calcium and magnesium; |
| ● | further concentration of the lithium chloride
concentrate and separation of sodium chloride from the solution using an evaporative crystallization process; |
| ● | electrolytic conversion of lithium chloride to
lithium hydroxide; |
| ● | further evaporative crystallization of the lithium
hydroxide into LHM; and |
| ● | drying and packaging in an inert atmosphere to
produce dry LHM crystals. |
The LHM production process is shown in the BFD
presented in Figure 17-3.
| Standard Lithium Ltd. SW Arkansas Lithium Project PEA | Page 137 |
Figure 17-3. Block flow diagram of lithium hydroxide
monohydrate plant
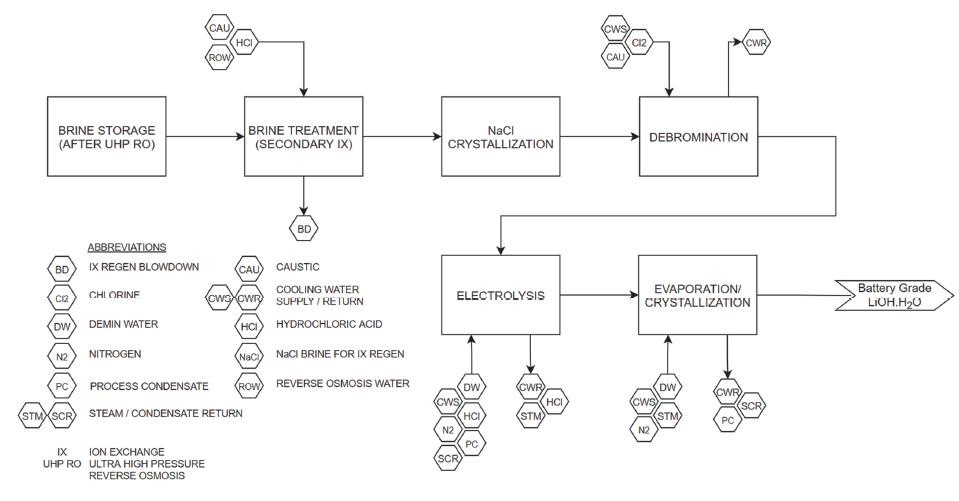
| Standard Lithium Ltd. SW Arkansas Lithium Project PEA | Page 138 |
Sodium chloride produced from the NaCl evaporator-crystallizer
is dissolved to provide the pure brine required for regeneration of the ion exchange resin in the strong-acid-cationic (SAC) ion exchange
process.
Chlorine gas produced from the electrolysis of
lithium chloride to lithium hydroxide will be reacted with hydrogen, also produced by the electrolysis process, to produce hydrochloric
acid. The hydrochloric acid is used in the sorbent stripping stage in the lithium extraction process and for regeneration in the weak-acid-cationic
ion exchange process.
Condensate produced from the evaporation is used
for washing in the lithium extraction process.
| Standard Lithium Ltd. SW Arkansas Lithium Project PEA | Page 139 |
18 Project Infrastructure
The infrastructure required to construct and operate
the proposed project is described below.
18.1 Brine Supply Wells Infrastructure
18.1.1 Wellfield
Brine is proposed to be extracted via a network
of 23 brine supply wells located in the South resource area of the SWA Project. The wellfield will utilize the latest drilling technologies
to provide an optimal multi-directional wellfield design that consolidates the surface locations of the wells into five (5) well
pad locations. The well pad locations will be chosen following more definitive geological and hydrogeological siting studies conducted
as part of the next pre-feasibility study(PFS) assessment.
The brine supply well pad facilities will provide
an economical solution for the above ground utilities and infrastructure at each well by assembling 4 to 5 of the brine supply wells at
each location and sharing or “pooling” their individual surface facilities to minimize upfront cost and improve operations
and maintenance (see Figure 18-1).
Figure 18-1. Brine supply well pad conceptual
layout
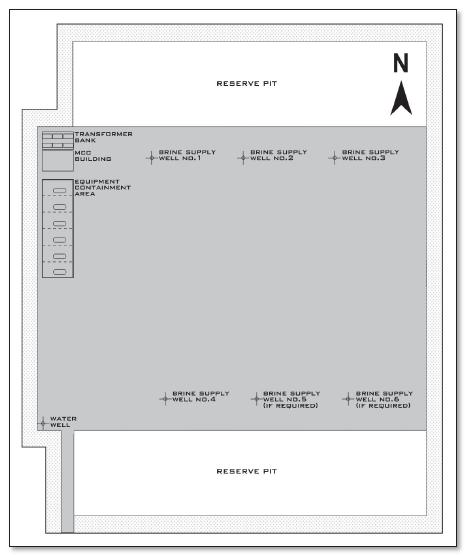
| Standard Lithium Ltd. SW Arkansas Lithium Project PEA | Page 140 |
Each of the brine supply wells will be individually
equipped with an electric submersible pump (ESP). The ESP’s will pump the brine through a three-phase gravity separator to remove
sour gas and crude oil from the brine before it is sent to the brine supply pipeline network via a booster pump.
| 18.1.1.1 | Water Supply and Distribution |
Each of the well pad facilities will be equipped
with a 45 m (150 ft) deep (from surface) water well that will provide approximately 10 m3/hr (45 US gpm) of water for drilling
and routine well maintenance operations.
The supply well pad facilities will require approximately
12 megawatts (MW) total for routine operations of the facilities as outlined below in Table 18-1.
Table 18-1. Power consumption for the brine
supply well facilities
| Facility No. | |
Well Count | | |
Operating Power (kW) | | |
Annual Electrical Consumption (kWh) | |
| Facility No.1 | |
| 4 | | |
| 2,083 | | |
| 18,098,872 | |
| Facility No.2 | |
| 5 | | |
| 2,604 | | |
| 22,623,590 | |
| Facility No.3 | |
| 5 | | |
| 2,604 | | |
| 22,623,590 | |
| Facility No.4 | |
| 5 | | |
| 2,604 | | |
| 22,623,590 | |
| Facility No.5 | |
| 4 | | |
| 2,083 | | |
| 18,098,872 | |
| Total | |
| 23 | | |
| 11,977 | | |
| 104,068,513 | |
Each of the well pad facilities will include a
small, prefabricated metal motor control center (MCC) building, medium voltage drive, and a capacitor bank. The power supply to each facility
will be from the South-West Arkansas Entergy power grid. New substations and transmission lines will likely be required for the facilities
but have not been included at this time in the evaluation.
Compressed air will be supplied via a single compressor
at each well pad facility located within the MCC buildings.
| 18.1.1.4 | Chemicals & Reagents |
Chemicals and reagents required for operation
and maintenance of the brine supply wells and well pad facilities will be stored within the equipment containment areas at each well pad
facility. These include, but are not limited to, anti-scalant and anti-corrosion chemicals.
| Standard Lithium Ltd. SW Arkansas Lithium Project PEA | Page 141 |
| 18.1.1.5 | Auxiliary Infrastructure |
The following auxiliary infrastructure will be
required at each well pad facility but are not included in the evaluation at this time per the guidelines set by the AACE for a Class 5
estimate.
| § | Access roads to the facility |
| § | Communication (internet to the site whether that
be ethernet or wireless) |
| § | Electrical substation and power distribution
lines |
| § | Metering stations for sour gas and brine |
Brine will be transported via fiberglass pipelines
from the booster pump at each well pad facility to the CPF. Sour gas removed from the brine at the well facilities will be transported
to the CPF via high density polyethylene plastic (HDPE) pipelines. The assumed pipeline quantities and details are detailed below in Table
18-2.
Table 18-2. Conceptual brine supply &
sour gas pipeline details
| Description |
|
Material
Type |
|
Diameter |
|
Length |
| Brine Supply |
|
Fiberglass NOV Green Thread HP25 |
|
25.40cm (10”), 30.48cm
(12”), 40.64(16”), 50.80cm (20”) |
|
18.25 km (11.41 miles) |
| Sour Gas |
|
HDPESDR-11/ PE3408 |
|
15.24cm (6”), 20.32cm (8”), 25.40cm (10”), 30.48cm (12”), 40.64(16”) |
|
18.25 km (11.41 miles) |
| Total |
|
- |
|
- |
|
36.5 km (22.82 miles) |
18.2 Central Processing Facility Infrastructure
Road access to the CPF will be via Highway 36
and Highway 56. The main entrance to the CPF will be located approximately 10.4 km (6.5 miles) from the junction of Highway 36 and Highway
56. A conceptual layout showing the proposed location, process areas, and auxiliary facilities is provided below on Figure 18-2.
| Standard Lithium Ltd. SW Arkansas Lithium Project PEA | Page 142 |
Figure 18-2. Central production facility conceptual
layout

| 18.2.1 | Fresh Water Supply and Distribution |
Four (4) fresh water supply wells will be
installed with one (1) spare to provide water to the CPF. The fresh water supply wells will be drilled to a depth of approximately
100 m (300 feet) below grade and designed to produce 380 m3/hr (1,750 US gpm) of fresh water to the facility. Water will be
sent from the wells to the well water/fire suppression storage tank where approximately 10,600 m3 (2.8 million gallons) of
fresh water will be stored for the plant as further defined below.
| § | Fire Water – The design of the tank will
be such that 4,920 m3 (1.3 million gallons) of water will be intrinsically reserved for fire water use. |
| § | Process Water – Process water will be obtained
directly from the tank without further processing for general plant use. |
| § | Reverse Osmosis (RO)/Potable Water – RO
water will be generated onsite using a RO treatment unit designed to produce 31.8 m3/hr (140 US gpm) of RO-treated water primarily
for use in the sorbent washing process, ion exchange units, demineralized water filtration unit, and potable water applications. |
| § | Demineralized (Demin) Water – Demin water
will be generated onsite using a demin filtration unit designed to produce 6.8 m3/hr (30 US gpm) of demin water primarily used
for startup in the cell house (EC-1600) and hydrochloric acid generation (X-1800) units. |
| Standard Lithium Ltd. SW Arkansas Lithium Project PEA | Page 143 |
The CPF will be equipped with a natural-gas-fired
boiler unit to provide approximately 114,000 kg/hr. (250,000 lb/h) of medium pressure steam to the plant. The steam will primarily be
used in the evaporator/sodium chloride crystallizer unit but will also be used at the lithium hydroxide monohydrate crystallizer and various
area heaters throughout the plant.
The CPF will require a power supply of approximately
19.8 megawatts (MW) and will consume roughly 159,000 MWh of electricity per year.
The power supply to the CPF will be from the South
West Arkansas Entergy power grid. New substations and transmission lines will likely be required for the facilities but have not been
included at this time in the evaluation.
Compressed air will be supplied via a bank of
rotary screw compressors. The compressor unit will be equipment with a refrigeration dryer system to control moisture content.
The CPF will utilize an existing natural gas transmission
pipeline tie-in on site to send sour gas downstream to the nearby Mission Creek Dorcheat Gas Plant for further processing.
| 18.2.6 | Auxiliary Facilities |
The CPF will include the following auxiliary infrastructure
facilities:
| § | Access/Security Checkpoint |
| § | Perimeter Fencing |
| § | Weigh Scale(s) |
| § | Internal Access Roads |
| § | Communication (phone Lines, internet) |
| § | Electrical Substation and Power Distribution
Lines for Energy Supply |
| § | Natural Gas Metering Station and Distribution
Lines for Natural Gas Supply |
| § | Sanitary Wastewater Disposal Lines and Processing
Pond |
| § | Solid Waste Disposal |
| § | Buildings |
| o | Administrative Office & Laboratory |
| o | Warehouse(s) |
| o | Workshop(s) |
| o | Storeroom(s) |
| o | Shipping & Receiving |
| Standard Lithium Ltd. SW Arkansas Lithium Project PEA | Page 144 |
18.3 Barren Brine/Process Water Injection Wells Network Infrastructure
The CPF will discharge barren brine and process
water (not to exceed additional 10% process water by volume). The tail-brine will be pumped from the CPF to a network of 24 brine injection
wells located in the North resource area of the SWA Property. This wellfield will use the same drilling technology used in the supply
field to consolidate the surface locations of the wells into 5 facilities. The injection well pad locations will be chosen following more
definitive geological and hydrogeological siting studies conducted as part of the PFS assessment.
The brine injection well facilities will follow
the same approach of the brine supply facilities by assembling 4 to 6 of the brine injection wells at each location to share or “pool”
their individual surface facilities to minimize upfront cost and improve operations and maintenance (see Figure 18-3).
Figure 18-3.Brine injection facility conceptual
layout
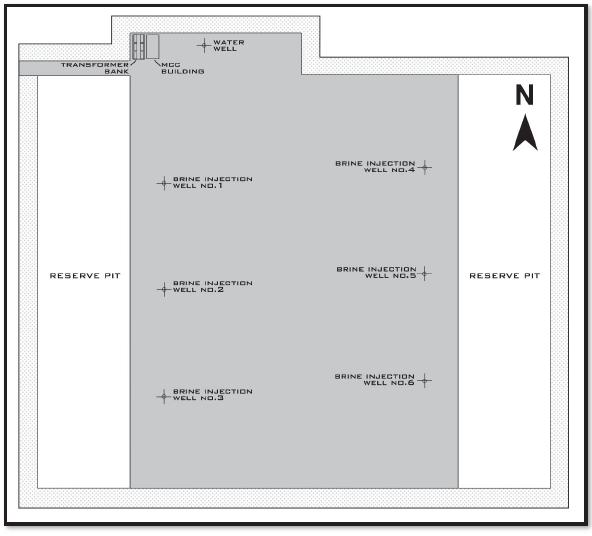
Each of the brine injection wells will be individually
equipped with a booster pump to reinject the lithium barren brine back into the Smackover Formation.
| Standard Lithium Ltd. SW Arkansas Lithium Project PEA | Page 145 |
| 18.3.1.1 | Water Supply and Distribution |
Each of the brine injection well pad facilities
will be equipped with a 45 m (150 ft) deep (from surface) water well that will provide approximately 10m3/hr (45 US gpm_) of
water for drilling and routine well and well pad facilities maintenance operations.
The injection well pad facilities will require
approximately three (3) megawatts (MW) total for routine operations of the facilities as further defined below in Table 18-3.
Table 18-3. Power Consumption for the Brine
Injection Well Facilities
| Facility No. | |
Well Count | | |
Operating Power (kW) | | |
Annual Electrical Consumption (kWh) | |
| Facility No.1 | |
| 6 | | |
| 739 | | |
| 6,327,977 | |
| Facility No.2 | |
| 5 | | |
| 616 | | |
| 5,273,314 | |
| Facility No.3 | |
| 5 | | |
| 616 | | |
| 5,273,314 | |
| Facility No.4 | |
| 4 | | |
| 493 | | |
| 4,218,651 | |
| Facility No.5 | |
| 4 | | |
| 493 | | |
| 4,218,651 | |
| Total | |
| 24 | | |
| 2,958 | | |
| 25,311,908 | |
Each of the brine injection well pad facilities
will include a small, prefabricated metal MCC building, medium voltage drive, and a capacitor bank. The power supply to each facility
will be from the South-West Arkansas Entergy power grid. New substations and transmission lines will likely be required for the facilities
but have not been included at this time in the evaluation.
Compressed air will be supplied via a 5 hp compressor
at each well pad facility. The compressors will be located within the MCC buildings.
| 18.3.1.4 | Auxiliary Infrastructure |
The following auxiliary infrastructure items will
be required at each facility but are not included in the evaluation at this time per the guidelines set by the AACE for a Class 5
estimate.
| § | Access roads to the facility |
| § | Communication (Internet to the site whether that
be ethernet or wireless) |
| § | Electrical substation and power distribution
lines |
| § | Metering stations for brine |
Brine will be transported via fiberglass pipelines
from the CPF to the booster pumps at each brine injection well pad and then to each individual injection well. The assumed pipeline quantities
and details are detailed below in Table 18-4.
| Standard Lithium Ltd. SW Arkansas Lithium Project PEA | Page 146 |
Table 18-4. Barren Brine Pipeline Details
| Description |
|
Material
Type |
|
Diameter |
|
Length |
| Barren Brine |
|
Fiberglass NOV Green Thread HP25 |
|
30.48cm (12”), 35.56cm (14”), 40.64cm (16”), 50.80cm (20”), 60.96cm (24”) |
|
20.13 km (12.58 miles) |
| Total |
|
- |
|
- |
|
20.13 km (12.58 miles |
| Standard Lithium Ltd. SW Arkansas Lithium Project PEA | Page 147 |
19 Market Studies and Contracts
19.1 Background
Lithium demand is expected to grow by approximately
300% from 2020 to 2025 and 700% by 2031 based on a gradual global transition away from fossil fuels which will be replaced by increased
use of renewable energy. A key component of this change is the phasing out of internal combustion engine (ICE) vehicles in favor of electric
vehicles (EVs) and increased use of lithium-ion batteries in energy storage systems (ESS) for renewable power from wind and solar. The
lithium industry is not adequately prepared for this transition. New lithium resources and improved technology for lithium extraction
will be required to satisfy the coming exponential growth.
Lithium used in batteries is a specialty chemical
as opposed to a commodity, which, due to the complexity of production, makes keeping up with demand even more challenging. Many lithium
operations in production today were based on industrial demand for lithium, which required a product with much less stringent specifications
than the battery industry. The forecast by Global Lithium LLC (shown in Figure 19-1) projects sustained lithium pricing strength over
the next several years and, based on the demand growth and increasingly stringent quality standards, the lithium industry will struggle
to supply in adequate volume to meet this growing demand.
The fact that lithium is now on the Unites States
Government’s critical metals list makes a US-based lithium project more attractive, given that most of the world’s lithium
hydroxide is currently produced in China. Major battery manufacturers and automotive OEMs are increasingly looking for more geographic
diversity in their supply chains. Global Lithium’s supply and demand forecast, is lower than the consensus average of other lithium
market forecasts.
Figure 19-1. Lithium Supply and Demand - Historical
and forecast from 2016-2027 (used with permission from Global Lithium LLC)
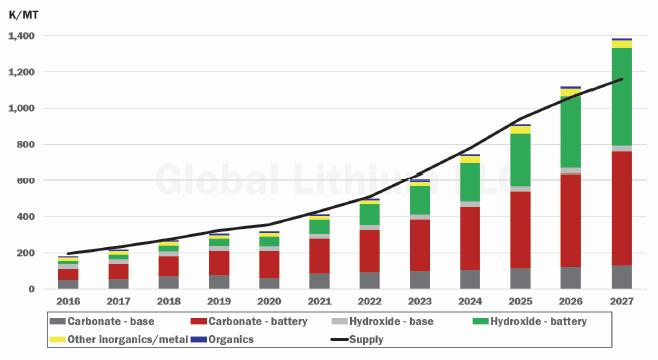
| Standard Lithium Ltd. SW Arkansas Lithium Project PEA | Page 148 |
It will be challenging for lithium supply to stay
ahead of lithium demand growth in the next decade even in the base case growth scenario. Lithium projects historically have come online
one to three years later than announced and extended production ramp-up periods to achieve acceptable quality are also common.
When LCE demand reaches one million metric tonnes
by the middle of this decade it will have taken over 60 years to achieve that volume. The second million tonnes will take approximately
five years as the energy transition in both transportation and ESS for solar and wind power gains traction. Lithium is the most critical
of battery metals required in the energy transition. Lithium-ion batteries can be made without nickel, cobalt or manganese but all cathode
technologies depend on either lithium carbonate or lithium hydroxide as the lithium source.
Lithium hydroxide is expected to be the fastest
growing form of lithium chemical over the next five years due to the growth of high nickel cathode in batteries used for electric vehicles
where long range between charges is a priority. The longest range batteries require the use of lithium hydroxide rather than lithium carbonate
for technical reasons. Projected growth of lithium hydroxide is depicted in Figure 19-2:
Figure 19-2. Lithium Hydroxide Demand - Historical
and forecast from 2016-2027 (used with Permission from Global Lithium LLC)
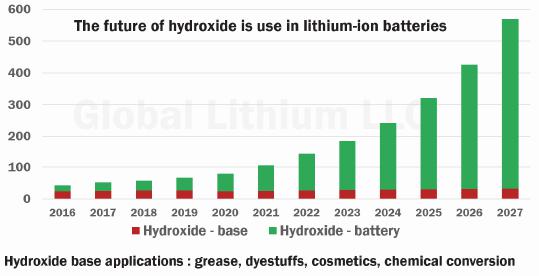
Lithium supply is likely to become the critical
path for EV adoption based on the fact it can take up to a decade to bring a greenfield lithium project online and takes only two to three
years to build a battery gigafactory.
19.2 Price
Despite announced expansions by major lithium
companies such as Albemarle, SQM and Ganfeng the industry has moved from a brief period of oversupply to what appears to be a sustained
period of tight or inadequate supply. Delays of both new projects and expansions coupled with consolidation of the Western Australia hard
rock precursor supply that feeds Chinese lithium chemical conversion capacity led to an approximately 300% increase in China spot prices
between Q4 of 2020 and Q3 of 2021.
| Standard Lithium Ltd. SW Arkansas Lithium Project PEA | Page 149 |
The lithium chemicals
spot market in China normally has the highest prices due to the majority of supply coming from high cost domestic production. The market
outside of China tends to operate on contracts ranging in length from six months to several years.
Shortages in the
lithium supply chain begin to happen when capacity utilization is above 85 to 90% for an extended period. It should be noted that a portion
of capacity additions will not be of sufficient quality to be used in battery applications, further exacerbating a tight supply situation.
Although China
is the largest single market for battery quality lithium chemicals; Korea and Japan are also significant markets with each currently
requiring over 40,000 MT of LCEs per year with a much higher growth rate in cathodes requiring lithium hydroxide. Korean and Japanese
battery manufacturers have been very vocal about their desire to have alternatives to supply from China for competitive and political
reasons.
The Global Lithium
price forecast for lithium hydroxide is shown in Figure 19-3. It should be noted that there is not a globally consistent price for any
lithium chemical. The China spot price is sometimes triple what a large cathode maker may be paying under a long-term contract signed
at a time when price was low.
The high, base
and low scenarios take pricing anomalies into consideration. The dotted line is J.P.Morgan’s base case as of July, 2021 (J.P.Morgan
Chase & Co., 2021).
Figure 19-3.
Lithium Hydroxide Monohydrate price in $US - Historical and forecast from 2016-2027 (used with Permission from Global Lithium LLC)
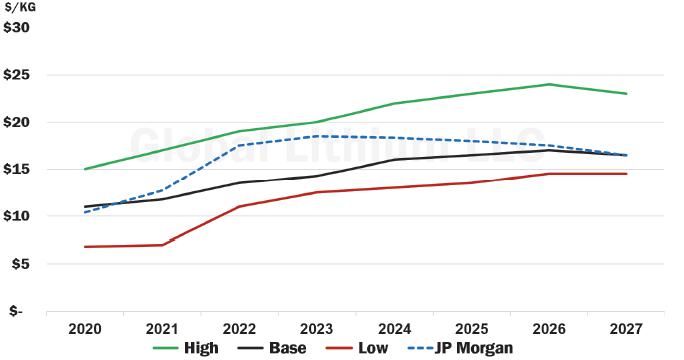
Based upon the
LHM pricing information shown in Figure 19-3, a price of US$14,500/tonne was selected as it was within the low and high scenarios and
similar to JP Morgan Chase’s estimate.
| Standard Lithium Ltd. SW Arkansas Lithium Project PEA | Page 150 |
| 20 | Environmental
Studies, Permitting and Social or Community Impact |
20.1 Introduction
Standard Lithium
is proposing to build the SWA Project for LHM production by processing brine with naturally occurring lithium found in the Smackover
Formation. Standard Lithium will process the brine to form lithium chloride solution and convert to LHM. In the proposed SWA Project,
Standard Lithium will need to develop brine supply and brine injection wellfields. The brine supply wellfield and ancillary equipment
will provide the CPF with brine while the other will be used to inject tail-brine (lithium-depleted brine) and associated process water
back into the Smackover Formation. This section of the report will focus on the listed components of Section 20 of a PEA for a new
Standard Lithium facility near Magnolia, Arkansas. These components are as follows:
| · | Environmental
Considerations |
| · | Permitting
Overview |
| · | Operating
Permits |
| · | Title
V Air Permits |
| · | National
Pollutant Discharge Elimination System |
| · | Underground
Injection Control (UIC) Permits |
| · | Resource
Conservation and Recovery Act Subtitle C Treatment, Storage and Disposal Permit |
| · | Social
Impact |
| · | Environmental
Management and Closure Plan |
20.2 Environmental
Considerations
If federal funds
are used on this project, an Environmental Assessment (EA), wetland delineation, floodplain study and a cultural resource study would
be required. Irrespective of whether federal funding is used or not, the proposed project will require multiple permits for air, water,
hazardous waste, resource extraction, and underground injection. Permit application approvals in some cases will take more than a year
from submission dates. Planning for the permits will need to take place with this long approval time in mind. Detailed plans will be
needed so that the permit application process can be completed in a timely fashion.
20.3 Permitting
20.3.1 Overview
The SWA Project
will require permits to be completed prior to construction of the facility. The permits will require review and approval from the Arkansas
Department of Energy and Environment and potentially, the Environmental Protection Agency. The Arkansas Department of Energy and Environment
is the permitting agency for both the environmental permits and resource extraction for the facility. The Department of Energy and Environment,
Division of Environmental Quality (DEQ) oversees the air, National Pollutant Discharge Elimination System (NPDES), Resource Conservation
and Recovery Act (RCRA) permits and underground injection control (UIC) permits. The Arkansas Oil and Gas Commission (AOGC) is the permitting
authority for the brine resource.
| Standard Lithium Ltd. SW Arkansas Lithium Project PEA | Page 151 |
| 20.3.2 | Air
Emissions Permitting |
An air emissions
permit will be required prior to the commencement of construction. The permit could take up to six months for approval. The permit will
be for both the construction phase of the project and the operation of the CPF. There are three levels of air permits available under
the DEQ air permitting program. The level of permit is directly tied to the mass of emissions the plant will produce. Calculations will
need to be performed to determine the emissions rates. The calculations will take into consideration the production throughput, chemical
reactions, and type of air emission controls used at the facility. A Title V permit is the middle tier permit and approval takes approximately
six months after the permit application is submitted. Again, permit approval must be obtained prior to any changes or construction of
new equipment can take place.
There are seven
NPDES water permits, authorized by DEQ, that are potentially applicable to the SWA Project. These permits include:
| · | Construction
Stormwater |
| · | NPDES
Construction (Wastewater Treatment System) |
| · | NPDES
Individual (Process Water) |
| · | Industrial
General Stormwater |
| · | Cooling
Tower Water |
| · | No
Discharge (holding ponds) |
| · | Underground
Injection Wells |
The NPDES construction
permit authorizes the facility to build the wastewater treatment system. All but two of the permits will have a public comment period
and may require a public meeting depending upon comments received. These permits are required to be in place prior to construction of
a new facility or the piece of the facility each one covers.
| 20.3.4 | Underground
Injection Control (UIC) Permitting |
DEQ and AOGC are
the permitting authorities for the non-hazardous and hazardous injection wells. The AOGC permit will be required for the Class V
spent brine injection well(s). The UIC permitting process is a multiple-step process. An initial permit application is the first step
in that process. Once the permit application has been approved by DEQ, then a drilling plan will need to be submitted. After the drilling
plan is approved, the wells can be drilled. DEQ will be in communication on the progress of the wells being drilled. DEQ staff will also
likely be onsite during the well drilling. Testing of the new wells will then be required. A drilling report, including test results,
will then need to be submitted to DEQ. If the well is a hazardous waste injection well, a No Migration Petition must be sent to EPA after
DEQ approves the drilling report. The well can go into operation after the No Migration Petition is approved by EPA. This process could
take anywhere between two and five years. At this time, there are no hazardous waste wells contemplated or required for the SWA Project.
| 20.3.5 | Resource
Conservation Recovery Act |
If a Class I
hazardous waste injection well is need for the project, it will need to be permitted through the Resource Conservation Recovery Act (RCRA)
program at DEQ. The RCRA permit would also apply to the treatment and storage of any hazardous waste generated onsite. The RCRA permit
approval process would take approximately 18 months once the permit application is submitted to DEQ. It is possible to get a RCRA permit
for the storage and operation of RCRA portions of the facility, and then modify the permit to add an injection well at a later date.
| Standard Lithium Ltd. SW Arkansas Lithium Project PEA | Page 152 |
| 20.3.6 | Construction
Permits, Approvals, and Plans |
Permits will need
to be in place prior to construction of the new CPF. DEQ uses a one permit system for air emissions permitting. The air permit must be
approved prior to construction of the facility. The air permit will also cover the facility during start-up and while operating. The
water discharge permits will also need to be approved prior to construction. There are two NPDES construction permits. The first is the
general stormwater discharge permit that is required for the construction phase of the project. The second is the NPDES construction
permit, which authorizes the construction of the wastewater treatment system. The NPDES individual permit (process water), no discharge
permit (if needed) approval is also required prior to construction. The industrial stormwater permit is required prior operation of the
facility. The RCRA permit or at least portions of the permit, will also need to be approved prior to construction. The time it takes
for DEQ to approve these permits varies from six months to more than a year. The UIC program will take the longest from application to
approval. A list of permits and approximate approval times is listed below in Table 20-1.
Table
20-1. Permit approval estimated timelines
| Permit |
Approximate
Approval Time |
| Title
V Air Permit |
12
Months |
| Minor
Source Permit |
6
Months |
| NPDES
Construction Permit (Wastewater Treatment System) |
12
Months |
| Stormwater
Construction Permit |
1
Month |
| NPDES
Individual (Process Water) |
18
months |
| No
Discharge Permit (holding ponds) |
18
Months |
| Industrial
General Stormwater Permit (Approval Prior to Startup) |
3
Months |
| Cooling
Tower Water |
1
Month |
| RCRA
Permit (Hazardous Waste) |
18
Months |
| UIC
Program Approval |
2-5
years |
Detailed plans
of the new facilities will need to be developed prior to permitting. The plans will be used in all of the permitting applications. Each
permit will require its own permitting package and drawings. The lead time allowed for permitting also needs to account for the time
it takes to prepare the permit application packages.
20.4 Social
Impact
A formal social
impact study has not been completed for this project. It is likely that public meetings will be required as a part of the overall permitting
process. The region around the proposed facility is a rural portion of a rural state. There is an opportunity for a positive social impact
on the surrounding communities. The community will benefit from the construction phase because the project will require skilled labor
to complete. The community will also benefit with the additional opportunities for a labor market skilled in similar operations once
the facility has been constructed.
| Standard Lithium Ltd. SW Arkansas Lithium Project PEA | Page 153 |
| 20.5 | Environmental
Management and Closure Plan |
Standard Lithium
may want to develop an environmental management plan for the proposed SWA Project but it is not required by any of the regulatory agencies.
A closure plan will be required as a part of the hazardous waste permit. The closure plan will need to detail the process of shutting
down the facility to prevent any negative environmental impacts after operations cease. The closure plan will also need to minimize the
amount of maintenance the facility will require after closure. The closure plan will need to be accompanied by a cost estimate to execute
the closure plan. Standard Lithium will be required to provide financial assurance that the closure plan can be implemented in case the
facility shuts down.
| Standard Lithium Ltd. SW Arkansas Lithium Project PEA | Page 154 |
| 21 | Capital
and Operating Expenditure Costs |
The capital expenditure
(CAPEX) cost estimate and operating expenditure (OPEX) cost estimate were prepared under the general provisions for a Class 5 Estimate,
as defined in the American Association of Cost Engineers (AACE) International Recommended Practice No. 18R-97 Cost Estimate Classification
System as Applied in Engineering, Procurement, And Construction for The Process Industries. The AACE classification system uses a 1 to
5 scale, where a “Class 1 Estimate” is the most accurate and a “Class 5 Estimate” is the least accurate.
An AACE Class 5
estimate is used for preliminary comparison of alternatives and generally describes a hypothetical installation. The estimate is suitable
to identify potential fatal flaws and identify the work that needs to be done at further stages of a project, leading to positive acceptance
of a project.
The accuracy of
this estimate has been determined to be -30%/+50%. While a contingency of 35% is typical for estimates of this range, the level of design
completed to date is greater than is typical at this stage of development. Therefore, a less conservative contingency of 25% has been
included.
21.1 Capital Expenditure Cost Estimate –
The basis of estimate
(BOE) for the CAPEX is a work breakdown of the project’s individual components. These components and the basis for their specific
areas are broken down and further described below.
| § | Project
execution includes the construction of one (1) commercial scale production facility
and the necessary brine production gathering and injection facilities. |
| § | Design
is for a facility that produces battery grade (>99.4% pure) LHM product. |
| § | LHM
production by the facility is based on an average brine grade of 399 mg/L of lithium. |
| § | Equipment
size and related cost were developed based on an hourly production rate of 3.833 tonnes per
hour of LHM. |
| § | Estimated
costs are based on current North American pricing from established cost databases and budget
quotations from selected vendors and contractors. |
| § | An
exchange rate of 1 US$ = 1.2436 CAD (Canadian Dollar) was used to convert CAD provided costs
to US currency (US$). |
| 21.1.1.2 | Brine
Supply & Injection Wellfields |
| § | Brine
gathering system consisting of five (5) well pad facilities that will be comprised (as
a whole) of four (4) vertical wells, fourteen (14) directional wells, and five (5) horizontal
wells. |
| Standard Lithium Ltd. SW Arkansas Lithium Project PEA | Page 155 |
| § | Capital
cost estimates for the wells were completed by HGA in cooperation with Baker Hughes and other
drilling service suppliers. The drilling cost estimates are based on the conceptual brine
supply and injection wellfields design provided by Matrix Solutions. Well pad locations and
drilling methodologies were identified based on down hole performance requirements and location/proximity
factors. A “typical” drilling plan model was established and priced for the three
(3) drilling methods detailed below: |
| - | Vertical
Well |
| - | Directional
Well |
| - | Horizontal
Well |
| § | The
well sites are expected to be drilled on a continuous schedule from start to finish. This
is expected to accrue certain cost savings for reduced mobilization costs, overhead, etc.
over the course of this effort. A “Drilling Efficiencies Factor” of 5% has been
included in the wellfield cost for the variable (daily) drilling expenses to account for
these anticipated cost savings. |
| § | Cost
estimates for the electrical submersible pumps (ESP) are based on an 800 horsepower, high
flow rate pump, with a cost of US$ 332,000 per pump including all accessories. ESP sizing
is based on historical pump sizing for similar wells in the region. The pump sizing and costs
are subject to change depending on the requirements set forth in the final wellfield design.
Further analysis should be conducted to better define the pump sizing requirements for the
wellfield as the costs for these pumps vary significantly with size. |
| § | Cost
estimates associated with surface facilities equipment at each facility are based on historical
pricing for installation and budgetary equipment costs in Aspen In-Plant Cost Estimator SoftwareTM,
Version 12. |
| § | Costs
associated with the site preparation and auxiliary infrastructure to be installed at each
well pad facility are based on budgetary contractor estimates. A material factor of 0.088
and labor factor of 0.072 was used to estimate the cost for electrical work at the facility. |
| § | Indirect
Costs are factored at 15% of Direct Cost to account for Owner’s Engineering and other
miscellaneous costs. |
| 21.1.1.3 | Brine
Supply/Return and Sour Gas Pipeline Network |
| § | Sour
gas will be separated from the brine at the supply well facilities and delivered to the production
facility in pipelines alongside the brine feedstock. |
| § | Anticipated
brine feedstock flow to the production facility is approximately 1,800 m3/hour. |
| § | Pipeline
cost estimates are based on material quotes received from suppliers – detailed below
in Table 21-1 along with installation and land costs from previous projects. |
| Standard Lithium Ltd. SW Arkansas Lithium Project PEA | Page 156 |
Table
21-1. Pipeline material summary
| Service |
|
Size |
|
Type /
Specification |
|
Quantity |
| Brine Supply Pipelines |
|
25.40cm to 50.80cm (10” to 20”) |
|
NOV Green Thread HP25 Fiberglass |
|
18.36 km (11.41 miles) |
| Barren Brine (Injection) Pipelines |
|
30.48cm to 60.96cm (12” to 24”) |
|
NOV Green Thread HP25 Fiberglass |
|
20.13 km (12.51 miles) |
| Sour Gas Pipelines |
|
15.24cm to 40.64cm (6” to 16”) |
|
SDR-11/PE3408 HDPE |
|
18.36 km (11.41 miles) |
| Total |
|
- |
|
- |
|
56.86 km (35.33 miles) |
| § | Survey
and land costs were estimated based on budgetary pricing developed by HGA. |
| § | Installation
and environmental services were also based on budgetary pricing from local companies familiar
with executing this type of work. |
| § | Indirect
cost estimates, such as those for engineering and inspection, are based on similar sized
projects. |
| 21.1.1.4 | Central
Processing Facility |
| § | The
CPF includes the following processing units/areas. |
| - | Brine
receiving unit for degassing, solids removal, and storage of pre-treated brine prior to its
introduction into Process Train 1. |
| - | Sour
gas receiving and disposal unit to receive sour gas from the brine supply well system and
the degassing system in the brine receiving area. Sour gas is expected to be metered and
delivered to a nearby Mission Creek sour gas gathering pipeline feeding the Mission Creek
Dorcheat Gas Plant. |
| - | LiSTR
unit produces a lithium chloride (LiCl) as a purified and concentrated solution feedstock
for the LHM unit. |
| - | LHM
Unit producing an average of 30,000 tonnes per year of LHM. |
| - | Annual
production is based on approximately 333 days of operation per year or 8,000 hours. |
| - | Shipping
and receiving unit for the storage and truck loading of the finished LHM. |
| - | Utilities
unit to produce: |
| o | 18,144
kg/hr (40,000 lb./hr) of medium pressure steam |
| o | 10
m3/min (2,700 gal/min) of raw water |
| o | 106
m3/min (28,000 gal/min) of cooling water |
| o | 0.3
m3/min (80 gal/min) of demineralized water |
| o | 0.3
m3/min (80 gal/min) of RO-filtered water |
| o | 45
m3/min (1,600 ft3/min) of compressed air |
| § | Lang
Factors were used as the primary method to estimate the cost for the inside boundary limit
(ISBL) areas of the production facility. The Lang Factor is one of the factored estimating
techniques recommended by AACE International for Class 4 and Class 5 estimates.
This method uses a formula that contains a set of factors multiplied by the total equipment
cost (TEC) to obtain the total plant cost (TPC). |
| Standard Lithium Ltd. SW Arkansas Lithium Project PEA | Page 157 |
| - | Gross
production schedules were estimated to form the basis of nominal process facilities capacity,
using assumed flow sheets and process requirements. |
| - | Equipment
lists were prepared based on preliminary process flow diagrams (PFDs) and are priced based
on historical pricing, informal vendor pricing, and formal budgetary pricing for the major
pieces of equipment at the facility. |
| - | AACE
percentage factors (Table 21-2) were applied to equipment costs to estimate installation
costs. Much of the equipment will either be packaged or require very little auxiliary equipment
support. Vendor pricing was obtained for most of the major equipment associated with this
project. The AACE factors have been refined accordingly to reflect the actual process conditions |
Table
21-2. Lang Factors comparison between factors used in the Technical Report and AACE 59R-10 (2011)
| Description | |
AACE 59R-10-2011
Lang Factor % Values
for Fluid Processing | | |
PEA Average
Factor % Values | | |
Delta + / (-) | |
| Direct Costs | |
| | | |
| | | |
| | |
| Purchased Equipment Cost | |
| 100 | | |
| 100 | | |
| - | |
| Equipment Setting | |
| 4 | | |
| 1.53 | | |
| (2.47 | ) |
| Site Development | |
| 5 | | |
| 4.55 | | |
| (0.45 | ) |
| Concrete | |
| 8 | | |
| 8.90 | | |
| 0.90 | |
| Structural Steel | |
| 13 | | |
| 5.41 | | |
| (7.59 | ) |
| Buildings | |
| 2 | | |
| 1.65 | | |
| (0.35 | ) |
| Piping | |
| 97 | | |
| 26.23 | | |
| (70.77 | ) |
| I&C | |
| 42 | | |
| 12.36 | | |
| (29.64 | ) |
| Electrical | |
| 16 | | |
| 8.05 | | |
| (7.95 | ) |
| Insulation | |
| 7 | | |
| 2.86 | | |
| (4.14 | ) |
| Painting | |
| 6 | | |
| 1.59 | | |
| (4.41 | ) |
| Total Direct Plant Cost | |
| 300 | | |
| 173.13 | | |
| (126.87 | ) |
| Indirect Costs | |
| | | |
| | | |
| | |
| Labor Indirect & Field Costs | |
| 72 | | |
| 51.05 | | |
| (20.95 | ) |
| Contractor Engineering Fees | |
| 91 | | |
| 35.84 | | |
| (55.16 | ) |
| Owner’s Engineering & Oversight | |
| 42 | | |
| 32.54 | | |
| (9.46 | ) |
| Total Indirect Cost | |
| 205 | | |
| 119.43 | | |
| (85.57 | ) |
| Total Installed Cost (TIC) | |
| 505 | | |
| 292.56 | | |
| (212.44 | ) |
21.1.2 Capital Expenditure Cost Estimate
The total capital
cost for the project is detailed below in Table 21-3.
| Standard Lithium Ltd. SW Arkansas Lithium Project PEA | Page 158 |
Table
21-3. SWA Project capital expenditure cost estimate
| Description | |
Equipment Cost
US$ | | |
Factor %
Values | | |
Factored Cost US$ | |
| Well-Field | |
| | | |
| | | |
| | |
| - Supply Wells & Facilities | |
| Included | | |
| N/A | | |
$ | 123,290,000 | |
| - Injection Wells & Facilities | |
| Included | | |
| N/A | | |
$ | 83,854,000 | |
| Pipelines | |
| | | |
| | | |
| | |
| - Brine Supply Pipelines | |
| Included | | |
| N/A | | |
$ | 14,770,000 | |
| - Brine Injection Pipelines | |
| Included | | |
| N/A | | |
$ | 20,497,000 | |
| - Sour Gas Pipelines | |
| Included | | |
| N/A | | |
$ | 5,942,000 | |
| Brine Receiving/Pre-Treatment | |
| | | |
| | | |
| | |
| - Brine Receiving | |
$ | 4,415,000 | | |
| 426 | % | |
$ | 18,808,000 | |
| - Raw Brine Storage | |
$ | 3,159,000 | | |
| 267 | % | |
$ | 8,433,000 | |
| - Brine Solids Removal | |
$ | 10,333,000 | | |
| 351 | % | |
$ | 36,300,000 | |
| LiSTR Unit | |
| | | |
| | | |
| | |
| - Sorbent Loading | |
$ | 21,100,000 | | |
| 365 | % | |
$ | 77,116,000 | |
| - Loaded Sorbent Washing | |
$ | 16,978,000 | | |
| 304 | % | |
$ | 51,687,000 | |
| - Sorbent Stripping | |
$ | 2,819,000 | | |
| 354 | % | |
$ | 9,974,000 | |
| - SAC/WAC IX | |
$ | 2,118,000 | | |
| 384 | % | |
$ | 8,133,000 | |
| - Stripping Sorbent Washing | |
$ | 19,053,000 | | |
| 306 | % | |
$ | 58,291,000 | |
| - UHPRO | |
$ | 13,739,000 | | |
| 244 | % | |
$ | 33,525,000 | |
| LHM Unit | |
| | | |
| | | |
| | |
| - Brine Treatment (Chemical/IX) | |
$ | 1,660,000 | | |
| 209 | % | |
$ | 3,476,000 | |
| - MP Brine Storage | |
$ | 349,000 | | |
| 267 | % | |
$ | 931,000 | |
| - NaCl Crystallization | |
$ | 9,382,000 | | |
| 297 | % | |
$ | 27,823,000 | |
| - Ultra-Pure Brine Storage | |
$ | 100,000 | | |
| 336 | % | |
$ | 335,000 | |
| - Electrolysis | |
$ | 34,739,000 | | |
| 207 | % | |
$ | 71,788,000 | |
| - Evaporation Crystallization | |
$ | 12,270,000 | | |
| 210 | % | |
$ | 25,706,000 | |
| - Product Bagging Facility | |
$ | 50,000 | | |
| 210 | % | |
$ | 105,000 | |
| - Vent Scrubber & Spill System | |
$ | 1,528,000 | | |
| 126 | % | |
$ | 1,919,000 | |
| - Debromination Unit | |
$ | 390,000 | | |
| 210 | % | |
$ | 817,000 | |
| Utilities/Infrastructure | |
| | | |
| | | |
| | |
| - Utilities Equipment | |
$ | 10,500,000 | | |
| 375 | % | |
$ | 39,406,000 | |
| - Chemical Receiving, Storage & Distribution | |
$ | 2,748,000 | | |
| 385 | % | |
$ | 10,589,000 | |
| - Plant Buildings | |
| | | |
| | | |
$ | 3,452,000 | |
| - Infrastructure | |
| | | |
| | | |
$ | 1,013,000 | |
| - Wastewater Collection, Treatment & Disposal | |
$ | 253,000 | | |
| 386 | % | |
$ | 974,000 | |
| Contingency (Based on Total Equipment Cost of 25%) | |
| Included | | |
| N/A | | |
$ | 132,969,000 | |
| TOTAL FACTORED COST | |
| | | |
| | | |
$ | 869,867,000 | |
| Standard Lithium Ltd. SW Arkansas Lithium Project PEA | Page 159 |
21.2 Operating Expenditure Cost Estimate
The BOE for the
OPEX of the SWA Project is a breakdown of the project’s individual operating expenditures. The operating costs presented herein
are for full production (30,666 tonnes per year LHM) after completion of the project for the first 15 years of operation with a reduced
production rate of 28,000 tonnes per year for the remaining 5 years of operation averaging to 30,000 tonnes per year over the 20-year
life of the SWA Project.
| 21.2.2 | Direct
Operational Expenditures |
The following cost
elements are taken into account for the direct OPEX estimation.
Labor manning levels
are based on experience and reported data from facilities operating in the region. Salary and wage estimates are based on published data
for various trades prevailing in the City of El Dorado, Arkansas. This is the closest significant population center to Magnolia, Arkansas,
where the SWA Project will be located. Personnel and staffing requirements, for the different parts of the operation, are discussed in
the following sections.
| 21.2.2.1.1. | Facility
Management |
Management includes
the higher-level managerial positions required for supervision of the operation of the CPF and the supporting wellfield facilities, as
summarized below in Table 21-4. Management personnel will not be assigned to a shift system and will be paid based on a standard 5 day/40
hour per week work schedule.
Table 21-4. Management
personnel
| Position | |
Full Time
Employees (FTE) | | |
Shifts | | |
Average Annual
Salary US$ | | |
Total Annual
Cost US$ | |
| Plant Manager | |
| 1 | | |
| 1 | | |
$ | 180,000 | | |
$ | 180,000 | |
| Assistant Plant Manager | |
| 1 | | |
| 1 | | |
$ | 100,000 | | |
$ | 100,000 | |
| Senior Plant Engineer | |
| 1 | | |
| 1 | | |
$ | 160,000 | | |
$ | 160,000 | |
| Maintenance Manager | |
| 1 | | |
| 1 | | |
$ | 95,000 | | |
$ | 95,000 | |
| Health, Safety & Environmental Manager | |
| 1 | | |
| 1 | | |
$ | 120,000 | | |
$ | 120,000 | |
| Logistics Manager | |
| 1 | | |
| 1 | | |
$ | 95,000 | | |
$ | 95,000 | |
| Total | |
| 6 | | |
| - | | |
$ | 125,000 | | |
$ | 750,000 | |
| 21.2.2.1.2. | Administration
Personnel |
Administrative
personnel include the support positions required for the “front office” operation of the CPF, as summarized below in Table
21-5. Administrative personnel will not be assigned to a shift system and will be paid based on a standard 5 day/40 hour per week work
schedule.
| Standard Lithium Ltd. SW Arkansas Lithium Project PEA | Page 160 |
Table
21-5. Administrative personnel
| Position | |
Full Time
Employees (FTE) | | |
Shifts | | |
Average Annual
Salary US$ | | |
Total Annual
Cost US$ | |
| Accounting Specialist | |
| 1 | | |
| 1 | | |
$ | 80,000 | | |
$ | 80,000 | |
| Receptionist/Data Clerk | |
| 1 | | |
| 1 | | |
$ | 45,000 | | |
$ | 45,000 | |
| Total | |
| 2 | | |
| - | | |
$ | 62,500 | | |
$ | 125,000 | |
| 21.2.2.1.3. | Security
Personnel |
Security personnel
include the support positions required to ensure a secured facility and work environment for both the personnel and end product, as summarized
below in Table 21-6. Security personnel will be assigned to a 12-hour DuPont rotating shift pattern with 24 hours per day/7 days per
week work schedule.
Table 21-6. Security
personnel
| Position | |
Full Time
Employees (FTE) | | |
Shifts | | |
Average Annual
Salary US$ | | |
Total Annual
Cost US$ | |
| Security Specialists | |
| 8 | | |
| 2 | | |
$ | 55,000 | | |
$ | 440,000 | |
| Total | |
| 8 | | |
| - | | |
$ | 55,000 | | |
$ | 440,000 | |
| 21.2.2.1.4. | Production
Personnel |
Production personnel
include the staff required for operation of the wellfield and CPF, as shown in Table 21-7. Plant engineers will not be assigned to a
shift system and will be paid based on a standard 5 day/40 hour per week work schedule. Plant foreman and operators will be assigned
to a 12-hour DuPont rotating shift pattern with 24 hours per day/7 days per week work schedule.
Table 21-7. Production
personnel
| Position | |
Full Time
Employees (FTE) | | |
Shifts | | |
Average Annual
Salary US$ | | |
Total Annual
Cost US$ | |
| Plant Engineer(s) - Process/Mechanical | |
| 1 | | |
| 1 | | |
$ | 95,000 | | |
$ | 95,000 | |
| Plant Engineer(s) - Electrical/ Instrumentation | |
| 1 | | |
| 1 | | |
$ | 95,000 | | |
$ | 95,000 | |
| Plant Foreman(s) - All Areas | |
| 4 | | |
| 2 | | |
$ | 85,000 | | |
$ | 340,000 | |
| Plant Operator(s) - All Areas | |
| 36 | | |
| 2 | | |
$ | 75,000 | | |
$ | 2,700,000 | |
| Total | |
| 42 | | |
| - | | |
$ | 76,905 | | |
$ | 3,230,000 | |
| 21.2.2.1.5. | Shipping &
Receiving Personnel |
Shipping and receiving
personnel will not be assigned to a shift system and will be paid based on a standard 5 day/40 hour per week work schedule, as shown
below in Table 21-8.
| Standard Lithium Ltd. SW Arkansas Lithium Project PEA | Page 161 |
Table
21-8. Shipping & receiving personnel
| Position | |
Full Time
Employees (FTE) | | |
Shifts | | |
Average Annual
Salary US$ | | |
Total Annual
Cost US$ | |
| Shipping & Receiving Clerks | |
| 1 | | |
| 1 | | |
$ | 75,000 | | |
$ | 75,000 | |
| Logistics/Loading Operators | |
| 1 | | |
| 1 | | |
$ | 45,000 | | |
$ | 45,000 | |
| Total | |
| 2 | | |
| - | | |
$ | 60,000 | | |
$ | 120,000 | |
| 21.2.2.1.6. | Maintenance
Personnel |
Maintenance personnel
positions will be assigned on both a standard work week schedule (5 day/40 hour per week) and a 12-hour DuPont rotating shift pattern
(24 hours per day/7 days per week), as detailed below in Table 21-9.
Table 21-9. Maintenance
personnel
| Position | |
Full Time
Employees (FTE) | | |
Shifts | | |
Average Annual
Salary US$ | | |
Total Annual
Cost US$ | |
| Mechanics – Day Shift | |
| 2 | | |
| 1 | | |
$ | 75,000 | | |
$ | 150,000 | |
| Mechanics – Rotating Shift | |
| 4 | | |
| 2 | | |
$ | 75,000 | | |
$ | 300,000 | |
| Electrical/Instrument Tech – Day Shift | |
| 2 | | |
| 1 | | |
$ | 75,000 | | |
$ | 150,000 | |
| Electrical/Instrument Tech – Rotating Shift | |
| 4 | | |
| 2 | | |
$ | 75,000 | | |
$ | 300,000 | |
| Total | |
| 12 | | |
| - | | |
$ | 75,000 | | |
$ | 900,000 | |
| 21.2.2.1.7. | Quality
Control & Laboratory Personnel |
Quality Control
(QC) and laboratory personnel will not be assigned to a shift system and will be paid based on a standard 5 day/40 hour per week work
schedule, as shown below in Table 21-10.
Table 21-10.
Quality control and laboratory personnel
| Position | |
Full Time
Employees (FTE) | | |
Shifts | | |
Average Annual
Salary US$ | | |
Total Annual
Cost US$ | |
| Lab Technician | |
| 1 | | |
| 1 | | |
$ | 85,000 | | |
$ | 85,000 | |
| Lab Assistant | |
| 1 | | |
| 1 | | |
$ | 60,000 | | |
$ | 60,000 | |
| Total | |
| 2 | | |
| - | | |
$ | 72,500 | | |
$ | 145,000 | |
| 21.2.2.1.8. | Manpower
Summary |
A cost summary
of manpower in all categories is provided below in Table 21-11.
| Standard Lithium Ltd. SW Arkansas Lithium Project PEA | Page 162 |
Table 21-11.
Manpower cost summary
| Category | |
Full Time
Employees (FTE) | | |
Average Annual
Salary US$ | | |
Total Annual
Cost US$ | |
| Management Personnel | |
| 6 | | |
$ | 125,000 | | |
$ | 750,000 | |
| Administration Personnel | |
| 2 | | |
$ | 62,500 | | |
$ | 125,000 | |
| Security Personnel | |
| 8 | | |
$ | 55,000 | | |
$ | 440,000 | |
| Production Personnel | |
| 42 | | |
$ | 76,905 | | |
$ | 3,230,000 | |
| Shipping & Receiving Personnel | |
| 2 | | |
$ | 60,000 | | |
$ | 120,000 | |
| Maintenance Personnel | |
| 12 | | |
$ | 75,000 | | |
$ | 900,000 | |
| QC & Lab Personnel | |
| 2 | | |
$ | 72,500 | | |
$ | 145,000 | |
| Total | |
| 74 | | |
$ | 77,162 | | |
$ | 5,710,000 | |
Electrical energy
will be delivered to the sites from the Entergy Arkansas power grid. The electrical costs are based on the latest Entergy rate sheet
for large power service (LPS) as detailed below in Table 21-12.
Table 21-12.
Entergy large power service rate sheet
| Description | |
Unit | | |
Base Case Value (US$) | |
| Customer Charge | |
$ per Month | | |
$ | 468.60 | |
| Demand Charge | |
| | |
| | |
| - Summer (June - Sept) | |
$ per kW | | |
$ | 13.42 | |
| - Other | |
$ per kW | | |
$ | 11.28 | |
| Energy Charge | |
| | |
| | |
| - Summer (June - Sept) | |
$ per kWh | | |
$ | 0.03 | |
| - Other | |
$ per kWh | | |
$ | 0.02 | |
The electrical
energy cost is summarized below in Table 21-13.
| Standard Lithium Ltd. SW Arkansas Lithium Project PEA | Page 163 |
Table
21-13. Electrical use and cost
| Description | |
Quantity | | |
Unit | | |
Average Annual
Cost US$* | |
| Wellfield | |
| | | |
| | | |
| | |
| Customer Charge | |
| 12 | | |
| Month | | |
$ | 5,623 | |
| Demand Charge | |
| | | |
| | | |
| | |
| - Summer Months (June - Sept) | |
| 59,739 | | |
| kW | | |
$ | 801,702 | |
| - Remaining Months | |
| 119,479 | | |
| kW | | |
$ | 1,347,720 | |
| Energy Charge | |
| | | |
| | | |
| | |
| - Summer Months (June - Sept) | |
| 43,126,807 | | |
| kWh | | |
$ | 1,168,305 | |
| - Remaining Months | |
| 86,253,614 | | |
| kWh | | |
$ | 1,662,107 | |
| Sub-Total | |
| | | |
| | | |
$ | 4,985,457 | |
| Central Processing Facility | |
| | | |
| | | |
| | |
| Customer Charge | |
| 12 | | |
| Month | | |
$ | 5,623 | |
| Demand Charge | |
| | | |
| | | |
| | |
| - Summer Months (June - Sept) | |
| 79,899 | | |
| kW | | |
$ | 1,072,245 | |
| - Remaining Months | |
| 159,798 | | |
| kW | | |
$ | 1,802,521 | |
| Energy Charge | |
| | | |
| | | |
| | |
| - Summer Months (June - Sept) | |
| 53,052,726 | | |
| kWh | | |
$ | 1,437,198 | |
| - Remaining Months | |
| 106,105,452 | | |
| kWh | | |
$ | 2,044,652 | |
| Sub-Total | |
| | | |
| | | |
$ | 6,362,240 | |
| Grand Total | |
| | | |
| | | |
$ | 11,347,697 | |
* Annual consumption and cost figures
are based on an average annual LHM production rate of 30,000 tonnes.
| 21.2.2.3 | Reagents
and Consumables |
Reagents and consumables
are the various additions required for the production process of LHM.
Quantities for
each item are estimated based on preliminary process flow calculations for the plant. The costs for the reagents and chemicals are based
on pricing received from local suppliers as shown below in Table 21-14.
| Standard Lithium Ltd. SW Arkansas Lithium Project PEA | Page 164 |
Table
21-14. Average annual reagents cost for 30,000 tonnes LHM per year production
| Description | |
Average Annual
Consumption* | |
Unit Cost US$ | |
Average Annual Cost
US$* | |
| Wellfield | |
| |
| |
| | |
| Scale Inhibitors | |
11.9 m3 | |
$12,728 / m3 | |
$ | 151,756 | |
| Corrosion Inhibitors | |
7.35 m3 | |
$19,905 / m3 | |
$ | 146,263 | |
| Sub-Total | |
- | |
- | |
$ | 298,019 | |
| Central Processing Facility | |
| |
| |
| | |
| CO2 Free Air | |
151,560.66 kg | |
$0.13 / kg | |
$ | 19,703 | |
| Hydrochloric Acid - 31.5% | |
| |
| |
| | |
| - Consumption at CPF | |
156,612,483 kg | |
$0.13 / kg | |
$ | 20,845,122 | |
| - Production at Synthesis Plant | |
(79,674,446) kg | |
$0.13 / kg | |
$ | (10,604,669) | |
| Lithium Titanate | |
248 tonnes | |
Credit from entrained Lithium is greater than the $8,000/tonne unit cost for Lithium Titanate ** | |
$ | 0 | |
| Sodium Chloride | |
| |
| |
$ | 0
(No revenue recognized as surplus NaCl will not be marketed for sale) | |
| - Consumption at CPF | |
2,350,684 kg | |
$0.51 / kg | |
$ | 1,198,849 | |
| - Production at NaCl Crystallizer | |
(20,727,584) kg | |
$0.51 / kg | |
$ | (10,571,068) | |
| Sodium Hydroxide - 50% | |
4,897,895 kg | |
$0.55 / kg | |
$ | 2,670,822 | |
| Ammonium Hydroxide - 19% | |
136,738 tonnes | |
$56.75 / tonne | |
$ | 7,759,863 | |
| Nitrogen | |
494,712 Nm3 | |
$0.35 / Nm3 | |
$ | 171,980 | |
| Membrane Replacement | |
27767 m2 | |
$70.00 / m2 | |
$ | 1,943,667 | |
| Sub-Total | |
- | |
- | |
$ | 24,789,510 | |
| Grand Total | |
- | |
- | |
$ | 25,087,529 | |
* Annual consumption and cost figures
are based on an average annual LHM production rate of 30,000 tonnes.
** The lithium contained in the lithium
titanate nominally increases in value when converted to battery grade LHM; however, there is no credit assigned in the OPEX. The sorbent
pricing is based upon the material costs only. Similar materials are currently manufactured in China for use in older lithium-ion battery
architectures. Domestic sorbent pricing at a commercial scale will be evaluated for future project studies (i.e. Pre-feasibility study).
Water wells will
be installed at each of the well facilities and CPF. Operating costs for the wells are included in the electrical power and maintenance &
servicing portions of this OPEX breakdown.
Natural gas will
be required as fuel gas for the 18,140 kg/hr (40,000 lb/hr) boiler at the CPF, as detailed below in Table 21-15.
| Standard Lithium Ltd. SW Arkansas Lithium Project PEA | Page 165 |
Table
21-15. Natural gas use
| Description | |
Annual Natural Gas
Use (MMBtu)* | | |
Unit Cost US$
/ MMBtu | | |
Average Annual
Cost US$* | |
| Natural gas for steam production | |
| 376,471 | | |
$ | 3.144 | | |
$ | 1,183,624 | |
| Total | |
| - | | |
| - | | |
$ | 1,183,624 | |
* Annual consumption
and cost figures are based on an average annual LHM production rate of 30,000 tonnes.
The estimated cost
of natural gas is based on the supply from an on-site existing distribution network. The unit cost rate of natural gas used is for large
industrial users in Arkansas. No credit is provided for any natural gas that may be co-produced with the brine.
| 21.2.2.6 | Maintenance &
Servicing |
| 21.2.2.6.1. | Well
Facilities |
Several routine
maintenance and servicing activities are required for efficient operation of the supply and reinjection well facilities, as detailed
below in Table 21-16.
Table 21-16.
Well facilities maintenance & servicing
| Description | |
Basis | |
Unit Cost US$ | | |
Average Annual
Cost US$ | |
| ESP Servicing/ Workovers | |
1 per Supply Well every 2 Years | |
$ | 30,000 | | |
$ | 345,000 | |
| ESP Replacements | |
2-Year Service Life for ESP’s | |
$ | 362,000 per ESP w/Installation | | |
$ | 4,163,000 | |
| Surface Eqmt/Site Servicing | |
3% Direct Cost Less Drilling & Equipment Costs | |
$ | 1,806,246 | | |
$ | 1,806,246 | |
| Total | |
- | |
| - | | |
| 6,314,246 | |
The estimated cost
for these activities is based on historical pricing and factors used on similar well facilities in south Arkansas.
Routine maintenance
activities for the pipeline Right-of-Way (ROW) are provided below in Table 21-17. These costs do not include major pipeline overhauls
or repairs as the service life for the pipelines are expected to be greater than the service life of the project.
| Standard Lithium Ltd. SW Arkansas Lithium Project PEA | Page 166 |
Table
21-17. Pipelines ROW maintenance & servicing
| Description | |
Basis | | |
Unit Cost US$ | | |
Average Annual
Cost US$ | |
| Pipelines ROW | |
| 3% of Direct Cost | | |
$ | 1,236,289 | | |
$ | 1,236,289 | |
| Total | |
| - | | |
| - | | |
$ | 1,236,289 | |
| 21.2.2.6.3. | Central
Processing Facility |
Routine maintenance
activities for the CPF are provided below in Table 21-18. A 4% factor was used to estimate the maintenance and servicing costs for much
of the CPF. A $1,600,000 refurbishment cost was included per year to service the Electrolysis Cellhouse. A 3% factor was used to estimate
the general maintenance costs associated with the site/infrastructure upkeep at the facility.
Table 21-18.
CPF Maintenance & Servicing Costs
| Description | |
Basis / Frequency | |
Average Annual
Cost US$ | |
| Receiving/Pre-Treatment | |
4% Equipment Costs | |
$ | 716,278 | |
| LiSTR Unit | |
4% Equipment Costs | |
$ | 3,032,295 | |
| LHM Unit | |
| |
| | |
| - General | |
4% Equipment Costs | |
$ | 2,418,650 | |
| - Electrolysis Cellhouse Servicing/Workover | |
Once a Year | |
$ | 1,600,000 | |
| Utilities | |
4% Equipment Costs | |
$ | 540,051 | |
| Site/Infrastructure | |
3% Equipment Costs | |
$ | 107,161 | |
| Total | |
- | |
$ | 8,414,435 | |
| 21.2.2.7 | Product
Transport |
All reagent pricing
includes transportation to site. Additionally, the cost of freight for LHM has been assumed to be included in purchaser contracts.
It is assumed that
two pump-outs will be required annually to remove the solids from the three-phase separators on each of the supply wells, as shown below
in Table 21-19. The cost per pump out is based on historical pricing for a pump truck.
| Standard Lithium Ltd. SW Arkansas Lithium Project PEA | Page 167 |
Table
21-19. Solids disposal
| Process Area | |
Total Annual
Pump Outs | |
Cost US$ per
Pump Out | |
Total Annual
Cost US$ | |
Remarks |
| Brine Supply Well Separators | |
| 46 | |
$ | 1,500.00 | |
$ | 34,500.00 | |
2 pump outs per year for 23 separators. |
| Total | |
| 46 | |
| - | |
$ | 34,500.00 | |
|
| 21.2.2.9 | Miscellaneous
Costs |
Miscellaneous operating
costs include costs that may be required but cannot be detailed at this stage of the project. For these reasons, these costs are estimated
at 1.5% of the other direct costs as detailed in Table 21-20.
Table 21-20.
Miscellaneous direct operational costs
| Description | |
Unit | | |
Total Amount | |
| Direct Operational Costs | |
| US$ | | |
| 59,328,319 | |
| Cost as a Percentage of Direct Operational Costs | |
| % | | |
| 1.50 | |
| Total | |
| US$ | | |
| 889,925 | |
| 21.2.3 | Indirect
Operational Expenditures |
The following indirect
cost elements are included for the OPEX estimation:
Insurance during
the operation phase will cover property, general liability, and risk of business interruption. The annual insurance premium has been
estimated at 0.5% of direct CAPEX or $2,659,377.
| 21.2.3.2 | Sales,
Marketing, & Customers Relations |
The annual cost
of sales, marketing, and customer relations is estimated at 0.15% of direct OPEX or $90,327.
| 21.2.3.3 | Plant
Optimizations & Development |
The annual cost
for plant optimization and project development is estimated at 0.25% of direct OPEX or $150,546 to cover salaries for consultants and
contractors for studies on development tasks.
| 21.2.3.4 | Environmental
Monitoring |
Environmental monitoring
contains the annual cost of environmental assessment and monitoring including air emissions, water discharges, waste disposal, noise
emission, and changes to the environment. The annual cost for environmental monitoring is estimated at 0.5% of direct OPEX or $301,091.
| Standard Lithium Ltd. SW Arkansas Lithium Project PEA | Page 168 |
| 21.2.3.5 | Community
Benefits |
The annual cost
for community benefits is estimated at 0.01 % of direct OPEX or $6,022.
| 21.2.3.6 | Mine
Closure Fund |
Each well will
need to be plugged and capped at the end of operations. A $35,000 allowance has been included for each brine supply and injection well
to cover the cost to plug and cap the wells. These costs will be incurred as a one-time cost at the end of operations. A surety bond
will be secured prior to operation of the plant to provide the necessary assurances that the mine closure funds will be available at
or prior to the conclusion of operations of the facilities. The surety bond principal is assumed to be a one-time 3% fee of the total
closure fund amount payable on the 1st year of operations of the plant.
| 21.2.4 | Royalties &
Land Fees |
The following cost
elements are taken into account for the royalties and land costs:
On January 8th,
2018, Standard Lithium executed an Option Agreement with TETRA Technologies Inc. (TETRA) to acquire the rights to conduct exploration,
production, and lithium extraction activities on up to 33,000 acres of brine leases in southern Arkansas, USA. The terms of this agreement
are detailed below and summarized in Table 21-21.
| § | Under
the terms of the Option Agreement with TETRA, Standard Lithium will be granted the rights
in consideration for a series of cash payments, as well as certain ongoing royalties tied
to Lithium production from the properties. In consideration of the execution of the Option
Agreement, the Company has made a non-refundable cash payment to TETRA of US$500,000, with
further cash payments owing to TETRA as follows: |
| - | US$500,000
on or before the date that is thirty (30) calendar days following the Agreement Date. |
| - | An
additional US$600,000 on or before the date which is twelve (12) months following the Agreement
Date. |
| - | An
additional US$700,000 on or before the date which is twenty-four (24) months following the
Agreement Date. |
| - | An
additional US$750,000 on or before the date which is thirty-six (36) months following the
Agreement Date. |
| - | An
additional annual payment of US$1,000,000 on or before each annual anniversary of the Agreement
Date, beginning with the date that is forty-eight (48) months following the Agreement Date,
until the earlier of the expiration of the 10-year exploratory period or, if the Company
exercises the Option, the Company begins payment of the Royalty. |
| § | Upon
commercial production, the Company will pay TETRA a two and one-half percent (2.5%) royalty
on gross revenue derived from the sale of lithium produced from the properties, subject to
a minimum annual royalty payment of US$1,000,000. |
| Standard Lithium Ltd. SW Arkansas Lithium Project PEA | Page 169 |
Table 21-21.
TETRA brine lease agreement summary
| Description | |
Total Amount US$ | | |
Remarks |
| Initial Payment | |
$ | 500,000 | | |
|
| - 30 Day Payment after Agreement | |
$ | 500,000 | | |
|
| - 12 Month Payment after Agreement | |
$ | 600,000 | | |
Paid Prior to Year 1 (2021) of Project. |
| - 24 Month Payment after Agreement | |
$ | 700,000 | | |
|
| - 36 Month Payment after Agreement | |
$ | 750,000 | | |
|
| - 48 Month Payment after Agreement | |
$ | 1,000,000 | | |
|
| Royalties | |
| | | |
|
| - Initial US$1M Annual Payments | |
$ | 4,000,000 | | |
During Project Development & Startup |
| - Royalties – 2.5% of Gross Revenue | |
$ | 285,038,045 | | |
Total Amount Paid for Life of Plant |
Does not include
future lease-fees-in-lieu-of-royalties which are still to be determined and subject to regulatory approval (lease-fees-in-lieu-of-royalties
have been determined for bromine and certain other minerals in the State of Arkansas, but have not yet been determined for lithium extraction).
Additional items will be identified and addressed in future stages of development for the project.
| 21.2.4.2.1. | Well
Facilities and Central Processing Plant |
The brine supply
and injection well facilities will require approximately 167 acres of surface area for the facility arrangements detailed in Sections
18.1.1 and 18.3.1. No financing fees are included in the assessment at this time for the land costs associated with the well facilities.
The CPF will be
located on the 57 acre “Mission Creek” property described in Section 18.2. It is assumed that this land will be purchased
between years 2 and 3 of the project, after preliminary engineering and property negotiations are complete. These costs have been included
in the assessment based on an assumed purchase price of US$5,000 per acre plus 20% for property acquisition related fees (US$6,000 Total/Acre)
as described below in Table 21-22.
Table 21-22.
Well facilities and central processing plant land costs
| Description | |
Quantity | | |
Unit | | |
Units
Cost US$ | | |
Total Cost US$ | |
| Supply Well Facilities (5 @ 16.73 Acres Each) | |
| 83.62 | | |
| Acres | | |
$ | 6,000 | | |
$ | 501,739 | |
| Injection Well Facilities (5 @ 16.63 Acres Each) | |
| 83.16 | | |
| Acres | | |
$ | 6,000 | | |
$ | 498,967 | |
| Central Processing Facility | |
| 57.00 | | |
| Acres | | |
$ | 6,000 | | |
$ | 342,000 | |
| Total | |
| 223.78 | | |
| Acres | | |
| - | | |
$ | 1,342,706 | |
| Standard Lithium Ltd. SW Arkansas Lithium Project PEA | Page 170 |
| 21.2.4.2.2. | Pipeline
Right-of-Way |
Approximately 38
km (24 miles) of Right-of-Way (ROW) will be required for the pipelines detailed in Sections 18.1.2 and 18.3.2. It is assumed that the
ROW’s will be purchased between years 2 and 3 of the project, after preliminary engineering and property negotiations are complete.
The assessment includes an average cost of $189,819 per km ($118,637 per mile) of ROW which includes the ROW and labor/acquisition related
costs as described below in Table 21-23. No financing fees are included in the assessment at this time for the land costs associated
with the well facilities.
Table 21-23.
Pipeline right-of-way land costs
| Description | |
Quantity | | |
Unit | | |
Units Cost US$ | | |
Total Cost US$ | |
| Brine Supply & Sour Gas Pipelines | |
| 11.41 | | |
Mile | | |
$ | 118,637 | | |
$ | 1,353,835 | |
| Barren Brine (Injection) Pipelines | |
| 12.58 | | |
Mile | | |
$ | 118,637 | | |
$ | 1,492,659 | |
| Total | |
| 23.99 | | |
Mile | | |
| - | | |
$ | 2,846,494 | |
Annual operating
cost summary is given in Table 21-24.
| Standard Lithium Ltd. SW Arkansas Lithium Project PEA | Page 171 |
Table
21-24. Annual OPEX summary
| Description | |
Total Average
Annual Cost US$ | | |
Total Average Cost US$
per Tonne LHM | |
| Direct Operational Expenditures | |
| | | |
| | |
| - Manpower | |
$ | 5,710,000 | | |
$ | 190 | |
| - Electrical Power | |
$ | 11,347,697 | | |
$ | 378 | |
| - Reagents & Consumables | |
$ | 25,087,529 | | |
$ | 836 | |
| - Water | |
$ | 0 | | |
$ | 0 | |
| - Natural Gas | |
$ | 1,183,624 | | |
$ | 39 | |
| - Maintenance | |
$ | 15,964,970 | | |
$ | 532 | |
| - Solids Disposal | |
$ | 34,500 | | |
$ | 1 | |
| - Miscellaneous Costs | |
$ | 889,925 | | |
$ | 30 | |
| Sub-Total | |
$ | 60,218,244 | | |
$ | 2,007 | |
| Indirect Operational Expenditures | |
| | | |
| | |
| - Insurance | |
$ | 2,659,377 | | |
$ | 89 | |
| - Sales Marketing & Customers Relations | |
$ | 90,327 | | |
$ | 3 | |
| - Plant Optimizations & Development | |
$ | 150,546 | | |
$ | 5 | |
| - Environmental Monitoring | |
$ | 301,091 | | |
$ | 10 | |
| - Community Benefits | |
$ | 6,022 | | |
$ | 0 | |
| - Mine Closure Fund | |
$ | 84,718 | | |
$ | 3 | |
| Sub-Total | |
$ | 3,292,081 | | |
$ | 110 | |
| Royalties & Land Fees | |
| | | |
| | |
| - Royalties (per TETRA Contract) | |
$ | 14,251,902 | | |
$ | 475 | |
| - Land Costs | |
$ | 209,460 | | |
$ | 7 | |
|
(Total $ Divided by Life of Plant) | |
| | | |
| | |
| Sub-Total | |
$ | 14,461,362 | | |
$ | 482 | |
| Total | |
$ | 77,971,687 | | |
$ | 2,599 | |
Note: All-in OPEX per one metric tonne
of production is US$2,599.
| Standard Lithium Ltd. SW Arkansas Lithium Project PEA | Page 172 |
22 Economic Analysis
This economic analysis
for the SWA Project was prepared using a discounted cash flow economic model, showing both, pre- and post-tax results, to evaluate the
project. CAPEX and OPEX expenditures presented in Section 21 have been used in this analysis. The model includes all taxes, government
and commercial royalties/ payments, and community engagement contributions. The results include net present value (NPV) for an 8% discount
rate, internal rate of return (IRR), and sensitivity analysis of key inputs.
The economic analysis
for the SWA Project is preliminary in nature and includes inferred mineral resources that are considered too speculative geologically
to have the economic considerations applied to them that would enable them to be categorized as mineral reserves and there is no certainty
that this economic analysis will be realized.
22.1 Evaluation Criteria
The following criteria
have been used to develop the economic model:
| § | CAPEX:
Capital investment for the 30,000 tonnes per year of battery grade LHM, including equipment,
materials, indirect costs, and contingencies at 25%, is estimated to be US$869.97 Million.
This total excludes interest expenses that might be capitalized during the same period. |
| § | OPEX:
The annual operating cost for the SWA Project is estimated at US$63.5 Million in 2021
(Direct Operational Expenditures escalated 2% annually). This figure includes manpower, electrical
power, reagents and consumables, natural gas, maintenance, solids disposal, miscellaneous
costs, insurance, sales and customers relations, plant optimizations and development, environmental
monitoring, community benefits, and mine closure fund. Eighty percent (80%) of the OPEX costs
are derived from three (3) of OPEX cost categories as shown below. |
| - | Reagents &
Consumables – 40% |
The remaining
components of the operating costs have significantly lower impact on the overall economics.
| § | Cash
Flow: Cash flow will reach 100% in 2025 after start of operations. |
| § | Construction:
Total construction time of the project starting first with the wellfield is estimated
at 30 months (2.5 years). The construction time of the most significant cost item, the CPF,
is estimated at 18 months (1.5 years). |
| § | Operating
Life: The plant is expected to operate for a period of no less than 20 years from the
start of production. |
| § | Commodity
Pricing: Pricing for battery grade LHM is as per conclusions in Section 19 assumed
at a price of US$14,500/tonne in 2021 with an annual escalation rate of 2% leading to an
average price of US$19,068/tonne during the operating life of the SWA Project. |
| § | Discounted
Cash Flow (DCF): The DCF economic evaluation escalates the product price as well as the
operating costs by 2% yearly in order to reflect inflation. |
| § | Equity
Basis: It has been assumed that 100% of capital expenditures, including pre-production
expenses, are financed with Owners’ equity for the purposes of the project DCF evaluation. |
| § | Pre-Construction
Expenses: Pre-construction expenses are treated as sunk costs and not included in the
DCF analysis. |
| Standard Lithium Ltd. SW Arkansas Lithium Project PEA | Page 173 |
22.2 Taxes & Royalties
The following royalties
and taxes have been applied to the economic analysis of the SWA Project.
22.2.1 Royalties and Lease Fees
Yearly royalty
payments of 2.5% of gross revenue are considered which accumulates to royalty payments of US$285.0 Million over the 20 years of operating
life. Additional fees for brine lease, land lease, and Rights of Ways accumulate to US$8.2 MM.
22.2.2 Depreciation
A yearly depreciation
of 5% (facility evenly depreciated over 20 years of operating life) is used for this analysis.
22.2.3 Corporate Taxes
The US Federal
Corporate Income Tax (CIT) rate of 21%, and the State Arkansas CIT rate of 5.9%, are used for this analysis.
22.3 CAPEX Spending Schedule
The economic model
assumes that capital investment disbursements will be spread over 30 months (2.5 years).
Full production
of LHM will start at the end of start-up and commissioning at a rate of 30,666 tonnes per year and will continue at that rate until year
15 of production when it is expected to decrease to 28,000 tonnes per year. This equates to an average LHM production of approximately
30,000 tonnes per year over the 20-year operating life of the SWA Project.
22.4 Production Revenues
Production revenues
have been estimated based on the price scenario for a LHM product, as identified in Section 19.
22.5 Cash-Flow Projection
Table 22-1 summarizes
the Discounted Cash Flow (DCF) for the assumed Base Case (Case 1) price and production level scenario.
| Standard Lithium Ltd. SW Arkansas Lithium Project PEA | Page 174 |
Table
22-1. Annual operating cost summary
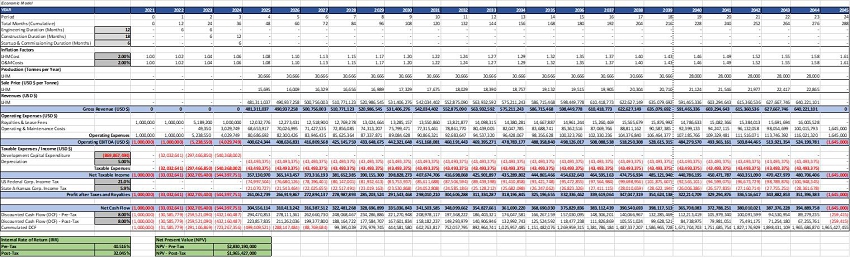
| Standard Lithium Ltd. SW Arkansas Lithium Project PEA | Page 175 |
22.6 Economic Evaluation Results
The project economics
resulting from the assumed price scenario at full production, which was used in the economic model, are presented in Table 22-2. Values
of NPV were also calculated for a discount rate of 8%.
Table 22-2. Economic
Evaluation – Case 1 (Base Case) Summary
| Overview | |
Units | |
Values | | |
Comments |
| Production | |
Tonnes / Year | |
| 30,666 to 28,000 | | |
Average annual production over the modelled life of the project is 30,000 TPA. |
| Plant Operation | |
Years | |
| 20 | | |
|
| Capital Cost (CAPEX) | |
US$ | |
| 869,867,494 | | |
|
| Average Annual Operating Cost (OPEX) | |
US$ | |
| 83,405,480 | | |
US$ 63,510,324 in 2021 (escalated by 2% annually). |
| Average Selling Price over the duration of the project | |
US$ / Tonne | |
| 19,068 | | |
US$ 14,500 in 2021 (escalated by 2% annually). |
| Average Annual Revenue | |
US$ | |
| 570,076,090 | | |
2% LHM price inflation rate is included in the model revenue projections. |
| Discount Rate | |
% | |
| 8 | | |
|
Net Present Value (NPV)
Post-Tax | |
US$ | |
| 1,965,427,000 | | |
|
Net Present Value (NPV)
Pre-Tax | |
US$ | |
| 2,830,190,000 | | |
|
Internal Rate of Return (IRR)
Post-Tax | |
% | |
| 32.045 | | |
|
Internal Rate of Return (IRR)
Pre-Tax | |
% | |
| 40.516 | | |
|
22.7 Sensitivity Analysis
A sensitivity analysis
methodology, using one-factor-at-a-time (OAT), involves changing one input variable, keeping others at their baseline (nominal) values,
and then returning the variable to its nominal value. This is repeated for each of the other inputs in the same way.
OAT sensitivity
analysis of the project key variables (CAPEX, OPEX, Selling Price changing +/- 20%) was conducted to illustrate the impact of changes
on the corresponding values of NPV and IRR.
The results of
the sensitivity analysis, at an 8% discount rate, are presented in Table 22-3 to Table 22-5, and Figures 22-1 to 22-4.
Sensitivity of
NPV and IRR to the CAPEX increase and decrease by 20% from the Base Case, is shown in Table 22-3. It must be noted that some of the OPEX
items are percentages of the CAPEX. However, for the sensitivity of the CAPEX variation, the OPEX has been kept at their baseline (nominal)
values.
| Standard Lithium Ltd. SW Arkansas Lithium Project PEA | Page 176 |
Table 22-3. Sensitivity analysis to CAPEX
variation
| Overview |
|
Case
1
Base Case (US$) |
|
|
Case
2
CAPEX – 20% (US$) |
|
|
Case
3
CAPEX + 20% (US$) |
|
| Capital Cost (CAPEX) |
|
|
869,867,494 |
|
|
|
695,893,995 |
|
|
|
1,043,840,992 |
|
| Net Present Value (NPV) Post-Tax |
|
|
1,965,427,000 |
|
|
|
2,089,920,000 |
|
|
|
1,840,935,000 |
|
| Net Present Value (NPV) Pre-Tax |
|
|
2,830,190,000 |
|
|
|
2,972,920,000 |
|
|
|
2,687,460,000 |
|
| Internal Rate of Return (IRR) Post-Tax |
|
|
32.05 |
% |
|
|
38.39 |
% |
|
|
27.55 |
% |
| Internal Rate of Return (IRR) Pre-Tax |
|
|
40.52 |
% |
|
|
48.56 |
% |
|
|
34.81 |
% |
Sensitivity of NPV and IRR to the OPEX increase
and decrease by 20% from the Base Case, is shown in Table 22-4.
Table 22-4. Sensitivity analysis to OPEX
variation
| Overview | |
Case
1
Base Case (US$) | | |
Case
2
OPEX – 20% (US$) | | |
Case
3
OPEX + 20% (US$) | |
| Average Operating Cost (OPEX) | |
| 83,405,480 | | |
| 66,724,384 | | |
| 100,086,576 | |
| Net Present Value (NPV) Post-Tax | |
| 1,965,427,000 | | |
| 2,056,430,000 | | |
| 1,874,425,000 | |
| Net Present Value (NPV) Pre-Tax | |
| 2,830,190,000 | | |
| 2,954,481,000 | | |
| 2,705,899,000 | |
| Internal Rate of Return (IRR) Post-Tax | |
| 32.05 | % | |
| 32.97 | % | |
| 31.11 | % |
| Internal Rate of Return (IRR) Pre-Tax | |
| 40.52 | % | |
| 41.69 | % | |
| 39.33 | % |
Sensitivity of NPV and IRR to the products selling
price increase and decrease by 20% from the Base Case, is shown in Table 22-5.
Table 22-5. Sensitivity analysis to product
price variation
| Overview | |
Case
1
Base Case (US$) | | |
Case
2
Revenue – 20% (US$) | | |
Case
3
Revenue + 20% (US$) | |
| Average Selling Price US$/Tonne
LHM over lifetime of project | |
| 19,068 | | |
| 15,254 | | |
| 22,882 | |
| Net Present Value (NPV) Post-Tax | |
| 1,965,427,000 | | |
| 1,355,413,000 | | |
| 2,575,442,000 | |
| Net Present Value (NPV) Pre-Tax | |
| 2,830,190,000 | | |
| 1,995,697,000 | | |
| 3,664,683,000 | |
| Internal Rate of Return (IRR) Post-Tax | |
| 32.05 | % | |
| 25.58 | % | |
| 38.12 | % |
| Internal Rate of Return (IRR) Pre-Tax | |
| 40.52 | % | |
| 32.31 | % | |
| 48.22 | % |
Sensitivity of Post-Tax NPV to the changes in
the CAPEX, OPEX, and Selling Price by +/-20% is illustrated in Figure 22-1.
| Standard Lithium Ltd. SW Arkansas Lithium Project PEA | Page 177 |
Figure 22-1. Net present value post tax sensitivity
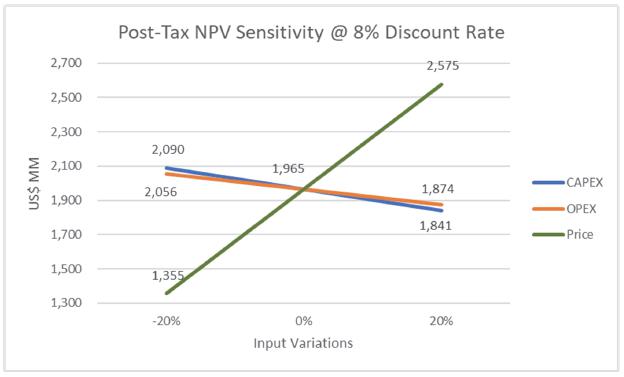
Sensitivity of Pre-Tax NPV to the changes in
the CAPEX, OPEX, and Selling Price by +/-20% is illustrated in Figure 22-2.
Figure 22-2. Net present value pre-tax sensitivity
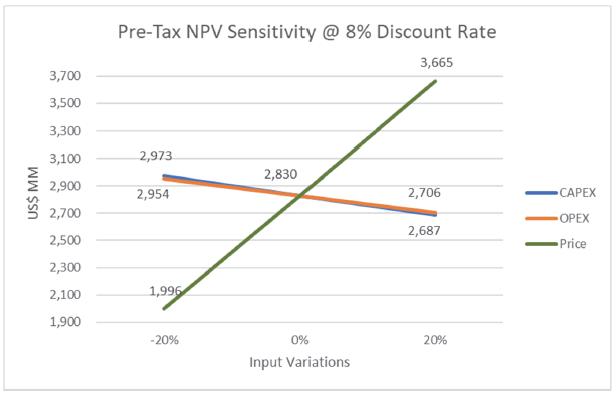
Sensitivity of Post-Tax IRR to the changes in
the CAPEX, OPEX, and Selling Price by +/-20% is illustrated in Figure 22-3.
| Standard Lithium Ltd. SW Arkansas Lithium Project PEA | Page 178 |
Figure 22-3. Internal rate of return post-tax
sensitivity
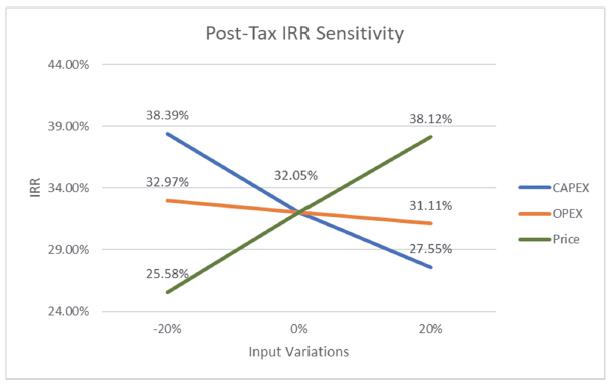
Sensitivity of Pre-Tax IRR to the changes in
the CAPEX, OPEX, and Selling Price by +/-20% is illustrated in Figure 22-4.
Figure 22-4. Internal rate of return pre-tax
sensitivity
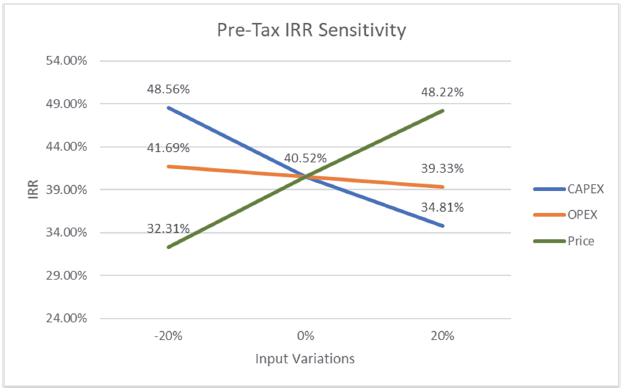
The OAT sensitivity analysis indicates that the
project is as follows:
| § | Very
sensitive to the product selling price variation. |
| § | Moderately
sensitive to the OPEX variation. |
| § | Very
sensitive to the CAPEX variation. |
The SWA Project is shown to be less sensitive
to variations in OPEX than to variations in CAPEX and product price when measuring IRR.
| Standard Lithium Ltd. SW Arkansas Lithium Project PEA | Page 179 |
| 22.8 | Conclusions and Sensitivity Analysis |
The SWA Project’s economics resulting from
the assumed price scenario used in the economic model is presented in Table 22-1. A sensitivity analysis was conducted to illustrate
the impact of +/-20% changes in key variables on the project’s NPV and IRR (Table 22-3 to Table 22-5).
| · | SWA
Project economics is very sensitive to the variations in the product selling price. A change
in selling price by +/-20% changes the value of the Post-Tax NPV by approximately +/-10%
and the value of IRR by approximately +/-6%. |
| · | The
SWA Project is relatively insensitive to variations in the OPEX. A change in the OPEX by
+/-20% changes the value of the Post-Tax NPV by approximately +/-4.5% and the value of IRR
by approximately +/-1%. Improvements made to process efficiency, particularly the reduction
of reagents and chemicals consumption, will improve the economics of the project. |
| · | The
SWA Project economics is very sensitive to the increase or decrease of CAPEX. A change
in the CAPEX by +/-20% changes the value of the Post-Tax NPV by approximately +/-6.5% and
the value of IRR by approximately +/-5.0%. |
This preliminary economic assessment is preliminary
in nature and includes inferred mineral resources that are considered too speculative geologically to have the economic considerations
applied to them that would enable them to be categorized as mineral reserves and there is no certainty that this economic assessment
will be realized. In conducting this economic assessment the authors have relied upon a number of qualifications, assumptions and estimates,
the basis of which are described above.
| Standard Lithium Ltd. SW Arkansas Lithium Project PEA | Page 180 |
There are two major bromine producers in Arkansas:
LANXESS and Albemarle Corporation (Figure 6-2). LANXESS has its Arkansas headquarters in El Dorado, Arkansas. Albemarle has Arkansas
headquarters at the center of its property in Magnolia, Arkansas. The Albemarle property adjoins the eastern SWA Project boundary and
LANXESS western property boundary is approximately 40 km (25 miles) further to the east.
Albemarle Corporation and subsidiaries own and
operate two brine processing plants near the City of Magnolia in Columbia County (Albemarle Corporation, 2011). The plants are two of
the world's largest suppliers of bromine and bromine chemicals. Albemarle's Magnolia North and South plants are fed by a network of brine
production wells in Columbia County.
The LANXESS property is sub-divided into three
contiguous ‘units’ based on the three (3) unitised areas of shared bromine operation: South, Central and West unit areas.
LANXESS-owned infrastructure includes:
| · | Three
(3) Bromine plants (1/unit area), all of which are in operation and producing bromine; |
| · | 400
km of pipelines (250 miles); and |
| · | 61
brine supply and reinjection wells. |
According to brine production records maintained
by the AOGC, LANXESS processed 660 million barrels (105 million m3) of brine from the Smackover Formation at the LANXESS property
to produce bromine and bromine-related chemicals between January 2013 and March 2018. The LANXESS property has been extracting
brine and producing bromine continuously since 1957 (NI 43-101 Technical Report – Preliminary Economic Assessment of LANXESS Smackover
Project, dated August 1, 2019).
Albemarle and LANXESS produce bromine-brine for
use/sale in flame retardants, inorganic bromides, agricultural intermediates, tertiary amines, drilling fluids and water treatment.
It is understood from public filings that TETRA
and other project developers have entered into extraneous brine leasing agreements with other mineral rights owners separate from the
leases that form the basis of this PEA. This PEA does not contemplate any development from, or impact to, those extraneous leases, except
for where they may be integrated as part of the contemplated future unitisation process.
The authors have not verified the information
associated with adjacent properties, and the information associated with these adjacent properties may not be indicative of mineralization
that may exist on, or the potential for similar development at, the SWA Project.
| Standard Lithium Ltd. SW Arkansas Lithium Project PEA | Page 181 |
| 24 | Other
Relevant Data and Information |
There are no other relevant data pertinent to
the proposed project.
| Standard Lithium Ltd. SW Arkansas Lithium Project PEA | Page 182 |
| 25 | Interpretation
and Conclusions |
| 25.1 | Opinion
on Standard Lithium’s Exploration Work |
The exploration conducted by Standard Lithium
at the SWA Project, and/or exploration components commissioned to the QP (Roy Eccles) by Standard Lithium, are in-line with defining
reasonable prospects of economic extraction and completing a mineral resource estimate.
Roy Eccles P. Geol. was involved in the brine
sampling, aquifer characterization and hydrogeology aspects of Standard Lithium’s 2018 exploration work. The author coordinated
discussion and meetings involving methodologies and interpretation resulting from the exploration work to define the geometry and hydrogeological
characterization of the Upper and Middle Smackover formations aquifer and form the basis of the resource model.
The author of the relevant sections acknowledges
that the data interpreted in this PEA have been used by the appropriate QP personnel and in a fashion that extracts the best possible
3D-model and hydrogeological characterization of the Upper and Middle Smackover formations aquifer. To conclude, the author, Roy Eccles
has found no significant issues or inconsistencies that would cause one to question the validity of the lithium-brine concentration,
subsurface geology definition and aquifer characterization results that are presented in this PEA.
| 25.2 | SWA Property Preliminary Economic
Assessment Summary |
The updated 2021 SWA Project lithium-brine resource
estimate is classified as ‘inferred’ according to the CIM definition standards. The project is an early-stage exploration
project and will require further exploration and test work to elevate the resource to a higher classification level.
An objective of
this PEA was to update the 2019 maiden Inferred Resource estimate, which applied a net acreage and brine ownership percentages
of between 73% and 79% to the estimation process. The updated 2021 Inferred Resource estimate applies a gross acreage of 14,638 gross
mineral hectares (36,172 gross mineral acres) with 100% brine ownership that is consistent with unitisation.
It is the opinion of the QP, Roy Eccles P.Geol.
that proposed unitisation of the SWA Property provides reasonable justification to update the mineral resource. Unitisation within the
Arkansas Brine Statute provides the most efficient pathway for the production process by protecting the production rights of the brine
operator and the correlative rights of mineral interest owners. Standard Lithium’s legal counsel has provided an opinion letter
that it is Standard Lithium’s intent to implement the unitisation process for the SWA Property at the appropriate time.
The total resource in Table 14-14 includes the
breakdown of how the resource was calculated by area (i.e., North and South resource areas) and by Formation (i.e., Upper and Middle
Smackover formations). The information shows that the:
| · | Upper
Smackover Formation in the South resource area contains the highest amount of LCE (596,000
tonnes; 657,000 tons), or almost double the next sub-resource area, which include from highest
to lowest LCE; |
| · | Upper
Smackover Formation - North resource area (354,000 tonnes LCE; 391,000 tons LCE); |
| · | Middle
Smackover Formation - South resource area (152,000 tonnes LCE; 167,000 tons LCE); and finally,
the |
| · | Middle
Smackover Formation - North resource area (93,000 tonnes LCE; 103,000 tons LCE). |
| Standard Lithium Ltd. SW Arkansas Lithium Project PEA | Page 183 |
| 25.3 | Risks and Uncertainties |
| 25.3.1 | Assumption in the Resource Model
and Estimation Process |
Historical lithium
concentrations and the 2018 brine samples that were collected by Standard Lithium are from the Upper Smackover Formation. We assume the
lithium concentration is the same for both the Upper and Middle Smackover formations as both formations are hydrogeologically connected.
Additional brine sampling studies are required throughout the North and South resource areas. It is expected that geochemical
variations could influence the North and South area boundaries and the overall estimation of lithium-brine resources at the SWA Property.
The thickness of
the Middle Smackover Formation is based on limited data because the petro-companies have historically focussed on the Upper Smackover
Formation. Consequently, we have applied a Middle Smackover Formation unit thickness of 12 m (40 feet) across the SWA Property, which
is based on pick information from nine wells.
In all likelihood,
the actual thickness of the Middle Smackover Formation is dependent on numerous factors in a Jurassic-aged carbonate shelf environment.
Additional core analysis, drilling and/or seismic studies are required in areas where there are gaps in the geological data model,
and it is expected that variations in the thickness of the Middle Smackover Formation would increase or decrease the overall volume in
comparison to the estimate provided in this Technical Report.
| 25.3.2 | Risk Assessment Summary |
A risk analysis meeting was held with key members
of the project team to assess initial and residual risk in the brine supply and lithium processes proposed for the SWA Project. The results
of this discussion are presented in Table 25-1. The risks were evaluated before and after a risk treatment plan. The level of risk indicates
whether a small or large change to the assumptions used in this PEA would result in a serious consequence to the Project’s execution.
| Standard Lithium Ltd. SW Arkansas Lithium Project PEA | Page 184 |
Table 25-1. Risk Assessment Matrix
Risk
No. |
Risk
Description |
Existing
Controls |
Initial
Risk
(after
Existing
Controls) |
Risk
Treatment Plan |
Residual
Risk |
| 1 |
Brine
production of 1,800 m3/h and/or lithium concentration of 399 mg/L not available. Includes associated drilling risk. |
A
geological assessment, in addition to testing existing brine supply wells |
Medium |
Additional
testing of existing and new brine supply wells is planned. |
Low |
| 2 |
If
innovative lithium extraction process does not perform as expected, could result in higher OPEX and CAPEX. |
Extended
pilot tests completed. |
Low |
Continued
operation and process optimization of Demonstration Plant operation.
This will also not be the first commercial plant of this type |
Low |
| 3 |
If
electrochemical and associated Lithium Hydroxide conversion process does not perform as expected, it could result in higher OPEX
and CAPEX. |
Based
on existing chloralkali industry technology and specific experience with Lithium solutions. |
Medium |
Long-term
membrane testing with representative enriched LiCl solution planned, as well as pilot testing of commercial-scale electrochemical
cells. |
Low |
| 4 |
If
market price of LHM drops, project economics will be negatively affected. |
Demand
is increasing faster than supply is coming to the market. Sensitivity analysis shows favourable
economics even for significantly lower Lithium Hydroxide price. |
High |
To
evaluate alternate contracts with vendors to mitigate short term price decline. |
High |
| 5 |
Global
supply chain shortages / delays could influence schedule and CAPEX |
Understanding
long-lead items that would be impacted by supply chain constraints |
Medium |
A
mitigating action plan will be put in place to minimize supply chain risk. |
Low |
| 6 |
If
natural disaster occurs (e.g., tornado, earthquake), could result in loss of production. |
Understanding
of current risks at plant location. |
Medium |
Engineering
of the plant will take into account weather risks.
Provide shelter for personnel. Design critical facilities to withstand
moderate tornados and earthquakes. Carry special insurance. |
Low |
| 7 |
If
unknown infringement of sorbent and process patents occurs, could result in licensing claims. |
Conducted
freedom to operate searches. |
Medium |
Continue
patent research. Ensure contingency funds in place to cover licensing fees. |
Low |
| 8 |
Construction
cost/schedule overruns |
25%
contingency included in current economics.
Sensitivity analysis shows favourable economics even for higher
CAPEX |
Medium |
Work
with experienced EPC contractor; lump-sum turnkey where possible.
PFS will provide improved cost confidence.
|
Low |
| 9 |
Lithium
brine royalty assessment by the Arkansas Oil and Gas Commission is not completed in a timely manner and/or the royalty rates overly
impact project economics. |
Established
process completed for bromine and most recently for calcium chloride and magnesium chloride |
Medium |
Work
with experienced and qualified team and engage stakeholders early in the process. |
Low |
| Standard Lithium Ltd. SW Arkansas Lithium Project PEA | Page 185 |
As with any development project there exists
potential risks and uncertainties. Standard Lithium will attempt to reduce risk/uncertainty through effective project management, engaging
technical experts and developing contingency plans.
As per the CIM guidelines for lithium-brine,
and when reporting higher level of resource classification than reported in this PEA (i.e., Indicated and Measured Brine Resources),
the QP’s must consider only those resources that are, or may become, recoverable under reasonably assumed technical and economic
conditions. The logical next steps and work recommendations for Standard Lithium to elevate the SWA Project to a higher level of resource
classification and project definition is to:
| 1. | Collect additional brine samples from
the Upper and Middle Smackover Formations either from existing wells on the Property, or
recomplete existing/abandoned wells or install new wells (US$1.5mm); |
| 2. | Analyse available Smackover Formation
core at several locations from the Arkansas Geological Survey at 0.3 m intervals throughout
the Upper and Middle Smackover Formations to assess porosity and permeability (US$0.1mm); |
| 3. | Perform long-duration pumping tests to
confirm aquifer properties (US$0.9mm); |
| 4. | Complete reservoir and resource modelling
(US$0.75mm); |
| 5. | Continue with ongoing direct lithium
extraction pre-commercial demonstration using brines from the SWA Project (US$0.75mm); |
| 6. | Conduct lithium chloride to lithium hydroxide
conversion at suitable scale (US$1.0mm); |
| 7. | Complete additional permitting and environmental
studies where appropriate (US$0.5mm); and, |
| 8. | Conduct all additional necessary engineering
and pre-feasibility studies to integrate the project development findings into an updated
resource classification and PFS (US$1.5mm). |
The authors recommend Standard Lithium approaches
accomplishing these tasks over a two-year period. The total estimated cost of the recommended work including contingency is US$7,000,000.
| Standard Lithium Ltd. SW Arkansas Lithium Project PEA | Page 186 |
Ahr, W. M. (1973): The carbonate
ramp – an alternative to the shelf model. Gulf Coast Association of Geological Societies Transactions, v. 23, p. 221–225.
Albemarle Corporation (2011):
Albemarle Corporation Announces Discovery in Lithium Carbonate Production; Albemarle Corporation News Release, April 29, 2011,
< Available on 5 July 2018 at: https://www.prnewswire.com/news-releases/albemarle-corporation-announces-discovery-in-Lithium-Carbonate-production-120969289.html
>.
Alkin, R.H. and Graves, R.W. (1969):
Reynolds oolite of southern Arkansas; The American Association of Petroleum Geologists, Bulletin v. 53, no. 9, p. 1909-1922.
Arkansas Code (2016a): §
15-76-308. Formation of a Brine Unit; Title 15 – Natural Resources and Economic Development, Subtitle 6 – Oil,
Gas and Brine, Chapter 76 – Brine, Subchapter 3 – Brine Production, < Available on 9 July 2018 at: https://law.justia.com/codes/arkansas/2016/title-15/subtitle-6/chapter-76/subchapter-3/section-15-76-308/
>.
Arkansas Code (2016b): §
15-76-309. Petition for formation of a brine production unit or a brine expansion unit; Title 15 – Natural Resources
and Economic Development, Subtitle 6 – Oil, Gas and Brine, Chapter 76 – Brine, Subchapter 3 – Brine Production,
< Available on 9 July 2018 at: https://law.justia.com/codes/arkansas/2016/title-15/subtitle-6/chapter-76/subchapter-3/section-15-76-309/
>.
Arkansas Code (2016c): §
15-76-312. Unlawful drainage -- Unit inclusion or accounting; Title 15 – Natural Resources and Economic Development, Subtitle
6 – Oil, Gas and Brine, Chapter 76 – Brine, Subchapter 3 – Brine Production, < Available on 9 July 2018 at:
https://law.justia.com/codes/arkansas/2016/title-15/subtitle-6/chapter-76/subchapter-3/section-15-76-312/ >.
Arkansas Code (2016d): §
15-76-314. Participation by owners and royalties; Title 15 – Natural Resources and Economic Development, Subtitle 6
– Oil, Gas and Brine, Chapter 76 – Brine, Subchapter 3 – Brine Production, < Available on 9 July 2018 at: https://law.justia.com/codes/arkansas/2016/title-15/subtitle-6/chapter-76/subchapter-3/section-15-76-314/
>.
Arkansas Code (2016e): §
15-76-315. Valuation of brine; Title 15 – Natural Resources and Economic Development, Subtitle 6 – Oil, Gas and
Brine, Chapter 76 – Brine, Subchapter 3 – Brine Production, < Available on 9 July 2018 at: https://law.justia.com/codes/arkansas/2016/title-15/subtitle-6/chapter-76/subchapter-3/section-15-76-315/
>.
Arkansas Code (2016f): §
15-76-318. Drilling permits – fees; Title 15 – Natural Resources and Economic Development, Subtitle 6 –
Oil, Gas and Brine, Chapter 76 – Brine, Subchapter 3 – Brine Production, < Available on 9 July 2018 at: https://law.justia.com/codes/arkansas/2016/title-15/subtitle-6/chapter-76/subchapter-3/section-15-76-318/
>.
| Standard Lithium Ltd. SW Arkansas Lithium Project PEA | Page 187 |
AGC (1950): Arkansas Geological Commission
Information Circular 14: Petroleum Geology of the Smackover Formation of Southern Arkansas, 1950.
Arkansas Geological Survey
(2018): Brine Resources; Arkansas Geological Survey, < Available on 14 July 2018 at: http://www.geology.ar.gov/energy/brine_resources.htm
>.
Arkansas Oil and Gas Commission (2016).
Annual Report of Production 2016. http://www.aogc.state.ar.us/annual/default.aspx
Barrera, P. (2021): Lithium
Outlook 2021: Analysts positive on pricing, more balanced market ahead; Investing News, January 7th, 2021; <
Available on 8 April 2021 at: https://investingnews.com/daily/resource-investing/battery-metals-investing/Lithium-investing/Lithium-outlook/
>.
Baria, L. R., Stoudt, D. L., Harris,
P. M. and Crevello, P. D. (1982): Upper Jurassic reefs of Smackover Formation, United States Gulf Coast. American Association of Petroleum
Geologists Bulletin, v. 66, p. 1449–1482.
Baldwin, O. D., and Adams, J. A.
S. (1971): KI0/Arl0 ages of the alkalic igneous rocks of the Balcones fault trend of Texas: Texas Journal of Science, v.
22, no. 2 & 3, p. 223-231.
Benchmark Mineral Intelligence (2017):
Into the Light: Lithium ion battery supply chain in 2018; Benchmark Mineral Intelligence, 17 Bank of America Merrill Lynch, 17 January 2018,
New York, 34 p.
Benchmark Mineral Intelligence (2018a):
Lithium Price Assessment, March 2018 Review; Benchmark Mineral Intelligence, 7 p.
Benchmark Mineral Intelligence (2018b):
Benchmark Mineral Price Assessment – Subscription Guide: Lithium; Benchmark Mineral Intelligence, H1 2018, 7 p.
Benson, D.J. (1988): Depositional
history of the Smackover Formation in southwest Alabama: Gulf Coast Association of Geological Societies Transactions, v. 38, p. 197-205.
Benson, T.R., Coble, M.A., Rutyba,
J.J. and Mahood, G.A. (2017): Lithium enrichment in intracontinental rhyolite magmas leads to Lithium deposits in caldera basins; Nature
Communications, v. 8, no. 270, p. 1–9.
Bishop, W.F. (1967): Age of pre-Smackover
Formations, North Louisiana and South Arkansas; AAPG Bulletin v. 51, p. 244-250.
Bishop, W. F. (1968): Petrology of
upper Smackover limestone in North Haynesville field, Claiborne Parish, Louisiana. American Association of Petroleum Geologists Bulletin,
v. 52, p. 92–128.
Bishop, W. F. (1971a): Geology of
a Smackover stratigraphic trap. American Association of Petroleum Geologists Bulletin, v. 55, p. 51–63.
Bishop, W. F. (1971b): Geology of
upper member of Buckner Formation, Haynesville Field area, Claiborne Parish, Louisiana. American Association of Petroleum Geologists
Bulletin, v. 55, p. 566–580.
| Standard Lithium Ltd. SW Arkansas Lithium Project PEA | Page 188 |
Bishop, W. F. (1973): Late Jurassic
contemporaneous faults in north Louisiana and south Arkansas. American Association of Petroleum Geologists Bulletin, v. 57, p. 566–580.
Blondes, M.S., Gans, K.D.,
Rowan, E.L., Thordsen, J.J., Reidy, M.E., Engle, M.A., Kharaka, Y.K. and Thomas B. (2016): U.S. Geological Survey National Produced
Waters Geochemical Database v2.2 (PROVISIONAL) Documentation; USGS Energy Resources Program: Produced Waters, 16 Feb 2016, <
Available on 14 July 2018 at: https://archive.org/stream/USGSProducedWatersV2.2c/USGS%20Produced%20Waters%20Database%20v2.2%20Documentation_djvu.txt
>.
Bradley, D., Munk, L., Jochens, H.,
Hynek, S. and Labay, K (2006): A Preliminary Deposit Model for Lithium Brines; USGS Open-File Report 2013–1006, 9 p.
Bradley, D.C., Stillings, L.L., Jaskulka,
B.W., Munk, L. and McCauley, A.D. (2017): Lithium; In: Chapter K of Critical Mineral Resources of the United States—Economic and
Environmental Geology and Prospects for Future Supply, K.J. Schulz, J.H. DeYoung, Jr., R.R. Seal II, and D.C. Bradley (Eds.), USGS
Professional Paper 1802-K, 21 p.
Budd, D. A. and Loucks, R. G. (1981):
Smackover and lower Buckner formations, south Texas. Depositional systems on a carbonate ramp. Bureau of Economic Geology, The University
of Texas at Austin, Report of Investigations, 112 p.
Buffler, R.T. (1991): Early evolution
of the Gulf of Mexico basin; In: D. Goldthwaite, (ed.), An Introduction to Central Gulf Coast Geology, New Orleans: New Orleans
Geological Society, p. 1-15.
Buffler, R.T., Shaub, F.J., Huerta,
R., Ibrahim, A.B.K. and Watkins, J.S. (1981): A model for the early evolution of the Gulf of Mexico; Oceanologica Acta, No. SP,
p 129-136.
Burga, E., Burga, D., Rosko, M.,
King, M., Abbey, D., Sanford, R., Smee, B. and Leblanc, R. (2018): NI 43 – 101 Technical Report, Updated Feasibility Study: Reserve
estimation and Lithium Carbonate production at the Cauchari-Olaroz Salars, Jujuy Province, Argentina; Technical Report prepared for Lithium
Americas, Effective Date: 29 March 2017 and Filing Date: 15 January 2018, Available at www.sedar.com.
Cabot Corporation (2014): Section A4
Viscosity of Formation Brines; In: Formate Technical Manual, Chemical and Physical Properties, 17 p. < Available on 24 February 2019
at: http://www.cabotcorp.com/solutions/products-plus/cesium-formate-brines/formate-technical-manual >.
Centre for Computational Geostatistics
(2016): Pygeostat. Edmonton AB: Centre for Computational Geostatistics. Retrieved from http://www.ccgalberta.com.
Chimene, C. A. (1991): Walker Creek
field. In: Foster, N. H. and Beaumont, E. A. (eds) Stratigraphic Traps II. Treatise of Petroleum Geology, Atlas of Oil and Gas
Fields. American Association of Petroleum Geologists, p. 55–116.
Chuchla, R.J. (In Preparation, 2018):
Some ideas regarding the controls on Lithium concentration in Smackover Brine; In preparation, 2018.
| Standard Lithium Ltd. SW Arkansas Lithium Project PEA | Page 189 |
Collins, A. G. (1976): Lithium abundance
in oilfield waters; Lithium Resources and Requirements by the Year 2000, U.S. Geol. Survey Prof. Paper 1005, p. 116–123.
Daitch, P.J. (2018): Lithium extraction
from oilfield brine; MSc/MBA Thesis, University of Texas at Austin, May 2018, 141 p.
Dickinson, K. A. (1968): Upper Jurassic
stratigraphy of some adjacent parts of Texas, Louisiana and Arkansas; U.S. Geol. Survey Prof. Paper, 594E, 25 p.
The Encyclopedia of Arkansas History &
Culture (2018): The Encyclopedia of Arkansas History & Culture (EOA) is a project of the Butler Center for Arkansas Studies
at the Central Arkansas Library System (CALS) in Little Rock, Arkansas, < Accessed on 12 July 2018 at: http://www.encyclopediaofarkansas.net/about/
>.
Earlougher, R.C. (1977): Advances
in Well Analysis. P. 272.
Evans, R.K. (2014): Lithium; In:
A.G. Gunn (Ed.), Critical Metals Handbook, John Wiley & Sones td., Chichester, UK.
Fetter, C.W. (1988): Applied Hydrogeology
(4th Edition); Prentice-Hall Inc., Upper Saddle River, New Jersey, 592 p.
Forgotson, J.M. (1954): Regional
stratigraphic analysis of Cotton Valley Group of Upper Gulf Coastal Plain: AAPG Bulletin, v. 38, p. 2476-2499.
Fancher, G.H. and Mackay, D. K. (1946):
Secondary recovery of petroleum in Arkansas - A survey: A report to the 56th General Assembly of the State of Arkansas under the auspices
of the Arkansas Oil and Gas Commission, 264 p.
Freeze, R.A. and J.A. Cherry (1979):
Groundwater; Prentice Hall; 1 edition (May 18, 1979), 604 p.
Garrett, D.E. (2004): Handbook of
Lithium and Natural Calcium Chloride: Their Deposits, Processing, Uses and Properties. Elsevier. 476 p.
Gruber, P.W. Medina, P.A., Keoleian,
G.A., Kesler, S.E., Everson, M.P. and Wallington, T.J. (2011): Global Lithium Availability: A constraint for Electric Vehicles?; Journal
of Industrial Ecology, v. 15, no. 5, p. 760-775.
Hanford, and Barier (2007): Geometry
and seismic geomorphology of Carbonate shoreface clinoforms, Jurassic Smackover Formation, north Louisiana: In: Davies, R. J.,
Posamentier, H. W., Wood, L. J. and Cartwright, J. A. (eds) Seismic Geomorphology: Applications to Hydrocarbon Exploration and Production.
Geological Society, London, Special Publications, v. 277, 171–185.
Harris, P.M. and Dodman, C.A.
(1982): Jurassic evaporites of the U.S. Gulf Coast: the Smackover-Buckner contact; In: Handford, C. R., R. G. Loucks, and G. R.
Davies (eds.), Depositional and diagenetic spectra of evaporites -- a core workshop: Society of Economic Paleontologists and Mineralogists
Core Workshop 3, p. 174-192.
Heydari, E. and Baria, L. (2005):
A microbial Smackover Formation and the dual reservoir–seal system at the Little Cedar Creek Field in Conecuh County of Alabama;
Gulf Coast Association of Geological Societies Transactions, v. 55, p. 294-320.
| Standard Lithium Ltd. SW Arkansas Lithium Project PEA | Page 190 |
Harris, P. M. and Dodman, C. A. (1987):
Jurassic evaporites of the U.S. Gulf Coast: the Smackover-Buckner contact; Society of Economic Paleontologists and Mineralogists, Depositional
and Diagenetic Spectra of Evaporites (CW3), p. 174–192.
Hazzard, R.T., W.C. Spooner, and
Blanpied, B.W. (1947): Notes on the stratigraphy of the formations which underlie the Smackover Limestone in south Arkansas, northeast
Texas, and north Louisiana; Shreveport Geological Society 1945 Reference Report, v. 2, p. 483-503.
Houston, J. and Gunn, M. (2011):
Technical report on the Salar De Olaroz Lithium-potash project, Jujuy Province, Argentina; National Instrument 43-101 report prepared
for Orocobre Ltd.
Imlay, R.W. (1940): Lower Cretaceous
and Jurassic formations of southern Arkansas and their oil and gas possibilities; Arkansas Geological Survey, Information Circular
12, 64 p.
J.P.Morgan Chase & Co. (2021):
Asia Pacific Equity Research – Lithium Sector
Kalbacher, K., and A. A. Sartin (1986):
Diagenetic study of the Upper Member of the Smackover Formation (Upper Jurassic), Columbia County, Arkansas: Gulf Coast Association of
Geological Societies Transactions, v. 36, p. 191-199.
Kopaska-Merkel, D.C., Mann, S.D.
and Tew, B.H. (1992): Geological setting, petrophysical characteristics, and regional heterogeneity patterns of the Smackover in southwest
Alabama; Geological Survey of Alabama, Contract No. DE-FG22-89BC14425, 215 p.
Kruseman, G.P. and de Riddler, N.A.
(1994): Analysis and evaluation of pumping test data; Second Edition, ILRI Publication no. 47, 372 p.
Kunasz, I. (2006): Lithium Resources;
In: J.E. Kogel, N.C. Trivedi, J.M. Barker and S.T. Kurkowski (Eds)., Industrial Minerals and Rocks, 7th Edition Society
of Mining, Metallurgy and Exploration Inc., Little Colorado, U.S., p. 599-613.
Lamb, S. H. (1945). Hydrodynamics;
6th Edition, Dover Publications, New York, 738 p.
LANXESS (2016): Qualität in
Zahlen, Daten und Fakten, 2016 Geschäftsbericht (Translation, Quality in Numbers, Dates and Facts), 16 March 2017, < Available
on 6 July 2018 at: https://web.archive.org/web/20180117131428/https://lanxess.de/fileadmin/user_upload/lxs_gb2016_d_Stand_1705.pdf
>.
LANXESS (2017a): Lanxess successfully
completed acquisition of Chemtura; Lanxess Press Release, 21 April 2017, < Available on 5 July 2018 at: https://lanxess.com/en/corporate/media/press-releases/2017-00035e/
>.
LANXESS (2017b): LANXESS: Capacity
Expansion for Emerald Innovation 3000 Flame Retardant; Lanxess Press Release, 19 May 2017, < Available on 5 July 2018 at:
https://lanxess.com/en/corporate/media/press-releases/2017-00049e/ >.
Li, L., Deshmane, V.G., Paranthaman,
M.P., Bhave, R., Moyer, B.A. and Harrison, S. (2018): Lithium recovery from aqueous resources and batteries: a brief review; Johnson
Matthey Technol. Rev., 2018, v. 62, (2), pp. 161–176.
| Standard Lithium Ltd. SW Arkansas Lithium Project PEA | Page 191 |
MacMillan, G. and Binks, G. (2018):
NI 43-101 Technical Report, Lithium resource estimate for the Exshaw West Property south-central Alberta, Canada; Technical Report prepared
for E3 Metals Corporation, Effective Date: 4 June 2018; Available at : www.sedar.com.
MacRae, G., and Watkins, J.S. (1996):
Desoto Canyon Salt Basin: tectonic evolution and salts structural styles; In: J.O. Jones, and R.L. Freed, (Eds.), Structural Framework
of the Northern Gulf of Mexico: A Special Publication of GCAGS, Austin, GCAGS, p. 53-61.
Magnolia Reporter (2011): Albemarle
Corporation’s South Arkansas brine may soon power cars with Lithium; Magnolia Reporter, April 20, 2011 < Article available
on 5 July 2018 at: http://www.magnoliareporter.com/news_and_business/local_business/article_ee29b4de-7363-11e0-a004-001cc4c002e0.html
>
Magnolia Reporter (2016): Achtung!
German-based Lanxess acquires Chemtura Corporation; Magnolia Reporter, September 26, 2016, < Available on 5 July 2018 at:
http://www.magnoliareporter.com/news_and_business/local_business/article_5c3dfeb4-83a6-11e6-8588-8f7f83067bea.html >.
Mancini, E. A., Mink, R. M., Tew,
B. H., and Bearden, B. L. (1990): Natural gas plays in Jurassic reservoirs of southwestern Alabama and the Florida panhandle area; Gulf
Coast Association of Geological Societies Transactions, v. 40, p. 513-519.
Mancini, E.A., Aharon, P., Goddard,
D.A., Horn, M. and Barnaby, R. (2008): Basin analysis and petroleum system characterization and modelling, interior salt basins, central
and eastern Gulf of Mexico, Part 3: tectonic / depositional history, resource assessment; Adapted from Final Report, issued June 30,
2008, for period May 1, 2003 to April 30, 2008, prepared for U.S. Department of Energy, for DOE Award Number DE-FC26-03NT15395
and available at Texas A&M University (http://berg-hughes.tamu.edu/research/sedimentary-basin-analysis-studies).
Manger, G.E. (1963): Porosity and
Bulk Density of Sedimentary Rocks; In: Contributions to Geochemistry, Geological Survey Bulletin 1144-E.
Mann, S.D. (1988): Subaqueous evaporites
of the Buckner Member, Haynesville Formation, Northeastern Mobile County, Alabama. Gulf Coast Association of Geological Societies Transactions
38, 187–196.
Marton, G.L. and Buffler, R.T. (2016):
Jurassic-Cretaceous Tectonic Evolution of the Southeastern Gulf of Mexico, Constrains on the Style and Timing of Gulf of Mexico Rift-Drift
Development; AAPG 2016 International Convention and Exhibition, Cancun, Mexico, September 6-9, 2016.
McCoy, M. (2014): Betting on Bromine
in Arkansas; Chemical Engineering News, v. 92 (21), p. 31-32.
McEachern, P. (2017): Lithium recovery
from oilfield produced water brine and wastewater treatment; Report prepared for MGX Minerals Inc., 21 p. < available on 2 August 2018
at: https://rockstone-research.com/images/pdfs/MGX_TechnicalReportRapidLithiumExtractionProcess.pdf >.
| Standard Lithium Ltd. SW Arkansas Lithium Project PEA | Page 192 |
Mills, J., Frim, R., Ukeles, S.l,
and Yoffe, D. (2015): Bromine— Ullmann’s encyclopedia of industrial chemistry; Hoboken, NJ, John Wiley & Sons, Inc.,
p. 1–20.
Mining Journal (2021): Lithium Carbonate
prices have nearly doubled in 2021: Benchmark, 16 March 2021, < Available on 31 March 2021 at: https://www.mining-journal.com/energy-minerals-news/news/1406529/Lithium-Carbonate-prices-have-nearly-doubled-in-2021-benchmark
>.
Moore, C.H. and Druckman (1981):
Burial diagenesis and porosity evolution, Upper Jurassic Smackover, Arkansas and Louisiana; The American Association of Petroleum Geologists,
1981, p. 597-628.
Moore, C. H. (1984): The upper Smackover
of the Gulf rim: depositional systems, diagenesis, porosity evolution and hydrocarbon production; In: W. P. S. Ventress, D. G.
Bebout, B. F. Perkins, and C. H. Moore (eds.), The Jurassic of the Gulf rim: Gulf Coast Section SEPM, 3rd Annual Research Symposium,
Program and Abstracts, p. 283–307.
Moldovanyi, E.P. and Walter, L.M.
(1992): Regional trends in water chemistry, Smackover Formation, southwest Arkansas: Geochemical and physical controls; The American
Association of Petroleum Geologists, Bulletin, v. 76, no. 6., p. 864-894.
Munk, L., Jochens, H., Jennings,
M., Bradley, D. Hynek, S. and Godfrey, L. (2011): Geochemistry of Lithium-rich brines in Clayton Valley, Nevada, USA; Presentation and
paper from the 11th Biennial Meeting of the Society for Geology Applied to Mineral Deposits, 26-29 September 2011, Antofagasta,
Chile.
Nunn, J.A. (1984): Subsidence histories
for the Jurassic sediments of the northern Gulf Coast: thermal-mechanical model; Third Annual Research Conf., Gulf Coast Section, SEPM
Foundation, p. 309-322.
Swain F.M. and Anderson, E.G. (1993):
Stratigraphy and Ostracoda of the Cotton Valley Group, north central Louisiana; Louisiana Geological Survey, Geological Bulletin no.
45, 239 p.
Parker, A. P. (1973): Geopressure
in the Deep Smackover of Mississippi; Journal of Petroleum Technology, pp. 971-979.
Pavlovic, P. and Fowler, J. (2004):
Evaluation of the potential of Salar de Ricon brine deposits as a source of Lithium, potash, Boron and other mineral resources; Final
report prepared for Admiralty Resources NL and Argentina Diamonds Ltd., 15 December 2004.
Pilger, R.H., Jr. (1981): The
opening of the Gulf of Mexico: implications for the tectonic evolution of the northern Gulf Coast; GCAGS Transactions, v. 31, p. 377-381.
Reidel, F. (2017): Technical Report,
Resource estimate for Lithium and Potassium Sal de los Angeles Project; Technical Report prepared for LithiumX; Effective Date: 20 August 2016,
Amended Date: 24 February 24, 2017, Available at : www.sedar.com.
Rosko, M. (2017): Technical Report
for the Hombre Muerto North Project Salta and Catamarca Provinces, Argentina; Technical Report prepared for NRG Metals Inc., Effective
Date: 9 October, 2017, Available at : www.sedar.com.
| Standard Lithium Ltd. SW Arkansas Lithium Project PEA | Page 193 |
Roskill (2020): Lithium: Outlook
to 2030, 17th Edition, Published August 7, 2020, Available on 8 April 2021 at : https://roskill.com/market-report/Lithium/
>.
Salier, B. (2018): How we look at
Lithium projects; Sprott Capital Partners; Abstract at The Geological Society of London Conference, Lithium: From Exploration to End-User,
April 2018.
Salvador, A. (1987): Late Triassic-Jurassic
paleography and origin of Gulf of Mexico basin; AAPG Bulletin, v. 71, p. 419-451.
Salvador, A. (1990): Triassic-Jurassic;
In: Salvador, A., (ed.), The Geology of North America, v. J., The Gulf of Mexico Basin; Boulder, Geological Society of America,
p. 131–180.
Salvador, A. (1991a): The Gulf of
Mexico Basin: Decade of North American geology; v. DNAG, v. J: Boulder, Colorado, GSA, 568 p.
Salvador, A. (1991b): Triassic-Jurassic;
In: A. Salvador, (ed.), The Gulf of Mexico Basin, Boulder, Colorado, GSA, p. 131-180.
Sawyer, D.S., R.T. Buffler, and R.H.
Pilger, Jr. (1991): The crust under the Gulf of Mexico, in A. Salvadore, (ed.), The Gulf of Mexico Basin: Decade of North
American Geology, Boulder, GSA, p. 53-72.
Scott, K.R., W.E. Hayes and Fietz,
R.P. (1961): Geology of the Eagle Mills Formation; GCAGS Transactions, v. 11, p. 1-14.
Shreveport Geological Society (1945):
McKamie Field Lafayette County, Arkansas, Reference Report on Certain Oil and Gas Fields of North Louisiana, South Arkansas, Mississippi,
and Alabama, v. 1. p. 43-49.
Shengsong, Y. (1986): the hydrochemical
features of salt lakes in Qaidam Basin; Chinese Journal of Oceanology and Limnology, v. 4, no. 3, p. 383-403.
Simbol Materials (2011): Simbol Materials,
< Available on 14 July 2018 at: http://www.simbolmaterials.com/who_we_are.htm >.
Snydacker, D. (2018): Industry Presentation
by Lilac Solutions: Lithium Mineral Exploration in Alberta, Government/Industry Workshop, March 28, 2018, Calgary, Alberta.
Spanjers, R.P. (2015): Inferred resource
estimate for Lithium Clayton Valley south project Clayton valley, Esmeralda county, Nevada, USA: Technical Report prepared for Pure Energy
Minerals Ltd., Effective Date: 17 July 2015, Available at: www.sedar.com.
Standard Lithium Ltd. (2018a): Standard
Lithium to Acquire Lithium Brine Exploration and Production Rights; Standard Lithium Press Release, August 7, 2017, Available on
26 February at: https://standardLithium.com/2017/08/02/standard-Lithium-acquire-Lithium-brine-exploration-production-rights/
Standard Lithium Ltd. (2018b): Standard
Lithium Commences Resource Definition in Southern Arkansas; Standard Lithium Press Release, January 30, 2018, Available on 26 February at:
https://standardLithium.com/2018/01/30/standard-Lithium-commences-resource-definition-southern-arkansas/.
| Standard Lithium Ltd. SW Arkansas Lithium Project PEA | Page 194 |
Standard Lithium Ltd. (2021): Standard
Lithium Successfully Produces >99.985% Purity Battery Quality Lithium Carbonate Using OEM Technology and Commences Lithium Hydroxide
Conversion Program; Standard Lithium Press Release, November 12, 2018, Available on 26 February, Available on 1 March 2021
at: https://www.standardLithium.com/investors/news-events/press-releases/detail/86/standard-Lithium-successfully-produces-99-985-purity
>.
Stueber, A. M., Pushkar, P. and Hetherington,
E.A. (1984): A Strontium Isotopic Study of Smackover Brines and Associated Solids, Southern Arkansas; Geochimica et Cosmochimica Acta,
v. 48, p. 1637-1649.
TETRA Technologies, Inc. CEO
Overview Investor Day Presentation, May 31, 2018, page 61. http://ir.tetratec.com/presentations.
ThermoFisher Scientific (2018): Comparison
of ICP-OES and ICP-MS for trace element analysis; Available on 31 July 2018 at: https://www.thermofisher.com/ca/en/home/industrial/environmental/environmental-learning-center/contaminant-analysis-information/metal-analysis/comparison-icp-oes-icp-ms-trace-element-analysis.html
>.
Tonietto, S.N. and Pope, M.C. (2013):
Diagenetic evolution and its influence on petrophysical properties of the Jurassic Smackover Formation thrombolite and grainstone units
of Little Cedar Creek Field, Alabama; GCAGS Journal, v. 2, p. 68-84.
Troell, A. R. and Robinson, J. D.
(1987): Regional stratigraphy of the Smackover limestone (Jurassic) in south Arkansas and north Louisiana, and the geology of Chalybeat
Springs oil field. Gulf Coast Association of Geological Societies Transactions, v. 37, p. 225–262.
Van Siclen, D.C. (1984): Early opening
of initially-closed Gulf of Mexico and central North Atlantic Ocean; GCAGS Transactions, v. 34, p. 265-275.
Vestal, Jack H. (1950): Petroleum
geology of the Smackover Formation of southern Arkansas; State of Arkansas Geological Commission, p. 1-37.
U.S. Environmental Protection Agency
(1999): Spent brine return flow wells, in The class V underground injection control study; U.S. Environmental Protection Agency, EPA/816–R–99–014i,
v. 9, 27 p, < Accessed 12 July 2018, at: https://www.epa.gov/sites/production/files/2015-08/documents/classvstudy_volume09-spentbrinereturnflow_0.pdf
>.
USGS (1968): Upper Jurassic Stratigraphy
of Some Adjacent Parts of Texas, Louisiana, and Arkansas; U.S. Department of the Interior, U.S. Geological Survey Professional Paper
594-E, 1968. USGS (2016): 2016 Mineral Yearbook: Bromine [Advance Release]; U.S. Department of the Interior, U.S. Geological Survey,
June 2018, 8 p.
Wahlen, R. (2011): Recent
advances in ICP-MS and ICP-OES technology for the determination of heavy metals and trace elements in contaminated soil samples;
2nd SCLF Conference, 8 September 2011, < Available on 31 July 2018 at: http://www.sclf.co.uk/conference/2011/7%20Raimund%20Wahlen%202011.pdf >.
Walter, L.M., Molclovanyi, E.P. and
Land, L.S. (1990): Boron isotopic composition of subsurface brines (Smackover Formation, southwest Arkansas): Implications for chemical
evolution and migration; Geological Society of America 1990 Annual Meeting Abstracts with Programs, p. A62.
| Standard Lithium Ltd. SW Arkansas Lithium Project PEA | Page 195 |
Winker, C.D. and Buffler, R.T. (1988):
Paleogeographic evolution of early deep-water Gulf of Mexico and margins, Jurassic to Middle Cretaceous (Comanchaean): AAPG Bulletin,
v. 72, p. 318-346.
Wolf (2005): What is ICP-MS? …And
more importantly, what can it do?; USGS/Central Region/Crustal Imaging & Characterization Team, March 2005, < Available
on 31 July 2018 at: https://crustal.usgs.gov/laboratories/icpms/intro.html >.
Xu, X., Zhou, Y., Fan, M., Lv, Z.,
Tang, Y., Sun, Y., Chen, Y. and Wan, P. (2017): Lithium adsorption performance of a three-dimensional porous H2TiO3-type
Lithium ion-sieve in strong alkaline Bayer liquor; RSC Advances, v. 7, p. 18883--18891.
Zheng, M., Yuan, H., Liu, J., Li,
Y., Ma, Z. and Sun, Q. (2007): Sedimentary characteristics and paleoenvironmental records of Zabuye Salt Lake, Tibetan Plateay, since
128 ka BP; Acta Geological Sinica, v. 81, no. 5, p. 681-879.
Zimmerman, R. K. (1992): Fractured
Smackover limestone in northeast Louisiana; Implications for hydrocarbon exploitation; AAPG Datapages/Archives, GCAGS Transactions, v.
42, p. 401-412.
| Standard Lithium Ltd. SW Arkansas Lithium Project PEA | Page 196 |
The certificates
can be found on the following pages.
| Standard Lithium Ltd. SW Arkansas Lithium Project PEA | Page 197 |
I,
Rodney Breuer, Professional Engineer, do hereby certify that:
| 1. | I
am Vice President of Engineering, Compliance and Construction, Inc (ECCI), located in Little
Rock, Arkansas. |
| 2. | I
graduated with a B.Sc. in Civil Engineering from the University of Missouri-Rolla in 1979
and a M.Sc. in Civil Engineering the University of Missouri-Rolla in 1980. |
| 3. | I
am and have been registered as a Professional Engineer since 1984. |
| 4. | I
have worked as an engineer in the environmental industry for 40 years, since my graduation. |
| 5. | I
have read the definition of "Qualified Person" set out in National Instrument 43-101
(NI 43-101) and certify that by reason of my education, affiliation with a professional association
(as defined in NI 43-101) and past relevant work experience, I fulfill the requirements
to be a "Qualified Person" for the purposes of NI 43-101. |
| 6. | I
oversaw the preparation and am responsible for the Environmental Studies, Permitting and
Social or Community Impact in Section 20 of the Technical Report titled "SW Arkansas
Lithium Project Arkansas, United States", with an effective date of November 20,
2021 and an amended issue date of June 16, 2023 (the "Technical Report"). |
| 7. | I
have not visited the SW Arkansas Property with respect to this Technical Report. |
| 8. | I
am not aware of any scientific or technical information with respect to the subject matter
of the Technical Report that is not reflected in the Technical Report, the omission to disclose
which makes the Technical Report misleading. |
| 9. | I
am independent of the Issuer as per NI 43-101 and successfully pass the independence requirements
of the Guidance of Independence test in NI 43-101 CP Item 1.5. I am not an employee, insider,
director or partner of the Issuer and do not hold any securities or direct/indirect interests
related to the Issuer or the Property and/or adjacent properties that is the subject of this
Technical Report. |
| 10. | I
have read National Instrument 43-101 and Form 43-101 F1, and the Technical Report has
been prepared in compliance with that instrument and form. |
| 11. | I
consent to the filing of the Technical Report with any stock exchange and other regulatory
authority and any publication by them for regulatory purposes, including electronic publication
in the public company files or their websites. |
| |
 |
| /s/ Rodney Breuer |
| |
| Rodney Breuer, P.Eng. |
| |
| Effective date: November 20, 2021 |
| Signature date: June 16, 2023 |
| Little Rock, Arkansas, United States |
I,
D. Roy Eccles, P. Geol., do hereby certify that:
| 1. | I
am a Senior Consulting Geologist and Chief Operations Officer of APEX Geoscience Ltd., #100,
11450 – 160th Street, Edmonton, Alberta T5M 3Y7. |
| 2. | I
graduated with a B.Sc. in Geology from the University of Manitoba in Winnipeg, Manitoba in
1986 and with a M.Sc. in Geology from the University of Alberta in Edmonton, Alberta in 2004. |
| 3. | I
am and have been registered as a Professional Geologist with the Association of Professional
Engineers and Geoscientists (APEGA) of Alberta since 2003. |
| 4. | I
have worked as a geologist for more than 35 years since my graduation from university and
have been involved in all aspects of global mineral exploration, mineral research, and mineral
resource estimations for metallic, industrial, and specialty mineral projects and deposits. |
| 5. | I
have read the definition of “Qualified Person” set out in National Instrument
43-101 (NI 43-101) and certify that by reason of my education, affiliation with a professional
association (as defined in NI 43-101) and past relevant work experience, I fulfill the
requirements to be a “Qualified Person” for the purposes of NI 43-101. I have
explored for and prepared mineral resource models and estimations for lithium-brine projects
in western Canada, southern United States, central Europe, and other international destinations. |
| 6. | I
oversaw the preparation, and am responsible for, the technical information included in Sections
4-12, 14, and 23 of the Technical Report titled “Preliminary Economic Assessment of
SW Arkansas Lithium Project”, with an effective date of November 20, 2021 and
an amended issue date of June 16, 2023 (the “Technical Report). |
| 7. | I
visited the SWA Property on March 5 to 9, 2018 and can verify the brine sampling program,
infrastructure at the SWA Property, including oil and gas wells, the pipeline network and
primary and secondary road network. |
| 8. | To
the best of my knowledge, information and belief, the Technical Report contains all relevant
scientific and technical information that is required to be disclosed, to make the Technical
Report not misleading. |
| 9. | I
have read National Instrument 43-101 and Form 43-101F1, and the Technical Report has
been prepared in compliance with that instrument and form. |
| 10. | I
am independent of the Issuer, and the SW Arkansas Property, as per NI 43-101 and successfully
pass the independence requirements of the Guidance of Independence test in NI 43-101 CP Item
1.5. |
| 11. | I
have been involved with the project in the preparation of the following report: |
Eccles,
D.R., Molnar, R., and Rakhit, K. (2019): Geological introduction and Maiden Inferred Resource Estimate for Standard Lithium Ltd.’s
Tetra Smackover Lithium-Brine Property in Arkansas, United States; Technical Report prepared for Standard Lithium Ltd., Effective Date
28 February 2019, 159 p.
| 12. | I
consent to the filing of the Technical Report with any stock exchange and other regulatory
authority and any publication by them for regulatory purposes, including electronic publication
in the public company files or their websites. |

D.
Roy Eccles, M.Sc., P. Geol.
Effective
date: November 20, 2021
Signature
date: June 16, 2023
Edmonton,
Alberta, Canada
I,
Trotter Hunt, Professional Engineer, do hereby certify that:
| 1. | I
am Vice President of Hunt, Guillot & Associates LLC, 603 E Reynolds Drive, Ruston,
Louisiana, 71270, United States of America. |
| 2. | I
graduated with a Bachelor of Science Degree in Mechanical Engineering from Georgia Institute
of Technology in 1999 and Master's Degree in Business Administration in 2004 from Vanderbilt
University. |
| 3. | I
am registered as a Professional Engineer in Louisiana, Texas, South Carolina, New York, New
Jersey, Florida, West Virginia, and multiple other states since 2009. |
| 4. | I
have worked as a mechanical engineer in the petroleum, natural gas, specialty chemical and
multiple other industries for 21 years, since my graduation from university. |
| 5. | I
have read the definition of "Qualified Person" set out in National Instrument 43-101
(NI 43-101) and certify that by reason of my education, affiliation with a professional association
(as defined in NI 43-101) and past relevant work experience, I fulfill the requirements
to be a "Qualified Person" for the purposes of NI 43-101. |
| 6. | I
oversaw the preparation and am responsible for Sections 16.2 - 16.4, 18, 21 and 22 the Technical
Report titled "SW Arkansas Lithium Project Arkansas, United States", with an effective
date of November 20, 2021 and an amended issue date of June 16, 2023 (the "Technical
Report"). |
| 7. | I
made one (1) visit to the SW Arkansas Property on November 20, 2021 to observe
the proposed location for the facility and associated infrastructure. |
| 8. | I
am not aware of any scientific or technical information with respect to the subject matter
of the Technical Report that is not reflected in the Technical Report, the omission to disclose
which makes the Technical Report misleading. |
| 9. | I
am independent of the Issuer as per NI 43-101 and successfully pass the independence requirements
of the Guidance of Independence test in NI 43-101 CP Item 1.5. I am not an employee, insider,
director or partner of the Issuer and do not hold any securities or direct/indirect interests
related to the Issuer or the Property and/or adjacent properties that is the subject of this
Technical Report. |
| 10. | I
have read National Instrument 43-101 and Form 43-101F1, and the Technical Report has
been prepared in compliance with that instrument and form. |
| 11. | I
consent to the filing of the Technical Report with any stock exchange and other regulatory
authority and any publication by them for regulatory purposes, including electronic publication
in the public company files or their websites. |
/s/ Trotter Hunt
Trotter
Hunt, Professional Engineer
Effective
date: November 20, 2021
Signature
date: June 16, 2023
Ruston,
Louisiana, United States
|
|  |
I,
David Anthony (Tony) Boyd , Ph.D., P.Eng., do hereby certify that:
| 1. | I
am a process engineer employed at NORAM Electrolysis Systems Inc., located at #1800-200 Granville
St. , Vancouver, British Columbia, V6C 1S4 and as of the effective date of the Technical
Report I was employed by NORAM Engineering and Constructors Ltd. located at #1800-200 Granville
Street, Vancouver, British Columbia, V6C 1S4. |
| 2. | I
am a graduate of the University of British Columbia, Canada with a B.A.Sc. in Chemical Engineering
(1990) and a Ph.D. in Chemical Engineering (2006). |
| 3. | I
am a Registered Professional Engineer (P.Eng.) with the Engineers and Geoscientists of
British Columbia (EGBC) with Registration Number 24424 (June 1999). |
| 4. | As
of the effective date of the technical report, I had over 30 years of process engineering
experience in a variety of technology areas, including nitration, sulphuric acid and electrochemistry. I have worked in the area of electrolysis to produce lithium hydroxide for over seven years
through NORAM's development of its Norscand® electrolyser, including operations at NORAM's
pilot plant (Richmond , BC) and Nemaska Lithium's P1 P demonstration plant (Shawinigan, QC).
I was the QP for the electrolysis portion of Nemaska Lithium's NI 43-101 Feasibility Studies
(2017, 2019). |
| 5. | I
have read the definition of "Qualified Person" set out in National Instrument 43-101
(NI 43- 101) and certify that by reason of my education , affiliation with a professional
association (as defined in NI 43-101) and past relevant work experience, I fulfill the
requirements to be a "Qualified Person" for the purposes of NI 43-101. |
| 6. | I
was the supervisor of the engineer (Eric Mielke, P.Eng.) involved in the preparation of Sections
1, 2, 3, 17, 19, 24, 25, 26 and 27 of the Technical Report titled "SW Arkansas Lithium
Project Arkansas, United States", with an effective date of November 20, 2021 and
an amended issue date of June 16, 2023 (the "Technical Report"), and I am
responsible for Sections 2, 3, 17, 19, 24, 25, 26 and 27. For the summary chapter (Section 1), I
am responsible for the content to be consistent with the subsequent report chapters. |
| 7. | I
have not visited the SW Arkansas Property with respect to this Technical Report. |
| 8. | As
at the effective date of the Technical Report, to the best of knowledge, information and
belief, the Technical Report, or part(s) thereof that I am responsible for, contains
all scientific and technical information that is required to be disclosed to make the Technical
Report not misleading. |
| 9. | I
am independent of the Issuer as per NI 43-101 and successfully pass the independence requirements
of the Guidance of Independence test in NI 43-101 CP Item 1.5. I am not an employee, insider,
director or partner of the Issuer and do not hold any securities or direct/indirect interests
related to the Issuer or the Property and/or adjacent properties that is the subject of this
Technical Report. |
| 10. | 1
have read National Instrument 43-101 and Form 43-101F1, and the Technical Report has
been prepared in compliance with that instrument and form. |
| 11. | I
consent to the filing of the Technical Report with any stock exchange and other regulatory authority and any publication by them
for regulatory purposes, including electronic publication in the public, company files or their websites. |
| /s/ David Anthony (Tony) Boyd | |
David
Anthony (Tony) Boyd, Ph.D., P.Eng.
Effective
date: November 20, 2021
Signature
date: July 17, 2023
Vancouver,
British Columbia, Canada
I,
Dr. Ronald Molnar, Professional Engineer, do hereby certify that:
| 1. | I
am Owner and President of: METNETH2O Inc., 1816 Parkwood Circle, Peterborough,
ON K9J 8C2. |
| 2. | I
graduated with a B.Eng. in Metallurgy from McGill University in 1972 and a Ph.D. in Metallurgy
from the Imperial College, Royal School of Mines, London, England in 1980. |
| 3. | I
am and have been registered as a Professional Engineer with the Professional Engineers Ontario
(PEO) since 2008. |
| 4. | I
have worked as a hydrometallurgist for over 40 years, including over 36 years of experience
in extraction of metals from aqueous solutions and purification of metallurgical solutions,
since my graduation from university. I currently specialize in solvent extraction and ion
exchange, test program design, pilot plant design, and data analysis for bench-scale and
pilot plant programs. |
| 5. | I
have read the definition of “Qualified Person” set out in National Instrument
43-101 (NI 43-101) and certify that by reason of my education, affiliation with a professional
association (as defined in NI 43-101) and past relevant work experience, I fulfill
the requirements to be a “Qualified Person” for the purposes of NI 43-101. |
| 6. | I
oversaw the preparation and am responsible for the technical information included in Section 13
(Mineral Processing and Metallurgical Testing) of the Technical Report titled “Preliminary
Economic Assessment of SW Arkansas Lithium Project”, with an effective date of November 20,
2021 and an amended issue date of June 16, 2023 (the “Technical Report”). |
| 7. | I
have not visited the SWA Property with respect to this Technical Report. |
| 8. | I
am not aware of any scientific or technical information with respect to the subject matter
of the Technical Report that is not reflected in the Technical Report, the omission of the
disclosure of which would render the Technical Report misleading. |
| 9. | I
am independent of the Issuer as per NI 43-101 and successfully pass the independence requirements
of the Guidance of Independence test in NI 43-101 CP Item 1.5. I am not an employee, insider,
director or partner of the Issuer and do not hold any securities or direct/indirect interests
related to the Issuer or the Property and/or adjacent properties that are the subject of
this Technical Report. I work as a contractor on a project basis at an hourly rate and have
not received income beyond the 3-years proceeding the Effective Date of this Technical
Report. |
| 10. | I
have read National Instrument 43-101 and Form 43-101F1, and the Technical Report has
been prepared in compliance with that instrument and form. |
| 11. | I
consent to the filing of the Technical Report with any stock exchange and other regulatory
authority and any publication by them for regulatory purposes, including electronic publication
in the public company files or their websites. |
/s/ Ronald
Molnar
Ronald
Molnar, Ph.D., P. Eng (ON)
Effective
date: November 20, 2021
Signature
date: June 26, 2023
Peterborough,
Ontario, Canada
| |  |
I,
Steve Shikaze, Professional Engineer, do hereby certify that:
| 1. | I
am a self-employed Senior Hydrogeological Engineer based in Waterloo, Ontario, and as of
the effective date of the Technical Report I was employed by Matrix Solutions Inc. located
at 7B-650 Woodlawn Road W., Guelph, Ontario, N1K 1B8. |
| 2. | I
graduated with a B.A.Sc. in Geological Engineering from the University of Waterloo in 1990
and a M.Sc. in Earth Sciences (Hydrogeology) from the University of Waterloo in 1993. |
| 3. | I
am and have been registered as a Professional Engineer with the Professional Engineers of
Ontario since 2006. |
| 4. | I
have worked as a hydrogeologist in the environmental industry for 30 years since
my graduation from university. |
| 5. | I
have read the definition of “Qualified Person” set out in National Instrument 43-101 (NI 43-101) and certify that by reason
of my education, affiliation with a professional association (as defined in NI 43-101) and past relevant work experience, I
fulfill the requirements to be a “Qualified Person” for the purposes of NI 43-101. |
| 6. | I
oversaw the preparation and am responsible for the hydrogeological information included in
Section 16.1 (Estimated Brine Production Capacity of the Technical Report titled “SW
Arkansas Lithium Project Arkansas, United States”, with an effective date of
November 20, 2021 and an amended issue date of June 16, 2023 (the “Technical
Report”). |
| 7. | I
have not visited the SW Arkansas Property with respect to this Technical Report. |
| 8. | I
am not aware of any scientific or technical information with respect to the subject matter
of the Technical Report that is not reflected in the Technical Report, the omission to disclose
which makes the Technical Report misleading. |
| 9. | I
am independent of the Issuer as per NI 43-101 and successfully pass the independence requirements
of the Guidance of Independence test in NI 43-101 CP Item 1.5. I am not an employee, insider,
director or partner of the Issuer and do not hold any securities or direct/indirect interests
related to the Issuer or the Property and/or adjacent properties
that is the subject of this Technical Report. |
| 10. | I
have read National Instrument 43-101 and Form 43-101F1, and the Technical Report has
been prepared in compliance with that instrument and form. |
| 11. | I
consent to the filing of the Technical Report with any stock exchange and other regulatory
authority and any publication by them for regulatory purposes, including electronic publication
in the public company files or their websites. |
/s/
Steve Shikaze
Steve
Shikaze, M.Sc., P.Eng.
Effective
date: November 20, 2021
Signature
date: June 16, 2023
Waterloo,
Ontario, Canada
| |  |
Standard Lithium (AMEX:SLI)
과거 데이터 주식 차트
부터 4월(4) 2024 으로 5월(5) 2024

Standard Lithium (AMEX:SLI)
과거 데이터 주식 차트
부터 5월(5) 2023 으로 5월(5) 2024
