falseQ312-3120230001740332http://fasb.org/us-gaap/2023#OtherAssetsNoncurrenthttp://fasb.org/us-gaap/2023#OtherAssetsNoncurrenthttp://fasb.org/us-gaap/2023#AccruedLiabilitiesCurrenthttp://fasb.org/us-gaap/2023#AccruedLiabilitiesCurrenthttp://fasb.org/us-gaap/2023#OtherLiabilitiesNoncurrenthttp://fasb.org/us-gaap/2023#OtherLiabilitiesNoncurrenthttp://fasb.org/us-gaap/2023#OtherAssetsCurrenthttp://fasb.org/us-gaap/2023#OtherAssetsNoncurrenthttp://fasb.org/us-gaap/2023#CostOfGoodsAndServicesSold00017403322023-01-012023-09-3000017403322023-10-20xbrli:shares00017403322023-09-30iso4217:USD00017403322022-12-31iso4217:USDxbrli:shares00017403322023-07-022023-09-3000017403322022-07-032022-10-0100017403322022-01-012022-10-0100017403322021-12-3100017403322022-10-010001740332us-gaap:CommonStockMember2023-07-010001740332us-gaap:AdditionalPaidInCapitalMember2023-07-010001740332us-gaap:RetainedEarningsMember2023-07-010001740332us-gaap:AccumulatedOtherComprehensiveIncomeMember2023-07-010001740332us-gaap:TreasuryStockCommonMember2023-07-0100017403322023-07-010001740332us-gaap:RetainedEarningsMember2023-07-022023-09-300001740332us-gaap:AccumulatedOtherComprehensiveIncomeMember2023-07-022023-09-300001740332us-gaap:CommonStockMember2023-07-022023-09-300001740332us-gaap:AdditionalPaidInCapitalMember2023-07-022023-09-300001740332us-gaap:TreasuryStockCommonMember2023-07-022023-09-300001740332us-gaap:CommonStockMember2023-09-300001740332us-gaap:AdditionalPaidInCapitalMember2023-09-300001740332us-gaap:RetainedEarningsMember2023-09-300001740332us-gaap:AccumulatedOtherComprehensiveIncomeMember2023-09-300001740332us-gaap:TreasuryStockCommonMember2023-09-300001740332us-gaap:CommonStockMember2022-07-020001740332us-gaap:AdditionalPaidInCapitalMember2022-07-020001740332us-gaap:RetainedEarningsMember2022-07-020001740332us-gaap:AccumulatedOtherComprehensiveIncomeMember2022-07-020001740332us-gaap:TreasuryStockCommonMember2022-07-0200017403322022-07-020001740332us-gaap:RetainedEarningsMember2022-07-032022-10-010001740332us-gaap:AccumulatedOtherComprehensiveIncomeMember2022-07-032022-10-010001740332us-gaap:CommonStockMember2022-07-032022-10-010001740332us-gaap:AdditionalPaidInCapitalMember2022-07-032022-10-010001740332us-gaap:TreasuryStockCommonMember2022-07-032022-10-010001740332us-gaap:CommonStockMember2022-10-010001740332us-gaap:AdditionalPaidInCapitalMember2022-10-010001740332us-gaap:RetainedEarningsMember2022-10-010001740332us-gaap:AccumulatedOtherComprehensiveIncomeMember2022-10-010001740332us-gaap:TreasuryStockCommonMember2022-10-010001740332us-gaap:CommonStockMember2022-12-310001740332us-gaap:AdditionalPaidInCapitalMember2022-12-310001740332us-gaap:RetainedEarningsMember2022-12-310001740332us-gaap:AccumulatedOtherComprehensiveIncomeMember2022-12-310001740332us-gaap:TreasuryStockCommonMember2022-12-310001740332us-gaap:RetainedEarningsMember2023-01-012023-09-300001740332us-gaap:AccumulatedOtherComprehensiveIncomeMember2023-01-012023-09-300001740332us-gaap:CommonStockMember2023-01-012023-09-300001740332us-gaap:AdditionalPaidInCapitalMember2023-01-012023-09-300001740332us-gaap:TreasuryStockCommonMember2023-01-012023-09-300001740332us-gaap:CommonStockMember2021-12-310001740332us-gaap:AdditionalPaidInCapitalMember2021-12-310001740332us-gaap:RetainedEarningsMember2021-12-310001740332us-gaap:AccumulatedOtherComprehensiveIncomeMember2021-12-310001740332us-gaap:TreasuryStockCommonMember2021-12-310001740332us-gaap:RetainedEarningsMember2022-01-012022-10-010001740332us-gaap:AccumulatedOtherComprehensiveIncomeMember2022-01-012022-10-010001740332us-gaap:CommonStockMember2022-01-012022-10-010001740332us-gaap:AdditionalPaidInCapitalMember2022-01-012022-10-010001740332us-gaap:TreasuryStockCommonMember2022-01-012022-10-010001740332us-gaap:DisposalGroupHeldforsaleNotDiscontinuedOperationsMemberrezi:GenesisCableMember2023-09-300001740332rezi:SftySAMember2023-08-09xbrli:pure0001740332rezi:BTXTechnologiesIncMember2023-01-230001740332rezi:TekniqueLimitedMember2022-12-230001740332rezi:ElectronicCustomerDistributorsIncMember2022-07-050001740332rezi:FirstAlertMember2022-03-31rezi:segment0001740332rezi:ProductsAndSolutionsSegmentMember2023-07-022023-09-300001740332rezi:ProductsAndSolutionsSegmentMember2022-07-032022-10-010001740332rezi:ProductsAndSolutionsSegmentMember2023-01-012023-09-300001740332rezi:ProductsAndSolutionsSegmentMember2022-01-012022-10-010001740332rezi:ADIGlobalDistributionSegmentMember2023-07-022023-09-300001740332rezi:ADIGlobalDistributionSegmentMember2022-07-032022-10-010001740332rezi:ADIGlobalDistributionSegmentMember2023-01-012023-09-300001740332rezi:ADIGlobalDistributionSegmentMember2022-01-012022-10-010001740332us-gaap:OperatingSegmentsMemberrezi:ProductsAndSolutionsSegmentMember2023-07-022023-09-300001740332us-gaap:OperatingSegmentsMemberrezi:ProductsAndSolutionsSegmentMember2022-07-032022-10-010001740332us-gaap:OperatingSegmentsMemberrezi:ProductsAndSolutionsSegmentMember2023-01-012023-09-300001740332us-gaap:OperatingSegmentsMemberrezi:ProductsAndSolutionsSegmentMember2022-01-012022-10-010001740332us-gaap:OperatingSegmentsMemberrezi:ADIGlobalDistributionSegmentMember2023-07-022023-09-300001740332us-gaap:OperatingSegmentsMemberrezi:ADIGlobalDistributionSegmentMember2022-07-032022-10-010001740332us-gaap:OperatingSegmentsMemberrezi:ADIGlobalDistributionSegmentMember2023-01-012023-09-300001740332us-gaap:OperatingSegmentsMemberrezi:ADIGlobalDistributionSegmentMember2022-01-012022-10-010001740332us-gaap:CorporateNonSegmentMember2023-07-022023-09-300001740332us-gaap:CorporateNonSegmentMember2022-07-032022-10-010001740332us-gaap:CorporateNonSegmentMember2023-01-012023-09-300001740332us-gaap:CorporateNonSegmentMember2022-01-012022-10-010001740332rezi:AirMemberrezi:ProductsAndSolutionsSegmentMember2023-07-022023-09-300001740332rezi:AirMemberrezi:ProductsAndSolutionsSegmentMember2022-07-032022-10-010001740332rezi:AirMemberrezi:ProductsAndSolutionsSegmentMember2023-01-012023-09-300001740332rezi:AirMemberrezi:ProductsAndSolutionsSegmentMember2022-01-012022-10-010001740332rezi:SafetyAndSecurityMemberrezi:ProductsAndSolutionsSegmentMember2023-07-022023-09-300001740332rezi:SafetyAndSecurityMemberrezi:ProductsAndSolutionsSegmentMember2022-07-032022-10-010001740332rezi:SafetyAndSecurityMemberrezi:ProductsAndSolutionsSegmentMember2023-01-012023-09-300001740332rezi:SafetyAndSecurityMemberrezi:ProductsAndSolutionsSegmentMember2022-01-012022-10-010001740332us-gaap:EnergyServiceMemberrezi:ProductsAndSolutionsSegmentMember2023-07-022023-09-300001740332us-gaap:EnergyServiceMemberrezi:ProductsAndSolutionsSegmentMember2022-07-032022-10-010001740332us-gaap:EnergyServiceMemberrezi:ProductsAndSolutionsSegmentMember2023-01-012023-09-300001740332us-gaap:EnergyServiceMemberrezi:ProductsAndSolutionsSegmentMember2022-01-012022-10-010001740332rezi:ProductsAndSolutionsSegmentMemberus-gaap:PublicUtilitiesInventoryWaterMember2023-07-022023-09-300001740332rezi:ProductsAndSolutionsSegmentMemberus-gaap:PublicUtilitiesInventoryWaterMember2022-07-032022-10-010001740332rezi:ProductsAndSolutionsSegmentMemberus-gaap:PublicUtilitiesInventoryWaterMember2023-01-012023-09-300001740332rezi:ProductsAndSolutionsSegmentMemberus-gaap:PublicUtilitiesInventoryWaterMember2022-01-012022-10-010001740332rezi:ADIGlobalDistributionSegmentMemberrezi:USAndCanadaMember2023-07-022023-09-300001740332rezi:ADIGlobalDistributionSegmentMemberrezi:USAndCanadaMember2022-07-032022-10-010001740332rezi:ADIGlobalDistributionSegmentMemberrezi:USAndCanadaMember2023-01-012023-09-300001740332rezi:ADIGlobalDistributionSegmentMemberrezi:USAndCanadaMember2022-01-012022-10-010001740332us-gaap:EMEAMemberrezi:ADIGlobalDistributionSegmentMember2023-07-022023-09-300001740332us-gaap:EMEAMemberrezi:ADIGlobalDistributionSegmentMember2022-07-032022-10-010001740332us-gaap:EMEAMemberrezi:ADIGlobalDistributionSegmentMember2023-01-012023-09-300001740332us-gaap:EMEAMemberrezi:ADIGlobalDistributionSegmentMember2022-01-012022-10-010001740332rezi:ADIGlobalDistributionSegmentMembersrt:AsiaPacificMember2023-07-022023-09-300001740332rezi:ADIGlobalDistributionSegmentMembersrt:AsiaPacificMember2022-07-032022-10-010001740332rezi:ADIGlobalDistributionSegmentMembersrt:AsiaPacificMember2023-01-012023-09-300001740332rezi:ADIGlobalDistributionSegmentMembersrt:AsiaPacificMember2022-01-012022-10-010001740332srt:MinimumMember2022-01-012022-12-310001740332srt:MaximumMember2022-01-012022-12-3100017403322022-01-012022-12-310001740332us-gaap:PensionPlansDefinedBenefitMember2023-07-022023-09-300001740332us-gaap:PensionPlansDefinedBenefitMember2023-01-012023-09-3000017403322023-04-022023-07-010001740332us-gaap:EmployeeStockOptionMember2023-07-010001740332us-gaap:PerformanceSharesMember2023-01-012023-09-300001740332us-gaap:PerformanceSharesMember2022-01-012022-10-010001740332us-gaap:RestrictedStockUnitsRSUMember2023-01-012023-09-300001740332us-gaap:RestrictedStockUnitsRSUMember2022-01-012022-10-010001740332rezi:KeyEmployeesMember2023-01-012023-09-300001740332rezi:NonEmployeeDirectorsMember2023-01-012023-09-300001740332rezi:ProductsAndSolutionsSegmentMember2022-12-310001740332rezi:ADIGlobalDistributionSegmentMember2022-12-310001740332rezi:ProductsAndSolutionsSegmentMember2023-09-300001740332rezi:ADIGlobalDistributionSegmentMember2023-09-300001740332us-gaap:PatentedTechnologyMember2023-09-300001740332us-gaap:PatentedTechnologyMember2022-12-310001740332us-gaap:CustomerRelationshipsMember2023-09-300001740332us-gaap:CustomerRelationshipsMember2022-12-310001740332us-gaap:TrademarksMember2023-09-300001740332us-gaap:TrademarksMember2022-12-310001740332us-gaap:ComputerSoftwareIntangibleAssetMember2023-09-300001740332us-gaap:ComputerSoftwareIntangibleAssetMember2022-12-310001740332rezi:CostOfGoodsSoldMember2023-07-022023-09-300001740332rezi:CostOfGoodsSoldMember2022-07-032022-10-010001740332rezi:CostOfGoodsSoldMember2023-01-012023-09-300001740332rezi:CostOfGoodsSoldMember2022-01-012022-10-010001740332us-gaap:SellingGeneralAndAdministrativeExpensesMember2023-07-022023-09-300001740332us-gaap:SellingGeneralAndAdministrativeExpensesMember2022-07-032022-10-010001740332us-gaap:SellingGeneralAndAdministrativeExpensesMember2023-01-012023-09-300001740332us-gaap:SellingGeneralAndAdministrativeExpensesMember2022-01-012022-10-010001740332rezi:A4OfSeniorUnsecuredNotesDue2029Member2023-09-300001740332rezi:A4OfSeniorUnsecuredNotesDue2029Member2022-12-310001740332rezi:SevenYearVariableRateTermLoanBDueInTwoThousandTwentyEightMember2023-09-300001740332rezi:SevenYearVariableRateTermLoanBDueInTwoThousandTwentyEightMember2022-12-310001740332rezi:AmendedAndRestatedTermBFacilityMemberrezi:AmendedAndRestatedCreditAgreementMember2021-02-122021-02-120001740332rezi:AmendedAndRestatedTermBFacilityMemberrezi:AmendedAndRestatedCreditAgreementMember2021-02-120001740332rezi:AmendedAndRestatedTermBFacilityMemberrezi:AmendedAndRestatedCreditAgreementMember2023-09-300001740332rezi:AmendedAndRestatedRevolvingCreditFacilityMemberrezi:AmendedAndRestatedCreditAgreementMember2021-02-122021-02-120001740332rezi:AmendedAndRestatedRevolvingCreditFacilityMemberrezi:AmendedAndRestatedCreditAgreementMember2021-02-120001740332rezi:SecuredOvernightFinancingRateSOFRMemberrezi:AmendedAndRestatedRevolvingCreditFacilityMemberrezi:AmendedAndRestatedCreditAgreementMember2023-06-302023-06-300001740332rezi:AmendedAndRestatedTermBFacilityMember2023-09-300001740332rezi:AmendedAndRestatedTermBFacilityMember2022-12-310001740332rezi:AmendedAndRestatedRevolvingCreditFacilityMemberrezi:SeniorCreditFacilitiesMember2022-12-310001740332rezi:AmendedAndRestatedRevolvingCreditFacilityMemberrezi:SeniorCreditFacilitiesMember2023-09-300001740332rezi:SeniorCreditFacilitiesMemberus-gaap:LetterOfCreditMember2023-09-300001740332rezi:SeniorCreditFacilitiesMemberus-gaap:LetterOfCreditMember2022-12-310001740332rezi:SwapAgreementsMember2021-03-31rezi:derivative0001740332rezi:SwapAgreementsMember2023-03-012023-04-300001740332rezi:SwapAgreementsMember2023-04-300001740332rezi:SwapAgreementsMember2023-03-310001740332rezi:SwapAgreementsMember2023-09-300001740332rezi:SwapAgreementsMember2023-06-230001740332rezi:SwapAgreementsMembersrt:MaximumMember2023-06-230001740332us-gaap:InterestRateSwapMemberus-gaap:DesignatedAsHedgingInstrumentMemberus-gaap:OtherCurrentAssetsMember2023-09-300001740332us-gaap:InterestRateSwapMemberus-gaap:DesignatedAsHedgingInstrumentMemberus-gaap:OtherCurrentAssetsMember2022-12-310001740332us-gaap:InterestRateSwapMemberus-gaap:OtherAssetsMemberus-gaap:DesignatedAsHedgingInstrumentMember2023-09-300001740332us-gaap:InterestRateSwapMemberus-gaap:OtherAssetsMemberus-gaap:DesignatedAsHedgingInstrumentMember2022-12-310001740332us-gaap:AccumulatedGainLossNetCashFlowHedgeParentMember2023-01-012023-09-300001740332us-gaap:AccumulatedGainLossNetCashFlowHedgeParentMember2022-01-012022-12-310001740332us-gaap:AccumulatedGainLossNetCashFlowHedgeParentMember2023-07-010001740332us-gaap:AccumulatedGainLossNetCashFlowHedgeParentMember2022-07-020001740332us-gaap:AccumulatedGainLossNetCashFlowHedgeParentMember2022-12-310001740332us-gaap:AccumulatedGainLossNetCashFlowHedgeParentMember2021-12-310001740332us-gaap:AccumulatedGainLossNetCashFlowHedgeParentMember2023-07-022023-09-300001740332us-gaap:AccumulatedGainLossNetCashFlowHedgeParentMember2022-07-032022-10-010001740332us-gaap:AccumulatedGainLossNetCashFlowHedgeParentMember2022-01-012022-10-010001740332us-gaap:AccumulatedGainLossNetCashFlowHedgeParentMember2023-09-300001740332us-gaap:AccumulatedGainLossNetCashFlowHedgeParentMember2022-10-010001740332rezi:AAndRTermBFacilityMember2023-09-300001740332rezi:AAndRTermBFacilityMember2022-12-310001740332us-gaap:FairValueInputsLevel2Memberus-gaap:FairValueMeasurementsRecurringMember2023-09-300001740332us-gaap:FairValueInputsLevel2Memberus-gaap:FairValueMeasurementsRecurringMember2022-12-310001740332rezi:HoneywellMemberus-gaap:IndemnificationGuaranteeMember2018-10-292018-10-290001740332srt:MaximumMemberrezi:HoneywellMemberus-gaap:IndemnificationGuaranteeMember2018-10-290001740332rezi:ReimbursementAgreementMemberrezi:HoneywellMember2022-12-310001740332rezi:HoneywellMemberrezi:TaxMattersAgreementMember2022-12-310001740332rezi:HoneywellMember2022-12-310001740332rezi:ReimbursementAgreementMemberrezi:HoneywellMember2023-01-012023-09-300001740332rezi:HoneywellMemberrezi:TaxMattersAgreementMember2023-01-012023-09-300001740332rezi:HoneywellMember2023-01-012023-09-300001740332rezi:ReimbursementAgreementMemberrezi:HoneywellMember2023-09-300001740332rezi:HoneywellMemberrezi:TaxMattersAgreementMember2023-09-300001740332rezi:HoneywellMember2023-09-300001740332us-gaap:IndemnificationGuaranteeMember2023-09-300001740332rezi:HoneywellMemberus-gaap:AccountsPayableAndAccruedLiabilitiesMember2023-09-300001740332rezi:HoneywellMemberus-gaap:AccountsPayableAndAccruedLiabilitiesMember2022-12-310001740332rezi:HoneywellMemberrezi:ObligationsPayableUnderIndemnificationAgreementsMember2023-09-300001740332rezi:HoneywellMemberrezi:ObligationsPayableUnderIndemnificationAgreementsMember2022-12-310001740332us-gaap:OtherExpenseMember2023-07-022023-09-300001740332us-gaap:OtherExpenseMember2023-01-012023-09-300001740332us-gaap:OtherExpenseMember2022-07-032022-10-010001740332us-gaap:OtherExpenseMember2022-01-012022-10-010001740332rezi:TrademarkLicenseAgreementMemberrezi:HoneywellMember2023-07-022023-09-300001740332rezi:TrademarkLicenseAgreementMemberrezi:HoneywellMember2023-01-012023-09-300001740332rezi:TrademarkLicenseAgreementMemberrezi:HoneywellMember2022-07-032022-10-010001740332rezi:TrademarkLicenseAgreementMemberrezi:HoneywellMember2022-01-012022-10-0100017403322022-11-172022-11-1700017403322023-02-030001740332rezi:OptionsAndOtherRightsMember2023-07-022023-09-300001740332rezi:OptionsAndOtherRightsMember2023-01-012023-09-300001740332rezi:PerformanceBasedUnitAwardsMember2023-07-022023-09-300001740332rezi:PerformanceBasedUnitAwardsMember2023-01-012023-09-300001740332rezi:OptionsAndOtherRightsMember2022-07-032022-10-010001740332rezi:OptionsAndOtherRightsMember2022-01-012022-10-010001740332rezi:PerformanceBasedUnitAwardsMember2022-07-032022-10-010001740332rezi:PerformanceBasedUnitAwardsMember2022-01-012022-10-0100017403322023-08-030001740332us-gaap:CommonStockMember2023-07-022023-09-30
UNITED STATES
SECURITIES AND EXCHANGE COMMISSION
Washington, D.C. 20549
FORM 10-Q
(Mark One)
☒ QUARTERLY REPORT PURSUANT TO SECTION 13 OR 15(d) OF THE SECURITIES EXCHANGE ACT OF 1934
For the quarterly period ended September 30, 2023
or
☐ TRANSITION REPORT PURSUANT TO SECTION 13 OR 15(d) OF THE SECURITIES EXCHANGE ACT OF 1934
For the transition period from ______ to _____
Commission File Number 001-38635
Resideo Technologies, Inc.
(Exact name of registrant as specified in its charter)
| | | | | | | | |
| Delaware | | 82-5318796 |
| (State or other jurisdiction of incorporation or organization) | | (I.R.S. Employer Identification No.) |
| | | |
16100 N. 71st Street, Suite 550 Scottsdale, Arizona | | 85254 |
| (Address of principal executive offices) | | (Zip Code) |
| | |
(480) 573-5340 |
| (Registrant’s telephone number, including area code) |
Securities registered pursuant to Section 12(b) of the Act:
| | | | | | | | | | | | | | |
| Title of each class: | | Trading Symbol: | | Name of each exchange on which registered: |
| Common Stock, par value $0.001 per share | | REZI | | New York Stock Exchange |
Indicate by check mark whether the registrant (1) has filed all reports required to be filed by Section 13 or 15(d) of the Securities Exchange Act of 1934 during the preceding 12 months (or for such shorter period that the registrant was required to file such reports), and (2) has been subject to such filing requirements for the past 90 days. Yes ☒ No ☐
Indicate by check mark whether the registrant has submitted electronically every Interactive Data File required to be submitted pursuant to Rule 405 of Regulation S-T (§ 232.405 of this chapter) during the preceding 12 months (or for such shorter period that the registrant was required to submit such files). Yes ☒ No ☐
Indicate by check mark whether the registrant is a large accelerated filer, an accelerated filer, a non-accelerated filer, a smaller reporting company, or an emerging growth company. See the definitions of “large accelerated filer,” “accelerated filer,” “smaller reporting company,” and “emerging growth company” in Rule 12b-2 of the Exchange Act.
| | | | | | | | | | | |
| Large accelerated filer | ☒ | Accelerated filer | ☐ |
| Non-accelerated filer | ☐ | Smaller reporting company | ☐ |
| | Emerging growth company | ☐ |
If an emerging growth company, indicate by check mark if the registrant has elected not to use the extended transition period for complying with any new or revised financial accounting standards provided pursuant to Section 13(a) of the Exchange Act. ☐
Indicate by check mark whether the registrant is a shell company (as defined in Rule 12b-2 of the Exchange Act). Yes ☐ No ☒
The number of shares outstanding of the registrant’s common stock, par value $0.001 per share, as of October 20, 2023 was 146,087,992 shares.
TABLE OF CONTENTS
Part I. Financial Information
Item 1. Unaudited Consolidated Financial Statements.
Resideo Technologies, Inc.
Consolidated Balance Sheets
(Unaudited)
| | | | | | | | | | | |
| (in millions, except par value) | September 30, 2023 | | December 31, 2022 |
| ASSETS | | | |
| Current assets: | | | |
| Cash and cash equivalents | $ | 368 | | | $ | 326 | |
| Accounts receivable, net | 988 | | | 1,002 | |
| Inventories, net | 970 | | | 975 | |
| Other current assets | 289 | | | 199 | |
| | | |
| Total current assets | 2,615 | | | 2,502 | |
| | | |
| Property, plant and equipment, net | 380 | | | 366 | |
| Goodwill | 2,687 | | | 2,724 | |
| Intangible assets, net | 456 | | | 475 | |
| Other assets | 321 | | | 320 | |
| | | |
| Total assets | $ | 6,459 | | | $ | 6,387 | |
| | | |
| LIABILITIES AND STOCKHOLDERS’ EQUITY | | | |
| Current liabilities: | | | |
| Accounts payable | $ | 863 | | | $ | 894 | |
| Current portion of long-term debt | 12 | | | 12 | |
| Accrued liabilities | 592 | | | 640 | |
| | | |
| Total current liabilities | 1,467 | | | 1,546 | |
| | | |
| Long-term debt | 1,397 | | | 1,404 | |
| Obligations payable under Indemnification Agreements | 599 | | | 580 | |
| Other liabilities | 351 | | | 328 | |
| | | |
| Total liabilities | 3,814 | | | 3,858 | |
| | | |
| COMMITMENTS AND CONTINGENCIES | | | |
| | | |
| Stockholders’ equity | | | |
| | | |
Common stock, $0.001 par value: 700 shares authorized, 151 and 146 shares issued and outstanding at September 30, 2023, respectively, and 148 and 146 shares issued and outstanding at December 31, 2022, respectively | — | | | — | |
| Additional paid-in capital | 2,219 | | | 2,176 | |
| Retained earnings | 728 | | | 600 | |
| Accumulated other comprehensive loss, net | (221) | | | (212) | |
| Treasury stock at cost | (81) | | | (35) | |
| Total stockholders’ equity | 2,645 | | | 2,529 | |
| Total liabilities and stockholders’ equity | $ | 6,459 | | | $ | 6,387 | |
Refer to accompanying Notes to the Unaudited Consolidated Financial Statements.
Resideo Technologies, Inc.
Consolidated Statements of Operations
(Unaudited)
| | | | | | | | | | | | | | | | | | | | | | | |
| Three Months Ended | | Nine Months Ended |
| (in millions, except per share data) | September 30, 2023 | | October 1, 2022 | | September 30, 2023 | | October 1, 2022 |
| Net revenue | $ | 1,554 | | | $ | 1,618 | | | $ | 4,705 | | | $ | 4,810 | |
| Cost of goods sold | 1,137 | | | 1,188 | | | 3,432 | | | 3,475 | |
| Gross profit | 417 | | | 430 | | | 1,273 | | | 1,335 | |
| Operating expenses: | | | | | | | |
| Research and development expenses | 28 | | | 29 | | | 84 | | | 81 | |
| Selling, general and administrative expenses | 233 | | | 236 | | | 719 | | | 716 | |
| Intangible asset amortization | 9 | | | 10 | | | 28 | | | 25 | |
| Restructuring and impairment expenses | 38 | | | — | | | 42 | | | — | |
| Total operating expenses | 308 | | | 275 | | | 873 | | | 822 | |
| Income from operations | 109 | | | 155 | | | 400 | | | 513 | |
| Other expenses, net | 56 | | | 44 | | | 138 | | | 126 | |
| Interest expense, net | 16 | | | 15 | | | 50 | | | 39 | |
| Income before taxes | 37 | | | 96 | | | 212 | | | 348 | |
| Provision for income taxes | 16 | | | 33 | | | 84 | | | 104 | |
| | | | | | | |
| | | | | | | |
| Net income | $ | 21 | | | $ | 63 | | | $ | 128 | | | $ | 244 | |
| | | | | | | |
| | | | | | | |
| | | | | | | |
| | | | | | | |
| | | | | | | |
| Earnings per share: | | | | | | | |
| Basic | $ | 0.14 | | | $ | 0.43 | | | $ | 0.87 | | | $ | 1.68 | |
| | | | | | | |
| | | | | | | |
| | | | | | | |
| | | | | | | |
| Diluted | $ | 0.14 | | | $ | 0.42 | | | $ | 0.86 | | | $ | 1.64 | |
| | | | | | | |
| Weighted average number of shares outstanding: | | | | | | | |
| Basic | 147 | | 146 | | 147 | | 145 |
| Diluted | 148 | | 149 | | 149 | | 149 |
Refer to accompanying Notes to the Unaudited Consolidated Financial Statements.
Resideo Technologies, Inc.
Consolidated Statements of Comprehensive Income (Loss)
(Unaudited)
| | | | | | | | | | | | | | | | | | | | | | | |
| Three Months Ended | | Nine Months Ended |
| (in millions) | September 30, 2023 | | October 1, 2022 | | September 30, 2023 | | October 1, 2022 |
| Comprehensive income (loss): | | | | | | | |
| Net income | $ | 21 | | | $ | 63 | | | $ | 128 | | | $ | 244 | |
| Other comprehensive loss, net of tax: | | | | | | | |
| Foreign exchange translation loss | (37) | | | (86) | | | (11) | | | (165) | |
| | | | | | | |
| | | | | | | |
| | | | | | | |
| | | | | | | |
| | | | | | | |
| Pension liability adjustments | 2 | | | — | | | 6 | | | — | |
| | | | | | | |
| | | | | | | |
| | | | | | | |
| Changes in fair value of effective cash flow hedges | (2) | | | 14 | | | (4) | | | 38 | |
| Total other comprehensive loss, net of tax | (37) | | | (72) | | | (9) | | | (127) | |
| Comprehensive income (loss) | $ | (16) | | | $ | (9) | | | $ | 119 | | | $ | 117 | |
Refer to accompanying Notes to the Unaudited Consolidated Financial Statements.
Resideo Technologies, Inc.
Consolidated Statements of Cash Flows
(Unaudited)
| | | | | | | | | | | | | |
| Nine Months Ended | | |
| (in millions) | September 30, 2023 | | October 1, 2022 | | |
| Cash Flows From Operating Activities: | | | | | |
| Net income | $ | 128 | | | $ | 244 | | | |
| Adjustments to reconcile net income to net cash in operating activities: | | | | | |
| | | | | |
| Depreciation and amortization | 71 | | | 69 | | | |
| Restructuring and impairment expenses | 42 | | | — | | | |
| Stock-based compensation expense | 36 | | | 36 | | | |
| | | | | |
| Other, net | 2 | | | 8 | | | |
| | | | | |
| Changes in assets and liabilities, net of acquired companies: | | | | | |
| Accounts receivable, net | (9) | | | (142) | | | |
| Inventories, net | (4) | | | (129) | | | |
| Other current assets | (5) | | | (38) | | | |
| | | | | |
| Accounts payable | (14) | | | 5 | | | |
| Accrued liabilities | (114) | | | (25) | | | |
| Other, net | 44 | | | (15) | | | |
| | | | | |
| | | | | |
| Net cash provided by operating activities | 177 | | | 13 | | | |
| Cash Flows From Investing Activities: | | | | | |
| Capital expenditures | (74) | | | (34) | | | |
| Acquisitions, net of cash acquired | (16) | | | (660) | | | |
| Other investing activities, net | — | | | (13) | | | |
| | | | | |
| | | | | |
| Net cash used in investing activities | (90) | | | (707) | | | |
| Cash Flows From Financing Activities: | | | | | |
| Common stock repurchases | (28) | | | — | | | |
| Proceeds from issuance of A&R Term B Facility | — | | | 200 | | | |
| Repayments of long-term debt | (9) | | | (9) | | | |
| | | | | |
| Other financing activities, net | (10) | | | (9) | | | |
| | | | | |
| | | | | |
| | | | | |
| Net cash (used in) provided by financing activities | (47) | | | 182 | | | |
| Effect of foreign exchange rate changes on cash, cash equivalents and restricted cash | 1 | | | (12) | | | |
| Net increase (decrease) in cash, cash equivalents and restricted cash | 41 | | | (524) | | | |
| Cash, cash equivalents and restricted cash at beginning of period | 329 | | | 779 | | | |
| Cash, cash equivalents and restricted cash at end of period | $ | 370 | | | $ | 255 | | | |
| | | | | |
| Supplemental Cash Flow Information: | | | | | |
| Interest paid | $ | 81 | | | $ | 38 | | | |
| Taxes paid, net of refunds | $ | 104 | | | $ | 129 | | | |
| Capital expenditures in accounts payable | $ | 19 | | | $ | 18 | | | |
Refer to accompanying Notes to the Unaudited Consolidated Financial Statements.
Resideo Technologies, Inc.
Consolidated Statements of Stockholders’ Equity
(Unaudited)
| | | | | | | | | | | | | | | | | | | | | | | | | | | | | | | | | | | | | | | | | | | | | | | |
| Fiscal Quarters | Common Stock | | | | | | Accumulated Other
Comprehensive Loss | | Treasury Stock | | |
| (in millions, except shares in thousands) | Shares | | Amount | | Additional
Paid-In Capital | | Retained
Earnings | | | Shares | | Amount | | Total Stockholders’
Equity |
| Balance at July 2, 2023 | 147,649 | | | $ | — | | | $ | 2,204 | | | $ | 707 | | | $ | (184) | | | 2,902 | | | $ | (50) | | | $ | 2,677 | |
| Net income | — | | | — | | | — | | | 21 | | | — | | | — | | | — | | | 21 | |
| Other comprehensive loss, net of tax | — | | | — | | | — | | | — | | | (37) | | | — | | | — | | | (37) | |
| Common stock issuance, net of shares withheld for taxes | 284 | | | — | | | 4 | | | — | | | — | | | 71 | | | (1) | | | 3 | |
| Stock-based compensation expense | — | | | — | | | 11 | | | — | | | — | | | — | | | — | | | 11 | |
| Common stock repurchases | (1,840) | | | — | | | — | | | — | | | — | | | 1,840 | | | (30) | | | (30) | |
| Balance at September 30, 2023 | 146,093 | | | $ | — | | | $ | 2,219 | | | $ | 728 | | | $ | (221) | | | 4,813 | | | $ | (81) | | | $ | 2,645 | |
| | | | | | | | | | | | | | | |
| Balance at July 3, 2022 | 145,684 | | | $ | — | | | $ | 2,147 | | | $ | 498 | | | $ | (220) | | | 1,844 | | | $ | (31) | | | $ | 2,394 | |
| Net income | — | | | — | | | — | | | 63 | | | — | | | — | | | — | | | 63 | |
| Other comprehensive loss, net of tax | — | | | — | | | — | | | — | | | (72) | | | — | | | — | | | (72) | |
| Common stock issuance, net of shares withheld for taxes | 154 | | | — | | | 2 | | | — | | | — | | | 21 | | | — | | | 2 | |
| Stock-based compensation expense | — | | | — | | | 13 | | | — | | | — | | | — | | | — | | | 13 | |
| | | | | | | | | | | | | | | |
| Balance at October 1, 2022 | 145,838 | | | $ | — | | | $ | 2,162 | | | $ | 561 | | | $ | (292) | | | 1,865 | | | $ | (31) | | | $ | 2,400 | |
| | | | | | | | | | | | | | | | | | | | | | | | | | | | | | | | | | | | | | | | | | | | | | | |
| Fiscal Year to Date Periods | Common Stock | | | | | | Accumulated Other
Comprehensive Loss | | Treasury Stock | | |
| (in millions, except shares in thousands) | Shares | | Amount | | Additional
Paid-In Capital | | Retained
Earnings | | | Shares | | Amount | | Total Stockholders’
Equity |
| Balance at January 1, 2023 | 146,222 | | | $ | — | | | $ | 2,176 | | | $ | 600 | | | $ | (212) | | | 2,050 | | | $ | (35) | | | $ | 2,529 | |
| Net income | — | | | — | | | — | | | 128 | | | — | | | — | | | — | | | 128 | |
| Other comprehensive loss, net of tax | — | | | — | | | — | | | — | | | (9) | | | — | | | — | | | (9) | |
| Common stock issuance, net of shares withheld for taxes | 1,711 | | | — | | | 7 | | | — | | | — | | | 923 | | | (16) | | | (9) | |
| Stock-based compensation expense | — | | | — | | | 36 | | | — | | | — | | | — | | | — | | | 36 | |
| Common stock repurchases | (1,840) | | | — | | | — | | | — | | | — | | | 1,840 | | | (30) | | | (30) | |
| Balance at September 30, 2023 | 146,093 | | | $ | — | | | $ | 2,219 | | | $ | 728 | | | $ | (221) | | | 4,813 | | | $ | (81) | | | $ | 2,645 | |
| | | | | | | | | | | | | | | |
| Balance at January 1, 2022 | 144,808 | | | $ | — | | | $ | 2,121 | | | $ | 317 | | | $ | (165) | | | 1,440 | | | $ | (21) | | | $ | 2,252 | |
| Net income | — | | | — | | | — | | | 244 | | | — | | | — | | | — | | | 244 | |
| Other comprehensive loss, net of tax | — | | | — | | | — | | | — | | | (127) | | | — | | | — | | | (127) | |
| Common stock issuance, net of shares withheld for taxes | 1,030 | | | — | | | 5 | | | — | | | — | | | 425 | | | (10) | | | (5) | |
| Stock-based compensation expense | — | | | — | | | 36 | | | — | | | — | | | — | | | — | | | 36 | |
| | | | | | | | | | | | | | | |
| Balance at October 1, 2022 | 145,838 | | | $ | — | | | $ | 2,162 | | | $ | 561 | | | $ | (292) | | | 1,865 | | | $ | (31) | | | $ | 2,400 | |
Refer to accompanying Notes to the Unaudited Consolidated Financial Statements.
Resideo Technologies, Inc.
Notes to Consolidated Financial Statements
(Unaudited)
Note 1. Nature of Operations and Basis of Presentation
Nature of Operations
Resideo Technologies, Inc. (“Resideo”, the “Company”, “we”, “us”, or “our”) is a leading manufacturer and developer of technology-driven products that provide critical comfort, energy, smoke and carbon monoxide detection home safety products, and security solutions to homes globally. We are also a leading wholesale distributor of low-voltage security products including access control, fire detection, fire suppression, security, and video products, and participate significantly in the broader related markets of audio, communications, data communications, networking, power, ProAV, smart home, and wire and cable. Our global footprint serves both commercial and residential end markets.
Basis of Consolidation and Reporting
The accompanying Unaudited Consolidated Financial Statements have been prepared in accordance with United States (“U.S.”) generally accepted accounting principles (“GAAP”) for interim financial information and with the instructions to Form 10-Q and Article 10 of Regulation S-X. Accordingly, the Unaudited Consolidated Financial Statements do not include all of the information and notes required by GAAP for complete financial statements. In the opinion of management, the Unaudited Consolidated Financial Statements included herein contain all adjustments, which consist of normal recurring adjustments, necessary to fairly present our financial position, results of operations and cash flows for the periods indicated. Operating results for the period from January 1, 2023 through September 30, 2023 are not necessarily indicative of the results that may be expected for the fiscal year ending December 31, 2023.
For additional information, refer to the consolidated financial statements and notes thereto included in our Annual Report on Form 10-K for the fiscal year ended December 31, 2022 (the “2022 Annual Report on Form 10-K”), filed with the United States Securities and Exchange Commission (the “SEC”) on February 21, 2023.
Reporting Period
We report financial information on a fiscal quarter basis using a modified four-four-five week calendar. Our fiscal calendar begins on January 1 and ends on December 31. We have elected the first, second and third quarters to end on a Saturday in order to not disrupt business processes. The effects of this election are generally not significant to reported results for any quarter and only exist within a reporting year.
Reclassification
For the purpose of comparability, certain prior period amounts have been reclassified to conform to current period classification.
Assets and Liabilities Held for Sale
On September 19 2023, we announced that we entered into a definitive agreement to sell the Genesis Wire & Cable (“Genesis”) business in a cash transaction to Southwire Company, LLC (the “buyer”) for $87.5 million, subject to customary adjustments. Genesis is reported within the Products and Solutions Segment. The divestiture does not represent a strategic shift, nor will it have a significant impact on our Unaudited Consolidated Statements of Operations. As such, we have reclassified the related assets and liabilities to held for sale within other current assets and accrued liabilities, respectively, on the Unaudited Consolidated Balance Sheets. The estimated fair value less costs exceeds the carrying amount for Genesis, therefore no impairment was recognized for the three and nine months ended September 30, 2023. The transaction closed in October 2023.
Resideo Technologies, Inc.
Notes to Consolidated Financial Statements
(Unaudited)
The following is a summary of the major categories of assets and liabilities that have been classified as held for sale within other current assets and accrued liabilities on the Unaudited Consolidated Balance Sheets at September 30, 2023:
| | | | | |
| (in millions) | September 30, 2023 |
| Accounts receivables, net | $ | 20 | |
| Inventories, net | 14 | |
| Property, plant and equipment, net | 7 | |
| Goodwill | 40 | |
| Other assets | 5 | |
| Total assets held for sale | $ | 86 | |
| |
| Accounts payable | $ | 18 | |
| Accrued liabilities | 8 | |
| Other liabilities | 5 | |
| Total liabilities held for sale | $ | 31 | |
Note 2. Summary of Significant Accounting Policies
Our significant accounting policies are detailed in Note 2. Summary of Significant Accounting Policies of the Annual Report on Form 10-K for the year ended December 31, 2022. There have been no significant changes to these policies that have had a material impact on the Unaudited Consolidated Financial Statements and accompanying notes for the three and nine months ended September 30, 2023.
We consider the applicability and impact of all recent accounting standards updates (“ASUs”) issued by the Financial Accounting Standards Board (“FASB”) and disclose only those that may have a material impact.
Adopted Accounting Pronouncements
In March 2020, the FASB issued ASU 2020-04, Reference Rate Reform (Topic 848): Facilitation of the Effects of Reference Rate Reform on Financial Reporting, and subsequent amendment to the initial guidance: ASU 2021-01, Reference Rate Reform (Topic 848): Scope (collectively, “Topic 848”). Topic 848 provides optional expedients and exceptions for applying GAAP to contracts, hedging relationships, and other transactions affected by reference rate reform if certain criteria are met. The amendments apply only to contracts, hedging relationships, and other transactions that reference London Interbank Offered Rate (“LIBOR”) or another reference rate expected to be discontinued because of reference rate reform. In December 2022, the FASB issued ASU 2022-06, Reference Rate Reform (Topic 848): Deferral of the Sunset Date of Topic 848. ASU 2022-06 defers the sunset date of Topic 848 from December 31, 2022 to December 31, 2024. This guidance may be applied prospectively to contract modifications made and hedging relationships entered into or evaluated on or before December 31, 2024. The impact of the adoption of this standard on our financial statements and related disclosures, including accounting policies, processes, and systems, was not material. Refer to Note 12. Long-Term Debt and Note 13. Derivative Financial Instruments to the Unaudited Consolidated Financial Statements for further discussion.
Note 3. Acquisitions
Pro forma results of operations for the following acquisitions have not been presented, as the impacts on our consolidated financial results were not material.
2023 Acquisitions
Sfty SA—On August 9, 2023, we acquired 100% of the outstanding equity of Sfty SA, a developer of cloud-based services providing alerts to multifamily homes and property managers with smoke, carbon monoxide and water leak detection
Resideo Technologies, Inc.
Notes to Consolidated Financial Statements
(Unaudited)
products. We report Sfty SA’s results within the Products and Solutions segment. We have made a preliminary purchase price allocation that is subject to change as additional information is obtained.
BTX Technologies, Inc.—On January 23, 2023, we acquired 100% of the outstanding equity of BTX Technologies, Inc., (“BTX”) a leading distributor of professional audio, video, data communications, and broadcast equipment. We report BTX’s results within the ADI Global Distribution segment. We have made a preliminary purchase price allocation that is subject to change as additional information is obtained.
2022 Acquisitions
Teknique Limited—On December 23, 2022, we acquired 100% of the outstanding equity of Teknique Limited, a developer and producer of edge-based, artificial intelligence-enabled video camera solutions. We report Teknique Limited’s results within the Products and Solutions segment. Purchase consideration included cash and a note payable with the former owner. We have made a preliminary purchase price allocation that is subject to change as additional information is obtained.
Electronic Custom Distributors, Inc.—On July 5, 2022, we acquired 100% of the outstanding equity of Electronic Custom Distributors, Inc., a regional distributor of residential audio, video, automation, security, wire and telecommunication products. We report Electronic Customer Distributors, Inc.’s results within the ADI Global Distribution segment. We completed the accounting for the acquisition during the first quarter of 2023, which did not result in any adjustments.
First Alert, Inc.—On March 31, 2022, we acquired 100% of the outstanding equity of First Alert, Inc., a leading provider of home safety products. We report First Alert, Inc.’s results within the Products and Solutions segment. We completed the accounting for the acquisition during the first quarter of 2023, which did not result in any adjustments.
Note 4. Segment Financial Data
We monitor our business operations through our two operating segments: Products and Solutions and ADI Global Distribution.
These operating segments follow the same accounting policies used for the financial statements. We evaluate a segment’s performance on a GAAP basis, primarily operating income before corporate expenses.
Corporate expenses relate to functions within the corporate office that support the operating segments such as acquisition-related costs, legal, tax, treasury, human resources, IT, strategy, accounting, communications, innovation, business development, facilities management, corporate travel expenses and other executive costs. Additionally, included within Corporate are unallocated non-operating items such as pension expense, Reimbursement Agreement expense, interest income, interest expense, and other income (expense).
Segment information is consistent with how management reviews the businesses, makes investing and resource allocation decisions, and assesses operating performance.
The following table represents summary financial data attributable to the segments:
| | | | | | | | | | | | | | | | | | | | | | | |
| Three Months Ended | | Nine Months Ended |
| (in millions) | September 30, 2023 | | October 1, 2022 | | September 30, 2023 | | October 1, 2022 |
| Net revenue | | | | | | | |
| Products and Solutions | $ | 654 | | | $ | 707 | | | $ | 1,989 | | | $ | 2,090 | |
| ADI Global Distribution | 900 | | | 911 | | | 2,716 | | | 2,720 | |
| Total net revenue | $ | 1,554 | | | $ | 1,618 | | | $ | 4,705 | | | $ | 4,810 | |
Resideo Technologies, Inc.
Notes to Consolidated Financial Statements
(Unaudited)
| | | | | | | | | | | | | | | | | | | | | | | |
| Three Months Ended | | Nine Months Ended |
| (in millions) | September 30, 2023 | | October 1, 2022 | | September 30, 2023 | | October 1, 2022 |
| Income from operations | | | | | | | |
| Products and Solutions | $ | 107 | | | $ | 124 | | | $ | 352 | | | $ | 431 | |
| ADI Global Distribution | 60 | | | 78 | | | 211 | | | 244 | |
| Corporate | (58) | | | (47) | | | (163) | | | (162) | |
| Total income from operations | $ | 109 | | | $ | 155 | | | $ | 400 | | | $ | 513 | |
The Company’s Chief Executive Officer, its Chief Operating Decision Maker, does not use segment assets information to allocate resources or to assess performance of the segments and therefore, total segment assets have not been reported.
Note 5. Revenue Recognition
We have two operating segments, Products and Solutions and ADI Global Distribution. Disaggregated revenue information for Products and Solutions is presented by product grouping, while ADI Global Distribution is presented by region.
The following table presents revenue by business line and geographic location, as we believe this presentation best depicts how the nature, amount, timing, and uncertainty of net revenue and cash flows are affected by economic factors:
| | | | | | | | | | | | | | | | | | | | | | | |
| Three Months Ended | | Nine Months Ended |
| (in millions) | September 30, 2023 | | October 1, 2022 | | September 30, 2023 | | October 1, 2022 |
| Products and Solutions | | | | | | | |
| Air | $ | 211 | | | $ | 245 | | | $ | 640 | | | $ | 721 | |
| Safety and Security | 245 | | | 248 | | | 721 | | | 670 | |
| Energy | 123 | | | 142 | | | 391 | | | 455 | |
| Water | 75 | | | 72 | | | 237 | | | 244 | |
| Total Products and Solutions | 654 | | | 707 | | | 1,989 | | | 2,090 | |
| | | | | | | |
| ADI Global Distribution | | | | | | | |
| U.S. and Canada | 780 | | | 792 | | | 2,354 | | | 2,335 | |
EMEA (1) | 120 | | | 111 | | | 362 | | | 360 | |
APAC (2) | — | | | 8 | | | — | | | 25 | |
| Total ADI Global Distribution | 900 | | | 911 | | | 2,716 | | | 2,720 | |
| | | | | | | |
| Total net revenue | $ | 1,554 | | | $ | 1,618 | | | $ | 4,705 | | | $ | 4,810 | |
(1)EMEA represents Europe, the Middle East and Africa.
(2)APAC represents Asia and Pacific countries.
Note 6. Restructuring
During the third quarter of 2023, we initiated additional restructuring programs (“2023 Plan”) in order to align our cost structure with market conditions. For the three and nine months ended September 30, 2023, we recognized restructuring and impairment expenses of $38 million and $42 million, respectively. These expenses primarily related to workforce reductions.
Restructuring and impairment expenses recognized were $25 million in the Product and Solutions segment, $10 million in the ADI Global Distribution segment and $3 million in the Corporate segment, respectively, for the three months ended September 30, 2023, and $27 million in the Product and Solutions segment, $12 million in the ADI Global Distribution
Resideo Technologies, Inc.
Notes to Consolidated Financial Statements
(Unaudited)
segment and $3 million in the Corporate segment, respectively, for the nine months ended September 30, 2023. No restructuring and impairment expenses were recognized for the three and nine months ended October 1, 2022.
In 2022, we initiated certain restructuring programs to lower costs, increase gross and operating margins and position us for growth. Refer to Note 6. Restructuring Expenses in our 2022 Annual Report on Form 10-K for further discussion of our 2022 restructuring programs.
We expect to fully execute our restructuring initiatives and programs over the next 12 to 24 months, and we may incur future additional restructuring expenses associated with these plans. We are unable at this time to make a good faith determination of cost estimates, or ranges of cost estimates, associated with future phases of the plans or the total costs we may incur in connection with these plans.
The following table summarizes the status of our restructuring expenses included within accrued liabilities on the Unaudited Consolidated Balance Sheets.
| | | | | | | | | | | |
| Nine Months Ended | | Twelve Months Ended |
| (in millions) | September 30, 2023 | | December 31, 2022 |
| Beginning of period | $ | 27 | | | $ | 9 | |
| Charges | 36 | | | 26 | |
Usage (1) | (22) | | | (5) | |
| Other | — | | | (3) | |
| End of period | $ | 41 | | | $ | 27 | |
(1) Usage primarily relates to cash payments associated with employee termination costs.
Note 7. Pension Plans
As a result of a voluntary lump sum window offering and the purchase of a group annuity contract that transferred a portion of the assets and liabilities to an insurance company during the first quarter of 2023, we triggered settlement accounting and performed a remeasurement of our U.S. qualified defined benefit pension plan. As a result, we recognized non-cash pension settlement losses within other expense, net in the Unaudited Consolidated Statements of Operations of $3 million and $6 million for the three and nine months ended September 30, 2023, respectively. The loss for the three months ended September 30, 2023 is mainly related to an adjustment to our estimate of the losses from settlements that occurred during the first quarter of 2023. The corresponding remeasurement of our U.S. qualified defined benefit pension plan resulted in decreases of $80 million in plan assets and $75 million in liabilities for the nine months ended September 30, 2023.
Note 8. Stock-Based Compensation Plans
The Stock Incentive Plans, which consists of the Amended and Restated 2018 Stock Incentive Plan of Resideo Technologies, Inc. and its Affiliates and the 2018 Stock Incentive Plan for Non-Employee Directors of Resideo Technologies, Inc., provide for the grant of stock options, stock appreciation rights, restricted stock units, restricted stock, and other stock-based awards.
During the second quarter of 2023, the Amended and Restated 2018 Stock Incentive Plan of Resideo Technologies, Inc. and its Affiliates was further amended to increase the number of shares of our common stock available for issuance by 3.5 million shares for an aggregate of 19.5 million shares with no more than 7.5 million shares being available for grant in the form of stock options.
A summary of awards granted as part of our annual long-term compensation follows:
Resideo Technologies, Inc.
Notes to Consolidated Financial Statements
(Unaudited)
| | | | | | | | | | | | | | | | | | | | | | | |
| Nine Months Ended September 30, 2023 | | Nine Months Ended October 1, 2022 |
| Number of Stock Units Granted | | Weighted average grant date fair value per share | | Number of Stock Units Granted | | Weighted average grant date fair value per share |
Performance Stock Units (“PSUs”) | 553,071 | | $ | 29.89 | | | 669,551 | | $ | 36.11 | |
Restricted Stock Units (“RSUs”) | 2,232,465 | | $ | 18.85 | | | 1,711,282 | | $ | 22.68 | |
Annual RSU awards to our key employees generally have a three-year service or performance period. RSU awards to our non-employee directors have a one-year service period. The fair value is determined at the grant date. PSUs granted in 2023 were issued with the shares awarded per unit being based on the difference in performance between the total stockholders’ return of our common stock against that of the S&P 600 Industrials Index. PSUs granted prior to 2023 were issued with the shares awarded per unit being based on the difference in performance between the total stockholders’ return of our common stock against that of the S&P 400 Industrials Index.
Stock-based compensation expense, net of tax was $11 million and $36 million for the three and nine months ended September 30, 2023, respectively. For the three and nine months ended October 1, 2022, stock-based compensation expense, net of tax was $13 million and $36 million, respectively.
Note 9. Inventories, net
The following table summarizes the details of our inventories, net:
| | | | | | | | | | | | | | |
| (in millions) | | September 30, 2023 | | December 31, 2022 |
| Raw materials | | $ | 229 | | | $ | 251 | |
| Work in process | | 21 | | | 25 | |
| Finished products | | 720 | | | 699 | |
| | | | |
| | | | |
| Total inventories, net | | $ | 970 | | | $ | 975 | |
Note 10. Goodwill and Intangible Assets, net
Our goodwill balance and changes in carrying value by segment are as follows:
| | | | | | | | | | | | | | | | | |
| (in millions) | Products and Solutions | | ADI Global Distribution | | Total |
Balance at December 31, 2022 | $ | 2,072 | | | $ | 652 | | | $ | 2,724 | |
| Acquisitions | 10 | | | 3 | | | 13 | |
Adjustments(1) | (42) | | | — | | | (42) | |
| | | | | |
| | | | | |
| Impact of foreign currency translation | (6) | | | (2) | | | (8) | |
| Balance at September 30, 2023 | $ | 2,034 | | | $ | 653 | | | $ | 2,687 | |
(1) Primarily relates to the divestiture of our Genesis business as discussed in Note 1. Nature of Operations and Basis of Presentation.
The following table summarizes the net carrying amount of intangible assets:
| | | | | | | | | | | |
| (in millions) | September 30, 2023 | | December 31, 2022 |
| Intangible assets subject to amortization | $ | 276 | | | $ | 295 | |
| Indefinite-lived intangible assets | 180 | | | 180 | |
| Total intangible assets | $ | 456 | | | $ | 475 | |
Resideo Technologies, Inc.
Notes to Consolidated Financial Statements
(Unaudited)
Intangible assets subject to amortization consisted of the following:
| | | | | | | | | | | | | | | | | | | | | | | | | | | | | | | | | | | | | | | |
| September 30, 2023 | | December 31, 2022 | | | | |
| (in millions) | Gross
Carrying
Amount | | Accumulated
Amortization | | Net
Carrying
Amount | | Gross
Carrying
Amount | | Accumulated
Amortization | | Net
Carrying
Amount | | | | |
| Patents and technology | $ | 57 | | | $ | (23) | | | $ | 34 | | | $ | 65 | | | $ | (28) | | | $ | 37 | | | | | |
| Customer relationships | 311 | | | (129) | | | 182 | | | 313 | | | (117) | | | 196 | | | | | |
| Trademarks | 8 | | | (8) | | | — | | | 14 | | | (8) | | | 6 | | | | | |
| Software | 187 | | | (127) | | | 60 | | | 175 | | | (119) | | | 56 | | | | | |
| Intangible assets subject to amortization | $ | 563 | | | $ | (287) | | | $ | 276 | | | $ | 567 | | | $ | (272) | | | $ | 295 | | | | | |
Intangible assets amortization expense was $9 million and $28 million for the three and nine months ended September 30, 2023, respectively. For the three and nine months ended October 1, 2022, intangible assets amortization expense was $10 million and $25 million, respectively.
Note 11. Leases
Total operating lease costs are as follows:
| | | | | | | | | | | | | | | | | | | | | | | |
| Three Months Ended | | Nine Months Ended |
| (in millions) | September 30, 2023 | | October 1, 2022 | | September 30, 2023 | | October 1, 2022 |
| Operating lease costs | | | | | | | |
| Cost of goods sold | $ | 5 | | | $ | 3 | | | $ | 15 | | | $ | 13 | |
| Selling, general and administrative expenses | 14 | | | 13 | | | 43 | | | 38 | |
| Total operating lease costs | $ | 19 | | | $ | 16 | | | $ | 58 | | | $ | 51 | |
Total operating lease costs include variable lease costs of $6 million and $18 million for the three and nine months ended September 30, 2023, respectively. For the three and nine months ended October 1, 2022, total operating lease costs include variable lease costs of $6 million and $15 million, respectively.
The following table summarizes the carrying amounts of our operating lease assets and liabilities:
| | | | | | | | | | | | | | | | | |
| (in millions) | Financial Statement Line Item | | September 30, 2023 | | December 31, 2022 |
| Operating lease assets | Other assets | | $ | 197 | | | $ | 191 | |
| Operating lease liabilities - current | Accrued liabilities | | $ | 36 | | | $ | 37 | |
| Operating lease liabilities - non-current | Other liabilities | | $ | 174 | | | $ | 166 | |
| | | | | |
| | | | | |
Supplemental cash flow information related to operating leases was as follows:
| | | | | | | | | | | | | |
| Nine Months Ended |
| (in millions) | September 30, 2023 | | October 1, 2022 | | |
| Cash paid for operating lease liabilities | $ | 27 | | | $ | 25 | | | |
| Non-cash activities: operating lease assets obtained in exchange for new operating lease liabilities | $ | 37 | | | $ | 84 | | | |
Resideo Technologies, Inc.
Notes to Consolidated Financial Statements
(Unaudited)
Note 12. Long-Term Debt
Long-term debt is comprised of the following:
| | | | | | | | | | | |
| |
| (in millions) | September 30, 2023 | | December 31, 2022 |
| | | |
4.000% Senior Notes due 2029 | $ | 300 | | | $ | 300 | |
| | | |
| | | |
| Variable rate A&R Term B Facility | 1,123 | | | 1,131 | |
| | | |
| Gross debt | 1,423 | | | 1,431 | |
| Less: current portion of long-term debt | (12) | | | (12) | |
| Less: unamortized deferred financing costs | (14) | | | (15) | |
| Total long-term debt | $ | 1,397 | | | $ | 1,404 | |
A&R Senior Credit Facilities
On February 12, 2021, we entered into an Amendment and Restatement Agreement with JP Morgan Chase Bank N.A. as administrative agent (the “A&R Credit Agreement”). The A&R Credit Agreement provides for (i) an initial seven-year senior secured Term B loan facility in an aggregate principal amount of $950 million, which was later amended to add $200 million in additional term loans (the “A&R Term B Facility”) and (ii) a five-year senior secured revolving credit facility in an aggregate principal amount of $500 million (the “A&R Revolving Credit Facility” and, together with the A&R Term B Facility, the “A&R Senior Credit Facilities”).
The A&R Senior Credit Facilities contain customary LIBOR replacement language, including, but not limited to, the use of rates based on secured overnight financing rate (“SOFR”), which is a broad measure of the cost of borrowing cash overnight collateralized by U.S. Treasury securities in the repurchase agreement market and is administered by the Federal Reserve Bank of New York. On June 30, 2023, we modified the calculation of interest under the A&R Senior Credit Facilities from being calculated based on LIBOR to being calculated based on SOFR. Therefore, the A&R Senior Credit Facilities bears interest at a rate per annum of Term SOFR plus a credit spread adjustment of 10 basis points for the A&R Revolving Credit Facility and varying credit spread adjustments for the A&R Term B Facility, based on the tenor of each individual borrowing. No other material terms of the A&R Senior Credit Facilities were amended.
At September 30, 2023 and December 31, 2022, the weighted average interest rate for the A&R Term B Facility, excluding the effect of the interest rate swaps, was 7.69% and 6.78%, respectively, and there were no borrowings and no letters of credit issued under the A&R Revolving Credit Facility. As of September 30, 2023, we were in compliance with all covenants related to the A&R Senior Credit Facilities.
We entered into certain interest rate swap agreements in March 2021, which were amended in June 2023, to transition from a hedge of LIBOR-based cash flows to a hedge of SOFR-based cash flows. These interest rate swap agreements effectively convert a portion of our variable-rate debt to fixed rate debt. Refer to Note 13. Derivative Financial Instruments for further discussion.
Refer to Note 11. Long-Term Debt in our 2022 Annual Report on Form 10-K for further discussion.
Note 13. Derivative Financial Instruments
In March 2021, we entered into eight interest rate swap agreements (“Swap Agreements”) with several financial institutions for a combined notional value of $560 million. The Swap Agreements were entered into to reduce the consolidated interest rate risk associated with variable rate, long-term debt.
Resideo Technologies, Inc.
Notes to Consolidated Financial Statements
(Unaudited)
In March and April 2023, we modified two of the eight Swap Agreements, each with a notional value of $70 million that matures in May 2024 as follows: (i) the original interest rate swap agreements were cancelled for no termination payment and (ii) we simultaneously entered into new pay-fixed interest rate swap agreements with a notional amount of $70 million each, effectively blending the asset positions of the original interest rate swap agreements into new interest swap agreements and extending the term of our hedged positions to February 2027. In connection with these transactions, no cash was exchanged between us and the counterparty. The new pay-fixed interest rate swap agreements qualify as a hybrid instrument in accordance with Accounting Standards Codification 815, Derivatives and Hedging, consisting of financing components and embedded at-market derivatives that were designated as cash flow hedges. The amounts remaining in accumulated other comprehensive loss for the modified interest rate swap agreements as of September 30, 2023 were approximately $4 million in aggregate and are being amortized as a reduction to interest expense over the effective period of the original interest rate swap agreements, or May 2024. The financing components are accounted for at amortized cost over the life of the swap while the embedded at-market derivatives are accounted for at fair value.
On June 23, 2023, we amended the Swap Agreements to transition from a hedge of LIBOR-based cash flows to a hedge of SOFR-based cash flows. Under the amended Swap Agreements, we convert a portion of our variable interest rate obligations based on Term SOFR with a minimum rate of 0.39% per annum to a base fixed weighted average rate of 1.13% over the remaining terms. We designated the Swap Agreements as cash flow hedges of the variability in expected cash outflows for interest payments.
The Swap Agreements are adjusted to fair value on a quarterly basis. The fair value of each swap is presented within the Unaudited Consolidated Balance Sheets, and we recognize any changes in the fair value as an adjustment of accumulated other comprehensive loss within equity to the extent the swap is effective. As interest expense is accrued on the debt obligation, amounts in accumulated other comprehensive loss related to the Swap Agreements are reclassified into income resulting in a net interest expense on the hedged amount of the underlying debt obligation equal to the effective yield of the fixed rate of the swap.
The following table summarizes the fair value and presentation of derivative instruments in the Unaudited Consolidated Balance Sheets as well as the changes in fair value recorded in accumulated other comprehensive loss:
| | | | | | | | | | | | | | | | | |
| Fair Value of Derivative Assets |
| (in millions) | Financial Statement Line Item | | September 30, 2023 | | December 31, 2022 |
| | | | |
| | | | | |
| | | | | |
| | | | |
| | | | | |
| Derivatives designated as hedging instruments | | | | |
| Interest rate swaps | Other current assets | | $ | 23 | | | $ | 23 | |
| Interest rate swaps | Other assets | | 18 | | | 22 | |
| Total derivative assets designated as hedging instruments | | $ | 41 | | | $ | 45 | |
| | | | | |
| |
| | | |
| | | | | |
| | | | |
| | | | | |
| | | | | |
| | | | | |
| Unrealized gain | Accumulated other comprehensive loss | | $ | 38 | | | $ | 42 | |
The following table summarizes the effect of derivative instruments designated as cash flow hedges in other comprehensive income and the Unaudited Consolidated Statements of Operations:
| | | | | | | | | | | | | | | | | | | | | | | |
| Three Months Ended | | Nine Months Ended |
| (in millions) | September 30, 2023 | | October 1, 2022 | | September 30, 2023 | | October 1, 2022 |
| Gains recorded in accumulated other comprehensive loss, beginning of period | $ | 40 | | | $ | 30 | | | $ | 42 | | | $ | 6 | |
| Current period (loss) gain recognized in/reclassified from other comprehensive income | (2) | | | 14 | | | (4) | | | 38 | |
| Gains recorded in accumulated other comprehensive loss, end of period | $ | 38 | | | $ | 44 | | | $ | 38 | | | $ | 44 | |
Unrealized gains expected to be reclassified from accumulated other comprehensive loss in the next 12 months are estimated to be $27 million as of September 30, 2023.
Resideo Technologies, Inc.
Notes to Consolidated Financial Statements
(Unaudited)
Note 14. Fair Value
The estimated fair value of our financial instruments held, and when applicable, issued to finance our operations, is summarized below. Certain estimates and judgments were required to develop the fair value amounts. The fair value amounts shown below are not necessarily indicative of the amounts that we would realize upon disposition, nor do they indicate our intent or ability to dispose of the financial instrument. Assets and liabilities that are carried at fair value are required to be classified and disclosed in one of the following three categories:
Level 1—quoted market prices in active markets for identical assets and liabilities
Level 2—observable market-based inputs or unobservable inputs that are corroborated by market data
Level 3—unobservable inputs that are not corroborated by market data
Financial and non-financial assets and liabilities are classified in their entirety based on the lowest level of input that is significant to the fair value measurement. There were no changes in the methodologies used in our valuation practices as of September 30, 2023.
The fair values of long-term debt instruments were determined using quoted market prices in inactive markets or discounted cash flows based upon current observable market interest rates and therefore were classified as Level 2 measurements in the fair value hierarchy.
The following table provides a summary of the carrying amount and fair value of outstanding debt:
| | | | | | | | | | | | | | | | | | | | | | | |
| September 30, 2023 | | December 31, 2022 |
| (in millions) | Carrying Value | | Fair Value | | Carrying Value | | Fair Value |
| Debt | | | | | | | |
4.000% Senior Notes due 2029 | $ | 300 | | | $ | 246 | | | $ | 300 | | | $ | 242 | |
| Variable rate A&R Term B Facility | 1,123 | | | 1,127 | | | 1,131 | | | 1,125 | |
| Total debt | $ | 1,423 | | | $ | 1,373 | | | $ | 1,431 | | | $ | 1,367 | |
Refer to Note 12. Long-Term Debt to the Unaudited Consolidated Financial Statements for further discussion.
Interest Rate Risk—We have exposure to movements in interest rates associated with cash and borrowings. We have entered, and in the future may enter, into various interest rate protection agreements in order to limit the impact of movements in interest rates. The fair values of interest rate swaps have been determined based on market value equivalents at the balance sheet date, taking into account the current interest rate environment and therefore, were classified as Level 2 measurements in the fair value hierarchy.
The following table provides a summary of the carrying amount and fair value of our interest rate swaps:
| | | | | | | | | | | | | | | | | | | | | | | | | | | |
| September 30, 2023 | | December 31, 2022 |
| (in millions) | Carrying Value | | | | Fair Value | | Carrying Value | | | | Fair Value |
| Assets: | | | | | | | | | | | |
| Interest rate swaps | $ | 41 | | | | | $ | 41 | | | $ | 45 | | | | | $ | 45 | |
| | | | | | | | | | | |
| | | | | | | | | | | |
| | | | | | | | | | | |
Refer to Note 13. Derivative Financial Instruments to the Unaudited Consolidated Financial Statements for further discussion.
There are no Level 1 or Level 3 assets or liabilities for the periods presented. The carrying amounts of cash and cash equivalents, accounts receivable, other current assets, accounts payable, accrued and other liabilities approximate fair value because of the short-term maturity of these amounts.
Resideo Technologies, Inc.
Notes to Consolidated Financial Statements
(Unaudited)
Note 15. Accrued Liabilities
Accrued liabilities consist of the following:
| | | | | | | | | | | |
| |
| (in millions) | September 30, 2023 | | December 31, 2022 |
| Obligations payable under Indemnification Agreements | $ | 140 | | | $ | 140 | |
| Compensation, benefit and other employee-related | 100 | | | 108 | |
| Customer rebate reserve | 92 | | | 98 | |
Restructuring | 41 | | | 27 | |
| Current operating lease liability | 36 | | | 37 | |
Held for sale (1) | 31 | | | — | |
| Product warranties | 24 | | | 40 | |
| Taxes payable | 17 | | | 38 | |
Other (2) | 111 | | | 152 | |
| Total accrued liabilities | $ | 592 | | | $ | 640 | |
(1) Relates to the divestiture of our Genesis business as discussed in Note 1. Nature of Operations and Basis of Presentation.
(2) Other includes accruals for advertising, legal and professional reserves, freight, royalties, interest, and other miscellaneous items.
The Indemnification Agreements are further described in Note 16. Commitments and Contingencies to the Unaudited Consolidated Financial Statements.
Note 16. Commitments and Contingencies
Environmental Matters
We are subject to various federal, state, local, and foreign government requirements relating to the protection of the environment and accrue costs related to environmental matters when it is probable that we have incurred a liability related to a contaminated site and the amount can be reasonably estimated. We believe that, as a general matter, our policies, practices and procedures are properly designed to prevent unreasonable risk of environmental damage and personal injury and that our handling, manufacture, use and disposal of hazardous substances are in accordance with environmental and safety laws and regulations. We have incurred remedial response and voluntary cleanup costs for site contamination and are a party to claims associated with environmental and safety matters, including products containing hazardous substances. Additional claims and costs involving environmental matters are likely to continue to arise in the future.
Environment-related expenses for sites owned and operated by us are presented within cost of goods sold for operating sites. For the three and nine months ended September 30, 2023 and October 1, 2022, environmental expenses related to these operating sites were not material. Liabilities for environmental costs were $22 million at September 30, 2023 and December 31, 2022.
Obligations Payable Under Indemnification Agreements
The Reimbursement Agreement and the Tax Matters Agreement (collectively, the “Indemnification Agreements”) are further described below.
Reimbursement Agreement
We separated from Honeywell International Inc. (“Honeywell”) on October 29, 2018, becoming an independent publicly traded company as a result of a pro rata distribution of our common stock to shareholders of Honeywell (the “Spin-off”). In connection with the Spin-Off, we entered into the Reimbursement Agreement, pursuant to which we have an obligation to make cash payments to Honeywell in amounts equal to 90% of payments for certain Honeywell environmental-liability payments, which include amounts billed (payments), less 90% of Honeywell’s net insurance receipts relating to such liabilities, and less 90% of the net proceeds received by Honeywell in connection with (i) affirmative claims relating to such liabilities, (ii) contributions by other parties relating to such liabilities and (iii) certain property sales (the recoveries). While the amount payable by us in respect of such liabilities arising in any given year is subject to a cap of $140 million
Resideo Technologies, Inc.
Notes to Consolidated Financial Statements
(Unaudited)
under the Reimbursement Agreement, the estimated liability for resolution of pending and future environmental-related liabilities recorded on our balance sheets are calculated as if we were responsible for 100% of the environmental-liability payments associated with certain sites. Refer to Note 15. Commitments and Contingencies in our 2022 Annual Report on Form 10-K for further discussion.
Tax Matters Agreement
In connection with the Spin-Off, we entered into the Tax Matters Agreement with Honeywell, pursuant to which we are responsible and will indemnify Honeywell for certain taxes, including certain income taxes, sales taxes, VAT and payroll taxes, relating to the business for all periods, including periods prior to the consummation of the Spin-Off. In addition, the Tax Matters Agreement addresses the allocation of liability for taxes that are incurred as a result of restructuring activities undertaken to effectuate the Spin-Off.
We are required to indemnify Honeywell for any taxes resulting from the failure of the Spin-Off and related internal transactions to qualify for their intended tax treatment under U.S. federal, state and local income tax law, as well as foreign tax law, where such taxes result from our action or omission not permitted by the Separation and Distribution Agreement between Honeywell and Resideo dated as of October 19, 2018 or the Tax Matters Agreement.
The following table summarizes information concerning the Reimbursement and Tax Matter Agreements’ liabilities:
| | | | | | | | | | | | | | | | | |
| (in millions) | Reimbursement Agreement | | Tax Matters Agreement | | Total |
| Balance as of December 31, 2022 | $ | 614 | | | $ | 106 | | | $ | 720 | |
Accruals for liabilities deemed probable and reasonably estimable (1) | 128 | | | (4) | | | 124 | |
| Payments to Honeywell | (105) | | | — | | | (105) | |
| Balance as of September 30, 2023 | $ | 637 | | | $ | 102 | | | $ | 739 | |
(1) Reimbursement Agreement liabilities deemed probable and reasonably estimable; however, it is possible we could pay $140 million per year (exclusive of any late payment fees up to 5% per annum) until the earlier of (1) December 31, 2043; or (2) December 31 of the third consecutive year during which the annual reimbursement obligation (including in respect of deferred payment amounts) has been less than $25 million.
The liabilities related to the Reimbursement and Tax Matters Agreements are included in the following balance sheet accounts:
| | | | | | | | | | | |
| (in millions) | September 30, 2023 | | December 31, 2022 |
| Accrued liabilities | $ | 140 | | | $ | 140 | |
| Obligations payable under Indemnification Agreements | 599 | | | 580 | |
| Total indemnification liabilities | $ | 739 | | | $ | 720 | |
For the three and nine months ended September 30, 2023, net expenses related to the Reimbursement Agreement were $43 million and $128 million, respectively, and for the three and nine months ended October 1, 2022, net expenses related to the Reimbursement Agreement were $30 million and $116 million, respectively, and are recorded in other expense, net.
We do not currently possess sufficient information to reasonably estimate the amounts of indemnification liabilities to be recorded upon future completion of studies, litigation or settlements, and neither the timing nor the amount of the ultimate costs associated with such indemnification liability payments can be determined although they could be material to our consolidated results of operations and operating cash flows in the periods recognized or paid.
Independent of our payments under the Reimbursement Agreement, we will have ongoing liability for certain environmental claims, which are part of our ongoing business.
Trademark Agreement
We entered into a 40-year Trademark Agreement with Honeywell that authorizes our use of the Honeywell Home trademark in the operation of our business for the advertising, sale and distribution of certain licensed products. In
Resideo Technologies, Inc.
Notes to Consolidated Financial Statements
(Unaudited)
exchange, we pay Honeywell a royalty fee based on net revenue related to such licensed products, which is recorded in selling, general and administrative expense in the Unaudited Consolidated Statements of Operations. For the three and nine months ended September 30, 2023, royalty fees were $4 million and $13 million, respectively. For the three and nine months ended October 1, 2022, royalty fees were $7 million and $16 million, respectively.
Other Matters
We are subject to lawsuits, investigations and disputes arising out of the conduct of our business, including matters relating to commercial transactions, government contracts, product liability, acquisitions and divestitures, employee matters, intellectual property, and environmental, health, and safety matters. We recognize a liability for any contingency that is probable of occurrence and reasonably estimable. We continually assess the likelihood of adverse judgments or outcomes in these matters, as well as potential ranges of possible losses, based on a careful analysis of each matter with the assistance of outside legal counsel and, if applicable, other experts. No such matters are material to our financial statements. Refer to Note 15. Commitments and Contingencies in our 2022 Annual Report on Form 10-K for further discussion of these matters.
Certain current or former directors and officers were defendants in a consolidated derivative action, In re Resideo Technologies, Inc. Derivative Litigation (the “Consolidated Federal Derivative Action”), which was stayed pending entry of final judgment in the related securities litigation and Delaware Chancery derivative action. An additional suit was filed in the Court of Chancery of the State of Delaware in 2021 and not consolidated with the Consolidated Federal Derivative Action. On November 17, 2022, the parties executed a Confidential Term Sheet summarizing the agreed terms of a global settlement to resolve all of the pending lawsuits and derivative claims. Under the terms of the settlement, we agreed to implement or codify certain corporate governance reforms and reimburse the plaintiffs’ attorneys’ fees of up to $1.6 million. On February 3, 2023, the parties executed a definitive stipulation of settlement. The U.S. District Court for the District of Minnesota preliminarily approved the settlement, and a fairness hearing was held on June 22, 2023. The final settlement remains subject to, among other things, court approval. The settlement liability is included in the other accrued liabilities in the Unaudited Consolidated Balance Sheets, and the expected insurance recovery of approximately $0.6 million is included in accounts receivable, net.
On September 16, 2022, Salvatore Badalamenti (“Plaintiff”) filed a putative class action lawsuit (the “Badalamenti Lawsuit”) in the U.S. District Court for the District of New Jersey against Honeywell International Inc. and the Company. Plaintiff alleges, among other things, that the Company violated certain consumer protection laws by falsely advertising the Company’s combination-listed single data-bus burglar and fire alarms system control units (the “Products”) as conforming to Underwriters Laboratories, Inc. (the “UL”) or the National Fire Protection Association (“NFPA”) standards and/or failing to disclose such nonconformance. Plaintiff further alleges that the Products are defective because they do not conform to the UL and NFPA industry standards. Plaintiff does not allege that he, or anyone else, has experienced any adverse event due to the alleged product defect or that the Products did not work. Plaintiff alleges causes of action for violation of the New Jersey Consumer Fraud Act, fraud, negligent misrepresentation, breach of express and implied warranties, violation of the Magnuson-Moss Warranty Act, unjust enrichment, and violation of the Truth-in-Consumer Contract, Warranty, and Notice Act.
Plaintiff seeks to represent a putative class of other persons in the U.S. who purchased the Products. Plaintiff, on behalf of himself and the putative class, seeks damages in an unknown amount, which he describes as the cost to repair and/or replace the Products and/or the diminution in value of the Products.
We believe we have strong defenses against the allegations and claims asserted in the Badalamenti Lawsuit and our motion to dismiss Plaintiff's complaint was fully briefed on March 3, 2023. We continue to defend the matter vigorously; however, there can be no assurance that we will be successful in such defense. In light of the early stage of the Badalamenti Lawsuit, we are unable to estimate the total costs to defend the matter or the potential liability to us in the event that we are not successful in our defense.
On June 28, 2023, Lisset Tredo, a Company employee, filed a putative class action complaint in the San Diego County Superior Court on behalf of all non-exempt employees in California, in which she alleges violations by the Company of the California Labor Code related to sick leave pay, accurate wage statements, recordkeeping, and pay timing, and on August 28, 2023 she filed a first amended complaint adding a claim under the California Private Attorneys General Act (the “Tredo Lawsuit”). In the Tredo Lawsuit, Tredo seeks alleged unpaid wages, restitution, interest, statutory penalties, attorneys’ fees
Resideo Technologies, Inc.
Notes to Consolidated Financial Statements
(Unaudited)
and costs in an unknown amount. The Company answered the Tredo lawsuit in which it asserted a general denial of plaintiff’s allegations and asserted various defenses.
We are investigating the allegations and defenses. The parties have agreed to attend mediation in January 2024 and to stay formal discovery pending the outcome of the mediation. If the case is not resolved at mediation, we intend to defend the matter vigorously; however, there can be no assurance that we will be successful in such defense. In light of the early stage of the Tredo Lawsuit, we are unable to estimate the total costs to defend the matter or the potential liability to us in the event that we are not successful in our defense.
Warranties and Guarantees
In the normal course of business, we issue product warranties and product performance guarantees. We accrue for the estimated cost of product warranties and product performance guarantees based on contract terms and historical experience at the time of sale. Adjustments to initial obligations for warranties and guarantees are made as changes to the obligations become reasonably estimable. Product warranties and product performance guarantees are included in accrued and other liabilities. The following table summarizes information concerning recorded obligations for product warranties and product performance guarantees:
| | | | | | | | | | | |
| (in millions) | September 30, 2023 | | December 31, 2022 |
| Beginning balance | $ | 48 | | | $ | 23 | |
| Accruals for warranties/guarantees issued during the year | 19 | | | 30 | |
| Adjustment of pre-existing warranties/guarantees | (2) | | | (2) | |
| Settlement of warranty/guarantee claims | (32) | | | (17) | |
| Reserve of acquired company at date of acquisition | — | | | 14 | |
| Ending balance | $ | 33 | | | $ | 48 | |
Note 17. Income Taxes
For interim periods, income tax is equal to the total of (1) year-to-date pretax income multiplied by the forecasted effective tax rate plus (2) tax expense items specific to the period. In situations where we expect to report losses and where we do not expect to receive tax benefits, we apply separate forecast effective tax rates to those jurisdictions rather than including them in the consolidated forecast effective tax rate.
For the three and nine months ended September 30, 2023, the net tax expense was $16 million and $84 million, respectively, and for the three and nine months ended October 1, 2022, net tax expense was $33 million and $104 million, respectively, and consists primarily of interim period tax expense based on year-to-date pretax income multiplied by our forecasted effective tax rate. In addition to items specific to the period, our income tax rate is impacted by the mix of earnings across the jurisdictions in which we operate, non-deductible expenses, and U.S. taxation of foreign earnings.
Resideo Technologies, Inc.
Notes to Consolidated Financial Statements
(Unaudited)
Note 18. Earnings Per Share
The reconciliation of the numerator and denominator used for the computation of basic and diluted earnings per share follows:
| | | | | | | | | | | | | | | | | | | | | | | |
| Three Months Ended | | Nine Months Ended |
| (in millions, except per share data) | September 30, 2023 | | October 1, 2022 | | September 30, 2023 | | October 1, 2022 |
| Numerator for basic and diluted earnings per share: | | | | | | | |
| | | | | | | |
| | | | | | | |
| Net income | $ | 21 | | | $ | 63 | | | $ | 128 | | | $ | 244 | |
| | | | | | | |
| Denominator for basic and diluted earnings per share: | | | | | | | |
| Weighted average basic number of common shares outstanding | 147 | | | 146 | | | 147 | | | 145 | |
| Plus: dilutive effect of common stock equivalents | 1 | | | 3 | | | 2 | | | 4 | |
| Weighted average diluted number of common shares outstanding | 148 | | | 149 | | | 149 | | | 149 | |
| | | | | | | |
| Earnings per share: | | | | | | | |
| | | | | | | |
| | | | | | | |
| | | | | | | |
| Basic | $ | 0.14 | | | $ | 0.43 | | | $ | 0.87 | | | $ | 1.68 | |
| | | | | | | |
| | | | | | | |
| | | | | | | |
| | | | | | | |
| Diluted | $ | 0.14 | | | $ | 0.42 | | | $ | 0.86 | | | $ | 1.64 | |
Diluted earnings per share is computed based upon the weighted average number of common shares outstanding for the period plus the dilutive effect of common stock equivalents using the treasury stock method and the average market price of our common stock for the period. For the three and nine months ended September 30, 2023, average options and other rights to purchase approximately 1.0 million and 1.5 million shares of common stock, respectively, were outstanding and anti-dilutive, and therefore excluded from the computation of diluted earnings per share. In addition, an average of 1.6 million and 1.1 million shares of PSU awards are excluded from the computation of diluted earnings per share for the three and nine months ended September 30, 2023, respectively, as the contingency had not been satisfied. For the three and nine months ended October 1, 2022, average options and other rights to purchase approximately 0.8 million and 0.4 million shares of common stock, respectively, were outstanding and anti-dilutive, and therefore excluded from the computation of diluted income per share. In addition, an average of 1.5 million and 0.8 million shares of PSU awards are excluded from the computation of diluted earnings per share for the three and nine months ended October 1, 2022, respectively, as the contingency had not been satisfied.
Note 19. Shareholders’ Equity
On August 3, 2023, we announced that our Board of Directors authorized a share repurchase program for the repurchase of up to $150 million of our common stock over an unlimited time period (the “Share Repurchase Program”). Under the Share Repurchase Program, we may repurchase common stock from time-to-time through various methods, including in open market transactions, block trades, accelerated share repurchases, privately negotiated transactions, derivative transactions or otherwise, certain of which may be made pursuant to a trading plan meeting the requirements of Rule 10b5-1 under the Securities Exchange Act of 1934, as amended, in compliance with applicable state and federal securities laws. The Share Repurchase Program can be modified or terminated by our Board of Directors at any time.
The timing, as well as the number and value of common stock repurchased under the Share Repurchase Program, will be determined at our discretion and will depend on a variety of factors, including our assessment of the intrinsic value and market price of our common stock, general market and economic conditions, available liquidity, compliance with our debt and other agreements, applicable legal requirements, the nature of other investment opportunities available to us and other considerations.
Resideo Technologies, Inc.
Notes to Consolidated Financial Statements
(Unaudited)
During the three months ended September 30, 2023, we repurchased 1.8 million shares of common stock in the open market at a total cost of $30 million. As of September 30, 2023, the Company had approximately $120 million of authorized repurchases remaining under the Share Repurchase Program. Common stock repurchases are recorded at cost and presented as a deduction from stockholders’ equity.
Item 2. Management’s Discussion and Analysis of Financial Condition and Results of Operations.
The following information should be read in conjunction with the Unaudited Consolidated Financial Statements included herein under “Item 1. Unaudited Consolidated Financial Statements” and the Audited Consolidated Financial Statements and the notes thereto and “Item 7. Management’s Discussion and Analysis of Financial Condition and Results of Operations” (“MD&A”) included in our 2022 Annual Report on Form 10-K.
FORWARD LOOKING STATEMENTS
This Quarterly Report on Form 10-Q (“Quarterly Report”) contains forward-looking statements within the meaning of the Private Securities Litigation Reform Act of 1995. These statements can be identified by the fact that they do not relate strictly to historical or current facts, but rather are based on current expectations, estimates, assumptions and projections about our industries and our business and financial results. Forward-looking statements often include words such as “anticipates,” “estimates,” “expects,” “projects,” “forecasts,” “intends,” “plans,” “continues,” “believes,” “may,” “will,” “goals” and words and terms of similar substance in connection with discussions of future operating or financial performance. This Quarterly Report includes industry and market data that we obtained from various third-party sources, including forecasts based upon such data; as with any projection or forecast, forward-looking statements are inherently susceptible to uncertainty and changes in circumstances. Our actual results may vary materially from those expressed or implied in our forward-looking statements. Accordingly, undue reliance should not be placed on any forward-looking statement made by us or on our behalf. Although we believe that the forward-looking statements contained in this Quarterly Report are based on reasonable assumptions, you should be aware that many factors could affect our actual financial results or results of operations and could cause actual results to differ materially from those in such forward-looking statements, including but not limited to:
•competition from other companies in our markets and segments, as well as in new markets and emerging markets;
•our ability to identify consumer preferences and industry standards, develop and protect intellectual property related thereto, and successfully market new technologies, products, and services to consumers;
•our reliance on certain suppliers;
•the impact of disruptions in our supply chain from third-party suppliers and manufacturers, including our inability to obtain necessary product components, production equipment or replacement parts;
•inability to consummate acquisitions on satisfactory terms or to integrate such acquisitions effectively;
•the impact of earthquakes, hurricanes, fires, power outages, floods, pandemics, epidemics, natural disasters and other catastrophic events or other public health emergencies, such as COVID-19;
•the impact of potentially volatile global market and economic conditions and industry and end market cyclicality, including factors such as interest rates, inflation, availability of financing, consumer spending habits and preferences, housing market changes, and employment rates;
•failure to achieve and maintain a high level of product and service quality, including the impact of warranty claims, product recalls, and product liability actions that may be brought against us;
•our ability to retain or expand relationships with significant customers;
•the significant failure or inability to comply with specifications and manufacturing requirements or delays or other problems with existing or new products or inability to meet price requirements;
•inability to successfully execute transformation programs or to effectively manage our workforce;
•the failure to increase productivity through sustainable operational improvements;
•economic, political, regulatory, foreign exchange and other risks of international operations;
•the potential adverse impacts of enhanced tariff, import/export restrictions, or other trade barriers on global economic conditions, financial markets and our business;
•our dependence upon IT infrastructure and network operations having adequate cyber-security functionality;
•risks associated with the Reimbursement Agreement, the other agreements we entered into with Honeywell in connection with the Spin-Off, and our relationships with Honeywell, including our reliance on Honeywell for the Honeywell Home trademark and potential material environmental liabilities;
•regulations and societal actions to respond to global climate change;
•failure to comply with the broad range of current and future standards, laws and regulations in the jurisdictions in which we operate;
•the impact of potential material litigation matters, government proceedings, and other contingencies and uncertainties;
•our ability to borrow funds and access capital markets in light of the terms of our debt documents or otherwise;
•our ability to recruit and retain qualified personnel;
•currency exchange rate fluctuations; and
•other risks detailed under the caption “Risk Factors” in this Quarterly Report, in Part I, Item 1A in our 2022 Annual Report on Form 10-K, and other filings we make with the SEC.
There have been no material changes to the risk factors described in our 2022 Annual Report on Form 10-K. These risks could cause actual results to differ materially from those implied by forward-looking statements in this Quarterly Report. Even if our results of operations, financial condition and liquidity and the development of the industries in which we operate are consistent with the forward-looking statements contained in this Quarterly Report, those results or developments may not be indicative of results or developments in subsequent periods.
Any forward-looking statements made by us in this Quarterly Report speak only as of the date on which they are made. We are under no obligation to and expressly disclaim any obligation to, update or alter our forward-looking statements, whether as a result of new information, subsequent events or otherwise.
Overview and Business Trends
We are a leading global manufacturer and distributor of technology-driven products and solutions that help homeowners and businesses stay connected and in control of their comfort, security and energy use. We are a leader in the home heating, ventilation and air conditioning controls markets, smoke and carbon monoxide detection home safety and fire suppression products, and security markets. We have a global footprint serving commercial and residential end-markets. We manage our business operations through two operating segments, Products and Solutions and ADI Global Distribution. The Products and Solutions operating segment, consistent with our industry, has a higher gross and operating profit profile in comparison to the ADI Global Distribution operating segment.
Our Products and Solutions operating segment offerings include temperature and humidity control, energy products and solutions, water and air solutions, smoke and carbon monoxide detection home safety products, security panels, sensors, peripherals, wire and cable, communications devices, video cameras, other home-related lifestyle convenience solutions, cloud infrastructure, installation and maintenance tools, and related software.
Our ADI Global Distribution business (“ADI”) is a leading wholesale distributor of low-voltage products including access control, fire detection, security, and video products and participates significantly in the broader related markets of audio, communications, data communications, networking, power, ProAV, smart home, and wire and cable. Our ADI strategy is focused on growth in our omni-channel presence, expansion into adjacent markets, and continued enhancements to our value-add services to support our professional installers’ efficiency and profitability.
Our financial performance is influenced by macroeconomic factors such as repair and remodeling activity, residential and non-residential construction, employment rates, interest rates and bank lending standards, supply chain dynamics, and the overall macroeconomic environment. Our visibility toward future performance is more limited due to uncertainty surrounding the prevailing macroeconomic environment. While we believe supply chain and logistics will continue to normalize over the remainder of 2023, customer demand continues to moderate as inventories rebalance over the period and uncertainties remain including the potential for changes in inflation and interest rates, increased labor costs, reduced consumer spending due to softening labor markets, elevated mortgage rates, the resumption of student loan repayments, unfavorable foreign currency impacts from a stronger U.S. Dollar, and potential market and other disruption from the ongoing conflicts in Ukraine and Israel.
Recent Developments
During the third quarter of 2023, we announced a restructuring program to align our cost structure with market conditions. For the three and nine months ended September 30, 2023, we recognized restructuring and impairment expenses of $38 million and $42 million, respectively. These expenses primarily related to workforce reductions.
On August 3, 2023, we announced that our Board of Directors authorized a share repurchase program for the repurchase of up to $150 million of our common stock over an unlimited time period. During the three and nine months ended September 30, 2023, we repurchased 1.8 million shares of common stock in the open market at a total cost of $30 million.
On August 9, 2023, we acquired 100% of the outstanding equity of Sfty SA, a developer of cloud-based services providing alerts to multifamily homes and property managers with smoke, carbon monoxide and water leak detection products. This acquisition will allow us to further expand our safety and security service offerings in the Products and Solutions business segment.
On September 19, 2023, we announced that we entered into a definitive agreement to sell our Genesis Wire & Cable business in a cash transaction to Southwire Company, LLC for $87.5 million, subject to customary adjustments. The transaction closed in October 2023.
Current Period Highlights
•Net revenue of $1.55 billion, down 4.0% from $1.62 billion in the third quarter of 2022
•Income from operations of $109 million, or 7.0% of revenue, compared to $155 million, or 9.6% of revenue in the third quarter of 2022
•Fully diluted earnings per share of $0.14, compared to $0.42 per share in the third quarter of 2022
•Cash Flow From Operations was $60 million in the third quarter of 2023 as compared to $37 million in the third quarter of 2022
Outlook
The following table summarizes our current fourth quarter 2023 and updated full year 2023 outlook. This outlook includes an estimated gain on the sale of Genesis of approximately $24 million. The transaction closed in October 2023 for estimated pre-tax cash proceeds of approximately $85 million.
| | | | | | | | |
| ($ in millions, except per share data) | Q4 2023 | 2023 |
| Net revenue | $1,495 - $1,545 | $6,200 - $6,250 |
| Gross profit margin | 26.0% - 27.0% | 26.6% - 27.2% |
| Income from operations | $135 - $155 | $535 - $555 |
| GAAP Earnings per share | $0.43 - $0.53 | $1.30 - $1.41 |
| | |
| | |
Results of Operations
The following table represents results of operations on a consolidated basis for the periods indicated:
| | | | | | | | | | | | | | | | | | | | | | | |
| Three Months Ended | | Nine Months Ended |
| (in millions, except per share data and percentages) | September 30, 2023 | | October 1, 2022 | | September 30, 2023 | | October 1, 2022 |
| Net revenue | $ | 1,554 | | | $ | 1,618 | | | $ | 4,705 | | | $ | 4,810 | |
| Cost of goods sold | 1,137 | | | 1,188 | | | 3,432 | | | 3,475 | |
| Gross profit | 417 | | | 430 | | | 1,273 | | | 1,335 | |
| Gross profit % | 26.8 | % | | 26.6 | % | | 27.1 | % | | 27.8 | % |
| Operating expenses: | | | | | | | |
| Research and development expenses | 28 | | | 29 | | | 84 | | | 81 | |
| Selling, general and administrative expenses | 233 | | | 236 | | | 719 | | | 716 | |
| Intangible asset amortization | 9 | | | 10 | | | 28 | | | 25 | |
| Restructuring and impairment expenses | 38 | | | — | | | 42 | | | — | |
| Total operating expenses | 308 | | | 275 | | | 873 | | | 822 | |
| Income from operations | 109 | | | 155 | | | 400 | | | 513 | |
| Other expenses, net | 56 | | | 44 | | | 138 | | | 126 | |
| Interest expense, net | 16 | | | 15 | | | 50 | | | 39 | |
| Income before taxes | 37 | | | 96 | | | 212 | | | 348 | |
| Provision for income taxes | 16 | | | 33 | | | 84 | | | 104 | |
| | | | | | | |
| | | | | | | |
| Net income | $ | 21 | | | $ | 63 | | | $ | 128 | | | $ | 244 | |
| | | | | | | |
| Earnings per share: | | | | | | | |
| Basic | $ | 0.14 | | | $ | 0.43 | | | $ | 0.87 | | | $ | 1.68 | |
| | | | | | | |
| | | | | | | |
| | | | | | | |
| | | | | | | |
| Diluted | $ | 0.14 | | | $ | 0.42 | | | $ | 0.86 | | | $ | 1.64 | |
Net Revenue
Three months ended
Net revenue for the three months ended September 30, 2023 was $1,554 million, a decrease of $64 million, or 4.0%, from the same period in 2022, driven primarily by lower sales volume of $109 million partially offset by higher selling prices of $29 million, favorable foreign currency fluctuations of $10 million and $6 million from acquisitions across both segments. Volume declines were driven by customer destocking and lower demand for air and energy products.
Nine months ended
Net revenue for the nine months ended September 30, 2023 was $4,705 million, a decrease of $105 million, or 2.2% from the same period in 2022, driven primarily by lower sales volume of $358 million and unfavorable foreign currency fluctuations of $22 million, partially offset by $147 million in revenue from acquisitions and $128 million from higher selling prices.
Gross Profit
Three months ended
The chart below presents the drivers of the gross profit variance from the three months ended October 1, 2022 to the three months ended September 30, 2023.
Gross profit dollars decreased $13 million in the three months ended September 30, 2023 as compared to the same period in 2022, and gross margin increased 20 basis points (“bps”) to 26.8% compared to 26.6% in the same period in the prior year. The change in gross margin was driven by 340 bps of favorable material, freight and other manufacturing costs, partially offset by lower demand from customers as they continued to normalize inventory levels of 170 bps and unfavorable margin mix shift of 150 bps, as the inflationary environment has begun to stabilize.
Nine months ended
The chart below presents the drivers of the gross profit variance from the nine months ended October 1, 2022 to the nine months ended September 30, 2023.
Gross profit dollars decreased $62 million in the nine months ended September 30, 2023 as compared to the same period in 2022, and gross margin decreased 70 bps to 27.1% compared to 27.8% in the same period of the prior year. The decrease in gross margin was driven by lower demand from customers as they continue to normalize inventory levels of 130 bps and, unfavorable product mix shift of 100 bps partially offset by 150 bps of favorable material, freight and other costs as the inflationary environment has begun to stabilize and 10 bps of favorable foreign currency fluctuations.
Research and Development Expenses
Three months ended
Research and development expenses for the three months ended September 30, 2023 were $28 million a slight decrease of $1 million, or 3.4%, as compared to the same period in 2022.
Nine months ended
Research and development expenses for the nine months ended September 30, 2023 were $84 million, an increase of $3 million, or 3.7%, as compared to the same period in 2022. The increase was primarily driven by additional research and development costs from the acquisition of First Alert, Inc. in first quarter of 2022.
Selling, General and Administrative Expenses
Three months ended
Selling, general and administrative expenses for the three months ended September 30, 2023 were $233 million, a decrease of $3 million, or 1.3%, as compared to the same period in 2022. The decrease was primarily driven by executed cost savings actions partially offset by the tax matters indemnification accrual release of $8 million in the third quarter of 2022.
Nine months ended
Selling, general and administrative expenses for the nine months ended September 30, 2023 were $719 million, an increase of $3 million, or 0.4%, as compared to the same period in 2022. The increase was primarily driven by $18 million in costs related to the inclusion of First Alert, Inc. and other acquisitions for the nine months ended September 30, 2023. This increase was partially offset by $10 million of transaction costs incurred in the first quarter of 2022.
Restructuring and Impairment Expenses
Three months ended
During the third quarter of 2023, we initiated our 2023 Plan in order to align our cost structure with market conditions. The following summarizes our restructuring and impairment expenses for the three months ended September 30, 2023, which were primarily related to workforce reductions.
| | | | | | | | | | | | | | | |
| Three Months Ended | | |
| (in millions) | September 30, 2023 | | October 1, 2022 | | | | |
| Products and Solutions | $ | 25 | | | $ | — | | | | | |
| ADI | 10 | | | — | | | | | |
| Corporate | 3 | | | — | | | | | |
| Restructuring and impairment expenses | $ | 38 | | | $ | — | | | | | |
Nine months ended
In the fourth quarter of 2022 and during 2023, we have taken actions to align our cost structure with market conditions. The intent of these actions is to lower costs, increase margins, and position us for long-term growth. The following summarizes our restructuring and impairment expenses for the nine months ended September 30, 2023, which were primarily related to workforce reductions.
| | | | | | | | | | | | | | | |
| | | | | Nine Months Ended |
| (in millions) | | | | | September 30, 2023 | | October 1, 2022 |
| Products and Solutions | | | | | $ | 27 | | | $ | — | |
| ADI | | | | | 12 | | | — | |
| Corporate | | | | | 3 | | | — | |
| Restructuring and impairment expenses | | | | | $ | 42 | | | $ | — | |
Intangible Asset Amortization
Three months ended
Intangible asset amortization was approximately flat for the three months ended September 30, 2023 as compared to the same period in 2022, primarily due to intangibles obtained through acquisition activities.
Nine months ended
Intangible asset amortization increased $3 million for the nine months ended September 30, 2023 as compared to the same period in 2022, due to the increased amortization costs primarily due to intangibles obtained through acquisition activities.
Other Expenses, Net
Three months ended
Other expenses, net consists primarily of Reimbursement Agreement expenses in the amount of $43 million for the three months ended September 30, 2023.
Nine months ended
Other expenses, net consists primarily of Reimbursement Agreement expenses in the amount of $128 million for the nine months ended September 30, 2023.
Interest Expense, Net
Three months ended
Interest expense, net increased $1 million for the three months ended September 30, 2023 as compared to the same period in 2022, due to higher interest rates on our borrowings.
Nine months ended
Interest expense, net increased $11 million for the nine months ended September 30, 2023 as compared to the same period in 2022, due to higher interest rates and additional borrowings of $200 million in March 2022 associated with our A&R Credit Agreement.
Tax Expense
Three months ended
Income tax expense decreased by $17 million for the three months ended September 30, 2023 as compared to the same period in 2022, primarily driven by a decrease in income before taxes. The effective income tax rate increased 1,096 bps for the three months ended September 30, 2023 compared to the same period in 2022, primarily due to non-deductible expenses associated with obligations payable under the Reimbursement Agreement being forecasted to be a larger portion of earnings.
Nine months ended
Income tax expense decreased by $20 million for the nine months ended September 30, 2023 as compared to the same period in 2022, primarily driven by a decrease in income before income taxes. The effective income tax rate increased 1,000 bps compared to the same period in 2022, primarily due to non-deductible expenses associated with obligations payable under the Reimbursement Agreement being forecasted to be a larger portion of earnings.
Segment Results of Operations
Products and Solutions
Three months ended
The chart below presents net revenue and income from operations for the three months ended September 30, 2023 and October 1, 2022.
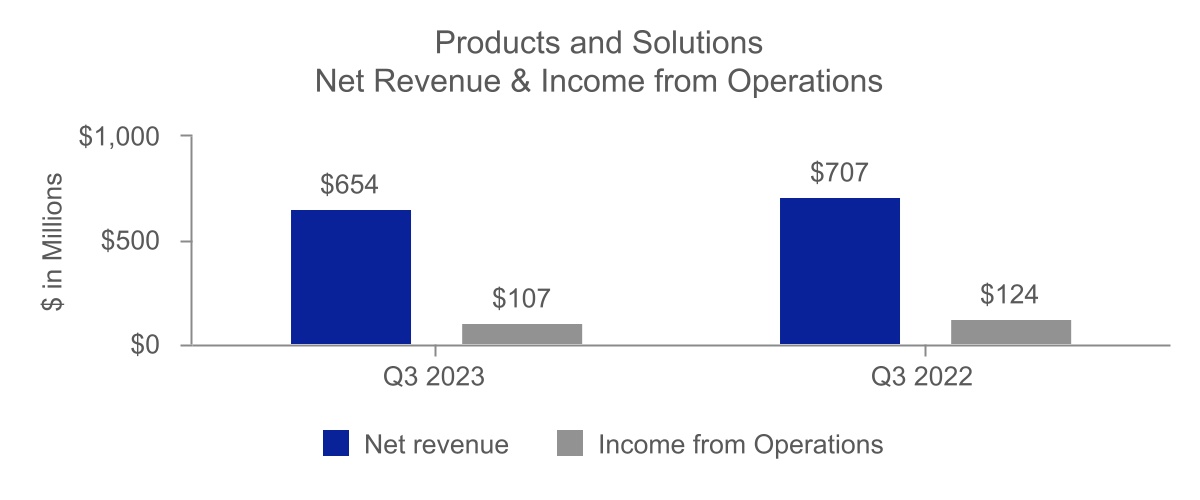
Products and Solutions net revenue decreased $53 million, or 7%, as compared to the same period in 2022, primarily due to lower sales volume of $81 million, partially offset by price increases of $25 million and favorable foreign exchange impacts of $4 million. Inventory remains extended in the HVAC distribution channel and overall end customer demand is being negatively impacted by slower existing home turnover and reduced new home construction. First Alert, Inc. smoke and carbon monoxide detector product sales again performed well, driven by continued expansion in the home builder channel. Income from operations decreased $17 million, or 14%, from the same period in 2022, primarily due to lower sales volume of $52 million, restructuring expense of $25 million and unfavorable price/mix of $8 million from mix shifts to lower priced products. Partially offsetting the unfavorable impacts to income from operations was $56 million of lower manufacturing input costs, primarily material and freight, due to the inflationary environment stabilizing.
Nine months ended
The chart below presents net revenue and income from operations for the nine months ended September 30, 2023 and October 1, 2022.
Products and Solutions net revenue decreased $101 million, or 4.8%, as compared to the same period in 2022, primarily due to lower sales volume of $274 million and unfavorable foreign currency fluctuations of $11 million, partially offset by revenue from the First Alert, Inc. acquisition of $99 million and price increases of $85 million. Income from operations decreased $79 million, or 18.3%, from the same period in 2022, primarily due to lower sales volume of $155 million, restructuring expense of $27 million, and unfavorable price/mix of $17 million from mix shifts to lower priced products. Partially offsetting the unfavorable impacts to income from operations were $74 million of lower manufacturing input costs, primarily material and freight, due to the inflationary environment stabilizing and $20 million from the First Alert, Inc. acquisition.
ADI Global Distribution
Three months ended
The chart below presents net revenue and income from operations for the three months ended September 30, 2023 and October 1, 2022.
ADI Global Distribution net revenue decreased by $11 million, or 1.2%, as compared to the same period in 2022, due to a decrease in volume of $28 million, offset by acquisitions of $7 million, favorable foreign exchange of $6 million, and price increases of $4 million. Sales decline in North America was partially offset by growth in the EMEA region. ADI saw strength in the access control category but continued slower demand within residential security category. Income from operations decreased $18 million, or 23%, due to restructuring costs of $10 million, sales mix and carry over inflation impacts of $9 million and lower volumes of $3 million, partially offset by lower freight and other selling, general and administrative costs of $4 million.
Nine months ended
The chart below presents net revenue and income from operations for the nine months ended September 30, 2023 and October 1, 2022.
ADI Global Distribution net revenue decreased $4 million, or 0.1%, as compared to the same period in 2022, driven by the impact of acquisitions of $49 million and price increases of $42 million, partially offset by lower sales volume of $84 million, primarily in sales in residential security and AV categories, and unfavorable foreign exchange fluctuations of $11 million. Income from operations decreased $33 million, or 14%, as compared to the same period in 2022, due to $21 million of higher input costs, primarily material, $15 million of lower sales volume, and $12 million of restructuring expenses slightly offset by price, net of mix and other favorable impacts of $15 million.
Corporate
Three months ended
Corporate costs for the three months ended September 30, 2023, were $58 million, an $11 million increase compared to the same period in 2022 primarily due to the tax matters indemnification accrual release of $8 million in the third quarter of 2022 and restructuring costs of $3 million incurred during the quarter.
Nine months ended
Corporate costs for the nine months ended September 30, 2023 were $163 million, an increase of $1 million, or 0.6%, from $162 million in the same period in 2022, primarily due to the cost savings actions offsetting incremental selling, general and administrative costs from the acquisition of First Alert, Inc.
Capital Resources and Liquidity
As of September 30, 2023, total cash and cash equivalents were $368 million. Our liquidity is primarily dependent on our ability to continue to generate positive cash flows from operations, supplemented by external sources of capital, as needed.
Additional liquidity may also be provided through access to the capital markets and our $500 million A&R Revolving Credit Facility.
Liquidity
Our future capital requirements will depend on many factors, including the rate of sales growth, market acceptance of our products, the timing and extent of research and development projects, potential acquisitions of companies or technologies and the expansion of our sales and marketing activities. We may enter into acquisitions or strategic arrangements in the future, which also could require us to seek additional equity or debt financing. While we may elect to seek additional funding at any time, we believe our existing cash, cash equivalents and availability under our credit facilities are sufficient to meet our capital requirements through at least the next 12 months and the longer term.
We may from time to time take steps to reduce our debt or otherwise improve our financial position. These actions could include prepayments, open market debt repurchases, negotiated repurchases, other redemptions or retirements of outstanding debt, opportunistic refinancing of debt, raising additional capital or divesting certain non-core assets. The amount of prepayments or the amount of debt that may be refinanced, repurchased or otherwise retired, if any, will depend on market conditions, trading levels of our debt, our cash position, compliance with debt covenants and other considerations.
Credit Agreement
As of September 30, 2023, we had $1,409 million of long-term debt outstanding under our A&R Credit Agreement and Senior Notes due 2029, of which $12 million is due in the next 12 months. We entered into certain interest rate swap agreements to effectively convert a portion of our variable-rate debt to fixed rate debt. During the second quarter of 2023, we transitioned the reference rate under the A&R Senior Credit Facilities and the Swap Agreements from LIBOR to SOFR.
Refer to Note 12. Long-Term Debt and Note 13. Derivative Financial Instruments to the Unaudited Consolidated Financial Statements for a description of our debt obligations and the timing of future principal and interest payments, including impacts from our Swap Agreements.
Share Repurchase Program
On August 3, 2023, we announced that our Board of Directors authorized a share repurchase program for the repurchase of up to $150 million of our common stock over an unlimited time period. During the three months ended September 30, 2023, we repurchased 1.8 million shares of common stock in the open market at a total cost of $30 million. As of September 30, 2023, we had $120 million of authorized repurchases remaining under the share repurchase program.
Cash Flow Summary for the Nine Months Ended September 30, 2023 and October 1, 2022
Our cash flows from operating, investing and financing activities for the nine months ended September 30, 2023 and October 1, 2022, as reflected in the Unaudited Consolidated Financial Statements, are summarized as follows:
| | | | | | | | | | | | | | | |
| Nine Months Ended |
| (in millions) | September 30, 2023 | | October 1, 2022 | $ change | |
| Cash provided by (used for) operating activities: | | | | | |
| Operating activities | $ | 177 | | | $ | 13 | | $ | 164 | | |
| Investing activities | (90) | | | (707) | | 617 | | |
| Financing activities | (47) | | | 182 | | (229) | | |
| | | | | |
| | | | | |
| | | | | |
| | | | | |
| Effect of exchange rate changes on cash | 1 | | | (12) | | 13 | | |
| Net increase (decrease) in cash, cash equivalents and restricted cash | $ | 41 | | | $ | (524) | | $ | 565 | | |
Net cash provided by operating activities for the nine months ended September 30, 2023 was $177 million. Compared to the nine months ended October 1, 2022, net cash provided by operating activities increased $164 million primarily due to improvements in accounts receivable, inventory, and other current assets of $291 million partially offset by a decrease in net income of $116 million.
Net cash used for investing activities for the nine months ended September 30, 2023 was $90 million, a decrease of $617 million compared to the nine months ended October 1, 2022, primarily due to a decrease in acquisitions of $644 million resulting from the First Alert, Inc acquisition occurring in the prior year.
Net cash used for financing activities was $47 million during the nine months ended September 30, 2023, as compared to cash provided by financing activities of $182 million for the nine months ended October 1, 2022. The primary uses of cash during the third quarter of 2023 was $28 million of common stock repurchases under our share repurchase program, $10 million for employee incentive plans and $9 million of principal debt repayments. During the second quarter of 2022, we received $200 million of proceeds from the A&R Credit Agreement to support the First Alert, Inc. acquisition.
Contractual Obligations and Probable Liability Payments
In addition to our long-term debt discussed above, our material cash requirements include the following contractual obligations.
Reimbursement Agreement Payments
In connection with the Spin-Off, we entered into the Reimbursement Agreement with Honeywell. As of September 30, 2023, a liability of $637 million was deemed probable and reasonably estimable; however, it is possible we could pay $140 million per year (exclusive of any late payment fees up to 5% per annum) until the earlier of: (1) December 31, 2043; or (2) December 31 of the third consecutive year during which the annual reimbursement obligation (including in respect of deferred payment amounts) has been less than $25 million. During the nine months ended September 30, 2023, we paid Honeywell $105 million under the Reimbursement Agreement. For further discussion on the Reimbursement Agreement, refer to Note 16. Commitments and Contingencies to the Unaudited Consolidated Financial Statements.
Environmental Liability Payments
We make environmental liability payments for sites which we own and are directly responsible. As of September 30, 2023, a payment of $22 million was deemed probable and reasonably estimable.
Operating Leases
We have operating lease arrangements for the majority of our manufacturing sites, offices, engineering and lab sites, stocking locations, warehouses, automobiles, and certain equipment. As of September 30, 2023, we had operating lease payment obligations of $210 million, with $36 million payable within 12 months.
Capital Expenditures
We believe our capital spending in recent years has been sufficient to maintain efficient production capacity, to implement important product and process redesigns and to expand capacity to meet increased demand. Productivity projects have freed up capacity in our manufacturing facilities and are expected to continue to do so.
Other Matters
Litigation, Environmental Matters and the Reimbursement Agreement
Refer to Note 16. Commitments and Contingencies to the Unaudited Consolidated Financial Statements for further discussion.
Recent Accounting Pronouncements
Refer to Note 2. Summary of Significant Accounting Policies to the Unaudited Consolidated Financial Statements for further discussion.
Item 3. Quantitative and Qualitative Disclosures About Market Risk.
We are exposed to market risk from foreign currency exchange rates, commodity price risk and interest rates, which could affect operating results, financial position and cash flows. We manage our exposure to these market risks through our regular operating and financing activities and, when appropriate, through the use of derivative financial instruments.
Interest Rate Risk
As of September 30, 2023, the Swap Agreements, with a notional value of $560 million, effectively convert a portion of our $1,123 million long-term variable rate A&R Term B Facility to fixed rate debt. In June 2023, we modified our A&R Term B Facility to implement a forward-looking rate based on SOFR. In conjunction, we amended the Swap Agreements to transition from a hedge of LIBOR-based cash flows to a hedge of SOFR-based cash flows. The Swap Agreements effectively convert a portion of our variable interest rate obligations to a rate based on Term SOFR with a minimum rate of 0.39% per annum to a base fixed weighted average rate of 1.13% over the remaining terms.
As of September 30, 2023, an increase in interest rates by 100 bps would have an approximately $6 million impact on our annual interest expense.
For more information on the Swap Agreements, refer to Note 13. Derivative Financial Instruments and Note 14. Fair Value to the Unaudited Consolidated Financial Statements.
Foreign Currency Exchange Rate Risk
We are exposed to market risks from changes in currency exchange rates. While we primarily transact with customers and suppliers in the U.S. Dollar, we also transact in foreign currencies, primarily including the Mexican Peso, British Pound, Canadian Dollar, Indian Rupee, Euro, Polish Zloty, and Czech Korona. These exposures may impact total assets, liabilities, future earnings and/or operating cash flows. Our exposure to market risk for changes in foreign currency exchange rates results from transactions arising out of international trade, foreign currency denominated monetary assets and liabilities, and international financing activities between subsidiaries. We rely primarily on natural offsets to address our exposures and may supplement this approach from time to time by entering into forward and option hedging contracts. As of September 30, 2023, we have no outstanding hedging arrangements.
Commodity Price Risk
While we are exposed to commodity price risk, we attempt to pass through significant changes in component and raw material costs to our customers based on the contractual terms of our arrangements. In limited situations, we may not be fully compensated for such changes in costs.
Item 4. Controls and Procedures
Evaluation of Disclosure Controls and Procedures
We maintain a system of disclosure controls and procedures designed to give reasonable assurance that information required to be disclosed in our reports filed or submitted under the Securities Exchange Act of 1934, as amended (the “Exchange Act”), is recorded, processed, summarized and reported within the time periods specified in the rules and forms of the SEC and that such information is accumulated and communicated to management to allow timely decisions regarding required disclosures.
Management recognizes that any disclosure controls and procedures, no matter how well designed and operated, can provide only reasonable assurance of achieving their objectives. Because there are inherent limitations in all control systems, no evaluation of controls can provide absolute assurance that all control issues and instances of fraud have been or will be detected.
Our Chief Executive Officer and Chief Financial Officer, with the assistance of other members of our management, conducted an evaluation of the effectiveness of our disclosure controls and procedures (as such term is defined in Rules 13a-15(e) and 15d-15(e) of the Exchange Act) as of the end of the period covered by this Quarterly Report. Based upon such evaluation, our Chief Executive Officer and Chief Financial Officer have concluded that our disclosure controls and procedures are effective at a reasonable assurance level as of the end of the period covered by this Quarterly Report.
Changes in Internal Control Over Financial Reporting
There was no change in our internal control over financial reporting that occurred during the quarter ended September 30, 2023 that has materially affected, or is reasonably likely to materially affect, our internal control over financial reporting.
PART II. Other Information
Item 1. Legal Proceedings
Refer to Note 16. Commitments and Contingencies to Unaudited Consolidated Financial Statements of this Quarterly Report for a discussion on legal proceedings.
Item 1A. Risk Factors
We face a variety of risks that are inherent in our business and our industry, including operational, legal, and regulatory risks. Such risks could cause our actual results to differ materially from our forward-looking statements, expectations, and historical trends. There have been no material changes to the risk factors described in our 2022 Annual Report on Form 10-K.
Item 2. Unregistered Sales of Equity Securities, Use of Proceeds, and Issuer Purchases of Equity Securities
Issuer Purchases of Equity Securities
The following table summarizes information with respect to the purchase of our common stock during the three months ended September 30, 2023.
| | | | | | | | | | | | | | | | | | | | | | | | | | | |
| Share Repurchases (1) |
| Period | Total Number of Shares Purchased (thousands) (2) | | | | Average Price Paid per Share Excluding Commissions | | Total Number of Shares Purchased as Part of Publicly Announced Plans or Programs (thousands) | | | | Approximate Dollar Value of Shares that May Yet Be Purchased Under the Plans or Programs (millions) |
| July 2, 2023 to July 29, 2023 | — | | | | — | | — | | | | $ | 150 | |
| July 30, 2023 to August 26, 2023 | 656 | | | | $ | 16.12 | | | 656 | | | | $ | 139 | |
| August 27, 2023 to September 30, 2023 | 1,184 | | | | $ | 16.22 | | | 1,184 | | | | $ | 120 | |
| Total | 1,840 | | | | | $ | 16.18 | | | 1,840 | | | | | |
| | | | | | | | | | | |
| | | | | | | | | | | |
| | | | | | | | | | | |
(1) This table does not include the value of equity awards surrendered to satisfy tax withholding obligations or forfeitures of equity awards.
(2) Refer to Note 19. Shareholders’ Equity to the Unaudited Consolidated Financial Statements for information about the share repurchase program.
Item 5. Other Information
During the three months ended September 30, 2023, no director or officer of the Company adopted, modified or terminated a Rule 10b5-1 trading arrangement or non-Rule 10b5-1 trading arrangement, as each term is defined in Item 408(a) of Regulation S-K.
Item 6. Exhibits
The Exhibits listed below on the Exhibit Index are filed or incorporated by reference as part of this Quarterly Report.
EXHIBIT INDEX
| | | | | | | | | | | |
Exhibit
Number | | Exhibit Description | |
| | | |
| 31.1 | | | |
| | | |
| 31.2 | | | |
| | | |
| 32.1 | | | |
| | | |
| 32.2 | | | |
| | | |
| 101.INS | | Inline XBRL Instance Document (filed herewith) | |
| | | |
| 101.SCH | | Inline XBRL Taxonomy Extension Schema (filed herewith) | |
| | | |
| 101.CAL | | Inline XBRL Taxonomy Extension Calculation Linkbase (filed herewith) | |
| | | |
| 101.DEF | | Inline XBRL Taxonomy Extension Definition Linkbase (filed herewith) | |
| | | |
| 101.LAB | | Inline XBRL Taxonomy Extension Label Linkbase (filed herewith) | |
| | | |
| 101.PRE | | Inline XBRL Taxonomy Extension Presentation Linkbase (filed herewith) | |
| | | |
| 104 | | Cover Page Interactive Data File (formatted as Inline XBRL and contained in Exhibit 101) | |
Signatures
Pursuant to the requirements of the Securities Exchange Act of 1934, the registrant has duly caused this report to be signed on its behalf by the undersigned thereunto duly authorized.
| | | | | | | | |
| Resideo Technologies, Inc. |
| | |
Date: November 1, 2023 | By: | /s/ Anthony L. Trunzo |
| | Anthony L. Trunzo
Executive Vice President and Chief Financial Officer
(on behalf of the Registrant and as the
Registrant’s Principal Financial Officer) |
| | |
Date: November 1, 2023 | By: | /s/ Tina Beskid |
| | Tina Beskid |
| | Vice President, Controller, and Chief Accounting Officer
(Principal Accounting Officer) |
Exhibit 31.1
CERTIFICATION PURSUANT TO
SECTION 302
OF THE SARBANES-OXLEY ACT OF 2002
I, Jay Geldmacher, certify that:
1.I have reviewed this Quarterly Report on Form 10-Q of Resideo Technologies, Inc.;
2.Based on my knowledge, this report does not contain any untrue statement of a material fact or omit to state a material fact necessary to make the statements made, in light of the circumstances under which such statements were made, not misleading with respect to the period covered by this report;
3.Based on my knowledge, the financial statements, and other financial information included in this report, fairly present in all material respects the financial condition, results of operations and cash flows of the registrant as of, and for, the periods presented in this report;
4.The registrant’s other certifying officer and I are responsible for establishing and maintaining disclosure controls and procedures (as defined in Exchange Act Rules 13a-15(e) and 15d-15(e)) and internal control over financial reporting (as defined in Exchange Act Rules 13a-15(f) and 15d-15(f)) for the registrant and have:
a)designed such disclosure controls and procedures, or caused such disclosure controls and procedures to be designed under our supervision, to ensure that material information relating to the registrant, including its consolidated subsidiaries, is made known to us by others within those entities, particularly during the period in which this report is being prepared;
b)designed such internal control over financial reporting, or caused such internal control over financial reporting to be designed under our supervision, to provide reasonable assurance regarding the reliability of financial reporting and the preparation of financial statements for external purposes in accordance with generally accepted accounting principles;
c)evaluated the effectiveness of the registrant’s disclosure controls and procedures and presented in this report our conclusions about the effectiveness of the disclosure controls and procedures, as of the end of the period covered by this report based on such evaluation; and
d)disclosed in this report any change in the registrant’s internal control over financial reporting that occurred during the registrant’s most recent fiscal quarter (the registrant’s fourth fiscal quarter in the case of an annual report) that has materially affected, or is reasonably likely to materially affect, the registrant’s internal control over financial reporting;
5.The registrant’s other certifying officer and I have disclosed, based on our most recent evaluation of internal control over financial reporting, to the registrant’s auditors and the audit committee of the registrant’s board of directors (or persons performing the equivalent functions):
a)all significant deficiencies and material weaknesses in the design or operation of internal control over financial reporting which are reasonably likely to adversely affect the registrant’s ability to record, process, summarize and report financial information; and
b)any fraud, whether or not material, that involves management or other employees who have a significant role in the registrant’s internal control over financial reporting.
| | | | | | | | |
Date: November 1, 2023 | By: | /s/ Jay Geldmacher |
| | Jay Geldmacher |
| | President and Chief Executive Officer |
Exhibit 31.2
CERTIFICATION PURSUANT TO
SECTION 302
OF THE SARBANES-OXLEY ACT OF 2002
I, Anthony L. Trunzo, certify that:
1.I have reviewed this Quarterly Report on Form 10-Q of Resideo Technologies, Inc.;
2.Based on my knowledge, this report does not contain any untrue statement of a material fact or omit to state a material fact necessary to make the statements made, in light of the circumstances under which such statements were made, not misleading with respect to the period covered by this report;
3.Based on my knowledge, the financial statements, and other financial information included in this report, fairly present in all material respects the financial condition, results of operations and cash flows of the registrant as of, and for, the periods presented in this report;
4.The registrant’s other certifying officer and I are responsible for establishing and maintaining disclosure controls and procedures (as defined in Exchange Act Rules 13a-15(e) and 15d-15(e)) and internal control over financial reporting (as defined in Exchange Act Rules 13a-15(f) and 15d-15(f)) for the registrant and have:
a)designed such disclosure controls and procedures, or caused such disclosure controls and procedures to be designed under our supervision, to ensure that material information relating to the registrant, including its consolidated subsidiaries, is made known to us by others within those entities, particularly during the period in which this report is being prepared;
b)designed such internal control over financial reporting, or caused such internal control over financial reporting to be designed under our supervision, to provide reasonable assurance regarding the reliability of financial reporting and the preparation of financial statements for external purposes in accordance with generally accepted accounting principles;
c)evaluated the effectiveness of the registrant’s disclosure controls and procedures and presented in this report our conclusions about the effectiveness of the disclosure controls and procedures, as of the end of the period covered by this report based on such evaluation; and
d)disclosed in this report any change in the registrant’s internal control over financial reporting that occurred during the registrant’s most recent fiscal quarter (the registrant’s fourth fiscal quarter in the case of an annual report) that has materially affected, or is reasonably likely to materially affect, the registrant’s internal control over financial reporting; and
5.The registrant’s other certifying officer and I have disclosed, based on our most recent evaluation of internal control over financial reporting, to the registrant’s auditors and the audit committee of the registrant’s board of directors (or persons performing the equivalent functions):
a.all significant deficiencies and material weaknesses in the design or operation of internal control over financial reporting which are reasonably likely to adversely affect the registrant’s ability to record, process, summarize and report financial information; and
b.any fraud, whether or not material, that involves management or other employees who have a significant role in the registrant’s internal control over financial reporting.
| | | | | | | | |
Date: November 1, 2023 | By: | /s/ Anthony L. Trunzo |
| | Anthony L. Trunzo |
| | Executive Vice President and Chief Financial Officer |
Exhibit 32.1
CERTIFICATION PURSUANT TO
18 U.S.C. SECTION 1350,
AS ADOPTED PURSUANT TO
SECTION 906 OF THE SARBANES-OXLEY ACT OF 2002
In connection with the Quarterly Report of Resideo Technologies, Inc. (the Company) on Form 10-Q for the period ended September 30, 2023 as filed with the Securities and Exchange Commission on the date hereof (the Report), I, Jay Geldmacher, President and Chief Executive Officer of the Company, certify, pursuant to 18 U.S.C. Section 1350, as adopted pursuant to Section 906 of the Sarbanes-Oxley Act of 2002, that:
(1)The Report fully complies with the requirements of Section 13(a) or 15(d) of the Securities Exchange Act of 1934; and
(2)The information contained in the Report fairly presents, in all material respects, the financial condition and results of operations of the Company.
| | | | | | | | |
Date: November 1, 2023 | By: | /s/ Jay Geldmacher |
| | Jay Geldmacher |
| | | President and Chief Executive Officer |
Exhibit 32.2
CERTIFICATION PURSUANT TO
18 U.S.C. SECTION 1350,
AS ADOPTED PURSUANT TO
SECTION 906 OF THE SARBANES-OXLEY ACT OF 2002
In connection with the Quarterly Report of Resideo Technologies, Inc. (the Company) on Form 10-Q for the period ended September 30, 2023 as filed with the Securities and Exchange Commission on the date hereof (the Report), I, Anthony L. Trunzo, Executive Vice President and Chief Financial Officer of the Company, certify, pursuant to 18 U.S.C. Section 1350, as adopted pursuant to Section 906 of the Sarbanes-Oxley Act of 2002, that:
(1)The Report fully complies with the requirements of Section 13(a) or 15(d) of the Securities Exchange Act of 1934; and
(2)The information contained in the Report fairly presents, in all material respects, the financial condition and results of operations of the Company.
| | | | | | | | |
Date: November 1, 2023 | By: | /s/ Anthony L. Trunzo |
| | Anthony L. Trunzo |
| | Executive Vice President and Chief Financial Officer |
Cover - shares
|
9 Months Ended |
|
Sep. 30, 2023 |
Oct. 20, 2023 |
| Cover [Abstract] |
|
|
| Document Type |
10-Q
|
|
| Document Quarterly Report |
true
|
|
| Document Period End Date |
Sep. 30, 2023
|
|
| Document Transition Report |
false
|
|
| Entity File Number |
001-38635
|
|
| Entity Registrant Name |
Resideo Technologies, Inc.
|
|
| Entity Incorporation, State or Country Code |
DE
|
|
| Entity Tax Identification Number |
82-5318796
|
|
| Entity Address, Address Line One |
16100 N. 71st Street
|
|
| Entity Address, Address Line Two |
Suite 550
|
|
| Entity Address, City or Town |
Scottsdale
|
|
| Entity Address, State or Province |
AZ
|
|
| Entity Address, Postal Zip Code |
85254
|
|
| City Area Code |
480
|
|
| Local Phone Number |
573-5340
|
|
| Title of 12(b) Security |
Common Stock, par value $0.001 per share
|
|
| Trading Symbol |
REZI
|
|
| Security Exchange Name |
NYSE
|
|
| Entity Current Reporting Status |
Yes
|
|
| Entity Interactive Data Current |
Yes
|
|
| Entity Filer Category |
Large Accelerated Filer
|
|
| Entity Small Business |
false
|
|
| Entity Emerging Growth Company |
false
|
|
| Entity Shell Company |
false
|
|
| Entity Common Stock, Shares Outstanding |
|
146,087,992
|
| Amendment Flag |
false
|
|
| Document Fiscal Period Focus |
Q3
|
|
| Current Fiscal Year End Date |
--12-31
|
|
| Document Fiscal Period Focus |
2023
|
|
| Entity Central Index Key |
0001740332
|
|
| X |
- DefinitionBoolean flag that is true when the XBRL content amends previously-filed or accepted submission.
| Name: |
dei_AmendmentFlag |
| Namespace Prefix: |
dei_ |
| Data Type: |
xbrli:booleanItemType |
| Balance Type: |
na |
| Period Type: |
duration |
|
| X |
- DefinitionEnd date of current fiscal year in the format --MM-DD.
| Name: |
dei_CurrentFiscalYearEndDate |
| Namespace Prefix: |
dei_ |
| Data Type: |
xbrli:gMonthDayItemType |
| Balance Type: |
na |
| Period Type: |
duration |
|
| X |
- DefinitionFiscal period values are FY, Q1, Q2, and Q3. 1st, 2nd and 3rd quarter 10-Q or 10-QT statements have value Q1, Q2, and Q3 respectively, with 10-K, 10-KT or other fiscal year statements having FY.
| Name: |
dei_DocumentFiscalPeriodFocus |
| Namespace Prefix: |
dei_ |
| Data Type: |
dei:fiscalPeriodItemType |
| Balance Type: |
na |
| Period Type: |
duration |
|
| X |
- DefinitionThis is focus fiscal year of the document report in YYYY format. For a 2006 annual report, which may also provide financial information from prior periods, fiscal 2006 should be given as the fiscal year focus. Example: 2006.
| Name: |
dei_DocumentFiscalYearFocus |
| Namespace Prefix: |
dei_ |
| Data Type: |
xbrli:gYearItemType |
| Balance Type: |
na |
| Period Type: |
duration |
|
| X |
- DefinitionFor the EDGAR submission types of Form 8-K: the date of the report, the date of the earliest event reported; for the EDGAR submission types of Form N-1A: the filing date; for all other submission types: the end of the reporting or transition period. The format of the date is YYYY-MM-DD.
| Name: |
dei_DocumentPeriodEndDate |
| Namespace Prefix: |
dei_ |
| Data Type: |
xbrli:dateItemType |
| Balance Type: |
na |
| Period Type: |
duration |
|
| X |
- DefinitionBoolean flag that is true only for a form used as an quarterly report. Reference 1: http://www.xbrl.org/2003/role/presentationRef
-Publisher SEC
-Name Form 10-Q
-Number 240
-Section 308
-Subsection a
| Name: |
dei_DocumentQuarterlyReport |
| Namespace Prefix: |
dei_ |
| Data Type: |
xbrli:booleanItemType |
| Balance Type: |
na |
| Period Type: |
duration |
|
| X |
- DefinitionBoolean flag that is true only for a form used as a transition report. Reference 1: http://www.xbrl.org/2003/role/presentationRef
-Publisher SEC
-Name Forms 10-K, 10-Q, 20-F
-Number 240
-Section 13
-Subsection a-1
| Name: |
dei_DocumentTransitionReport |
| Namespace Prefix: |
dei_ |
| Data Type: |
xbrli:booleanItemType |
| Balance Type: |
na |
| Period Type: |
duration |
|
| X |
- DefinitionThe type of document being provided (such as 10-K, 10-Q, 485BPOS, etc). The document type is limited to the same value as the supporting SEC submission type, or the word 'Other'.
| Name: |
dei_DocumentType |
| Namespace Prefix: |
dei_ |
| Data Type: |
dei:submissionTypeItemType |
| Balance Type: |
na |
| Period Type: |
duration |
|
| X |
- DefinitionAddress Line 1 such as Attn, Building Name, Street Name
| Name: |
dei_EntityAddressAddressLine1 |
| Namespace Prefix: |
dei_ |
| Data Type: |
xbrli:normalizedStringItemType |
| Balance Type: |
na |
| Period Type: |
duration |
|
| X |
- DefinitionAddress Line 2 such as Street or Suite number
| Name: |
dei_EntityAddressAddressLine2 |
| Namespace Prefix: |
dei_ |
| Data Type: |
xbrli:normalizedStringItemType |
| Balance Type: |
na |
| Period Type: |
duration |
|
| X |
- Definition
+ References
+ Details
| Name: |
dei_EntityAddressCityOrTown |
| Namespace Prefix: |
dei_ |
| Data Type: |
xbrli:normalizedStringItemType |
| Balance Type: |
na |
| Period Type: |
duration |
|
| X |
- DefinitionCode for the postal or zip code
| Name: |
dei_EntityAddressPostalZipCode |
| Namespace Prefix: |
dei_ |
| Data Type: |
xbrli:normalizedStringItemType |
| Balance Type: |
na |
| Period Type: |
duration |
|
| X |
- DefinitionName of the state or province.
| Name: |
dei_EntityAddressStateOrProvince |
| Namespace Prefix: |
dei_ |
| Data Type: |
dei:stateOrProvinceItemType |
| Balance Type: |
na |
| Period Type: |
duration |
|
| X |
- DefinitionA unique 10-digit SEC-issued value to identify entities that have filed disclosures with the SEC. It is commonly abbreviated as CIK. Reference 1: http://www.xbrl.org/2003/role/presentationRef
-Publisher SEC
-Name Exchange Act
-Number 240
-Section 12
-Subsection b-2
| Name: |
dei_EntityCentralIndexKey |
| Namespace Prefix: |
dei_ |
| Data Type: |
dei:centralIndexKeyItemType |
| Balance Type: |
na |
| Period Type: |
duration |
|
| X |
- DefinitionIndicate number of shares or other units outstanding of each of registrant's classes of capital or common stock or other ownership interests, if and as stated on cover of related periodic report. Where multiple classes or units exist define each class/interest by adding class of stock items such as Common Class A [Member], Common Class B [Member] or Partnership Interest [Member] onto the Instrument [Domain] of the Entity Listings, Instrument.
| Name: |
dei_EntityCommonStockSharesOutstanding |
| Namespace Prefix: |
dei_ |
| Data Type: |
xbrli:sharesItemType |
| Balance Type: |
na |
| Period Type: |
instant |
|
| X |
- DefinitionIndicate 'Yes' or 'No' whether registrants (1) have filed all reports required to be filed by Section 13 or 15(d) of the Securities Exchange Act of 1934 during the preceding 12 months (or for such shorter period that registrants were required to file such reports), and (2) have been subject to such filing requirements for the past 90 days. This information should be based on the registrant's current or most recent filing containing the related disclosure.
| Name: |
dei_EntityCurrentReportingStatus |
| Namespace Prefix: |
dei_ |
| Data Type: |
dei:yesNoItemType |
| Balance Type: |
na |
| Period Type: |
duration |
|
| X |
- DefinitionIndicate if registrant meets the emerging growth company criteria. Reference 1: http://www.xbrl.org/2003/role/presentationRef
-Publisher SEC
-Name Exchange Act
-Number 240
-Section 12
-Subsection b-2
| Name: |
dei_EntityEmergingGrowthCompany |
| Namespace Prefix: |
dei_ |
| Data Type: |
xbrli:booleanItemType |
| Balance Type: |
na |
| Period Type: |
duration |
|
| X |
- DefinitionCommission file number. The field allows up to 17 characters. The prefix may contain 1-3 digits, the sequence number may contain 1-8 digits, the optional suffix may contain 1-4 characters, and the fields are separated with a hyphen.
| Name: |
dei_EntityFileNumber |
| Namespace Prefix: |
dei_ |
| Data Type: |
dei:fileNumberItemType |
| Balance Type: |
na |
| Period Type: |
duration |
|
| X |
- DefinitionIndicate whether the registrant is one of the following: Large Accelerated Filer, Accelerated Filer, Non-accelerated Filer. Definitions of these categories are stated in Rule 12b-2 of the Exchange Act. This information should be based on the registrant's current or most recent filing containing the related disclosure. Reference 1: http://www.xbrl.org/2003/role/presentationRef
-Publisher SEC
-Name Exchange Act
-Number 240
-Section 12
-Subsection b-2
| Name: |
dei_EntityFilerCategory |
| Namespace Prefix: |
dei_ |
| Data Type: |
dei:filerCategoryItemType |
| Balance Type: |
na |
| Period Type: |
duration |
|
| X |
- DefinitionTwo-character EDGAR code representing the state or country of incorporation.
| Name: |
dei_EntityIncorporationStateCountryCode |
| Namespace Prefix: |
dei_ |
| Data Type: |
dei:edgarStateCountryItemType |
| Balance Type: |
na |
| Period Type: |
duration |
|
| X |
- DefinitionBoolean flag that is true when the registrant has submitted electronically every Interactive Data File required to be submitted pursuant to Rule 405 of Regulation S-T during the preceding 12 months (or for such shorter period that the registrant was required to submit such files). Reference 1: http://www.xbrl.org/2003/role/presentationRef
-Publisher SEC
-Name Regulation S-T
-Number 232
-Section 405
| Name: |
dei_EntityInteractiveDataCurrent |
| Namespace Prefix: |
dei_ |
| Data Type: |
dei:yesNoItemType |
| Balance Type: |
na |
| Period Type: |
duration |
|
| X |
- DefinitionThe exact name of the entity filing the report as specified in its charter, which is required by forms filed with the SEC. Reference 1: http://www.xbrl.org/2003/role/presentationRef
-Publisher SEC
-Name Exchange Act
-Number 240
-Section 12
-Subsection b-2
| Name: |
dei_EntityRegistrantName |
| Namespace Prefix: |
dei_ |
| Data Type: |
xbrli:normalizedStringItemType |
| Balance Type: |
na |
| Period Type: |
duration |
|
| X |
- DefinitionBoolean flag that is true when the registrant is a shell company as defined in Rule 12b-2 of the Exchange Act. Reference 1: http://www.xbrl.org/2003/role/presentationRef
-Publisher SEC
-Name Exchange Act
-Number 240
-Section 12
-Subsection b-2
| Name: |
dei_EntityShellCompany |
| Namespace Prefix: |
dei_ |
| Data Type: |
xbrli:booleanItemType |
| Balance Type: |
na |
| Period Type: |
duration |
|
| X |
- DefinitionIndicates that the company is a Smaller Reporting Company (SRC). Reference 1: http://www.xbrl.org/2003/role/presentationRef
-Publisher SEC
-Name Exchange Act
-Number 240
-Section 12
-Subsection b-2
| Name: |
dei_EntitySmallBusiness |
| Namespace Prefix: |
dei_ |
| Data Type: |
xbrli:booleanItemType |
| Balance Type: |
na |
| Period Type: |
duration |
|
| X |
- DefinitionThe Tax Identification Number (TIN), also known as an Employer Identification Number (EIN), is a unique 9-digit value assigned by the IRS. Reference 1: http://www.xbrl.org/2003/role/presentationRef
-Publisher SEC
-Name Exchange Act
-Number 240
-Section 12
-Subsection b-2
| Name: |
dei_EntityTaxIdentificationNumber |
| Namespace Prefix: |
dei_ |
| Data Type: |
dei:employerIdItemType |
| Balance Type: |
na |
| Period Type: |
duration |
|
| X |
- DefinitionLocal phone number for entity.
| Name: |
dei_LocalPhoneNumber |
| Namespace Prefix: |
dei_ |
| Data Type: |
xbrli:normalizedStringItemType |
| Balance Type: |
na |
| Period Type: |
duration |
|
| X |
- DefinitionTitle of a 12(b) registered security. Reference 1: http://www.xbrl.org/2003/role/presentationRef
-Publisher SEC
-Name Exchange Act
-Number 240
-Section 12
-Subsection b
| Name: |
dei_Security12bTitle |
| Namespace Prefix: |
dei_ |
| Data Type: |
dei:securityTitleItemType |
| Balance Type: |
na |
| Period Type: |
duration |
|
| X |
- DefinitionName of the Exchange on which a security is registered. Reference 1: http://www.xbrl.org/2003/role/presentationRef
-Publisher SEC
-Name Exchange Act
-Number 240
-Section 12
-Subsection d1-1
| Name: |
dei_SecurityExchangeName |
| Namespace Prefix: |
dei_ |
| Data Type: |
dei:edgarExchangeCodeItemType |
| Balance Type: |
na |
| Period Type: |
duration |
|
| X |
- DefinitionTrading symbol of an instrument as listed on an exchange.
| Name: |
dei_TradingSymbol |
| Namespace Prefix: |
dei_ |
| Data Type: |
dei:tradingSymbolItemType |
| Balance Type: |
na |
| Period Type: |
duration |
|
v3.23.3
CONSOLIDATED BALANCE SHEETS (UNAUDITED) - USD ($)
$ in Millions |
Sep. 30, 2023 |
Dec. 31, 2022 |
| Current assets: |
|
|
| Cash and cash equivalents |
$ 368
|
$ 326
|
| Accounts receivable, net |
988
|
1,002
|
| Inventories, net |
970
|
975
|
| Other current assets |
289
|
199
|
| Total current assets |
2,615
|
2,502
|
| Property, plant and equipment, net |
380
|
366
|
| Goodwill |
2,687
|
2,724
|
| Intangible assets, net |
456
|
475
|
| Other assets |
321
|
320
|
| Total assets |
6,459
|
6,387
|
| Current liabilities: |
|
|
| Accounts payable |
863
|
894
|
| Current portion of long-term debt |
12
|
12
|
| Accrued liabilities |
592
|
640
|
| Total current liabilities |
1,467
|
1,546
|
| Long-term debt |
1,397
|
1,404
|
| Obligations payable under Indemnification Agreements |
599
|
580
|
| Other liabilities |
351
|
328
|
| Total liabilities |
3,814
|
3,858
|
| COMMITMENTS AND CONTINGENCIES |
|
|
| Stockholders’ equity |
|
|
| Common stock, $0.001 par value: 700 shares authorized, 151 and 146 shares issued and outstanding at September 30, 2023, respectively, and 148 and 146 shares issued and outstanding at December 31, 2022, respectively |
0
|
0
|
| Additional paid-in capital |
2,219
|
2,176
|
| Retained earnings |
728
|
600
|
| Accumulated other comprehensive loss, net |
(221)
|
(212)
|
| Treasury stock at cost |
(81)
|
(35)
|
| Total stockholders’ equity |
2,645
|
2,529
|
| Total liabilities and stockholders’ equity |
$ 6,459
|
$ 6,387
|
| X |
- DefinitionObligations payable under indemnification agreements.
| Name: |
rezi_ObligationsPayableUnderIndemnificationAgreements |
| Namespace Prefix: |
rezi_ |
| Data Type: |
xbrli:monetaryItemType |
| Balance Type: |
credit |
| Period Type: |
instant |
|
| X |
- DefinitionCarrying value as of the balance sheet date of liabilities incurred (and for which invoices have typically been received) and payable to vendors for goods and services received that are used in an entity's business. Used to reflect the current portion of the liabilities (due within one year or within the normal operating cycle if longer). Reference 1: http://www.xbrl.org/2003/role/exampleRef
-Topic 852
-SubTopic 10
-Name Accounting Standards Codification
-Section 55
-Paragraph 10
-Publisher FASB
-URI https://asc.fasb.org//1943274/2147481372/852-10-55-10
Reference 2: http://fasb.org/us-gaap/role/ref/legacyRef
-Name Accounting Standards Codification
-Topic 210
-SubTopic 10
-Section S99
-Paragraph 1
-Subparagraph (SX 210.5-02.19(a))
-Publisher FASB
-URI https://asc.fasb.org//1943274/2147480566/210-10-S99-1
| Name: |
us-gaap_AccountsPayableCurrent |
| Namespace Prefix: |
us-gaap_ |
| Data Type: |
xbrli:monetaryItemType |
| Balance Type: |
credit |
| Period Type: |
instant |
|
| X |
- DefinitionCarrying value as of the balance sheet date of obligations incurred and payable, pertaining to costs that are statutory in nature, are incurred on contractual obligations, or accumulate over time and for which invoices have not yet been received or will not be rendered. Examples include taxes, interest, rent and utilities. Used to reflect the current portion of the liabilities (due within one year or within the normal operating cycle if longer). Reference 1: http://fasb.org/us-gaap/role/ref/legacyRef
-Name Accounting Standards Codification
-Topic 210
-SubTopic 10
-Section S99
-Paragraph 1
-Subparagraph (SX 210.5-02.20)
-Publisher FASB
-URI https://asc.fasb.org//1943274/2147480566/210-10-S99-1
| Name: |
us-gaap_AccruedLiabilitiesCurrent |
| Namespace Prefix: |
us-gaap_ |
| Data Type: |
xbrli:monetaryItemType |
| Balance Type: |
credit |
| Period Type: |
instant |
|
| X |
- DefinitionAmount, after tax, of accumulated increase (decrease) in equity from transaction and other event and circumstance from nonowner source. Reference 1: http://fasb.org/us-gaap/role/ref/legacyRef
-Name Accounting Standards Codification
-Topic 220
-SubTopic 10
-Section 45
-Paragraph 14A
-Publisher FASB
-URI https://asc.fasb.org//1943274/2147482790/220-10-45-14A
Reference 2: http://fasb.org/us-gaap/role/ref/legacyRef
-Topic 220
-SubTopic 10
-Name Accounting Standards Codification
-Section 45
-Paragraph 11
-Publisher FASB
-URI https://asc.fasb.org//1943274/2147482790/220-10-45-11
Reference 3: http://www.xbrl.org/2003/role/disclosureRef
-Topic 944
-SubTopic 40
-Name Accounting Standards Codification
-Section 65
-Paragraph 2
-Subparagraph (g)(2)(ii)
-Publisher FASB
-URI https://asc.fasb.org//1943274/2147480016/944-40-65-2
Reference 4: http://www.xbrl.org/2003/role/disclosureRef
-Topic 944
-SubTopic 40
-Name Accounting Standards Codification
-Section 65
-Paragraph 2
-Subparagraph (h)(2)
-Publisher FASB
-URI https://asc.fasb.org//1943274/2147480016/944-40-65-2
Reference 5: http://www.xbrl.org/2003/role/disclosureRef
-Topic 210
-SubTopic 10
-Name Accounting Standards Codification
-Section S99
-Paragraph 1
-Subparagraph (SX 210.5-02(30)(a)(4))
-Publisher FASB
-URI https://asc.fasb.org//1943274/2147480566/210-10-S99-1
Reference 6: http://www.xbrl.org/2003/role/disclosureRef
-Topic 944
-SubTopic 210
-Name Accounting Standards Codification
-Section S99
-Paragraph 1
-Subparagraph (SX 210.7-03(a)(23)(a)(3))
-Publisher FASB
-URI https://asc.fasb.org//1943274/2147479440/944-210-S99-1
Reference 7: http://fasb.org/us-gaap/role/ref/legacyRef
-Name Accounting Standards Codification
-Topic 220
-SubTopic 10
-Section 45
-Paragraph 14
-Publisher FASB
-URI https://asc.fasb.org//1943274/2147482790/220-10-45-14
| Name: |
us-gaap_AccumulatedOtherComprehensiveIncomeLossNetOfTax |
| Namespace Prefix: |
us-gaap_ |
| Data Type: |
xbrli:monetaryItemType |
| Balance Type: |
credit |
| Period Type: |
instant |
|
| X |
- DefinitionAmount of excess of issue price over par or stated value of stock and from other transaction involving stock or stockholder. Includes, but is not limited to, additional paid-in capital (APIC) for common and preferred stock. Reference 1: http://www.xbrl.org/2003/role/exampleRef
-Topic 852
-SubTopic 10
-Name Accounting Standards Codification
-Section 55
-Paragraph 10
-Publisher FASB
-URI https://asc.fasb.org//1943274/2147481372/852-10-55-10
Reference 2: http://www.xbrl.org/2009/role/commonPracticeRef
-Topic 946
-SubTopic 210
-Name Accounting Standards Codification
-Section S99
-Paragraph 1
-Subparagraph (SX 210.6-04(18))
-Publisher FASB
-URI https://asc.fasb.org//1943274/2147479617/946-210-S99-1
Reference 3: http://fasb.org/us-gaap/role/ref/legacyRef
-Topic 210
-SubTopic 10
-Name Accounting Standards Codification
-Section S99
-Paragraph 1
-Subparagraph (SX 210.5-02(30)(a)(1))
-Publisher FASB
-URI https://asc.fasb.org//1943274/2147480566/210-10-S99-1
| Name: |
us-gaap_AdditionalPaidInCapital |
| Namespace Prefix: |
us-gaap_ |
| Data Type: |
xbrli:monetaryItemType |
| Balance Type: |
credit |
| Period Type: |
instant |
|
| X |
- DefinitionSum of the carrying amounts as of the balance sheet date of all assets that are recognized. Assets are probable future economic benefits obtained or controlled by an entity as a result of past transactions or events. Reference 1: http://www.xbrl.org/2003/role/disclosureRef
-Topic 810
-SubTopic 10
-Name Accounting Standards Codification
-Section 50
-Paragraph 3
-Subparagraph (bb)
-Publisher FASB
-URI https://asc.fasb.org//1943274/2147481203/810-10-50-3
Reference 2: http://www.xbrl.org/2003/role/disclosureRef
-Topic 810
-SubTopic 10
-Name Accounting Standards Codification
-Section 45
-Paragraph 25
-Subparagraph (a)
-Publisher FASB
-URI https://asc.fasb.org//1943274/2147481231/810-10-45-25
Reference 3: http://www.xbrl.org/2003/role/disclosureRef
-Topic 235
-SubTopic 10
-Name Accounting Standards Codification
-Section S99
-Paragraph 1
-Subparagraph (SX 210.4-08(g)(1)(ii))
-Publisher FASB
-URI https://asc.fasb.org//1943274/2147480678/235-10-S99-1
Reference 4: http://www.xbrl.org/2003/role/disclosureRef
-Topic 323
-SubTopic 10
-Name Accounting Standards Codification
-Section 50
-Paragraph 3
-Subparagraph (c)
-Publisher FASB
-URI https://asc.fasb.org//1943274/2147481687/323-10-50-3
Reference 5: http://www.xbrl.org/2003/role/disclosureRef
-Topic 825
-SubTopic 10
-Name Accounting Standards Codification
-Section 50
-Paragraph 28
-Subparagraph (f)
-Publisher FASB
-URI https://asc.fasb.org//1943274/2147482907/825-10-50-28
Reference 6: http://www.xbrl.org/2003/role/exampleRef
-Topic 852
-SubTopic 10
-Name Accounting Standards Codification
-Section 55
-Paragraph 10
-Publisher FASB
-URI https://asc.fasb.org//1943274/2147481372/852-10-55-10
Reference 7: http://www.xbrl.org/2003/role/exampleRef
-Topic 946
-SubTopic 830
-Name Accounting Standards Codification
-Section 55
-Paragraph 12
-Publisher FASB
-URI https://asc.fasb.org//1943274/2147480167/946-830-55-12
Reference 8: http://www.xbrl.org/2003/role/disclosureRef
-Topic 944
-SubTopic 210
-Name Accounting Standards Codification
-Section S99
-Paragraph 1
-Subparagraph (SX 210.7-03(a)(12))
-Publisher FASB
-URI https://asc.fasb.org//1943274/2147479440/944-210-S99-1
Reference 9: http://www.xbrl.org/2003/role/disclosureRef
-Topic 280
-SubTopic 10
-Name Accounting Standards Codification
-Section 50
-Paragraph 22
-Publisher FASB
-URI https://asc.fasb.org//1943274/2147482810/280-10-50-22
Reference 10: http://www.xbrl.org/2003/role/disclosureRef
-Topic 946
-SubTopic 210
-Name Accounting Standards Codification
-Section S99
-Paragraph 1
-Subparagraph (SX 210.6-04(8))
-Publisher FASB
-URI https://asc.fasb.org//1943274/2147479617/946-210-S99-1
Reference 11: http://www.xbrl.org/2003/role/disclosureRef
-Topic 210
-SubTopic 10
-Name Accounting Standards Codification
-Section S99
-Paragraph 1
-Subparagraph (SX 210.5-02(18))
-Publisher FASB
-URI https://asc.fasb.org//1943274/2147480566/210-10-S99-1
Reference 12: http://www.xbrl.org/2003/role/disclosureRef
-Topic 470
-SubTopic 10
-Name Accounting Standards Codification
-Section S99
-Paragraph 1A
-Subparagraph (SX 210.13-01(a)(4)(i))
-Publisher FASB
-URI https://asc.fasb.org//1943274/2147480097/470-10-S99-1A
Reference 13: http://www.xbrl.org/2009/role/commonPracticeRef
-Topic 470
-SubTopic 10
-Name Accounting Standards Codification
-Section S99
-Paragraph 1A
-Subparagraph (SX 210.13-01(a)(4)(ii))
-Publisher FASB
-URI https://asc.fasb.org//1943274/2147480097/470-10-S99-1A
Reference 14: http://www.xbrl.org/2009/role/commonPracticeRef
-Topic 470
-SubTopic 10
-Name Accounting Standards Codification
-Section S99
-Paragraph 1A
-Subparagraph (SX 210.13-01(a)(4)(iii))
-Publisher FASB
-URI https://asc.fasb.org//1943274/2147480097/470-10-S99-1A
Reference 15: http://www.xbrl.org/2003/role/disclosureRef
-Topic 470
-SubTopic 10
-Name Accounting Standards Codification
-Section S99
-Paragraph 1A
-Subparagraph (SX 210.13-01(a)(4)(iii)(A))
-Publisher FASB
-URI https://asc.fasb.org//1943274/2147480097/470-10-S99-1A
Reference 16: http://www.xbrl.org/2003/role/disclosureRef
-Topic 470
-SubTopic 10
-Name Accounting Standards Codification
-Section S99
-Paragraph 1A
-Subparagraph (SX 210.13-01(a)(4)(iv))
-Publisher FASB
-URI https://asc.fasb.org//1943274/2147480097/470-10-S99-1A
Reference 17: http://www.xbrl.org/2003/role/disclosureRef
-Topic 470
-SubTopic 10
-Name Accounting Standards Codification
-Section S99
-Paragraph 1A
-Subparagraph (SX 210.13-01(a)(5))
-Publisher FASB
-URI https://asc.fasb.org//1943274/2147480097/470-10-S99-1A
Reference 18: http://www.xbrl.org/2003/role/disclosureRef
-Topic 470
-SubTopic 10
-Name Accounting Standards Codification
-Section S99
-Paragraph 1B
-Subparagraph (SX 210.13-02(a)(4)(i))
-Publisher FASB
-URI https://asc.fasb.org//1943274/2147480097/470-10-S99-1B
Reference 19: http://www.xbrl.org/2003/role/disclosureRef
-Topic 470
-SubTopic 10
-Name Accounting Standards Codification
-Section S99
-Paragraph 1B
-Subparagraph (SX 210.13-02(a)(4)(iii)(A))
-Publisher FASB
-URI https://asc.fasb.org//1943274/2147480097/470-10-S99-1B
Reference 20: http://www.xbrl.org/2003/role/disclosureRef
-Topic 470
-SubTopic 10
-Name Accounting Standards Codification
-Section S99
-Paragraph 1B
-Subparagraph (SX 210.13-02(a)(4)(iii)(B))
-Publisher FASB
-URI https://asc.fasb.org//1943274/2147480097/470-10-S99-1B
Reference 21: http://www.xbrl.org/2003/role/disclosureRef
-Topic 470
-SubTopic 10
-Name Accounting Standards Codification
-Section S99
-Paragraph 1B
-Subparagraph (SX 210.13-02(a)(4)(iv))
-Publisher FASB
-URI https://asc.fasb.org//1943274/2147480097/470-10-S99-1B
Reference 22: http://www.xbrl.org/2003/role/disclosureRef
-Topic 470
-SubTopic 10
-Name Accounting Standards Codification
-Section S99
-Paragraph 1B
-Subparagraph (SX 210.13-02(a)(5))
-Publisher FASB
-URI https://asc.fasb.org//1943274/2147480097/470-10-S99-1B
Reference 23: http://www.xbrl.org/2009/role/commonPracticeRef
-Topic 852
-SubTopic 10
-Name Accounting Standards Codification
-Section 50
-Paragraph 7
-Subparagraph (a)
-Publisher FASB
-URI https://asc.fasb.org//1943274/2147481404/852-10-50-7
Reference 24: http://www.xbrl.org/2003/role/disclosureRef
-Topic 280
-SubTopic 10
-Name Accounting Standards Codification
-Section 50
-Paragraph 30
-Subparagraph (c)
-Publisher FASB
-URI https://asc.fasb.org//1943274/2147482810/280-10-50-30
Reference 25: http://www.xbrl.org/2003/role/disclosureRef
-Topic 280
-SubTopic 10
-Name Accounting Standards Codification
-Section 50
-Paragraph 32
-Subparagraph (d)
-Publisher FASB
-URI https://asc.fasb.org//1943274/2147482810/280-10-50-32
Reference 26: http://fasb.org/us-gaap/role/ref/legacyRef
-Topic 942
-SubTopic 210
-Name Accounting Standards Codification
-Section S99
-Paragraph 1
-Subparagraph (SX 210.9-03(11))
-Publisher FASB
-URI https://asc.fasb.org//1943274/2147479853/942-210-S99-1
| Name: |
us-gaap_Assets |
| Namespace Prefix: |
us-gaap_ |
| Data Type: |
xbrli:monetaryItemType |
| Balance Type: |
debit |
| Period Type: |
instant |
|
| X |
- DefinitionSum of the carrying amounts as of the balance sheet date of all assets that are expected to be realized in cash, sold, or consumed within one year (or the normal operating cycle, if longer). Assets are probable future economic benefits obtained or controlled by an entity as a result of past transactions or events. Reference 1: http://www.xbrl.org/2003/role/disclosureRef
-Topic 810
-SubTopic 10
-Name Accounting Standards Codification
-Section 50
-Paragraph 3
-Subparagraph (bb)
-Publisher FASB
-URI https://asc.fasb.org//1943274/2147481203/810-10-50-3
Reference 2: http://www.xbrl.org/2003/role/disclosureRef
-Topic 810
-SubTopic 10
-Name Accounting Standards Codification
-Section 45
-Paragraph 25
-Subparagraph (a)
-Publisher FASB
-URI https://asc.fasb.org//1943274/2147481231/810-10-45-25
Reference 3: http://www.xbrl.org/2003/role/disclosureRef
-Topic 235
-SubTopic 10
-Name Accounting Standards Codification
-Section S99
-Paragraph 1
-Subparagraph (SX 210.4-08(g)(1)(ii))
-Publisher FASB
-URI https://asc.fasb.org//1943274/2147480678/235-10-S99-1
Reference 4: http://www.xbrl.org/2003/role/disclosureRef
-Topic 323
-SubTopic 10
-Name Accounting Standards Codification
-Section 50
-Paragraph 3
-Subparagraph (c)
-Publisher FASB
-URI https://asc.fasb.org//1943274/2147481687/323-10-50-3
Reference 5: http://www.xbrl.org/2003/role/disclosureRef
-Topic 825
-SubTopic 10
-Name Accounting Standards Codification
-Section 50
-Paragraph 28
-Subparagraph (f)
-Publisher FASB
-URI https://asc.fasb.org//1943274/2147482907/825-10-50-28
Reference 6: http://www.xbrl.org/2003/role/exampleRef
-Topic 852
-SubTopic 10
-Name Accounting Standards Codification
-Section 55
-Paragraph 10
-Publisher FASB
-URI https://asc.fasb.org//1943274/2147481372/852-10-55-10
Reference 7: http://www.xbrl.org/2003/role/disclosureRef
-Topic 210
-SubTopic 10
-Name Accounting Standards Codification
-Section 45
-Paragraph 1
-Publisher FASB
-URI https://asc.fasb.org//1943274/2147483467/210-10-45-1
Reference 8: http://www.xbrl.org/2003/role/disclosureRef
-Topic 210
-SubTopic 10
-Name Accounting Standards Codification
-Section S99
-Paragraph 1
-Subparagraph (SX 210.5-02(9))
-Publisher FASB
-URI https://asc.fasb.org//1943274/2147480566/210-10-S99-1
Reference 9: http://www.xbrl.org/2003/role/disclosureRef
-Topic 470
-SubTopic 10
-Name Accounting Standards Codification
-Section S99
-Paragraph 1A
-Subparagraph (SX 210.13-01(a)(4)(i))
-Publisher FASB
-URI https://asc.fasb.org//1943274/2147480097/470-10-S99-1A
Reference 10: http://www.xbrl.org/2009/role/commonPracticeRef
-Topic 470
-SubTopic 10
-Name Accounting Standards Codification
-Section S99
-Paragraph 1A
-Subparagraph (SX 210.13-01(a)(4)(ii))
-Publisher FASB
-URI https://asc.fasb.org//1943274/2147480097/470-10-S99-1A
Reference 11: http://www.xbrl.org/2009/role/commonPracticeRef
-Topic 470
-SubTopic 10
-Name Accounting Standards Codification
-Section S99
-Paragraph 1A
-Subparagraph (SX 210.13-01(a)(4)(iii))
-Publisher FASB
-URI https://asc.fasb.org//1943274/2147480097/470-10-S99-1A
Reference 12: http://www.xbrl.org/2003/role/disclosureRef
-Topic 470
-SubTopic 10
-Name Accounting Standards Codification
-Section S99
-Paragraph 1A
-Subparagraph (SX 210.13-01(a)(4)(iii)(A))
-Publisher FASB
-URI https://asc.fasb.org//1943274/2147480097/470-10-S99-1A
Reference 13: http://www.xbrl.org/2003/role/disclosureRef
-Topic 470
-SubTopic 10
-Name Accounting Standards Codification
-Section S99
-Paragraph 1A
-Subparagraph (SX 210.13-01(a)(4)(iv))
-Publisher FASB
-URI https://asc.fasb.org//1943274/2147480097/470-10-S99-1A
Reference 14: http://www.xbrl.org/2003/role/disclosureRef
-Topic 470
-SubTopic 10
-Name Accounting Standards Codification
-Section S99
-Paragraph 1A
-Subparagraph (SX 210.13-01(a)(5))
-Publisher FASB
-URI https://asc.fasb.org//1943274/2147480097/470-10-S99-1A
Reference 15: http://www.xbrl.org/2003/role/disclosureRef
-Topic 470
-SubTopic 10
-Name Accounting Standards Codification
-Section S99
-Paragraph 1B
-Subparagraph (SX 210.13-02(a)(4)(i))
-Publisher FASB
-URI https://asc.fasb.org//1943274/2147480097/470-10-S99-1B
Reference 16: http://www.xbrl.org/2003/role/disclosureRef
-Topic 470
-SubTopic 10
-Name Accounting Standards Codification
-Section S99
-Paragraph 1B
-Subparagraph (SX 210.13-02(a)(4)(iii)(A))
-Publisher FASB
-URI https://asc.fasb.org//1943274/2147480097/470-10-S99-1B
Reference 17: http://www.xbrl.org/2003/role/disclosureRef
-Topic 470
-SubTopic 10
-Name Accounting Standards Codification
-Section S99
-Paragraph 1B
-Subparagraph (SX 210.13-02(a)(4)(iii)(B))
-Publisher FASB
-URI https://asc.fasb.org//1943274/2147480097/470-10-S99-1B
Reference 18: http://www.xbrl.org/2003/role/disclosureRef
-Topic 470
-SubTopic 10
-Name Accounting Standards Codification
-Section S99
-Paragraph 1B
-Subparagraph (SX 210.13-02(a)(4)(iv))
-Publisher FASB
-URI https://asc.fasb.org//1943274/2147480097/470-10-S99-1B
Reference 19: http://www.xbrl.org/2003/role/disclosureRef
-Topic 470
-SubTopic 10
-Name Accounting Standards Codification
-Section S99
-Paragraph 1B
-Subparagraph (SX 210.13-02(a)(5))
-Publisher FASB
-URI https://asc.fasb.org//1943274/2147480097/470-10-S99-1B
Reference 20: http://www.xbrl.org/2009/role/commonPracticeRef
-Topic 852
-SubTopic 10
-Name Accounting Standards Codification
-Section 50
-Paragraph 7
-Subparagraph (a)
-Publisher FASB
-URI https://asc.fasb.org//1943274/2147481404/852-10-50-7
| Name: |
us-gaap_AssetsCurrent |
| Namespace Prefix: |
us-gaap_ |
| Data Type: |
xbrli:monetaryItemType |
| Balance Type: |
debit |
| Period Type: |
instant |
|
| X |
- References
+ Details
| Name: |
us-gaap_AssetsCurrentAbstract |
| Namespace Prefix: |
us-gaap_ |
| Data Type: |
xbrli:stringItemType |
| Balance Type: |
na |
| Period Type: |
duration |
|
| X |
- DefinitionAmount of currency on hand as well as demand deposits with banks or financial institutions. Includes other kinds of accounts that have the general characteristics of demand deposits. Also includes short-term, highly liquid investments that are both readily convertible to known amounts of cash and so near their maturity that they present insignificant risk of changes in value because of changes in interest rates. Excludes cash and cash equivalents within disposal group and discontinued operation. Reference 1: http://www.xbrl.org/2003/role/disclosureRef
-Topic 210
-SubTopic 10
-Name Accounting Standards Codification
-Section S99
-Paragraph 1
-Subparagraph (SX 210.5-02(1))
-Publisher FASB
-URI https://asc.fasb.org//1943274/2147480566/210-10-S99-1
Reference 2: http://www.xbrl.org/2003/role/exampleRef
-Topic 210
-SubTopic 10
-Name Accounting Standards Codification
-Section 45
-Paragraph 1
-Subparagraph (a)
-Publisher FASB
-URI https://asc.fasb.org//1943274/2147483467/210-10-45-1
Reference 3: http://fasb.org/us-gaap/role/ref/legacyRef
-Name Accounting Standards Codification
-Topic 230
-SubTopic 10
-Section 45
-Paragraph 4
-Publisher FASB
-URI https://asc.fasb.org//1943274/2147482740/230-10-45-4
| Name: |
us-gaap_CashAndCashEquivalentsAtCarryingValue |
| Namespace Prefix: |
us-gaap_ |
| Data Type: |
xbrli:monetaryItemType |
| Balance Type: |
debit |
| Period Type: |
instant |
|
| X |
- DefinitionRepresents the caption on the face of the balance sheet to indicate that the entity has entered into (1) purchase or supply arrangements that will require expending a portion of its resources to meet the terms thereof, and (2) is exposed to potential losses or, less frequently, gains, arising from (a) possible claims against a company's resources due to future performance under contract terms, and (b) possible losses or likely gains from uncertainties that will ultimately be resolved when one or more future events that are deemed likely to occur do occur or fail to occur. Reference 1: http://www.xbrl.org/2003/role/disclosureRef
-Topic 944
-SubTopic 210
-Name Accounting Standards Codification
-Section S99
-Paragraph 1
-Subparagraph (SX 210.7-03(a)(19))
-Publisher FASB
-URI https://asc.fasb.org//1943274/2147479440/944-210-S99-1
Reference 2: http://www.xbrl.org/2003/role/disclosureRef
-Topic 946
-SubTopic 210
-Name Accounting Standards Codification
-Section S99
-Paragraph 1
-Subparagraph (SX 210.6-04(15))
-Publisher FASB
-URI https://asc.fasb.org//1943274/2147479617/946-210-S99-1
Reference 3: http://fasb.org/us-gaap/role/ref/legacyRef
-Name Accounting Standards Codification
-Topic 942
-SubTopic 210
-Section S99
-Paragraph 1
-Subparagraph (SX 210.9-03.17)
-Publisher FASB
-URI https://asc.fasb.org//1943274/2147479853/942-210-S99-1
Reference 4: http://fasb.org/us-gaap/role/ref/legacyRef
-Name Accounting Standards Codification
-Topic 210
-SubTopic 10
-Section S99
-Paragraph 1
-Subparagraph (SX 210.5-02.25)
-Publisher FASB
-URI https://asc.fasb.org//1943274/2147480566/210-10-S99-1
| Name: |
us-gaap_CommitmentsAndContingencies |
| Namespace Prefix: |
us-gaap_ |
| Data Type: |
xbrli:monetaryItemType |
| Balance Type: |
credit |
| Period Type: |
instant |
|
| X |
- DefinitionAggregate par or stated value of issued nonredeemable common stock (or common stock redeemable solely at the option of the issuer). This item includes treasury stock repurchased by the entity. Note: elements for number of nonredeemable common shares, par value and other disclosure concepts are in another section within stockholders' equity. Reference 1: http://www.xbrl.org/2003/role/exampleRef
-Topic 852
-SubTopic 10
-Name Accounting Standards Codification
-Section 55
-Paragraph 10
-Publisher FASB
-URI https://asc.fasb.org//1943274/2147481372/852-10-55-10
Reference 2: http://www.xbrl.org/2003/role/disclosureRef
-Topic 944
-SubTopic 210
-Name Accounting Standards Codification
-Section S99
-Paragraph 1
-Subparagraph (SX 210.7-03(a)(22))
-Publisher FASB
-URI https://asc.fasb.org//1943274/2147479440/944-210-S99-1
Reference 3: http://fasb.org/us-gaap/role/ref/legacyRef
-Topic 210
-SubTopic 10
-Name Accounting Standards Codification
-Section S99
-Paragraph 1
-Subparagraph (SX 210.5-02(29))
-Publisher FASB
-URI https://asc.fasb.org//1943274/2147480566/210-10-S99-1
| Name: |
us-gaap_CommonStockValue |
| Namespace Prefix: |
us-gaap_ |
| Data Type: |
xbrli:monetaryItemType |
| Balance Type: |
credit |
| Period Type: |
instant |
|
| X |
- DefinitionAmount after accumulated impairment loss of an asset representing future economic benefits arising from other assets acquired in a business combination that are not individually identified and separately recognized. Reference 1: http://www.xbrl.org/2003/role/exampleRef
-Topic 852
-SubTopic 10
-Name Accounting Standards Codification
-Section 55
-Paragraph 10
-Publisher FASB
-URI https://asc.fasb.org//1943274/2147481372/852-10-55-10
Reference 2: http://www.xbrl.org/2003/role/exampleRef
-Topic 350
-SubTopic 20
-Name Accounting Standards Codification
-Section 55
-Paragraph 24
-Publisher FASB
-URI https://asc.fasb.org//1943274/2147482548/350-20-55-24
Reference 3: http://www.xbrl.org/2003/role/disclosureRef
-Topic 210
-SubTopic 10
-Name Accounting Standards Codification
-Section S99
-Paragraph 1
-Subparagraph (SX 210.5-02(15))
-Publisher FASB
-URI https://asc.fasb.org//1943274/2147480566/210-10-S99-1
Reference 4: http://www.xbrl.org/2003/role/disclosureRef
-Topic 350
-SubTopic 20
-Name Accounting Standards Codification
-Section 45
-Paragraph 1
-Publisher FASB
-URI https://asc.fasb.org//1943274/2147482598/350-20-45-1
Reference 5: http://www.xbrl.org/2009/role/commonPracticeRef
-Topic 350
-SubTopic 20
-Name Accounting Standards Codification
-Section 50
-Paragraph 1
-Subparagraph (a)
-Publisher FASB
-URI https://asc.fasb.org//1943274/2147482573/350-20-50-1
Reference 6: http://www.xbrl.org/2009/role/commonPracticeRef
-Topic 350
-SubTopic 20
-Name Accounting Standards Codification
-Section 50
-Paragraph 1
-Subparagraph (h)
-Publisher FASB
-URI https://asc.fasb.org//1943274/2147482573/350-20-50-1
Reference 7: http://www.xbrl.org/2003/role/disclosureRef
-Topic 942
-SubTopic 210
-Name Accounting Standards Codification
-Section S99
-Paragraph 1
-Subparagraph (SX 210.9-03(10)(1))
-Publisher FASB
-URI https://asc.fasb.org//1943274/2147479853/942-210-S99-1
| Name: |
us-gaap_Goodwill |
| Namespace Prefix: |
us-gaap_ |
| Data Type: |
xbrli:monetaryItemType |
| Balance Type: |
debit |
| Period Type: |
instant |
|
| X |
- DefinitionSum of the carrying amounts of all intangible assets, excluding goodwill, as of the balance sheet date, net of accumulated amortization and impairment charges. Reference 1: http://fasb.org/us-gaap/role/ref/legacyRef
-Name Accounting Standards Codification
-Topic 350
-SubTopic 30
-Section 50
-Paragraph 2
-Subparagraph ((a)(1),(b))
-Publisher FASB
-URI https://asc.fasb.org//1943274/2147482665/350-30-50-2
Reference 2: http://fasb.org/us-gaap/role/ref/legacyRef
-Name Accounting Standards Codification
-Topic 350
-SubTopic 30
-Section 45
-Paragraph 1
-Publisher FASB
-URI https://asc.fasb.org//1943274/2147482686/350-30-45-1
| Name: |
us-gaap_IntangibleAssetsNetExcludingGoodwill |
| Namespace Prefix: |
us-gaap_ |
| Data Type: |
xbrli:monetaryItemType |
| Balance Type: |
debit |
| Period Type: |
instant |
|
| X |
- DefinitionAmount after valuation and LIFO reserves of inventory expected to be sold, or consumed within one year or operating cycle, if longer. Reference 1: http://www.xbrl.org/2003/role/exampleRef
-Topic 852
-SubTopic 10
-Name Accounting Standards Codification
-Section 55
-Paragraph 10
-Publisher FASB
-URI https://asc.fasb.org//1943274/2147481372/852-10-55-10
Reference 2: http://www.xbrl.org/2003/role/exampleRef
-Topic 210
-SubTopic 10
-Name Accounting Standards Codification
-Section 45
-Paragraph 1
-Subparagraph (b)
-Publisher FASB
-URI https://asc.fasb.org//1943274/2147483467/210-10-45-1
Reference 3: http://www.xbrl.org/2003/role/disclosureRef
-Topic 210
-SubTopic 10
-Name Accounting Standards Codification
-Section S99
-Paragraph 1
-Subparagraph (SX 210.5-02(6))
-Publisher FASB
-URI https://asc.fasb.org//1943274/2147480566/210-10-S99-1
| Name: |
us-gaap_InventoryNet |
| Namespace Prefix: |
us-gaap_ |
| Data Type: |
xbrli:monetaryItemType |
| Balance Type: |
debit |
| Period Type: |
instant |
|
| X |
- DefinitionSum of the carrying amounts as of the balance sheet date of all liabilities that are recognized. Liabilities are probable future sacrifices of economic benefits arising from present obligations of an entity to transfer assets or provide services to other entities in the future. Reference 1: http://www.xbrl.org/2003/role/disclosureRef
-Topic 810
-SubTopic 10
-Name Accounting Standards Codification
-Section 50
-Paragraph 3
-Subparagraph (c)
-Publisher FASB
-URI https://asc.fasb.org//1943274/2147481203/810-10-50-3
Reference 2: http://www.xbrl.org/2003/role/disclosureRef
-Topic 810
-SubTopic 10
-Name Accounting Standards Codification
-Section 45
-Paragraph 25
-Subparagraph (b)
-Publisher FASB
-URI https://asc.fasb.org//1943274/2147481231/810-10-45-25
Reference 3: http://www.xbrl.org/2003/role/disclosureRef
-Topic 810
-SubTopic 10
-Name Accounting Standards Codification
-Section 50
-Paragraph 3
-Subparagraph (bb)
-Publisher FASB
-URI https://asc.fasb.org//1943274/2147481203/810-10-50-3
Reference 4: http://www.xbrl.org/2003/role/disclosureRef
-Topic 235
-SubTopic 10
-Name Accounting Standards Codification
-Section S99
-Paragraph 1
-Subparagraph (SX 210.4-08(g)(1)(ii))
-Publisher FASB
-URI https://asc.fasb.org//1943274/2147480678/235-10-S99-1
Reference 5: http://www.xbrl.org/2003/role/disclosureRef
-Topic 323
-SubTopic 10
-Name Accounting Standards Codification
-Section 50
-Paragraph 3
-Subparagraph (c)
-Publisher FASB
-URI https://asc.fasb.org//1943274/2147481687/323-10-50-3
Reference 6: http://www.xbrl.org/2003/role/disclosureRef
-Topic 825
-SubTopic 10
-Name Accounting Standards Codification
-Section 50
-Paragraph 28
-Subparagraph (f)
-Publisher FASB
-URI https://asc.fasb.org//1943274/2147482907/825-10-50-28
Reference 7: http://www.xbrl.org/2003/role/exampleRef
-Topic 946
-SubTopic 830
-Name Accounting Standards Codification
-Section 55
-Paragraph 12
-Publisher FASB
-URI https://asc.fasb.org//1943274/2147480167/946-830-55-12
Reference 8: http://www.xbrl.org/2003/role/disclosureRef
-Topic 946
-SubTopic 210
-Name Accounting Standards Codification
-Section S99
-Paragraph 1
-Subparagraph (SX 210.6-04(14))
-Publisher FASB
-URI https://asc.fasb.org//1943274/2147479617/946-210-S99-1
Reference 9: http://www.xbrl.org/2003/role/disclosureRef
-Topic 470
-SubTopic 10
-Name Accounting Standards Codification
-Section S99
-Paragraph 1A
-Subparagraph (SX 210.13-01(a)(4)(i))
-Publisher FASB
-URI https://asc.fasb.org//1943274/2147480097/470-10-S99-1A
Reference 10: http://www.xbrl.org/2009/role/commonPracticeRef
-Topic 470
-SubTopic 10
-Name Accounting Standards Codification
-Section S99
-Paragraph 1A
-Subparagraph (SX 210.13-01(a)(4)(ii))
-Publisher FASB
-URI https://asc.fasb.org//1943274/2147480097/470-10-S99-1A
Reference 11: http://www.xbrl.org/2003/role/disclosureRef
-Topic 470
-SubTopic 10
-Name Accounting Standards Codification
-Section S99
-Paragraph 1A
-Subparagraph (SX 210.13-01(a)(4)(iii)(A))
-Publisher FASB
-URI https://asc.fasb.org//1943274/2147480097/470-10-S99-1A
Reference 12: http://www.xbrl.org/2003/role/disclosureRef
-Topic 470
-SubTopic 10
-Name Accounting Standards Codification
-Section S99
-Paragraph 1A
-Subparagraph (SX 210.13-01(a)(4)(iv))
-Publisher FASB
-URI https://asc.fasb.org//1943274/2147480097/470-10-S99-1A
Reference 13: http://www.xbrl.org/2003/role/disclosureRef
-Topic 470
-SubTopic 10
-Name Accounting Standards Codification
-Section S99
-Paragraph 1A
-Subparagraph (SX 210.13-01(a)(5))
-Publisher FASB
-URI https://asc.fasb.org//1943274/2147480097/470-10-S99-1A
Reference 14: http://www.xbrl.org/2003/role/disclosureRef
-Topic 470
-SubTopic 10
-Name Accounting Standards Codification
-Section S99
-Paragraph 1B
-Subparagraph (SX 210.13-02(a)(4)(i))
-Publisher FASB
-URI https://asc.fasb.org//1943274/2147480097/470-10-S99-1B
Reference 15: http://www.xbrl.org/2003/role/disclosureRef
-Topic 470
-SubTopic 10
-Name Accounting Standards Codification
-Section S99
-Paragraph 1B
-Subparagraph (SX 210.13-02(a)(4)(iii)(A))
-Publisher FASB
-URI https://asc.fasb.org//1943274/2147480097/470-10-S99-1B
Reference 16: http://www.xbrl.org/2003/role/disclosureRef
-Topic 470
-SubTopic 10
-Name Accounting Standards Codification
-Section S99
-Paragraph 1B
-Subparagraph (SX 210.13-02(a)(4)(iii)(B))
-Publisher FASB
-URI https://asc.fasb.org//1943274/2147480097/470-10-S99-1B
Reference 17: http://www.xbrl.org/2003/role/disclosureRef
-Topic 470
-SubTopic 10
-Name Accounting Standards Codification
-Section S99
-Paragraph 1B
-Subparagraph (SX 210.13-02(a)(4)(iv))
-Publisher FASB
-URI https://asc.fasb.org//1943274/2147480097/470-10-S99-1B
Reference 18: http://www.xbrl.org/2003/role/disclosureRef
-Topic 470
-SubTopic 10
-Name Accounting Standards Codification
-Section S99
-Paragraph 1B
-Subparagraph (SX 210.13-02(a)(5))
-Publisher FASB
-URI https://asc.fasb.org//1943274/2147480097/470-10-S99-1B
Reference 19: http://www.xbrl.org/2009/role/commonPracticeRef
-Topic 852
-SubTopic 10
-Name Accounting Standards Codification
-Section 50
-Paragraph 7
-Subparagraph (a)
-Publisher FASB
-URI https://asc.fasb.org//1943274/2147481404/852-10-50-7
Reference 20: http://www.xbrl.org/2009/role/commonPracticeRef
-Topic 852
-SubTopic 10
-Name Accounting Standards Codification
-Section 50
-Paragraph 7
-Subparagraph (b)
-Publisher FASB
-URI https://asc.fasb.org//1943274/2147481404/852-10-50-7
Reference 21: http://www.xbrl.org/2003/role/exampleRef
-Topic 280
-SubTopic 10
-Name Accounting Standards Codification
-Section 50
-Paragraph 30
-Subparagraph (d)
-Publisher FASB
-URI https://asc.fasb.org//1943274/2147482810/280-10-50-30
Reference 22: http://fasb.org/us-gaap/role/ref/legacyRef
-Name Accounting Standards Codification
-Topic 210
-SubTopic 10
-Section S99
-Paragraph 1
-Subparagraph (SX 210.5-02.19-26)
-Publisher FASB
-URI https://asc.fasb.org//1943274/2147480566/210-10-S99-1
| Name: |
us-gaap_Liabilities |
| Namespace Prefix: |
us-gaap_ |
| Data Type: |
xbrli:monetaryItemType |
| Balance Type: |
credit |
| Period Type: |
instant |
|
| X |
- DefinitionAmount of liabilities and equity items, including the portion of equity attributable to noncontrolling interests, if any. Reference 1: http://www.xbrl.org/2003/role/exampleRef
-Topic 852
-SubTopic 10
-Name Accounting Standards Codification
-Section 55
-Paragraph 10
-Publisher FASB
-URI https://asc.fasb.org//1943274/2147481372/852-10-55-10
Reference 2: http://www.xbrl.org/2003/role/disclosureRef
-Topic 944
-SubTopic 210
-Name Accounting Standards Codification
-Section S99
-Paragraph 1
-Subparagraph (SX 210.7-03(a)(25))
-Publisher FASB
-URI https://asc.fasb.org//1943274/2147479440/944-210-S99-1
Reference 3: http://www.xbrl.org/2009/role/commonPracticeRef
-Topic 235
-SubTopic 10
-Name Accounting Standards Codification
-Section S99
-Paragraph 1
-Subparagraph (SX 210.4-08(g)(1)(ii))
-Publisher FASB
-URI https://asc.fasb.org//1943274/2147480678/235-10-S99-1
Reference 4: http://www.xbrl.org/2009/role/commonPracticeRef
-Topic 323
-SubTopic 10
-Name Accounting Standards Codification
-Section 50
-Paragraph 3
-Subparagraph (c)
-Publisher FASB
-URI https://asc.fasb.org//1943274/2147481687/323-10-50-3
Reference 5: http://www.xbrl.org/2009/role/commonPracticeRef
-Topic 825
-SubTopic 10
-Name Accounting Standards Codification
-Section 50
-Paragraph 28
-Subparagraph (f)
-Publisher FASB
-URI https://asc.fasb.org//1943274/2147482907/825-10-50-28
Reference 6: http://fasb.org/us-gaap/role/ref/legacyRef
-Topic 942
-SubTopic 210
-Name Accounting Standards Codification
-Section S99
-Paragraph 1
-Subparagraph (SX 210.9-03(23))
-Publisher FASB
-URI https://asc.fasb.org//1943274/2147479853/942-210-S99-1
Reference 7: http://fasb.org/us-gaap/role/ref/legacyRef
-Topic 210
-SubTopic 10
-Name Accounting Standards Codification
-Section S99
-Paragraph 1
-Subparagraph (SX 210.5-02(32))
-Publisher FASB
-URI https://asc.fasb.org//1943274/2147480566/210-10-S99-1
| Name: |
us-gaap_LiabilitiesAndStockholdersEquity |
| Namespace Prefix: |
us-gaap_ |
| Data Type: |
xbrli:monetaryItemType |
| Balance Type: |
credit |
| Period Type: |
instant |
|
| X |
- DefinitionTotal obligations incurred as part of normal operations that are expected to be paid during the following twelve months or within one business cycle, if longer. Reference 1: http://www.xbrl.org/2003/role/disclosureRef
-Topic 810
-SubTopic 10
-Name Accounting Standards Codification
-Section 50
-Paragraph 3
-Subparagraph (c)
-Publisher FASB
-URI https://asc.fasb.org//1943274/2147481203/810-10-50-3
Reference 2: http://www.xbrl.org/2003/role/disclosureRef
-Topic 810
-SubTopic 10
-Name Accounting Standards Codification
-Section 45
-Paragraph 25
-Subparagraph (b)
-Publisher FASB
-URI https://asc.fasb.org//1943274/2147481231/810-10-45-25
Reference 3: http://www.xbrl.org/2003/role/disclosureRef
-Topic 810
-SubTopic 10
-Name Accounting Standards Codification
-Section 50
-Paragraph 3
-Subparagraph (bb)
-Publisher FASB
-URI https://asc.fasb.org//1943274/2147481203/810-10-50-3
Reference 4: http://www.xbrl.org/2003/role/disclosureRef
-Topic 235
-SubTopic 10
-Name Accounting Standards Codification
-Section S99
-Paragraph 1
-Subparagraph (SX 210.4-08(g)(1)(ii))
-Publisher FASB
-URI https://asc.fasb.org//1943274/2147480678/235-10-S99-1
Reference 5: http://www.xbrl.org/2003/role/disclosureRef
-Topic 323
-SubTopic 10
-Name Accounting Standards Codification
-Section 50
-Paragraph 3
-Subparagraph (c)
-Publisher FASB
-URI https://asc.fasb.org//1943274/2147481687/323-10-50-3
Reference 6: http://www.xbrl.org/2003/role/disclosureRef
-Topic 825
-SubTopic 10
-Name Accounting Standards Codification
-Section 50
-Paragraph 28
-Subparagraph (f)
-Publisher FASB
-URI https://asc.fasb.org//1943274/2147482907/825-10-50-28
Reference 7: http://www.xbrl.org/2003/role/exampleRef
-Topic 852
-SubTopic 10
-Name Accounting Standards Codification
-Section 55
-Paragraph 10
-Publisher FASB
-URI https://asc.fasb.org//1943274/2147481372/852-10-55-10
Reference 8: http://www.xbrl.org/2003/role/disclosureRef
-Topic 210
-SubTopic 10
-Name Accounting Standards Codification
-Section 45
-Paragraph 5
-Publisher FASB
-URI https://asc.fasb.org//1943274/2147483467/210-10-45-5
Reference 9: http://www.xbrl.org/2003/role/disclosureRef
-Topic 470
-SubTopic 10
-Name Accounting Standards Codification
-Section S99
-Paragraph 1A
-Subparagraph (SX 210.13-01(a)(4)(i))
-Publisher FASB
-URI https://asc.fasb.org//1943274/2147480097/470-10-S99-1A
Reference 10: http://www.xbrl.org/2009/role/commonPracticeRef
-Topic 470
-SubTopic 10
-Name Accounting Standards Codification
-Section S99
-Paragraph 1A
-Subparagraph (SX 210.13-01(a)(4)(ii))
-Publisher FASB
-URI https://asc.fasb.org//1943274/2147480097/470-10-S99-1A
Reference 11: http://www.xbrl.org/2003/role/disclosureRef
-Topic 470
-SubTopic 10
-Name Accounting Standards Codification
-Section S99
-Paragraph 1A
-Subparagraph (SX 210.13-01(a)(4)(iii)(A))
-Publisher FASB
-URI https://asc.fasb.org//1943274/2147480097/470-10-S99-1A
Reference 12: http://www.xbrl.org/2003/role/disclosureRef
-Topic 470
-SubTopic 10
-Name Accounting Standards Codification
-Section S99
-Paragraph 1A
-Subparagraph (SX 210.13-01(a)(4)(iv))
-Publisher FASB
-URI https://asc.fasb.org//1943274/2147480097/470-10-S99-1A
Reference 13: http://www.xbrl.org/2003/role/disclosureRef
-Topic 470
-SubTopic 10
-Name Accounting Standards Codification
-Section S99
-Paragraph 1A
-Subparagraph (SX 210.13-01(a)(5))
-Publisher FASB
-URI https://asc.fasb.org//1943274/2147480097/470-10-S99-1A
Reference 14: http://www.xbrl.org/2003/role/disclosureRef
-Topic 470
-SubTopic 10
-Name Accounting Standards Codification
-Section S99
-Paragraph 1B
-Subparagraph (SX 210.13-02(a)(4)(i))
-Publisher FASB
-URI https://asc.fasb.org//1943274/2147480097/470-10-S99-1B
Reference 15: http://www.xbrl.org/2003/role/disclosureRef
-Topic 470
-SubTopic 10
-Name Accounting Standards Codification
-Section S99
-Paragraph 1B
-Subparagraph (SX 210.13-02(a)(4)(iii)(A))
-Publisher FASB
-URI https://asc.fasb.org//1943274/2147480097/470-10-S99-1B
Reference 16: http://www.xbrl.org/2003/role/disclosureRef
-Topic 470
-SubTopic 10
-Name Accounting Standards Codification
-Section S99
-Paragraph 1B
-Subparagraph (SX 210.13-02(a)(4)(iii)(B))
-Publisher FASB
-URI https://asc.fasb.org//1943274/2147480097/470-10-S99-1B
Reference 17: http://www.xbrl.org/2003/role/disclosureRef
-Topic 470
-SubTopic 10
-Name Accounting Standards Codification
-Section S99
-Paragraph 1B
-Subparagraph (SX 210.13-02(a)(4)(iv))
-Publisher FASB
-URI https://asc.fasb.org//1943274/2147480097/470-10-S99-1B
Reference 18: http://www.xbrl.org/2003/role/disclosureRef
-Topic 470
-SubTopic 10
-Name Accounting Standards Codification
-Section S99
-Paragraph 1B
-Subparagraph (SX 210.13-02(a)(5))
-Publisher FASB
-URI https://asc.fasb.org//1943274/2147480097/470-10-S99-1B
Reference 19: http://www.xbrl.org/2009/role/commonPracticeRef
-Topic 852
-SubTopic 10
-Name Accounting Standards Codification
-Section 50
-Paragraph 7
-Subparagraph (a)
-Publisher FASB
-URI https://asc.fasb.org//1943274/2147481404/852-10-50-7
Reference 20: http://www.xbrl.org/2009/role/commonPracticeRef
-Topic 852
-SubTopic 10
-Name Accounting Standards Codification
-Section 50
-Paragraph 7
-Subparagraph (b)
-Publisher FASB
-URI https://asc.fasb.org//1943274/2147481404/852-10-50-7
Reference 21: http://fasb.org/us-gaap/role/ref/legacyRef
-Name Accounting Standards Codification
-Topic 210
-SubTopic 10
-Section S99
-Paragraph 1
-Subparagraph (SX 210.5-02.21)
-Publisher FASB
-URI https://asc.fasb.org//1943274/2147480566/210-10-S99-1
| Name: |
us-gaap_LiabilitiesCurrent |
| Namespace Prefix: |
us-gaap_ |
| Data Type: |
xbrli:monetaryItemType |
| Balance Type: |
credit |
| Period Type: |
instant |
|
| X |
- References
+ Details
| Name: |
us-gaap_LiabilitiesCurrentAbstract |
| Namespace Prefix: |
us-gaap_ |
| Data Type: |
xbrli:stringItemType |
| Balance Type: |
na |
| Period Type: |
duration |
|
| X |
- DefinitionAmount, after deduction of unamortized premium (discount) and debt issuance cost, of long-term debt classified as current. Excludes lease obligation. Reference 1: http://www.xbrl.org/2003/role/disclosureRef
-Topic 210
-SubTopic 10
-Name Accounting Standards Codification
-Section S99
-Paragraph 1
-Subparagraph (SX 210.5-02(20))
-Publisher FASB
-URI https://asc.fasb.org//1943274/2147480566/210-10-S99-1
| Name: |
us-gaap_LongTermDebtCurrent |
| Namespace Prefix: |
us-gaap_ |
| Data Type: |
xbrli:monetaryItemType |
| Balance Type: |
credit |
| Period Type: |
instant |
|
| X |
- DefinitionAmount, after deduction of unamortized premium (discount) and debt issuance cost, of long-term debt classified as noncurrent. Excludes lease obligation. Reference 1: http://www.xbrl.org/2003/role/disclosureRef
-Topic 210
-SubTopic 10
-Name Accounting Standards Codification
-Section S99
-Paragraph 1
-Subparagraph (SX 210.5-02(22))
-Publisher FASB
-URI https://asc.fasb.org//1943274/2147480566/210-10-S99-1
| Name: |
us-gaap_LongTermDebtNoncurrent |
| Namespace Prefix: |
us-gaap_ |
| Data Type: |
xbrli:monetaryItemType |
| Balance Type: |
credit |
| Period Type: |
instant |
|
| X |
- DefinitionAmount of current assets classified as other. Reference 1: http://www.xbrl.org/2003/role/exampleRef
-Topic 852
-SubTopic 10
-Name Accounting Standards Codification
-Section 55
-Paragraph 10
-Publisher FASB
-URI https://asc.fasb.org//1943274/2147481372/852-10-55-10
Reference 2: http://www.xbrl.org/2003/role/disclosureRef
-Topic 210
-SubTopic 10
-Name Accounting Standards Codification
-Section S99
-Paragraph 1
-Subparagraph (SX 210.5-02(8))
-Publisher FASB
-URI https://asc.fasb.org//1943274/2147480566/210-10-S99-1
| Name: |
us-gaap_OtherAssetsCurrent |
| Namespace Prefix: |
us-gaap_ |
| Data Type: |
xbrli:monetaryItemType |
| Balance Type: |
debit |
| Period Type: |
instant |
|
| X |
- DefinitionAmount of noncurrent assets classified as other. Reference 1: http://www.xbrl.org/2003/role/disclosureRef
-Topic 210
-SubTopic 10
-Name Accounting Standards Codification
-Section S99
-Paragraph 1
-Subparagraph (SX 210.5-02(17))
-Publisher FASB
-URI https://asc.fasb.org//1943274/2147480566/210-10-S99-1
| Name: |
us-gaap_OtherAssetsNoncurrent |
| Namespace Prefix: |
us-gaap_ |
| Data Type: |
xbrli:monetaryItemType |
| Balance Type: |
debit |
| Period Type: |
instant |
|
| X |
- DefinitionAmount of liabilities classified as other, due after one year or the normal operating cycle, if longer. Reference 1: http://fasb.org/us-gaap/role/ref/legacyRef
-Name Accounting Standards Codification
-Topic 210
-SubTopic 10
-Section S99
-Paragraph 1
-Subparagraph (SX 210.5-02.24)
-Publisher FASB
-URI https://asc.fasb.org//1943274/2147480566/210-10-S99-1
| Name: |
us-gaap_OtherLiabilitiesNoncurrent |
| Namespace Prefix: |
us-gaap_ |
| Data Type: |
xbrli:monetaryItemType |
| Balance Type: |
credit |
| Period Type: |
instant |
|
| X |
- DefinitionAmount after accumulated depreciation, depletion and amortization of physical assets used in the normal conduct of business to produce goods and services and not intended for resale. Examples include, but are not limited to, land, buildings, machinery and equipment, office equipment, and furniture and fixtures. Reference 1: http://fasb.org/us-gaap/role/ref/legacyRef
-Name Accounting Standards Codification
-Section 50
-Paragraph 1
-SubTopic 10
-Topic 360
-Publisher FASB
-URI https://asc.fasb.org//1943274/2147482099/360-10-50-1
Reference 2: http://www.xbrl.org/2003/role/exampleRef
-Topic 852
-SubTopic 10
-Name Accounting Standards Codification
-Section 55
-Paragraph 10
-Publisher FASB
-URI https://asc.fasb.org//1943274/2147481372/852-10-55-10
Reference 3: http://www.xbrl.org/2003/role/disclosureRef
-Topic 944
-SubTopic 210
-Name Accounting Standards Codification
-Section S99
-Paragraph 1
-Subparagraph (SX 210.7-03(a)(8))
-Publisher FASB
-URI https://asc.fasb.org//1943274/2147479440/944-210-S99-1
Reference 4: http://www.xbrl.org/2003/role/disclosureRef
-Topic 942
-SubTopic 360
-Name Accounting Standards Codification
-Section 50
-Paragraph 1
-Publisher FASB
-URI https://asc.fasb.org//1943274/2147480842/942-360-50-1
| Name: |
us-gaap_PropertyPlantAndEquipmentNet |
| Namespace Prefix: |
us-gaap_ |
| Data Type: |
xbrli:monetaryItemType |
| Balance Type: |
debit |
| Period Type: |
instant |
|
| X |
- DefinitionThe total amount due to the entity within one year of the balance sheet date (or one operating cycle, if longer) from outside sources, including trade accounts receivable, notes and loans receivable, as well as any other types of receivables, net of allowances established for the purpose of reducing such receivables to an amount that approximates their net realizable value. Reference 1: http://www.xbrl.org/2003/role/exampleRef
-Topic 852
-SubTopic 10
-Name Accounting Standards Codification
-Section 55
-Paragraph 10
-Publisher FASB
-URI https://asc.fasb.org//1943274/2147481372/852-10-55-10
| Name: |
us-gaap_ReceivablesNetCurrent |
| Namespace Prefix: |
us-gaap_ |
| Data Type: |
xbrli:monetaryItemType |
| Balance Type: |
debit |
| Period Type: |
instant |
|
| X |
- DefinitionAmount of accumulated undistributed earnings (deficit). Reference 1: http://www.xbrl.org/2003/role/exampleRef
-Topic 852
-SubTopic 10
-Name Accounting Standards Codification
-Section 55
-Paragraph 10
-Publisher FASB
-URI https://asc.fasb.org//1943274/2147481372/852-10-55-10
Reference 2: http://www.xbrl.org/2003/role/disclosureRef
-Topic 944
-SubTopic 40
-Name Accounting Standards Codification
-Section 65
-Paragraph 2
-Subparagraph (g)(2)(i)
-Publisher FASB
-URI https://asc.fasb.org//1943274/2147480016/944-40-65-2
Reference 3: http://www.xbrl.org/2003/role/disclosureRef
-Topic 944
-SubTopic 40
-Name Accounting Standards Codification
-Section 65
-Paragraph 2
-Subparagraph (h)(2)
-Publisher FASB
-URI https://asc.fasb.org//1943274/2147480016/944-40-65-2
Reference 4: http://www.xbrl.org/2003/role/disclosureRef
-Topic 946
-SubTopic 20
-Name Accounting Standards Codification
-Section 50
-Paragraph 11
-Publisher FASB
-URI https://asc.fasb.org//1943274/2147480990/946-20-50-11
Reference 5: http://www.xbrl.org/2003/role/disclosureRef
-Topic 944
-SubTopic 210
-Name Accounting Standards Codification
-Section S99
-Paragraph 1
-Subparagraph (SX 210.7-03(a)(23)(a)(4))
-Publisher FASB
-URI https://asc.fasb.org//1943274/2147479440/944-210-S99-1
Reference 6: http://www.xbrl.org/2003/role/disclosureRef
-Topic 946
-SubTopic 210
-Name Accounting Standards Codification
-Section S99
-Paragraph 1
-Subparagraph (SX 210.6-04(17))
-Publisher FASB
-URI https://asc.fasb.org//1943274/2147479617/946-210-S99-1
Reference 7: http://fasb.org/us-gaap/role/ref/legacyRef
-Topic 505
-SubTopic 10
-Name Accounting Standards Codification
-Section S99
-Paragraph 1
-Subparagraph (SX 210.3-04)
-Publisher FASB
-URI https://asc.fasb.org//1943274/2147480008/505-10-S99-1
Reference 8: http://fasb.org/us-gaap/role/ref/legacyRef
-Topic 210
-SubTopic 10
-Name Accounting Standards Codification
-Section S99
-Paragraph 1
-Subparagraph (SX 210.5-02(30)(a)(3))
-Publisher FASB
-URI https://asc.fasb.org//1943274/2147480566/210-10-S99-1
| Name: |
us-gaap_RetainedEarningsAccumulatedDeficit |
| Namespace Prefix: |
us-gaap_ |
| Data Type: |
xbrli:monetaryItemType |
| Balance Type: |
credit |
| Period Type: |
instant |
|
| X |
- DefinitionAmount of equity (deficit) attributable to parent. Excludes temporary equity and equity attributable to noncontrolling interest. Reference 1: http://www.xbrl.org/2003/role/exampleRef
-Topic 852
-SubTopic 10
-Name Accounting Standards Codification
-Section 55
-Paragraph 10
-Publisher FASB
-URI https://asc.fasb.org//1943274/2147481372/852-10-55-10
Reference 2: http://www.xbrl.org/2003/role/exampleRef
-Topic 946
-SubTopic 830
-Name Accounting Standards Codification
-Section 55
-Paragraph 12
-Publisher FASB
-URI https://asc.fasb.org//1943274/2147480167/946-830-55-12
Reference 3: http://www.xbrl.org/2003/role/disclosureRef
-Topic 946
-SubTopic 210
-Name Accounting Standards Codification
-Section S99
-Paragraph 1
-Subparagraph (SX 210.6-04(19))
-Publisher FASB
-URI https://asc.fasb.org//1943274/2147479617/946-210-S99-1
Reference 4: http://www.xbrl.org/2003/role/disclosureRef
-Topic 946
-SubTopic 210
-Name Accounting Standards Codification
-Section S99
-Paragraph 2
-Subparagraph (SX 210.6-05(4))
-Publisher FASB
-URI https://asc.fasb.org//1943274/2147479617/946-210-S99-2
Reference 5: http://www.xbrl.org/2009/role/commonPracticeRef
-Topic 946
-SubTopic 220
-Name Accounting Standards Codification
-Section S99
-Paragraph 3
-Subparagraph (SX 210.6-09(4)(b))
-Publisher FASB
-URI https://asc.fasb.org//1943274/2147483575/946-220-S99-3
Reference 6: http://www.xbrl.org/2003/role/disclosureRef
-Topic 946
-SubTopic 220
-Name Accounting Standards Codification
-Section S99
-Paragraph 3
-Subparagraph (SX 210.6-09(6))
-Publisher FASB
-URI https://asc.fasb.org//1943274/2147483575/946-220-S99-3
Reference 7: http://www.xbrl.org/2003/role/disclosureRef
-Topic 946
-SubTopic 220
-Name Accounting Standards Codification
-Section S99
-Paragraph 3
-Subparagraph (SX 210.6-09(7))
-Publisher FASB
-URI https://asc.fasb.org//1943274/2147483575/946-220-S99-3
Reference 8: http://www.xbrl.org/2009/role/commonPracticeRef
-Topic 235
-SubTopic 10
-Name Accounting Standards Codification
-Section S99
-Paragraph 1
-Subparagraph (SX 210.4-08(g)(1)(ii))
-Publisher FASB
-URI https://asc.fasb.org//1943274/2147480678/235-10-S99-1
Reference 9: http://www.xbrl.org/2009/role/commonPracticeRef
-Topic 323
-SubTopic 10
-Name Accounting Standards Codification
-Section 50
-Paragraph 3
-Subparagraph (c)
-Publisher FASB
-URI https://asc.fasb.org//1943274/2147481687/323-10-50-3
Reference 10: http://www.xbrl.org/2009/role/commonPracticeRef
-Topic 825
-SubTopic 10
-Name Accounting Standards Codification
-Section 50
-Paragraph 28
-Subparagraph (f)
-Publisher FASB
-URI https://asc.fasb.org//1943274/2147482907/825-10-50-28
Reference 11: http://fasb.org/us-gaap/role/ref/legacyRef
-Topic 210
-SubTopic 10
-Name Accounting Standards Codification
-Section S99
-Paragraph 1
-Subparagraph (SX 210.5-02(29))
-Publisher FASB
-URI https://asc.fasb.org//1943274/2147480566/210-10-S99-1
Reference 12: http://fasb.org/us-gaap/role/ref/legacyRef
-Topic 210
-SubTopic 10
-Name Accounting Standards Codification
-Section S99
-Paragraph 1
-Subparagraph (SX 210.5-02(31))
-Publisher FASB
-URI https://asc.fasb.org//1943274/2147480566/210-10-S99-1
Reference 13: http://fasb.org/us-gaap/role/ref/legacyRef
-Topic 210
-SubTopic 10
-Name Accounting Standards Codification
-Section S99
-Paragraph 1
-Subparagraph (SX 210.5-02(30))
-Publisher FASB
-URI https://asc.fasb.org//1943274/2147480566/210-10-S99-1
Reference 14: http://fasb.org/us-gaap/role/ref/legacyRef
-Topic 310
-SubTopic 10
-Name Accounting Standards Codification
-Section S99
-Paragraph 2
-Subparagraph (SAB Topic 4.E)
-Publisher FASB
-URI https://asc.fasb.org//1943274/2147480418/310-10-S99-2
| Name: |
us-gaap_StockholdersEquity |
| Namespace Prefix: |
us-gaap_ |
| Data Type: |
xbrli:monetaryItemType |
| Balance Type: |
credit |
| Period Type: |
instant |
|
| X |
- References
+ Details
| Name: |
us-gaap_StockholdersEquityAbstract |
| Namespace Prefix: |
us-gaap_ |
| Data Type: |
xbrli:stringItemType |
| Balance Type: |
na |
| Period Type: |
duration |
|
| X |
- DefinitionThe amount allocated to treasury stock. Treasury stock is common and preferred shares of an entity that were issued, repurchased by the entity, and are held in its treasury. Reference 1: http://fasb.org/us-gaap/role/ref/legacyRef
-Name Accounting Standards Codification
-Topic 505
-SubTopic 30
-Section 50
-Paragraph 4
-Publisher FASB
-URI https://asc.fasb.org//1943274/2147481520/505-30-50-4
Reference 2: http://fasb.org/us-gaap/role/ref/legacyRef
-Name Accounting Standards Codification
-Topic 505
-SubTopic 30
-Section 45
-Paragraph 1
-Publisher FASB
-URI https://asc.fasb.org//1943274/2147481549/505-30-45-1
Reference 3: http://fasb.org/us-gaap/role/ref/legacyRef
-Name Accounting Standards Codification
-Topic 210
-SubTopic 10
-Section S99
-Paragraph 1
-Subparagraph (SX 210.5-02.29,30)
-Publisher FASB
-URI https://asc.fasb.org//1943274/2147480566/210-10-S99-1
| Name: |
us-gaap_TreasuryStockValue |
| Namespace Prefix: |
us-gaap_ |
| Data Type: |
xbrli:monetaryItemType |
| Balance Type: |
debit |
| Period Type: |
instant |
|
v3.23.3
CONSOLIDATED BALANCE SHEETS (UNAUDITED) (Parenthetical) - $ / shares
|
Sep. 30, 2023 |
Dec. 31, 2022 |
| Statement of Financial Position [Abstract] |
|
|
| Common stock, par value (in dollars per share) |
$ 0.001
|
$ 0.001
|
| Common stock, shares authorized (in shares) |
700,000,000
|
700,000,000
|
| Common stock, shares issued (in shares) |
151,000,000
|
148,000,000
|
| Common stock, shares outstanding (in shares) |
146,000,000
|
146,000,000
|
| X |
- DefinitionFace amount or stated value per share of common stock. Reference 1: http://fasb.org/us-gaap/role/ref/legacyRef
-Topic 210
-SubTopic 10
-Name Accounting Standards Codification
-Section S99
-Paragraph 1
-Subparagraph (SX 210.5-02(29))
-Publisher FASB
-URI https://asc.fasb.org//1943274/2147480566/210-10-S99-1
| Name: |
us-gaap_CommonStockParOrStatedValuePerShare |
| Namespace Prefix: |
us-gaap_ |
| Data Type: |
dtr-types:perShareItemType |
| Balance Type: |
na |
| Period Type: |
instant |
|
| X |
- DefinitionThe maximum number of common shares permitted to be issued by an entity's charter and bylaws. Reference 1: http://www.xbrl.org/2003/role/disclosureRef
-Topic 946
-SubTopic 210
-Name Accounting Standards Codification
-Section S99
-Paragraph 1
-Subparagraph (SX 210.6-04(16)(a))
-Publisher FASB
-URI https://asc.fasb.org//1943274/2147479617/946-210-S99-1
Reference 2: http://fasb.org/us-gaap/role/ref/legacyRef
-Topic 210
-SubTopic 10
-Name Accounting Standards Codification
-Section S99
-Paragraph 1
-Subparagraph (SX 210.5-02(29))
-Publisher FASB
-URI https://asc.fasb.org//1943274/2147480566/210-10-S99-1
| Name: |
us-gaap_CommonStockSharesAuthorized |
| Namespace Prefix: |
us-gaap_ |
| Data Type: |
xbrli:sharesItemType |
| Balance Type: |
na |
| Period Type: |
instant |
|
| X |
- DefinitionTotal number of common shares of an entity that have been sold or granted to shareholders (includes common shares that were issued, repurchased and remain in the treasury). These shares represent capital invested by the firm's shareholders and owners, and may be all or only a portion of the number of shares authorized. Shares issued include shares outstanding and shares held in the treasury. Reference 1: http://fasb.org/us-gaap/role/ref/legacyRef
-Topic 210
-SubTopic 10
-Name Accounting Standards Codification
-Section S99
-Paragraph 1
-Subparagraph (SX 210.5-02(29))
-Publisher FASB
-URI https://asc.fasb.org//1943274/2147480566/210-10-S99-1
| Name: |
us-gaap_CommonStockSharesIssued |
| Namespace Prefix: |
us-gaap_ |
| Data Type: |
xbrli:sharesItemType |
| Balance Type: |
na |
| Period Type: |
instant |
|
| X |
- DefinitionNumber of shares of common stock outstanding. Common stock represent the ownership interest in a corporation. Reference 1: http://fasb.org/us-gaap/role/ref/legacyRef
-Name Accounting Standards Codification
-Section 50
-Paragraph 2
-SubTopic 10
-Topic 505
-Publisher FASB
-URI https://asc.fasb.org//1943274/2147481112/505-10-50-2
Reference 2: http://www.xbrl.org/2003/role/disclosureRef
-Topic 946
-SubTopic 210
-Name Accounting Standards Codification
-Section S99
-Paragraph 2
-Subparagraph (SX 210.6-05(4))
-Publisher FASB
-URI https://asc.fasb.org//1943274/2147479617/946-210-S99-2
Reference 3: http://www.xbrl.org/2009/role/commonPracticeRef
-Topic 946
-SubTopic 220
-Name Accounting Standards Codification
-Section S99
-Paragraph 3
-Subparagraph (SX 210.6-09(4)(b))
-Publisher FASB
-URI https://asc.fasb.org//1943274/2147483575/946-220-S99-3
Reference 4: http://www.xbrl.org/2003/role/disclosureRef
-Topic 946
-SubTopic 210
-Name Accounting Standards Codification
-Section S99
-Paragraph 1
-Subparagraph (SX 210.6-04(16)(a))
-Publisher FASB
-URI https://asc.fasb.org//1943274/2147479617/946-210-S99-1
Reference 5: http://www.xbrl.org/2009/role/commonPracticeRef
-Topic 946
-SubTopic 220
-Name Accounting Standards Codification
-Section S99
-Paragraph 3
-Subparagraph (SX 210.6-09(7))
-Publisher FASB
-URI https://asc.fasb.org//1943274/2147483575/946-220-S99-3
Reference 6: http://fasb.org/us-gaap/role/ref/legacyRef
-Topic 210
-SubTopic 10
-Name Accounting Standards Codification
-Section S99
-Paragraph 1
-Subparagraph (SX 210.5-02(29))
-Publisher FASB
-URI https://asc.fasb.org//1943274/2147480566/210-10-S99-1
| Name: |
us-gaap_CommonStockSharesOutstanding |
| Namespace Prefix: |
us-gaap_ |
| Data Type: |
xbrli:sharesItemType |
| Balance Type: |
na |
| Period Type: |
instant |
|
| X |
- References
+ Details
| Name: |
us-gaap_StatementOfFinancialPositionAbstract |
| Namespace Prefix: |
us-gaap_ |
| Data Type: |
xbrli:stringItemType |
| Balance Type: |
na |
| Period Type: |
duration |
|
v3.23.3
CONSOLIDATED STATEMENTS OF OPERATIONS (UNAUDITED) - USD ($)
shares in Millions, $ in Millions |
3 Months Ended |
9 Months Ended |
Sep. 30, 2023 |
Oct. 01, 2022 |
Sep. 30, 2023 |
Oct. 01, 2022 |
| Income Statement [Abstract] |
|
|
|
|
| Net revenue |
$ 1,554
|
$ 1,618
|
$ 4,705
|
$ 4,810
|
| Cost of goods sold |
1,137
|
1,188
|
3,432
|
3,475
|
| Gross profit |
417
|
430
|
1,273
|
1,335
|
| Operating expenses: |
|
|
|
|
| Research and development expenses |
28
|
29
|
84
|
81
|
| Selling, general and administrative expenses |
233
|
236
|
719
|
716
|
| Intangible asset amortization |
9
|
10
|
28
|
25
|
| Restructuring and impairment expenses |
38
|
0
|
42
|
0
|
| Total operating expenses |
308
|
275
|
873
|
822
|
| Total income from operations |
109
|
155
|
400
|
513
|
| Other expenses, net |
56
|
44
|
138
|
126
|
| Interest expense, net |
16
|
15
|
50
|
39
|
| Income before taxes |
37
|
96
|
212
|
348
|
| Provision for income taxes |
16
|
33
|
84
|
104
|
| Net income |
$ 21
|
$ 63
|
$ 128
|
$ 244
|
| Earnings per share: |
|
|
|
|
| Basic (in dollars per share) |
$ 0.14
|
$ 0.43
|
$ 0.87
|
$ 1.68
|
| Diluted (in dollars per share) |
$ 0.14
|
$ 0.42
|
$ 0.86
|
$ 1.64
|
| Weighted average number of shares outstanding: |
|
|
|
|
| Basic (in dollars per share) |
147
|
146
|
147
|
145
|
| Diluted (in dollars per share) |
148
|
149
|
149
|
149
|
| X |
- DefinitionThe aggregate expense charged against earnings to allocate the cost of intangible assets (nonphysical assets not used in production) in a systematic and rational manner to the periods expected to benefit from such assets. As a noncash expense, this element is added back to net income when calculating cash provided by or used in operations using the indirect method. Reference 1: http://fasb.org/us-gaap/role/ref/legacyRef
-Name Accounting Standards Codification
-Section 45
-Paragraph 28
-Subparagraph (b)
-SubTopic 10
-Topic 230
-Publisher FASB
-URI https://asc.fasb.org//1943274/2147482740/230-10-45-28
Reference 2: http://fasb.org/us-gaap/role/ref/legacyRef
-Name Accounting Standards Codification
-Topic 350
-SubTopic 30
-Section 45
-Paragraph 2
-Publisher FASB
-URI https://asc.fasb.org//1943274/2147482686/350-30-45-2
Reference 3: http://fasb.org/us-gaap/role/ref/legacyRef
-Name Accounting Standards Codification
-Topic 350
-SubTopic 30
-Section 50
-Paragraph 2
-Subparagraph (a)(2)
-Publisher FASB
-URI https://asc.fasb.org//1943274/2147482665/350-30-50-2
| Name: |
us-gaap_AmortizationOfIntangibleAssets |
| Namespace Prefix: |
us-gaap_ |
| Data Type: |
xbrli:monetaryItemType |
| Balance Type: |
debit |
| Period Type: |
duration |
|
| X |
- DefinitionThe aggregate costs related to goods produced and sold and services rendered by an entity during the reporting period. This excludes costs incurred during the reporting period related to financial services rendered and other revenue generating activities. Reference 1: http://www.xbrl.org/2003/role/disclosureRef
-Topic 924
-SubTopic 10
-Name Accounting Standards Codification
-Section S99
-Paragraph 1
-Subparagraph (SAB Topic 11.L)
-Publisher FASB
-URI https://asc.fasb.org//1943274/2147479941/924-10-S99-1
Reference 2: http://fasb.org/us-gaap/role/ref/legacyRef
-Topic 220
-SubTopic 10
-Name Accounting Standards Codification
-Section S99
-Paragraph 2
-Subparagraph (SX 210.5-03.2(a),(d))
-Publisher FASB
-URI https://asc.fasb.org//1943274/2147483621/220-10-S99-2
| Name: |
us-gaap_CostOfGoodsAndServicesSold |
| Namespace Prefix: |
us-gaap_ |
| Data Type: |
xbrli:monetaryItemType |
| Balance Type: |
debit |
| Period Type: |
duration |
|
| X |
- DefinitionThe amount of net income (loss) for the period per each share of common stock or unit outstanding during the reporting period. Reference 1: http://www.xbrl.org/2003/role/disclosureRef
-Topic 250
-SubTopic 10
-Name Accounting Standards Codification
-Section 50
-Paragraph 3
-Publisher FASB
-URI https://asc.fasb.org//1943274/2147483443/250-10-50-3
Reference 2: http://www.xbrl.org/2003/role/disclosureRef
-Topic 260
-SubTopic 10
-Name Accounting Standards Codification
-Section 55
-Paragraph 15
-Publisher FASB
-URI https://asc.fasb.org//1943274/2147482635/260-10-55-15
Reference 3: http://www.xbrl.org/2003/role/disclosureRef
-Topic 815
-SubTopic 40
-Name Accounting Standards Codification
-Section 65
-Paragraph 1
-Subparagraph (e)(4)
-Publisher FASB
-URI https://asc.fasb.org//1943274/2147480175/815-40-65-1
Reference 4: http://www.xbrl.org/2003/role/disclosureRef
-Topic 815
-SubTopic 40
-Name Accounting Standards Codification
-Section 65
-Paragraph 1
-Subparagraph (f)
-Publisher FASB
-URI https://asc.fasb.org//1943274/2147480175/815-40-65-1
Reference 5: http://www.xbrl.org/2003/role/disclosureRef
-Topic 250
-SubTopic 10
-Name Accounting Standards Codification
-Section 50
-Paragraph 11
-Subparagraph (a)
-Publisher FASB
-URI https://asc.fasb.org//1943274/2147483443/250-10-50-11
Reference 6: http://www.xbrl.org/2003/role/disclosureRef
-Topic 250
-SubTopic 10
-Name Accounting Standards Codification
-Section 50
-Paragraph 11
-Subparagraph (b)
-Publisher FASB
-URI https://asc.fasb.org//1943274/2147483443/250-10-50-11
Reference 7: http://www.xbrl.org/2003/role/disclosureRef
-Topic 250
-SubTopic 10
-Name Accounting Standards Codification
-Section 50
-Paragraph 7
-Subparagraph (a)
-Publisher FASB
-URI https://asc.fasb.org//1943274/2147483443/250-10-50-7
Reference 8: http://www.xbrl.org/2003/role/disclosureRef
-Topic 260
-SubTopic 10
-Name Accounting Standards Codification
-Section 45
-Paragraph 2
-Publisher FASB
-URI https://asc.fasb.org//1943274/2147482689/260-10-45-2
Reference 9: http://www.xbrl.org/2003/role/disclosureRef
-Topic 260
-SubTopic 10
-Name Accounting Standards Codification
-Section 45
-Paragraph 60B
-Subparagraph (d)
-Publisher FASB
-URI https://asc.fasb.org//1943274/2147482689/260-10-45-60B
Reference 10: http://www.xbrl.org/2003/role/disclosureRef
-Topic 250
-SubTopic 10
-Name Accounting Standards Codification
-Section 50
-Paragraph 4
-Publisher FASB
-URI https://asc.fasb.org//1943274/2147483443/250-10-50-4
Reference 11: http://www.xbrl.org/2003/role/disclosureRef
-Topic 260
-SubTopic 10
-Name Accounting Standards Codification
-Section 50
-Paragraph 1
-Subparagraph (a)
-Publisher FASB
-URI https://asc.fasb.org//1943274/2147482662/260-10-50-1
Reference 12: http://www.xbrl.org/2003/role/disclosureRef
-Topic 260
-SubTopic 10
-Name Accounting Standards Codification
-Section 45
-Paragraph 10
-Publisher FASB
-URI https://asc.fasb.org//1943274/2147482689/260-10-45-10
Reference 13: http://www.xbrl.org/2003/role/disclosureRef
-Topic 220
-SubTopic 10
-Name Accounting Standards Codification
-Section S99
-Paragraph 2
-Subparagraph (SX 210.5-03(25))
-Publisher FASB
-URI https://asc.fasb.org//1943274/2147483621/220-10-S99-2
Reference 14: http://www.xbrl.org/2003/role/disclosureRef
-Topic 942
-SubTopic 220
-Name Accounting Standards Codification
-Section S99
-Paragraph 1
-Subparagraph (SX 210.9-04(27))
-Publisher FASB
-URI https://asc.fasb.org//1943274/2147483589/942-220-S99-1
Reference 15: http://www.xbrl.org/2003/role/disclosureRef
-Topic 944
-SubTopic 220
-Name Accounting Standards Codification
-Section S99
-Paragraph 1
-Subparagraph (SX 210.7-04(23))
-Publisher FASB
-URI https://asc.fasb.org//1943274/2147483586/944-220-S99-1
Reference 16: http://www.xbrl.org/2003/role/exampleRef
-Topic 260
-SubTopic 10
-Name Accounting Standards Codification
-Section 55
-Paragraph 52
-Publisher FASB
-URI https://asc.fasb.org//1943274/2147482635/260-10-55-52
Reference 17: http://www.xbrl.org/2003/role/disclosureRef
-Topic 260
-SubTopic 10
-Name Accounting Standards Codification
-Section 45
-Paragraph 7
-Publisher FASB
-URI https://asc.fasb.org//1943274/2147482689/260-10-45-7
| Name: |
us-gaap_EarningsPerShareBasic |
| Namespace Prefix: |
us-gaap_ |
| Data Type: |
dtr-types:perShareItemType |
| Balance Type: |
na |
| Period Type: |
duration |
|
| X |
- References
+ Details
| Name: |
us-gaap_EarningsPerShareBasicAbstract |
| Namespace Prefix: |
us-gaap_ |
| Data Type: |
xbrli:stringItemType |
| Balance Type: |
na |
| Period Type: |
duration |
|
| X |
- DefinitionThe amount of net income (loss) for the period available to each share of common stock or common unit outstanding during the reporting period and to each share or unit that would have been outstanding assuming the issuance of common shares or units for all dilutive potential common shares or units outstanding during the reporting period. Reference 1: http://www.xbrl.org/2003/role/disclosureRef
-Topic 250
-SubTopic 10
-Name Accounting Standards Codification
-Section 50
-Paragraph 3
-Publisher FASB
-URI https://asc.fasb.org//1943274/2147483443/250-10-50-3
Reference 2: http://www.xbrl.org/2003/role/disclosureRef
-Topic 260
-SubTopic 10
-Name Accounting Standards Codification
-Section 55
-Paragraph 15
-Publisher FASB
-URI https://asc.fasb.org//1943274/2147482635/260-10-55-15
Reference 3: http://www.xbrl.org/2003/role/disclosureRef
-Topic 815
-SubTopic 40
-Name Accounting Standards Codification
-Section 65
-Paragraph 1
-Subparagraph (e)(4)
-Publisher FASB
-URI https://asc.fasb.org//1943274/2147480175/815-40-65-1
Reference 4: http://www.xbrl.org/2003/role/disclosureRef
-Topic 815
-SubTopic 40
-Name Accounting Standards Codification
-Section 65
-Paragraph 1
-Subparagraph (f)
-Publisher FASB
-URI https://asc.fasb.org//1943274/2147480175/815-40-65-1
Reference 5: http://www.xbrl.org/2003/role/disclosureRef
-Topic 250
-SubTopic 10
-Name Accounting Standards Codification
-Section 50
-Paragraph 11
-Subparagraph (a)
-Publisher FASB
-URI https://asc.fasb.org//1943274/2147483443/250-10-50-11
Reference 6: http://www.xbrl.org/2003/role/disclosureRef
-Topic 250
-SubTopic 10
-Name Accounting Standards Codification
-Section 50
-Paragraph 11
-Subparagraph (b)
-Publisher FASB
-URI https://asc.fasb.org//1943274/2147483443/250-10-50-11
Reference 7: http://www.xbrl.org/2003/role/disclosureRef
-Topic 250
-SubTopic 10
-Name Accounting Standards Codification
-Section 50
-Paragraph 7
-Subparagraph (a)
-Publisher FASB
-URI https://asc.fasb.org//1943274/2147483443/250-10-50-7
Reference 8: http://www.xbrl.org/2003/role/disclosureRef
-Topic 260
-SubTopic 10
-Name Accounting Standards Codification
-Section 45
-Paragraph 2
-Publisher FASB
-URI https://asc.fasb.org//1943274/2147482689/260-10-45-2
Reference 9: http://www.xbrl.org/2003/role/disclosureRef
-Topic 260
-SubTopic 10
-Name Accounting Standards Codification
-Section 45
-Paragraph 60B
-Subparagraph (d)
-Publisher FASB
-URI https://asc.fasb.org//1943274/2147482689/260-10-45-60B
Reference 10: http://www.xbrl.org/2003/role/disclosureRef
-Topic 250
-SubTopic 10
-Name Accounting Standards Codification
-Section 50
-Paragraph 4
-Publisher FASB
-URI https://asc.fasb.org//1943274/2147483443/250-10-50-4
Reference 11: http://www.xbrl.org/2003/role/disclosureRef
-Topic 260
-SubTopic 10
-Name Accounting Standards Codification
-Section 50
-Paragraph 1
-Subparagraph (a)
-Publisher FASB
-URI https://asc.fasb.org//1943274/2147482662/260-10-50-1
Reference 12: http://www.xbrl.org/2003/role/disclosureRef
-Topic 220
-SubTopic 10
-Name Accounting Standards Codification
-Section S99
-Paragraph 2
-Subparagraph (SX 210.5-03(25))
-Publisher FASB
-URI https://asc.fasb.org//1943274/2147483621/220-10-S99-2
Reference 13: http://www.xbrl.org/2003/role/disclosureRef
-Topic 942
-SubTopic 220
-Name Accounting Standards Codification
-Section S99
-Paragraph 1
-Subparagraph (SX 210.9-04(27))
-Publisher FASB
-URI https://asc.fasb.org//1943274/2147483589/942-220-S99-1
Reference 14: http://www.xbrl.org/2003/role/disclosureRef
-Topic 944
-SubTopic 220
-Name Accounting Standards Codification
-Section S99
-Paragraph 1
-Subparagraph (SX 210.7-04(23))
-Publisher FASB
-URI https://asc.fasb.org//1943274/2147483586/944-220-S99-1
Reference 15: http://www.xbrl.org/2003/role/exampleRef
-Topic 260
-SubTopic 10
-Name Accounting Standards Codification
-Section 55
-Paragraph 52
-Publisher FASB
-URI https://asc.fasb.org//1943274/2147482635/260-10-55-52
Reference 16: http://www.xbrl.org/2003/role/disclosureRef
-Topic 260
-SubTopic 10
-Name Accounting Standards Codification
-Section 45
-Paragraph 7
-Publisher FASB
-URI https://asc.fasb.org//1943274/2147482689/260-10-45-7
| Name: |
us-gaap_EarningsPerShareDiluted |
| Namespace Prefix: |
us-gaap_ |
| Data Type: |
dtr-types:perShareItemType |
| Balance Type: |
na |
| Period Type: |
duration |
|
| X |
- DefinitionAggregate revenue less cost of goods and services sold or operating expenses directly attributable to the revenue generation activity. Reference 1: http://www.xbrl.org/2003/role/disclosureRef
-Topic 235
-SubTopic 10
-Name Accounting Standards Codification
-Section S99
-Paragraph 1
-Subparagraph (SX 210.4-08(g)(1)(ii))
-Publisher FASB
-URI https://asc.fasb.org//1943274/2147480678/235-10-S99-1
Reference 2: http://www.xbrl.org/2003/role/disclosureRef
-Topic 323
-SubTopic 10
-Name Accounting Standards Codification
-Section 50
-Paragraph 3
-Subparagraph (c)
-Publisher FASB
-URI https://asc.fasb.org//1943274/2147481687/323-10-50-3
Reference 3: http://www.xbrl.org/2003/role/disclosureRef
-Topic 825
-SubTopic 10
-Name Accounting Standards Codification
-Section 50
-Paragraph 28
-Subparagraph (f)
-Publisher FASB
-URI https://asc.fasb.org//1943274/2147482907/825-10-50-28
Reference 4: http://www.xbrl.org/2003/role/disclosureRef
-Topic 280
-SubTopic 10
-Name Accounting Standards Codification
-Section 50
-Paragraph 22
-Publisher FASB
-URI https://asc.fasb.org//1943274/2147482810/280-10-50-22
Reference 5: http://www.xbrl.org/2003/role/disclosureRef
-Topic 470
-SubTopic 10
-Name Accounting Standards Codification
-Section S99
-Paragraph 1A
-Subparagraph (SX 210.13-01(a)(4)(i))
-Publisher FASB
-URI https://asc.fasb.org//1943274/2147480097/470-10-S99-1A
Reference 6: http://www.xbrl.org/2009/role/commonPracticeRef
-Topic 470
-SubTopic 10
-Name Accounting Standards Codification
-Section S99
-Paragraph 1A
-Subparagraph (SX 210.13-01(a)(4)(ii))
-Publisher FASB
-URI https://asc.fasb.org//1943274/2147480097/470-10-S99-1A
Reference 7: http://www.xbrl.org/2003/role/disclosureRef
-Topic 470
-SubTopic 10
-Name Accounting Standards Codification
-Section S99
-Paragraph 1A
-Subparagraph (SX 210.13-01(a)(4)(iii)(A))
-Publisher FASB
-URI https://asc.fasb.org//1943274/2147480097/470-10-S99-1A
Reference 8: http://www.xbrl.org/2003/role/disclosureRef
-Topic 470
-SubTopic 10
-Name Accounting Standards Codification
-Section S99
-Paragraph 1A
-Subparagraph (SX 210.13-01(a)(4)(iv))
-Publisher FASB
-URI https://asc.fasb.org//1943274/2147480097/470-10-S99-1A
Reference 9: http://www.xbrl.org/2003/role/disclosureRef
-Topic 470
-SubTopic 10
-Name Accounting Standards Codification
-Section S99
-Paragraph 1A
-Subparagraph (SX 210.13-01(a)(5))
-Publisher FASB
-URI https://asc.fasb.org//1943274/2147480097/470-10-S99-1A
Reference 10: http://www.xbrl.org/2003/role/disclosureRef
-Topic 470
-SubTopic 10
-Name Accounting Standards Codification
-Section S99
-Paragraph 1B
-Subparagraph (SX 210.13-02(a)(4)(i))
-Publisher FASB
-URI https://asc.fasb.org//1943274/2147480097/470-10-S99-1B
Reference 11: http://www.xbrl.org/2003/role/disclosureRef
-Topic 470
-SubTopic 10
-Name Accounting Standards Codification
-Section S99
-Paragraph 1B
-Subparagraph (SX 210.13-02(a)(4)(iii)(A))
-Publisher FASB
-URI https://asc.fasb.org//1943274/2147480097/470-10-S99-1B
Reference 12: http://www.xbrl.org/2003/role/disclosureRef
-Topic 470
-SubTopic 10
-Name Accounting Standards Codification
-Section S99
-Paragraph 1B
-Subparagraph (SX 210.13-02(a)(4)(iii)(B))
-Publisher FASB
-URI https://asc.fasb.org//1943274/2147480097/470-10-S99-1B
Reference 13: http://www.xbrl.org/2003/role/disclosureRef
-Topic 470
-SubTopic 10
-Name Accounting Standards Codification
-Section S99
-Paragraph 1B
-Subparagraph (SX 210.13-02(a)(4)(iv))
-Publisher FASB
-URI https://asc.fasb.org//1943274/2147480097/470-10-S99-1B
Reference 14: http://www.xbrl.org/2003/role/disclosureRef
-Topic 470
-SubTopic 10
-Name Accounting Standards Codification
-Section S99
-Paragraph 1B
-Subparagraph (SX 210.13-02(a)(5))
-Publisher FASB
-URI https://asc.fasb.org//1943274/2147480097/470-10-S99-1B
Reference 15: http://www.xbrl.org/2003/role/disclosureRef
-Topic 280
-SubTopic 10
-Name Accounting Standards Codification
-Section 50
-Paragraph 30
-Subparagraph (b)
-Publisher FASB
-URI https://asc.fasb.org//1943274/2147482810/280-10-50-30
Reference 16: http://www.xbrl.org/2003/role/disclosureRef
-Topic 280
-SubTopic 10
-Name Accounting Standards Codification
-Section 50
-Paragraph 32
-Subparagraph (f)
-Publisher FASB
-URI https://asc.fasb.org//1943274/2147482810/280-10-50-32
Reference 17: http://www.xbrl.org/2003/role/exampleRef
-Topic 280
-SubTopic 10
-Name Accounting Standards Codification
-Section 50
-Paragraph 31
-Publisher FASB
-URI https://asc.fasb.org//1943274/2147482810/280-10-50-31
Reference 18: http://www.xbrl.org/2003/role/disclosureRef
-Topic 280
-SubTopic 10
-Name Accounting Standards Codification
-Section 50
-Paragraph 32
-Subparagraph (c)
-Publisher FASB
-URI https://asc.fasb.org//1943274/2147482810/280-10-50-32
Reference 19: http://fasb.org/us-gaap/role/ref/legacyRef
-Topic 220
-SubTopic 10
-Name Accounting Standards Codification
-Section S99
-Paragraph 2
-Subparagraph (SX 210.5-03.1,2)
-Publisher FASB
-URI https://asc.fasb.org//1943274/2147483621/220-10-S99-2
| Name: |
us-gaap_GrossProfit |
| Namespace Prefix: |
us-gaap_ |
| Data Type: |
xbrli:monetaryItemType |
| Balance Type: |
credit |
| Period Type: |
duration |
|
| X |
- References
+ Details
| Name: |
us-gaap_IncomeStatementAbstract |
| Namespace Prefix: |
us-gaap_ |
| Data Type: |
xbrli:stringItemType |
| Balance Type: |
na |
| Period Type: |
duration |
|
| X |
- DefinitionThe net amount of operating interest income (expense). Reference 1: http://fasb.org/us-gaap/role/ref/legacyRef
-Topic 942
-SubTopic 220
-Name Accounting Standards Codification
-Section S99
-Paragraph 1
-Subparagraph (SX 210.9-04.10)
-Publisher FASB
-URI https://asc.fasb.org//1943274/2147483589/942-220-S99-1
| Name: |
us-gaap_InterestIncomeExpenseNet |
| Namespace Prefix: |
us-gaap_ |
| Data Type: |
xbrli:monetaryItemType |
| Balance Type: |
credit |
| Period Type: |
duration |
|
| X |
- DefinitionThe portion of profit or loss for the period, net of income taxes, which is attributable to the parent. Reference 1: http://www.xbrl.org/2003/role/disclosureRef
-Topic 235
-SubTopic 10
-Name Accounting Standards Codification
-Section S99
-Paragraph 1
-Subparagraph (SX 210.4-08(g)(1)(ii))
-Publisher FASB
-URI https://asc.fasb.org//1943274/2147480678/235-10-S99-1
Reference 2: http://www.xbrl.org/2003/role/disclosureRef
-Topic 323
-SubTopic 10
-Name Accounting Standards Codification
-Section 50
-Paragraph 3
-Subparagraph (c)
-Publisher FASB
-URI https://asc.fasb.org//1943274/2147481687/323-10-50-3
Reference 3: http://www.xbrl.org/2003/role/disclosureRef
-Topic 825
-SubTopic 10
-Name Accounting Standards Codification
-Section 50
-Paragraph 28
-Subparagraph (f)
-Publisher FASB
-URI https://asc.fasb.org//1943274/2147482907/825-10-50-28
Reference 4: http://www.xbrl.org/2003/role/disclosureRef
-Topic 220
-SubTopic 10
-Name Accounting Standards Codification
-Section 50
-Paragraph 6
-Publisher FASB
-URI https://asc.fasb.org//1943274/2147482765/220-10-50-6
Reference 5: http://www.xbrl.org/2003/role/disclosureRef
-Topic 250
-SubTopic 10
-Name Accounting Standards Codification
-Section 50
-Paragraph 3
-Publisher FASB
-URI https://asc.fasb.org//1943274/2147483443/250-10-50-3
Reference 6: http://www.xbrl.org/2003/role/disclosureRef
-Topic 250
-SubTopic 10
-Name Accounting Standards Codification
-Section 50
-Paragraph 1
-Subparagraph (b)(2)
-Publisher FASB
-URI https://asc.fasb.org//1943274/2147483443/250-10-50-1
Reference 7: http://www.xbrl.org/2003/role/disclosureRef
-Topic 815
-SubTopic 40
-Name Accounting Standards Codification
-Section 65
-Paragraph 1
-Subparagraph (f)
-Publisher FASB
-URI https://asc.fasb.org//1943274/2147480175/815-40-65-1
Reference 8: http://www.xbrl.org/2003/role/disclosureRef
-Topic 250
-SubTopic 10
-Name Accounting Standards Codification
-Section 50
-Paragraph 8
-Publisher FASB
-URI https://asc.fasb.org//1943274/2147483443/250-10-50-8
Reference 9: http://www.xbrl.org/2003/role/disclosureRef
-Topic 250
-SubTopic 10
-Name Accounting Standards Codification
-Section 50
-Paragraph 9
-Publisher FASB
-URI https://asc.fasb.org//1943274/2147483443/250-10-50-9
Reference 10: http://www.xbrl.org/2003/role/disclosureRef
-Topic 250
-SubTopic 10
-Name Accounting Standards Codification
-Section 50
-Paragraph 11
-Subparagraph (a)
-Publisher FASB
-URI https://asc.fasb.org//1943274/2147483443/250-10-50-11
Reference 11: http://www.xbrl.org/2003/role/disclosureRef
-Topic 250
-SubTopic 10
-Name Accounting Standards Codification
-Section 50
-Paragraph 11
-Subparagraph (b)
-Publisher FASB
-URI https://asc.fasb.org//1943274/2147483443/250-10-50-11
Reference 12: http://www.xbrl.org/2003/role/disclosureRef
-Topic 250
-SubTopic 10
-Name Accounting Standards Codification
-Section 50
-Paragraph 4
-Publisher FASB
-URI https://asc.fasb.org//1943274/2147483443/250-10-50-4
Reference 13: http://www.xbrl.org/2003/role/exampleRef
-Topic 946
-SubTopic 830
-Name Accounting Standards Codification
-Section 55
-Paragraph 10
-Publisher FASB
-URI https://asc.fasb.org//1943274/2147480167/946-830-55-10
Reference 14: http://www.xbrl.org/2003/role/disclosureRef
-Topic 946
-SubTopic 220
-Name Accounting Standards Codification
-Section 45
-Paragraph 7
-Publisher FASB
-URI https://asc.fasb.org//1943274/2147483581/946-220-45-7
Reference 15: http://www.xbrl.org/2003/role/disclosureRef
-Topic 944
-SubTopic 220
-Name Accounting Standards Codification
-Section S99
-Paragraph 1
-Subparagraph (SX 210.7-04(18))
-Publisher FASB
-URI https://asc.fasb.org//1943274/2147483586/944-220-S99-1
Reference 16: http://www.xbrl.org/2003/role/disclosureRef
-Topic 280
-SubTopic 10
-Name Accounting Standards Codification
-Section 50
-Paragraph 22
-Publisher FASB
-URI https://asc.fasb.org//1943274/2147482810/280-10-50-22
Reference 17: http://www.xbrl.org/2003/role/disclosureRef
-Topic 946
-SubTopic 220
-Name Accounting Standards Codification
-Section S99
-Paragraph 1
-Subparagraph (SX 210.6-07(9))
-Publisher FASB
-URI https://asc.fasb.org//1943274/2147483575/946-220-S99-1
Reference 18: http://www.xbrl.org/2003/role/disclosureRef
-Topic 946
-SubTopic 220
-Name Accounting Standards Codification
-Section S99
-Paragraph 3
-Subparagraph (SX 210.6-09(1)(d))
-Publisher FASB
-URI https://asc.fasb.org//1943274/2147483575/946-220-S99-3
Reference 19: http://www.xbrl.org/2003/role/disclosureRef
-Topic 470
-SubTopic 10
-Name Accounting Standards Codification
-Section S99
-Paragraph 1A
-Subparagraph (SX 210.13-01(a)(4)(i))
-Publisher FASB
-URI https://asc.fasb.org//1943274/2147480097/470-10-S99-1A
Reference 20: http://www.xbrl.org/2009/role/commonPracticeRef
-Topic 470
-SubTopic 10
-Name Accounting Standards Codification
-Section S99
-Paragraph 1A
-Subparagraph (SX 210.13-01(a)(4)(ii))
-Publisher FASB
-URI https://asc.fasb.org//1943274/2147480097/470-10-S99-1A
Reference 21: http://www.xbrl.org/2003/role/disclosureRef
-Topic 470
-SubTopic 10
-Name Accounting Standards Codification
-Section S99
-Paragraph 1A
-Subparagraph (SX 210.13-01(a)(4)(iii)(A))
-Publisher FASB
-URI https://asc.fasb.org//1943274/2147480097/470-10-S99-1A
Reference 22: http://www.xbrl.org/2003/role/disclosureRef
-Topic 470
-SubTopic 10
-Name Accounting Standards Codification
-Section S99
-Paragraph 1A
-Subparagraph (SX 210.13-01(a)(4)(iv))
-Publisher FASB
-URI https://asc.fasb.org//1943274/2147480097/470-10-S99-1A
Reference 23: http://www.xbrl.org/2003/role/disclosureRef
-Topic 470
-SubTopic 10
-Name Accounting Standards Codification
-Section S99
-Paragraph 1A
-Subparagraph (SX 210.13-01(a)(5))
-Publisher FASB
-URI https://asc.fasb.org//1943274/2147480097/470-10-S99-1A
Reference 24: http://www.xbrl.org/2003/role/disclosureRef
-Topic 470
-SubTopic 10
-Name Accounting Standards Codification
-Section S99
-Paragraph 1B
-Subparagraph (SX 210.13-02(a)(4)(i))
-Publisher FASB
-URI https://asc.fasb.org//1943274/2147480097/470-10-S99-1B
Reference 25: http://www.xbrl.org/2003/role/disclosureRef
-Topic 470
-SubTopic 10
-Name Accounting Standards Codification
-Section S99
-Paragraph 1B
-Subparagraph (SX 210.13-02(a)(4)(iii)(A))
-Publisher FASB
-URI https://asc.fasb.org//1943274/2147480097/470-10-S99-1B
Reference 26: http://www.xbrl.org/2003/role/disclosureRef
-Topic 470
-SubTopic 10
-Name Accounting Standards Codification
-Section S99
-Paragraph 1B
-Subparagraph (SX 210.13-02(a)(4)(iii)(B))
-Publisher FASB
-URI https://asc.fasb.org//1943274/2147480097/470-10-S99-1B
Reference 27: http://www.xbrl.org/2003/role/disclosureRef
-Topic 470
-SubTopic 10
-Name Accounting Standards Codification
-Section S99
-Paragraph 1B
-Subparagraph (SX 210.13-02(a)(4)(iv))
-Publisher FASB
-URI https://asc.fasb.org//1943274/2147480097/470-10-S99-1B
Reference 28: http://www.xbrl.org/2003/role/disclosureRef
-Topic 470
-SubTopic 10
-Name Accounting Standards Codification
-Section S99
-Paragraph 1B
-Subparagraph (SX 210.13-02(a)(5))
-Publisher FASB
-URI https://asc.fasb.org//1943274/2147480097/470-10-S99-1B
Reference 29: http://www.xbrl.org/2003/role/disclosureRef
-Topic 280
-SubTopic 10
-Name Accounting Standards Codification
-Section 50
-Paragraph 30
-Subparagraph (b)
-Publisher FASB
-URI https://asc.fasb.org//1943274/2147482810/280-10-50-30
Reference 30: http://www.xbrl.org/2003/role/disclosureRef
-Topic 280
-SubTopic 10
-Name Accounting Standards Codification
-Section 50
-Paragraph 32
-Subparagraph (f)
-Publisher FASB
-URI https://asc.fasb.org//1943274/2147482810/280-10-50-32
Reference 31: http://www.xbrl.org/2003/role/disclosureRef
-Topic 260
-SubTopic 10
-Name Accounting Standards Codification
-Section 45
-Paragraph 60B
-Subparagraph (a)
-Publisher FASB
-URI https://asc.fasb.org//1943274/2147482689/260-10-45-60B
Reference 32: http://www.xbrl.org/2003/role/exampleRef
-Topic 280
-SubTopic 10
-Name Accounting Standards Codification
-Section 50
-Paragraph 31
-Publisher FASB
-URI https://asc.fasb.org//1943274/2147482810/280-10-50-31
Reference 33: http://www.xbrl.org/2003/role/disclosureRef
-Topic 280
-SubTopic 10
-Name Accounting Standards Codification
-Section 50
-Paragraph 32
-Subparagraph (c)
-Publisher FASB
-URI https://asc.fasb.org//1943274/2147482810/280-10-50-32
Reference 34: http://www.xbrl.org/2003/role/disclosureRef
-Topic 205
-SubTopic 20
-Name Accounting Standards Codification
-Section 50
-Paragraph 7
-Publisher FASB
-URI https://asc.fasb.org//1943274/2147483499/205-20-50-7
Reference 35: http://fasb.org/us-gaap/role/ref/legacyRef
-Topic 230
-SubTopic 10
-Name Accounting Standards Codification
-Section 45
-Paragraph 28
-Publisher FASB
-URI https://asc.fasb.org//1943274/2147482740/230-10-45-28
Reference 36: http://www.xbrl.org/2003/role/disclosureRef
-Topic 220
-SubTopic 10
-Name Accounting Standards Codification
-Section 45
-Paragraph 1A
-Subparagraph (a)
-Publisher FASB
-URI https://asc.fasb.org//1943274/2147482790/220-10-45-1A
Reference 37: http://www.xbrl.org/2003/role/disclosureRef
-Topic 220
-SubTopic 10
-Name Accounting Standards Codification
-Section 45
-Paragraph 1B
-Subparagraph (a)
-Publisher FASB
-URI https://asc.fasb.org//1943274/2147482790/220-10-45-1B
Reference 38: http://fasb.org/us-gaap/role/ref/legacyRef
-Topic 220
-SubTopic 10
-Name Accounting Standards Codification
-Section S99
-Paragraph 2
-Subparagraph (SX 210.5-03(20))
-Publisher FASB
-URI https://asc.fasb.org//1943274/2147483621/220-10-S99-2
Reference 39: http://fasb.org/us-gaap/role/ref/legacyRef
-Topic 942
-SubTopic 220
-Name Accounting Standards Codification
-Section S99
-Paragraph 1
-Subparagraph (SX 210.9-04(22))
-Publisher FASB
-URI https://asc.fasb.org//1943274/2147483589/942-220-S99-1
| Name: |
us-gaap_NetIncomeLoss |
| Namespace Prefix: |
us-gaap_ |
| Data Type: |
xbrli:monetaryItemType |
| Balance Type: |
credit |
| Period Type: |
duration |
|
| X |
- DefinitionGenerally recurring costs associated with normal operations except for the portion of these expenses which can be clearly related to production and included in cost of sales or services. Includes selling, general and administrative expense.
| Name: |
us-gaap_OperatingExpenses |
| Namespace Prefix: |
us-gaap_ |
| Data Type: |
xbrli:monetaryItemType |
| Balance Type: |
debit |
| Period Type: |
duration |
|
| X |
- References
+ Details
| Name: |
us-gaap_OperatingExpensesAbstract |
| Namespace Prefix: |
us-gaap_ |
| Data Type: |
xbrli:stringItemType |
| Balance Type: |
na |
| Period Type: |
duration |
|
| X |
- DefinitionThe net result for the period of deducting operating expenses from operating revenues. Reference 1: http://www.xbrl.org/2003/role/disclosureRef
-Topic 280
-SubTopic 10
-Name Accounting Standards Codification
-Section 50
-Paragraph 22
-Publisher FASB
-URI https://asc.fasb.org//1943274/2147482810/280-10-50-22
Reference 2: http://www.xbrl.org/2003/role/disclosureRef
-Topic 280
-SubTopic 10
-Name Accounting Standards Codification
-Section 50
-Paragraph 30
-Subparagraph (b)
-Publisher FASB
-URI https://asc.fasb.org//1943274/2147482810/280-10-50-30
Reference 3: http://www.xbrl.org/2003/role/disclosureRef
-Topic 280
-SubTopic 10
-Name Accounting Standards Codification
-Section 50
-Paragraph 32
-Subparagraph (f)
-Publisher FASB
-URI https://asc.fasb.org//1943274/2147482810/280-10-50-32
Reference 4: http://www.xbrl.org/2003/role/exampleRef
-Topic 280
-SubTopic 10
-Name Accounting Standards Codification
-Section 50
-Paragraph 31
-Publisher FASB
-URI https://asc.fasb.org//1943274/2147482810/280-10-50-31
Reference 5: http://www.xbrl.org/2003/role/disclosureRef
-Topic 280
-SubTopic 10
-Name Accounting Standards Codification
-Section 50
-Paragraph 32
-Subparagraph (c)
-Publisher FASB
-URI https://asc.fasb.org//1943274/2147482810/280-10-50-32
| Name: |
us-gaap_OperatingIncomeLoss |
| Namespace Prefix: |
us-gaap_ |
| Data Type: |
xbrli:monetaryItemType |
| Balance Type: |
credit |
| Period Type: |
duration |
|
| X |
- DefinitionAmount of income (expense) related to nonoperating activities, classified as other. Reference 1: http://fasb.org/us-gaap/role/ref/legacyRef
-Topic 220
-SubTopic 10
-Name Accounting Standards Codification
-Section S99
-Paragraph 2
-Subparagraph (SX 210.5-03.9)
-Publisher FASB
-URI https://asc.fasb.org//1943274/2147483621/220-10-S99-2
| Name: |
us-gaap_OtherNonoperatingIncomeExpense |
| Namespace Prefix: |
us-gaap_ |
| Data Type: |
xbrli:monetaryItemType |
| Balance Type: |
credit |
| Period Type: |
duration |
|
| X |
- DefinitionThe aggregate costs incurred (1) in a planned search or critical investigation aimed at discovery of new knowledge with the hope that such knowledge will be useful in developing a new product or service, a new process or technique, or in bringing about a significant improvement to an existing product or process; or (2) to translate research findings or other knowledge into a plan or design for a new product or process or for a significant improvement to an existing product or process whether intended for sale or the entity's use, during the reporting period charged to research and development projects, including the costs of developing computer software up to the point in time of achieving technological feasibility, and costs allocated in accounting for a business combination to in-process projects deemed to have no alternative future use. Reference 1: http://www.xbrl.org/2003/role/disclosureRef
-Topic 730
-SubTopic 10
-Name Accounting Standards Codification
-Section 50
-Paragraph 1
-Publisher FASB
-URI https://asc.fasb.org//1943274/2147482916/730-10-50-1
Reference 2: http://www.xbrl.org/2009/role/commonPracticeRef
-Topic 912
-SubTopic 730
-Name Accounting Standards Codification
-Section 25
-Paragraph 1
-Publisher FASB
-URI https://asc.fasb.org//1943274/2147482517/912-730-25-1
Reference 3: http://fasb.org/us-gaap/role/ref/legacyRef
-Name Accounting Standards Codification
-Topic 985
-SubTopic 20
-Section 50
-Paragraph 1
-Publisher FASB
-URI https://asc.fasb.org//1943274/2147481283/985-20-50-1
| Name: |
us-gaap_ResearchAndDevelopmentExpense |
| Namespace Prefix: |
us-gaap_ |
| Data Type: |
xbrli:monetaryItemType |
| Balance Type: |
debit |
| Period Type: |
duration |
|
| X |
- DefinitionAmount, after cash payment, of expenses associated with exit or disposal activities pursuant to an authorized plan and expenses resulting from the write-down of assets. Excludes expenses related to a business combination, a discontinued operation or an asset retirement obligation. Reference 1: http://fasb.org/us-gaap/role/ref/legacyRef
-Name Accounting Standards Codification
-Section 45
-Paragraph 28
-Subparagraph (b)
-SubTopic 10
-Topic 230
-Publisher FASB
-URI https://asc.fasb.org//1943274/2147482740/230-10-45-28
| Name: |
us-gaap_RestructuringCostsAndAssetImpairmentCharges |
| Namespace Prefix: |
us-gaap_ |
| Data Type: |
xbrli:monetaryItemType |
| Balance Type: |
debit |
| Period Type: |
duration |
|
| X |
- DefinitionAmount, excluding tax collected from customer, of revenue from satisfaction of performance obligation by transferring promised good or service to customer. Tax collected from customer is tax assessed by governmental authority that is both imposed on and concurrent with specific revenue-producing transaction, including, but not limited to, sales, use, value added and excise. Reference 1: http://www.xbrl.org/2003/role/disclosureRef
-Topic 924
-SubTopic 10
-Name Accounting Standards Codification
-Section S99
-Paragraph 1
-Subparagraph (SAB Topic 11.L)
-Publisher FASB
-URI https://asc.fasb.org//1943274/2147479941/924-10-S99-1
Reference 2: http://www.xbrl.org/2003/role/disclosureRef
-Topic 606
-SubTopic 10
-Name Accounting Standards Codification
-Section 50
-Paragraph 5
-Publisher FASB
-URI https://asc.fasb.org//1943274/2147479806/606-10-50-5
Reference 3: http://www.xbrl.org/2003/role/disclosureRef
-Topic 280
-SubTopic 10
-Name Accounting Standards Codification
-Section 50
-Paragraph 30
-Subparagraph (a)
-Publisher FASB
-URI https://asc.fasb.org//1943274/2147482810/280-10-50-30
Reference 4: http://www.xbrl.org/2003/role/disclosureRef
-Topic 280
-SubTopic 10
-Name Accounting Standards Codification
-Section 50
-Paragraph 42
-Publisher FASB
-URI https://asc.fasb.org//1943274/2147482810/280-10-50-42
Reference 5: http://www.xbrl.org/2003/role/disclosureRef
-Topic 280
-SubTopic 10
-Name Accounting Standards Codification
-Section 50
-Paragraph 22
-Subparagraph (b)
-Publisher FASB
-URI https://asc.fasb.org//1943274/2147482810/280-10-50-22
Reference 6: http://www.xbrl.org/2003/role/disclosureRef
-Topic 280
-SubTopic 10
-Name Accounting Standards Codification
-Section 50
-Paragraph 32
-Subparagraph (b)
-Publisher FASB
-URI https://asc.fasb.org//1943274/2147482810/280-10-50-32
Reference 7: http://www.xbrl.org/2003/role/disclosureRef
-Topic 280
-SubTopic 10
-Name Accounting Standards Codification
-Section 50
-Paragraph 40
-Publisher FASB
-URI https://asc.fasb.org//1943274/2147482810/280-10-50-40
Reference 8: http://www.xbrl.org/2003/role/disclosureRef
-Topic 280
-SubTopic 10
-Name Accounting Standards Codification
-Section 50
-Paragraph 22
-Subparagraph (a)
-Publisher FASB
-URI https://asc.fasb.org//1943274/2147482810/280-10-50-22
Reference 9: http://www.xbrl.org/2003/role/disclosureRef
-Topic 280
-SubTopic 10
-Name Accounting Standards Codification
-Section 50
-Paragraph 32
-Subparagraph (a)
-Publisher FASB
-URI https://asc.fasb.org//1943274/2147482810/280-10-50-32
Reference 10: http://www.xbrl.org/2003/role/disclosureRef
-Topic 280
-SubTopic 10
-Name Accounting Standards Codification
-Section 50
-Paragraph 41
-Subparagraph (a)
-Publisher FASB
-URI https://asc.fasb.org//1943274/2147482810/280-10-50-41
Reference 11: http://www.xbrl.org/2003/role/disclosureRef
-Topic 606
-SubTopic 10
-Name Accounting Standards Codification
-Section 50
-Paragraph 4
-Subparagraph (a)
-Publisher FASB
-URI https://asc.fasb.org//1943274/2147479806/606-10-50-4
| Name: |
us-gaap_RevenueFromContractWithCustomerExcludingAssessedTax |
| Namespace Prefix: |
us-gaap_ |
| Data Type: |
xbrli:monetaryItemType |
| Balance Type: |
credit |
| Period Type: |
duration |
|
| X |
- DefinitionThe aggregate total costs related to selling a firm's product and services, as well as all other general and administrative expenses. Direct selling expenses (for example, credit, warranty, and advertising) are expenses that can be directly linked to the sale of specific products. Indirect selling expenses are expenses that cannot be directly linked to the sale of specific products, for example telephone expenses, Internet, and postal charges. General and administrative expenses include salaries of non-sales personnel, rent, utilities, communication, etc. Reference 1: http://fasb.org/us-gaap/role/ref/legacyRef
-Topic 220
-SubTopic 10
-Name Accounting Standards Codification
-Section S99
-Paragraph 2
-Subparagraph (SX 210.5-03.4)
-Publisher FASB
-URI https://asc.fasb.org//1943274/2147483621/220-10-S99-2
| Name: |
us-gaap_SellingGeneralAndAdministrativeExpense |
| Namespace Prefix: |
us-gaap_ |
| Data Type: |
xbrli:monetaryItemType |
| Balance Type: |
debit |
| Period Type: |
duration |
|
| X |
- DefinitionThe average number of shares or units issued and outstanding that are used in calculating diluted EPS or earnings per unit (EPU), determined based on the timing of issuance of shares or units in the period. Reference 1: http://www.xbrl.org/2003/role/disclosureRef
-Topic 260
-SubTopic 10
-Name Accounting Standards Codification
-Section 50
-Paragraph 1
-Subparagraph (a)
-Publisher FASB
-URI https://asc.fasb.org//1943274/2147482662/260-10-50-1
Reference 2: http://www.xbrl.org/2003/role/disclosureRef
-Topic 260
-SubTopic 10
-Name Accounting Standards Codification
-Section 45
-Paragraph 16
-Publisher FASB
-URI https://asc.fasb.org//1943274/2147482689/260-10-45-16
| Name: |
us-gaap_WeightedAverageNumberOfDilutedSharesOutstanding |
| Namespace Prefix: |
us-gaap_ |
| Data Type: |
xbrli:sharesItemType |
| Balance Type: |
na |
| Period Type: |
duration |
|
| X |
- References
+ Details
| Name: |
us-gaap_WeightedAverageNumberOfSharesOutstandingAbstract |
| Namespace Prefix: |
us-gaap_ |
| Data Type: |
xbrli:stringItemType |
| Balance Type: |
na |
| Period Type: |
duration |
|
| X |
- DefinitionNumber of [basic] shares or units, after adjustment for contingently issuable shares or units and other shares or units not deemed outstanding, determined by relating the portion of time within a reporting period that common shares or units have been outstanding to the total time in that period. Reference 1: http://www.xbrl.org/2003/role/disclosureRef
-Topic 260
-SubTopic 10
-Name Accounting Standards Codification
-Section 50
-Paragraph 1
-Subparagraph (a)
-Publisher FASB
-URI https://asc.fasb.org//1943274/2147482662/260-10-50-1
Reference 2: http://www.xbrl.org/2003/role/disclosureRef
-Topic 260
-SubTopic 10
-Name Accounting Standards Codification
-Section 45
-Paragraph 10
-Publisher FASB
-URI https://asc.fasb.org//1943274/2147482689/260-10-45-10
| Name: |
us-gaap_WeightedAverageNumberOfSharesOutstandingBasic |
| Namespace Prefix: |
us-gaap_ |
| Data Type: |
xbrli:sharesItemType |
| Balance Type: |
na |
| Period Type: |
duration |
|
v3.23.3
| X |
- DefinitionAmount after tax of increase (decrease) in equity from transactions and other events and circumstances from net income and other comprehensive income, attributable to parent entity. Excludes changes in equity resulting from investments by owners and distributions to owners. Reference 1: http://www.xbrl.org/2003/role/disclosureRef
-Topic 220
-SubTopic 10
-Name Accounting Standards Codification
-Section S99
-Paragraph 2
-Subparagraph (SX 210.5-03(24))
-Publisher FASB
-URI https://asc.fasb.org//1943274/2147483621/220-10-S99-2
Reference 2: http://www.xbrl.org/2003/role/disclosureRef
-Topic 942
-SubTopic 220
-Name Accounting Standards Codification
-Section S99
-Paragraph 1
-Subparagraph (SX 210.9-04(26))
-Publisher FASB
-URI https://asc.fasb.org//1943274/2147483589/942-220-S99-1
Reference 3: http://www.xbrl.org/2003/role/disclosureRef
-Topic 944
-SubTopic 220
-Name Accounting Standards Codification
-Section S99
-Paragraph 1
-Subparagraph (SX 210.7-04(22))
-Publisher FASB
-URI https://asc.fasb.org//1943274/2147483586/944-220-S99-1
Reference 4: http://www.xbrl.org/2003/role/disclosureRef
-Topic 220
-SubTopic 10
-Name Accounting Standards Codification
-Section 45
-Paragraph 1A
-Subparagraph (c)
-Publisher FASB
-URI https://asc.fasb.org//1943274/2147482790/220-10-45-1A
Reference 5: http://www.xbrl.org/2003/role/disclosureRef
-Topic 220
-SubTopic 10
-Name Accounting Standards Codification
-Section 45
-Paragraph 1B
-Subparagraph (b)
-Publisher FASB
-URI https://asc.fasb.org//1943274/2147482790/220-10-45-1B
Reference 6: http://fasb.org/us-gaap/role/ref/legacyRef
-Name Accounting Standards Codification
-Topic 220
-SubTopic 10
-Section 45
-Paragraph 5
-Publisher FASB
-URI https://asc.fasb.org//1943274/2147482790/220-10-45-5
| Name: |
us-gaap_ComprehensiveIncomeNetOfTax |
| Namespace Prefix: |
us-gaap_ |
| Data Type: |
xbrli:monetaryItemType |
| Balance Type: |
credit |
| Period Type: |
duration |
|
| X |
- DefinitionThe portion of profit or loss for the period, net of income taxes, which is attributable to the parent. Reference 1: http://www.xbrl.org/2003/role/disclosureRef
-Topic 235
-SubTopic 10
-Name Accounting Standards Codification
-Section S99
-Paragraph 1
-Subparagraph (SX 210.4-08(g)(1)(ii))
-Publisher FASB
-URI https://asc.fasb.org//1943274/2147480678/235-10-S99-1
Reference 2: http://www.xbrl.org/2003/role/disclosureRef
-Topic 323
-SubTopic 10
-Name Accounting Standards Codification
-Section 50
-Paragraph 3
-Subparagraph (c)
-Publisher FASB
-URI https://asc.fasb.org//1943274/2147481687/323-10-50-3
Reference 3: http://www.xbrl.org/2003/role/disclosureRef
-Topic 825
-SubTopic 10
-Name Accounting Standards Codification
-Section 50
-Paragraph 28
-Subparagraph (f)
-Publisher FASB
-URI https://asc.fasb.org//1943274/2147482907/825-10-50-28
Reference 4: http://www.xbrl.org/2003/role/disclosureRef
-Topic 220
-SubTopic 10
-Name Accounting Standards Codification
-Section 50
-Paragraph 6
-Publisher FASB
-URI https://asc.fasb.org//1943274/2147482765/220-10-50-6
Reference 5: http://www.xbrl.org/2003/role/disclosureRef
-Topic 250
-SubTopic 10
-Name Accounting Standards Codification
-Section 50
-Paragraph 3
-Publisher FASB
-URI https://asc.fasb.org//1943274/2147483443/250-10-50-3
Reference 6: http://www.xbrl.org/2003/role/disclosureRef
-Topic 250
-SubTopic 10
-Name Accounting Standards Codification
-Section 50
-Paragraph 1
-Subparagraph (b)(2)
-Publisher FASB
-URI https://asc.fasb.org//1943274/2147483443/250-10-50-1
Reference 7: http://www.xbrl.org/2003/role/disclosureRef
-Topic 815
-SubTopic 40
-Name Accounting Standards Codification
-Section 65
-Paragraph 1
-Subparagraph (f)
-Publisher FASB
-URI https://asc.fasb.org//1943274/2147480175/815-40-65-1
Reference 8: http://www.xbrl.org/2003/role/disclosureRef
-Topic 250
-SubTopic 10
-Name Accounting Standards Codification
-Section 50
-Paragraph 8
-Publisher FASB
-URI https://asc.fasb.org//1943274/2147483443/250-10-50-8
Reference 9: http://www.xbrl.org/2003/role/disclosureRef
-Topic 250
-SubTopic 10
-Name Accounting Standards Codification
-Section 50
-Paragraph 9
-Publisher FASB
-URI https://asc.fasb.org//1943274/2147483443/250-10-50-9
Reference 10: http://www.xbrl.org/2003/role/disclosureRef
-Topic 250
-SubTopic 10
-Name Accounting Standards Codification
-Section 50
-Paragraph 11
-Subparagraph (a)
-Publisher FASB
-URI https://asc.fasb.org//1943274/2147483443/250-10-50-11
Reference 11: http://www.xbrl.org/2003/role/disclosureRef
-Topic 250
-SubTopic 10
-Name Accounting Standards Codification
-Section 50
-Paragraph 11
-Subparagraph (b)
-Publisher FASB
-URI https://asc.fasb.org//1943274/2147483443/250-10-50-11
Reference 12: http://www.xbrl.org/2003/role/disclosureRef
-Topic 250
-SubTopic 10
-Name Accounting Standards Codification
-Section 50
-Paragraph 4
-Publisher FASB
-URI https://asc.fasb.org//1943274/2147483443/250-10-50-4
Reference 13: http://www.xbrl.org/2003/role/exampleRef
-Topic 946
-SubTopic 830
-Name Accounting Standards Codification
-Section 55
-Paragraph 10
-Publisher FASB
-URI https://asc.fasb.org//1943274/2147480167/946-830-55-10
Reference 14: http://www.xbrl.org/2003/role/disclosureRef
-Topic 946
-SubTopic 220
-Name Accounting Standards Codification
-Section 45
-Paragraph 7
-Publisher FASB
-URI https://asc.fasb.org//1943274/2147483581/946-220-45-7
Reference 15: http://www.xbrl.org/2003/role/disclosureRef
-Topic 944
-SubTopic 220
-Name Accounting Standards Codification
-Section S99
-Paragraph 1
-Subparagraph (SX 210.7-04(18))
-Publisher FASB
-URI https://asc.fasb.org//1943274/2147483586/944-220-S99-1
Reference 16: http://www.xbrl.org/2003/role/disclosureRef
-Topic 280
-SubTopic 10
-Name Accounting Standards Codification
-Section 50
-Paragraph 22
-Publisher FASB
-URI https://asc.fasb.org//1943274/2147482810/280-10-50-22
Reference 17: http://www.xbrl.org/2003/role/disclosureRef
-Topic 946
-SubTopic 220
-Name Accounting Standards Codification
-Section S99
-Paragraph 1
-Subparagraph (SX 210.6-07(9))
-Publisher FASB
-URI https://asc.fasb.org//1943274/2147483575/946-220-S99-1
Reference 18: http://www.xbrl.org/2003/role/disclosureRef
-Topic 946
-SubTopic 220
-Name Accounting Standards Codification
-Section S99
-Paragraph 3
-Subparagraph (SX 210.6-09(1)(d))
-Publisher FASB
-URI https://asc.fasb.org//1943274/2147483575/946-220-S99-3
Reference 19: http://www.xbrl.org/2003/role/disclosureRef
-Topic 470
-SubTopic 10
-Name Accounting Standards Codification
-Section S99
-Paragraph 1A
-Subparagraph (SX 210.13-01(a)(4)(i))
-Publisher FASB
-URI https://asc.fasb.org//1943274/2147480097/470-10-S99-1A
Reference 20: http://www.xbrl.org/2009/role/commonPracticeRef
-Topic 470
-SubTopic 10
-Name Accounting Standards Codification
-Section S99
-Paragraph 1A
-Subparagraph (SX 210.13-01(a)(4)(ii))
-Publisher FASB
-URI https://asc.fasb.org//1943274/2147480097/470-10-S99-1A
Reference 21: http://www.xbrl.org/2003/role/disclosureRef
-Topic 470
-SubTopic 10
-Name Accounting Standards Codification
-Section S99
-Paragraph 1A
-Subparagraph (SX 210.13-01(a)(4)(iii)(A))
-Publisher FASB
-URI https://asc.fasb.org//1943274/2147480097/470-10-S99-1A
Reference 22: http://www.xbrl.org/2003/role/disclosureRef
-Topic 470
-SubTopic 10
-Name Accounting Standards Codification
-Section S99
-Paragraph 1A
-Subparagraph (SX 210.13-01(a)(4)(iv))
-Publisher FASB
-URI https://asc.fasb.org//1943274/2147480097/470-10-S99-1A
Reference 23: http://www.xbrl.org/2003/role/disclosureRef
-Topic 470
-SubTopic 10
-Name Accounting Standards Codification
-Section S99
-Paragraph 1A
-Subparagraph (SX 210.13-01(a)(5))
-Publisher FASB
-URI https://asc.fasb.org//1943274/2147480097/470-10-S99-1A
Reference 24: http://www.xbrl.org/2003/role/disclosureRef
-Topic 470
-SubTopic 10
-Name Accounting Standards Codification
-Section S99
-Paragraph 1B
-Subparagraph (SX 210.13-02(a)(4)(i))
-Publisher FASB
-URI https://asc.fasb.org//1943274/2147480097/470-10-S99-1B
Reference 25: http://www.xbrl.org/2003/role/disclosureRef
-Topic 470
-SubTopic 10
-Name Accounting Standards Codification
-Section S99
-Paragraph 1B
-Subparagraph (SX 210.13-02(a)(4)(iii)(A))
-Publisher FASB
-URI https://asc.fasb.org//1943274/2147480097/470-10-S99-1B
Reference 26: http://www.xbrl.org/2003/role/disclosureRef
-Topic 470
-SubTopic 10
-Name Accounting Standards Codification
-Section S99
-Paragraph 1B
-Subparagraph (SX 210.13-02(a)(4)(iii)(B))
-Publisher FASB
-URI https://asc.fasb.org//1943274/2147480097/470-10-S99-1B
Reference 27: http://www.xbrl.org/2003/role/disclosureRef
-Topic 470
-SubTopic 10
-Name Accounting Standards Codification
-Section S99
-Paragraph 1B
-Subparagraph (SX 210.13-02(a)(4)(iv))
-Publisher FASB
-URI https://asc.fasb.org//1943274/2147480097/470-10-S99-1B
Reference 28: http://www.xbrl.org/2003/role/disclosureRef
-Topic 470
-SubTopic 10
-Name Accounting Standards Codification
-Section S99
-Paragraph 1B
-Subparagraph (SX 210.13-02(a)(5))
-Publisher FASB
-URI https://asc.fasb.org//1943274/2147480097/470-10-S99-1B
Reference 29: http://www.xbrl.org/2003/role/disclosureRef
-Topic 280
-SubTopic 10
-Name Accounting Standards Codification
-Section 50
-Paragraph 30
-Subparagraph (b)
-Publisher FASB
-URI https://asc.fasb.org//1943274/2147482810/280-10-50-30
Reference 30: http://www.xbrl.org/2003/role/disclosureRef
-Topic 280
-SubTopic 10
-Name Accounting Standards Codification
-Section 50
-Paragraph 32
-Subparagraph (f)
-Publisher FASB
-URI https://asc.fasb.org//1943274/2147482810/280-10-50-32
Reference 31: http://www.xbrl.org/2003/role/disclosureRef
-Topic 260
-SubTopic 10
-Name Accounting Standards Codification
-Section 45
-Paragraph 60B
-Subparagraph (a)
-Publisher FASB
-URI https://asc.fasb.org//1943274/2147482689/260-10-45-60B
Reference 32: http://www.xbrl.org/2003/role/exampleRef
-Topic 280
-SubTopic 10
-Name Accounting Standards Codification
-Section 50
-Paragraph 31
-Publisher FASB
-URI https://asc.fasb.org//1943274/2147482810/280-10-50-31
Reference 33: http://www.xbrl.org/2003/role/disclosureRef
-Topic 280
-SubTopic 10
-Name Accounting Standards Codification
-Section 50
-Paragraph 32
-Subparagraph (c)
-Publisher FASB
-URI https://asc.fasb.org//1943274/2147482810/280-10-50-32
Reference 34: http://www.xbrl.org/2003/role/disclosureRef
-Topic 205
-SubTopic 20
-Name Accounting Standards Codification
-Section 50
-Paragraph 7
-Publisher FASB
-URI https://asc.fasb.org//1943274/2147483499/205-20-50-7
Reference 35: http://fasb.org/us-gaap/role/ref/legacyRef
-Topic 230
-SubTopic 10
-Name Accounting Standards Codification
-Section 45
-Paragraph 28
-Publisher FASB
-URI https://asc.fasb.org//1943274/2147482740/230-10-45-28
Reference 36: http://www.xbrl.org/2003/role/disclosureRef
-Topic 220
-SubTopic 10
-Name Accounting Standards Codification
-Section 45
-Paragraph 1A
-Subparagraph (a)
-Publisher FASB
-URI https://asc.fasb.org//1943274/2147482790/220-10-45-1A
Reference 37: http://www.xbrl.org/2003/role/disclosureRef
-Topic 220
-SubTopic 10
-Name Accounting Standards Codification
-Section 45
-Paragraph 1B
-Subparagraph (a)
-Publisher FASB
-URI https://asc.fasb.org//1943274/2147482790/220-10-45-1B
Reference 38: http://fasb.org/us-gaap/role/ref/legacyRef
-Topic 220
-SubTopic 10
-Name Accounting Standards Codification
-Section S99
-Paragraph 2
-Subparagraph (SX 210.5-03(20))
-Publisher FASB
-URI https://asc.fasb.org//1943274/2147483621/220-10-S99-2
Reference 39: http://fasb.org/us-gaap/role/ref/legacyRef
-Topic 942
-SubTopic 220
-Name Accounting Standards Codification
-Section S99
-Paragraph 1
-Subparagraph (SX 210.9-04(22))
-Publisher FASB
-URI https://asc.fasb.org//1943274/2147483589/942-220-S99-1
| Name: |
us-gaap_NetIncomeLoss |
| Namespace Prefix: |
us-gaap_ |
| Data Type: |
xbrli:monetaryItemType |
| Balance Type: |
credit |
| Period Type: |
duration |
|
| X |
- DefinitionAmount, after tax and reclassification adjustment, of (increase) decrease in accumulated other comprehensive income for defined benefit plan, attributable to parent. Reference 1: http://fasb.org/us-gaap/role/ref/legacyRef
-Name Accounting Standards Codification
-Section 45
-Paragraph 10A
-Subparagraph (i-k)
-SubTopic 10
-Topic 220
-Publisher FASB
-URI https://asc.fasb.org//1943274/2147482790/220-10-45-10A
Reference 2: http://fasb.org/us-gaap/role/ref/legacyRef
-Topic 810
-SubTopic 10
-Name Accounting Standards Codification
-Section 45
-Paragraph 19
-Publisher FASB
-URI https://asc.fasb.org//1943274/2147481231/810-10-45-19
Reference 3: http://fasb.org/us-gaap/role/ref/legacyRef
-Topic 220
-SubTopic 10
-Name Accounting Standards Codification
-Section 45
-Paragraph 11
-Publisher FASB
-URI https://asc.fasb.org//1943274/2147482790/220-10-45-11
Reference 4: http://fasb.org/us-gaap/role/ref/legacyRef
-Name Accounting Standards Codification
-Section 50
-Paragraph 1A
-Subparagraph (c)(3)
-SubTopic 10
-Topic 810
-Publisher FASB
-URI https://asc.fasb.org//1943274/2147481203/810-10-50-1A
| Name: |
us-gaap_OtherComprehensiveIncomeDefinedBenefitPlansAdjustmentNetOfTaxPortionAttributableToParent |
| Namespace Prefix: |
us-gaap_ |
| Data Type: |
xbrli:monetaryItemType |
| Balance Type: |
debit |
| Period Type: |
duration |
|
| X |
- DefinitionAmount after tax and reclassification adjustments of gain (loss) on foreign currency translation adjustments, foreign currency transactions designated and effective as economic hedges of a net investment in a foreign entity and intra-entity foreign currency transactions that are of a long-term-investment nature, attributable to parent entity. Reference 1: http://fasb.org/us-gaap/role/ref/legacyRef
-Topic 810
-SubTopic 10
-Name Accounting Standards Codification
-Section 45
-Paragraph 19
-Publisher FASB
-URI https://asc.fasb.org//1943274/2147481231/810-10-45-19
Reference 2: http://fasb.org/us-gaap/role/ref/legacyRef
-Name Accounting Standards Codification
-Section 45
-Paragraph 20
-SubTopic 10
-Topic 810
-Publisher FASB
-URI https://asc.fasb.org//1943274/2147481231/810-10-45-20
Reference 3: http://fasb.org/us-gaap/role/ref/legacyRef
-Name Accounting Standards Codification
-Section 50
-Paragraph 1A
-Subparagraph (c)(3)
-SubTopic 10
-Topic 810
-Publisher FASB
-URI https://asc.fasb.org//1943274/2147481203/810-10-50-1A
| Name: |
us-gaap_OtherComprehensiveIncomeForeignCurrencyTransactionAndTranslationAdjustmentNetOfTaxPortionAttributableToParent |
| Namespace Prefix: |
us-gaap_ |
| Data Type: |
xbrli:monetaryItemType |
| Balance Type: |
credit |
| Period Type: |
duration |
|
| X |
- DefinitionAmount, after tax and reclassification, of gain (loss) from derivative instrument designated and qualifying as cash flow hedge included in assessment of hedge effectiveness, attributable to parent. Reference 1: http://www.xbrl.org/2003/role/disclosureRef
-Topic 220
-SubTopic 10
-Name Accounting Standards Codification
-Section 45
-Paragraph 11
-Publisher FASB
-URI https://asc.fasb.org//1943274/2147482790/220-10-45-11
| Name: |
us-gaap_OtherComprehensiveIncomeLossCashFlowHedgeGainLossAfterReclassificationAndTaxParent |
| Namespace Prefix: |
us-gaap_ |
| Data Type: |
xbrli:monetaryItemType |
| Balance Type: |
credit |
| Period Type: |
duration |
|
| X |
- DefinitionAmount after tax of other comprehensive income (loss) attributable to parent entity. Reference 1: http://fasb.org/us-gaap/role/ref/legacyRef
-Topic 810
-SubTopic 10
-Name Accounting Standards Codification
-Section 45
-Paragraph 19
-Publisher FASB
-URI https://asc.fasb.org//1943274/2147481231/810-10-45-19
Reference 2: http://fasb.org/us-gaap/role/ref/legacyRef
-Name Accounting Standards Codification
-Section 45
-Paragraph 20
-SubTopic 10
-Topic 810
-Publisher FASB
-URI https://asc.fasb.org//1943274/2147481231/810-10-45-20
Reference 3: http://fasb.org/us-gaap/role/ref/legacyRef
-Name Accounting Standards Codification
-Section 50
-Paragraph 1A
-Subparagraph (c)(3)
-SubTopic 10
-Topic 810
-Publisher FASB
-URI https://asc.fasb.org//1943274/2147481203/810-10-50-1A
Reference 4: http://www.xbrl.org/2003/role/disclosureRef
-Topic 220
-SubTopic 10
-Name Accounting Standards Codification
-Section 45
-Paragraph 1B
-Subparagraph (b)
-Publisher FASB
-URI https://asc.fasb.org//1943274/2147482790/220-10-45-1B
Reference 5: http://www.xbrl.org/2003/role/disclosureRef
-Topic 220
-SubTopic 10
-Name Accounting Standards Codification
-Section 45
-Paragraph 1A
-Subparagraph (b)
-Publisher FASB
-URI https://asc.fasb.org//1943274/2147482790/220-10-45-1A
| Name: |
us-gaap_OtherComprehensiveIncomeLossNetOfTaxPortionAttributableToParent |
| Namespace Prefix: |
us-gaap_ |
| Data Type: |
xbrli:monetaryItemType |
| Balance Type: |
credit |
| Period Type: |
duration |
|
| X |
- References
+ Details
| Name: |
us-gaap_OtherComprehensiveIncomeLossNetOfTaxPortionAttributableToParentAbstract |
| Namespace Prefix: |
us-gaap_ |
| Data Type: |
xbrli:stringItemType |
| Balance Type: |
na |
| Period Type: |
duration |
|
| X |
- References
+ Details
| Name: |
us-gaap_StatementOfIncomeAndComprehensiveIncomeAbstract |
| Namespace Prefix: |
us-gaap_ |
| Data Type: |
xbrli:stringItemType |
| Balance Type: |
na |
| Period Type: |
duration |
|
v3.23.3
CONSOLIDATED STATEMENTS OF CASH FLOWS (UNAUDITED) - USD ($)
$ in Millions |
9 Months Ended |
Sep. 30, 2023 |
Oct. 01, 2022 |
| Cash Flows From Operating Activities: |
|
|
| Net income |
$ 128
|
$ 244
|
| Adjustments to reconcile net income to net cash in operating activities: |
|
|
| Depreciation and amortization |
71
|
69
|
| Restructuring and impairment expenses |
42
|
0
|
| Stock-based compensation expense |
36
|
36
|
| Other, net |
2
|
8
|
| Changes in assets and liabilities, net of acquired companies: |
|
|
| Accounts receivable, net |
(9)
|
(142)
|
| Inventories, net |
(4)
|
(129)
|
| Other current assets |
(5)
|
(38)
|
| Accounts payable |
(14)
|
5
|
| Accrued liabilities |
(114)
|
(25)
|
| Other, net |
44
|
(15)
|
| Net cash provided by operating activities |
177
|
13
|
| Cash Flows From Investing Activities: |
|
|
| Capital expenditures |
(74)
|
(34)
|
| Acquisitions, net of cash acquired |
(16)
|
(660)
|
| Other investing activities, net |
0
|
(13)
|
| Net cash used in investing activities |
(90)
|
(707)
|
| Cash Flows From Financing Activities: |
|
|
| Common stock repurchases |
(28)
|
0
|
| Proceeds from issuance of A&R Term B Facility |
0
|
200
|
| Repayments of long-term debt |
(9)
|
(9)
|
| Other financing activities, net |
(10)
|
(9)
|
| Net cash (used in) provided by financing activities |
(47)
|
182
|
| Effect of foreign exchange rate changes on cash, cash equivalents and restricted cash |
1
|
(12)
|
| Net increase (decrease) in cash, cash equivalents and restricted cash |
41
|
(524)
|
| Cash, cash equivalents and restricted cash at beginning of period |
329
|
779
|
| Cash, cash equivalents and restricted cash at end of period |
370
|
255
|
| Supplemental Cash Flow Information: |
|
|
| Interest paid |
81
|
38
|
| Taxes paid, net of refunds |
104
|
129
|
| Capital expenditures in accounts payable |
$ 19
|
$ 18
|
| X |
- References
+ Details
| Name: |
us-gaap_AdjustmentsToReconcileNetIncomeLossToCashProvidedByUsedInOperatingActivitiesAbstract |
| Namespace Prefix: |
us-gaap_ |
| Data Type: |
xbrli:stringItemType |
| Balance Type: |
na |
| Period Type: |
duration |
|
| X |
- DefinitionFuture cash outflow to pay for purchases of fixed assets that have occurred. Reference 1: http://fasb.org/us-gaap/role/ref/legacyRef
-Name Accounting Standards Codification
-Topic 230
-SubTopic 10
-Section 50
-Paragraph 4
-Publisher FASB
-URI https://asc.fasb.org//1943274/2147482913/230-10-50-4
Reference 2: http://fasb.org/us-gaap/role/ref/legacyRef
-Name Accounting Standards Codification
-Topic 230
-SubTopic 10
-Section 50
-Paragraph 3
-Publisher FASB
-URI https://asc.fasb.org//1943274/2147482913/230-10-50-3
Reference 3: http://fasb.org/us-gaap/role/ref/legacyRef
-Name Accounting Standards Codification
-Topic 230
-SubTopic 10
-Section 50
-Paragraph 5
-Publisher FASB
-URI https://asc.fasb.org//1943274/2147482913/230-10-50-5
| Name: |
us-gaap_CapitalExpendituresIncurredButNotYetPaid |
| Namespace Prefix: |
us-gaap_ |
| Data Type: |
xbrli:monetaryItemType |
| Balance Type: |
credit |
| Period Type: |
duration |
|
| X |
- DefinitionAmount of cash and cash equivalents, and cash and cash equivalents restricted to withdrawal or usage. Excludes amount for disposal group and discontinued operations. Cash includes, but is not limited to, currency on hand, demand deposits with banks or financial institutions, and other accounts with general characteristics of demand deposits. Cash equivalents include, but are not limited to, short-term, highly liquid investments that are both readily convertible to known amounts of cash and so near their maturity that they present insignificant risk of changes in value because of changes in interest rates. Reference 1: http://www.xbrl.org/2003/role/disclosureRef
-Topic 230
-SubTopic 10
-Name Accounting Standards Codification
-Section 50
-Paragraph 8
-Publisher FASB
-URI https://asc.fasb.org//1943274/2147482913/230-10-50-8
Reference 2: http://fasb.org/us-gaap/role/ref/legacyRef
-Topic 230
-SubTopic 10
-Name Accounting Standards Codification
-Section 45
-Paragraph 24
-Publisher FASB
-URI https://asc.fasb.org//1943274/2147482740/230-10-45-24
Reference 3: http://fasb.org/us-gaap/role/ref/legacyRef
-Name Accounting Standards Codification
-Topic 230
-SubTopic 10
-Section 45
-Paragraph 4
-Publisher FASB
-URI https://asc.fasb.org//1943274/2147482740/230-10-45-4
| Name: |
us-gaap_CashCashEquivalentsRestrictedCashAndRestrictedCashEquivalents |
| Namespace Prefix: |
us-gaap_ |
| Data Type: |
xbrli:monetaryItemType |
| Balance Type: |
debit |
| Period Type: |
instant |
|
| X |
- DefinitionAmount of increase (decrease) in cash, cash equivalents, and cash and cash equivalents restricted to withdrawal or usage; including effect from exchange rate change. Cash includes, but is not limited to, currency on hand, demand deposits with banks or financial institutions, and other accounts with general characteristics of demand deposits. Cash equivalents include, but are not limited to, short-term, highly liquid investments that are both readily convertible to known amounts of cash and so near their maturity that they present insignificant risk of changes in value because of changes in interest rates. Reference 1: http://fasb.org/us-gaap/role/ref/legacyRef
-Topic 230
-SubTopic 10
-Name Accounting Standards Codification
-Section 45
-Paragraph 24
-Publisher FASB
-URI https://asc.fasb.org//1943274/2147482740/230-10-45-24
Reference 2: http://fasb.org/us-gaap/role/ref/legacyRef
-Name Accounting Standards Codification
-Section 45
-Paragraph 1
-SubTopic 230
-Topic 830
-Publisher FASB
-URI https://asc.fasb.org//1943274/2147481877/830-230-45-1
| Name: |
us-gaap_CashCashEquivalentsRestrictedCashAndRestrictedCashEquivalentsPeriodIncreaseDecreaseIncludingExchangeRateEffect |
| Namespace Prefix: |
us-gaap_ |
| Data Type: |
xbrli:monetaryItemType |
| Balance Type: |
debit |
| Period Type: |
duration |
|
| X |
- DefinitionThe current period expense charged against earnings on long-lived, physical assets not used in production, and which are not intended for resale, to allocate or recognize the cost of such assets over their useful lives; or to record the reduction in book value of an intangible asset over the benefit period of such asset; or to reflect consumption during the period of an asset that is not used in production. Reference 1: http://fasb.org/us-gaap/role/ref/legacyRef
-Name Accounting Standards Codification
-Section 45
-Paragraph 28
-Subparagraph (b)
-SubTopic 10
-Topic 230
-Publisher FASB
-URI https://asc.fasb.org//1943274/2147482740/230-10-45-28
Reference 2: http://fasb.org/us-gaap/role/ref/legacyRef
-Name Accounting Standards Codification
-Topic 360
-SubTopic 10
-Section 50
-Paragraph 1
-Subparagraph (a)
-Publisher FASB
-URI https://asc.fasb.org//1943274/2147482099/360-10-50-1
| Name: |
us-gaap_DepreciationAndAmortization |
| Namespace Prefix: |
us-gaap_ |
| Data Type: |
xbrli:monetaryItemType |
| Balance Type: |
debit |
| Period Type: |
duration |
|
| X |
- DefinitionAmount of increase (decrease) from effect of exchange rate changes on cash and cash equivalents, and cash and cash equivalents restricted to withdrawal or usage; held in foreign currencies; including, but not limited to, disposal group and discontinued operations. Cash includes, but is not limited to, currency on hand, demand deposits with banks or financial institutions, and other accounts with general characteristics of demand deposits. Cash equivalents include, but are not limited to, short-term, highly liquid investments that are both readily convertible to known amounts of cash and so near their maturity that they present insignificant risk of changes in value because of changes in interest rates. Reference 1: http://www.xbrl.org/2009/role/commonPracticeRef
-Topic 830
-SubTopic 230
-Name Accounting Standards Codification
-Section 45
-Paragraph 1
-Publisher FASB
-URI https://asc.fasb.org//1943274/2147481877/830-230-45-1
| Name: |
us-gaap_EffectOfExchangeRateOnCashCashEquivalentsRestrictedCashAndRestrictedCashEquivalentsIncludingDisposalGroupAndDiscontinuedOperations |
| Namespace Prefix: |
us-gaap_ |
| Data Type: |
xbrli:monetaryItemType |
| Balance Type: |
debit |
| Period Type: |
duration |
|
| X |
- DefinitionThe increase (decrease) during the reporting period in the aggregate amount of liabilities incurred (and for which invoices have typically been received) and payable to vendors for goods and services received that are used in an entity's business. Reference 1: http://fasb.org/us-gaap/role/ref/legacyRef
-Name Accounting Standards Codification
-Section 45
-Paragraph 28
-Subparagraph (a)
-SubTopic 10
-Topic 230
-Publisher FASB
-URI https://asc.fasb.org//1943274/2147482740/230-10-45-28
| Name: |
us-gaap_IncreaseDecreaseInAccountsPayable |
| Namespace Prefix: |
us-gaap_ |
| Data Type: |
xbrli:monetaryItemType |
| Balance Type: |
debit |
| Period Type: |
duration |
|
| X |
- DefinitionThe increase (decrease) during the reporting period in the aggregate amount of expenses incurred but not yet paid. Reference 1: http://fasb.org/us-gaap/role/ref/legacyRef
-Name Accounting Standards Codification
-Section 45
-Paragraph 28
-Subparagraph (a)
-SubTopic 10
-Topic 230
-Publisher FASB
-URI https://asc.fasb.org//1943274/2147482740/230-10-45-28
| Name: |
us-gaap_IncreaseDecreaseInAccruedLiabilities |
| Namespace Prefix: |
us-gaap_ |
| Data Type: |
xbrli:monetaryItemType |
| Balance Type: |
debit |
| Period Type: |
duration |
|
| X |
- DefinitionThe increase (decrease) during the reporting period in the aggregate value of all inventory held by the reporting entity, associated with underlying transactions that are classified as operating activities. Reference 1: http://fasb.org/us-gaap/role/ref/legacyRef
-Name Accounting Standards Codification
-Section 45
-Paragraph 28
-Subparagraph (a)
-SubTopic 10
-Topic 230
-Publisher FASB
-URI https://asc.fasb.org//1943274/2147482740/230-10-45-28
| Name: |
us-gaap_IncreaseDecreaseInInventories |
| Namespace Prefix: |
us-gaap_ |
| Data Type: |
xbrli:monetaryItemType |
| Balance Type: |
credit |
| Period Type: |
duration |
|
| X |
- References
+ Details
| Name: |
us-gaap_IncreaseDecreaseInOperatingCapitalAbstract |
| Namespace Prefix: |
us-gaap_ |
| Data Type: |
xbrli:stringItemType |
| Balance Type: |
na |
| Period Type: |
duration |
|
| X |
- DefinitionAmount of increase (decrease) in current assets classified as other. Reference 1: http://www.xbrl.org/2009/role/commonPracticeRef
-Topic 230
-SubTopic 10
-Name Accounting Standards Codification
-Section 45
-Paragraph 28
-Subparagraph (a)
-Publisher FASB
-URI https://asc.fasb.org//1943274/2147482740/230-10-45-28
| Name: |
us-gaap_IncreaseDecreaseInOtherCurrentAssets |
| Namespace Prefix: |
us-gaap_ |
| Data Type: |
xbrli:monetaryItemType |
| Balance Type: |
credit |
| Period Type: |
duration |
|
| X |
- DefinitionAmount of increase (decrease) in operating liabilities classified as other. Reference 1: http://fasb.org/us-gaap/role/ref/legacyRef
-Name Accounting Standards Codification
-Section 45
-Paragraph 28
-Subparagraph (a)
-SubTopic 10
-Topic 230
-Publisher FASB
-URI https://asc.fasb.org//1943274/2147482740/230-10-45-28
| Name: |
us-gaap_IncreaseDecreaseInOtherOperatingLiabilities |
| Namespace Prefix: |
us-gaap_ |
| Data Type: |
xbrli:monetaryItemType |
| Balance Type: |
debit |
| Period Type: |
duration |
|
| X |
- DefinitionThe increase (decrease) during the reporting period in the total amount due within one year (or one operating cycle) from all parties, associated with underlying transactions that are classified as operating activities. Reference 1: http://fasb.org/us-gaap/role/ref/legacyRef
-Name Accounting Standards Codification
-Section 45
-Paragraph 28
-Subparagraph (a)
-SubTopic 10
-Topic 230
-Publisher FASB
-URI https://asc.fasb.org//1943274/2147482740/230-10-45-28
| Name: |
us-gaap_IncreaseDecreaseInReceivables |
| Namespace Prefix: |
us-gaap_ |
| Data Type: |
xbrli:monetaryItemType |
| Balance Type: |
credit |
| Period Type: |
duration |
|
| X |
- DefinitionAmount of cash paid for interest, excluding capitalized interest, classified as operating activity. Includes, but is not limited to, payment to settle zero-coupon bond for accreted interest of debt discount and debt instrument with insignificant coupon interest rate in relation to effective interest rate of borrowing attributable to accreted interest of debt discount. Reference 1: http://www.xbrl.org/2003/role/disclosureRef
-Topic 230
-SubTopic 10
-Name Accounting Standards Codification
-Section 45
-Paragraph 17
-Subparagraph (d)
-Publisher FASB
-URI https://asc.fasb.org//1943274/2147482740/230-10-45-17
Reference 2: http://www.xbrl.org/2003/role/disclosureRef
-Topic 230
-SubTopic 10
-Name Accounting Standards Codification
-Section 45
-Paragraph 25
-Subparagraph (e)
-Publisher FASB
-URI https://asc.fasb.org//1943274/2147482740/230-10-45-25
Reference 3: http://www.xbrl.org/2003/role/disclosureRef
-Topic 230
-SubTopic 10
-Name Accounting Standards Codification
-Section 50
-Paragraph 2
-Publisher FASB
-URI https://asc.fasb.org//1943274/2147482913/230-10-50-2
| Name: |
us-gaap_InterestPaidNet |
| Namespace Prefix: |
us-gaap_ |
| Data Type: |
xbrli:monetaryItemType |
| Balance Type: |
credit |
| Period Type: |
duration |
|
| X |
- DefinitionAmount of cash inflow (outflow) from financing activities, including discontinued operations. Financing activity cash flows include obtaining resources from owners and providing them with a return on, and a return of, their investment; borrowing money and repaying amounts borrowed, or settling the obligation; and obtaining and paying for other resources obtained from creditors on long-term credit. Reference 1: http://www.xbrl.org/2003/role/disclosureRef
-Topic 230
-SubTopic 10
-Name Accounting Standards Codification
-Section 45
-Paragraph 24
-Publisher FASB
-URI https://asc.fasb.org//1943274/2147482740/230-10-45-24
| Name: |
us-gaap_NetCashProvidedByUsedInFinancingActivities |
| Namespace Prefix: |
us-gaap_ |
| Data Type: |
xbrli:monetaryItemType |
| Balance Type: |
debit |
| Period Type: |
duration |
|
| X |
- References
+ Details
| Name: |
us-gaap_NetCashProvidedByUsedInFinancingActivitiesAbstract |
| Namespace Prefix: |
us-gaap_ |
| Data Type: |
xbrli:stringItemType |
| Balance Type: |
na |
| Period Type: |
duration |
|
| X |
- DefinitionAmount of cash inflow (outflow) from investing activities, including discontinued operations. Investing activity cash flows include making and collecting loans and acquiring and disposing of debt or equity instruments and property, plant, and equipment and other productive assets. Reference 1: http://www.xbrl.org/2003/role/disclosureRef
-Topic 230
-SubTopic 10
-Name Accounting Standards Codification
-Section 45
-Paragraph 24
-Publisher FASB
-URI https://asc.fasb.org//1943274/2147482740/230-10-45-24
| Name: |
us-gaap_NetCashProvidedByUsedInInvestingActivities |
| Namespace Prefix: |
us-gaap_ |
| Data Type: |
xbrli:monetaryItemType |
| Balance Type: |
debit |
| Period Type: |
duration |
|
| X |
- References
+ Details
| Name: |
us-gaap_NetCashProvidedByUsedInInvestingActivitiesAbstract |
| Namespace Prefix: |
us-gaap_ |
| Data Type: |
xbrli:stringItemType |
| Balance Type: |
na |
| Period Type: |
duration |
|
| X |
- DefinitionAmount of cash inflow (outflow) from operating activities, including discontinued operations. Operating activity cash flows include transactions, adjustments, and changes in value not defined as investing or financing activities. Reference 1: http://fasb.org/us-gaap/role/ref/legacyRef
-Topic 230
-SubTopic 10
-Name Accounting Standards Codification
-Section 45
-Paragraph 28
-Publisher FASB
-URI https://asc.fasb.org//1943274/2147482740/230-10-45-28
Reference 2: http://fasb.org/us-gaap/role/ref/legacyRef
-Topic 230
-SubTopic 10
-Name Accounting Standards Codification
-Section 45
-Paragraph 24
-Publisher FASB
-URI https://asc.fasb.org//1943274/2147482740/230-10-45-24
Reference 3: http://fasb.org/us-gaap/role/ref/legacyRef
-Topic 230
-SubTopic 10
-Name Accounting Standards Codification
-Section 45
-Paragraph 25
-Publisher FASB
-URI https://asc.fasb.org//1943274/2147482740/230-10-45-25
| Name: |
us-gaap_NetCashProvidedByUsedInOperatingActivities |
| Namespace Prefix: |
us-gaap_ |
| Data Type: |
xbrli:monetaryItemType |
| Balance Type: |
na |
| Period Type: |
duration |
|
| X |
- References
+ Details
| Name: |
us-gaap_NetCashProvidedByUsedInOperatingActivitiesAbstract |
| Namespace Prefix: |
us-gaap_ |
| Data Type: |
xbrli:stringItemType |
| Balance Type: |
na |
| Period Type: |
duration |
|
| X |
- DefinitionThe portion of profit or loss for the period, net of income taxes, which is attributable to the parent. Reference 1: http://www.xbrl.org/2003/role/disclosureRef
-Topic 235
-SubTopic 10
-Name Accounting Standards Codification
-Section S99
-Paragraph 1
-Subparagraph (SX 210.4-08(g)(1)(ii))
-Publisher FASB
-URI https://asc.fasb.org//1943274/2147480678/235-10-S99-1
Reference 2: http://www.xbrl.org/2003/role/disclosureRef
-Topic 323
-SubTopic 10
-Name Accounting Standards Codification
-Section 50
-Paragraph 3
-Subparagraph (c)
-Publisher FASB
-URI https://asc.fasb.org//1943274/2147481687/323-10-50-3
Reference 3: http://www.xbrl.org/2003/role/disclosureRef
-Topic 825
-SubTopic 10
-Name Accounting Standards Codification
-Section 50
-Paragraph 28
-Subparagraph (f)
-Publisher FASB
-URI https://asc.fasb.org//1943274/2147482907/825-10-50-28
Reference 4: http://www.xbrl.org/2003/role/disclosureRef
-Topic 220
-SubTopic 10
-Name Accounting Standards Codification
-Section 50
-Paragraph 6
-Publisher FASB
-URI https://asc.fasb.org//1943274/2147482765/220-10-50-6
Reference 5: http://www.xbrl.org/2003/role/disclosureRef
-Topic 250
-SubTopic 10
-Name Accounting Standards Codification
-Section 50
-Paragraph 3
-Publisher FASB
-URI https://asc.fasb.org//1943274/2147483443/250-10-50-3
Reference 6: http://www.xbrl.org/2003/role/disclosureRef
-Topic 250
-SubTopic 10
-Name Accounting Standards Codification
-Section 50
-Paragraph 1
-Subparagraph (b)(2)
-Publisher FASB
-URI https://asc.fasb.org//1943274/2147483443/250-10-50-1
Reference 7: http://www.xbrl.org/2003/role/disclosureRef
-Topic 815
-SubTopic 40
-Name Accounting Standards Codification
-Section 65
-Paragraph 1
-Subparagraph (f)
-Publisher FASB
-URI https://asc.fasb.org//1943274/2147480175/815-40-65-1
Reference 8: http://www.xbrl.org/2003/role/disclosureRef
-Topic 250
-SubTopic 10
-Name Accounting Standards Codification
-Section 50
-Paragraph 8
-Publisher FASB
-URI https://asc.fasb.org//1943274/2147483443/250-10-50-8
Reference 9: http://www.xbrl.org/2003/role/disclosureRef
-Topic 250
-SubTopic 10
-Name Accounting Standards Codification
-Section 50
-Paragraph 9
-Publisher FASB
-URI https://asc.fasb.org//1943274/2147483443/250-10-50-9
Reference 10: http://www.xbrl.org/2003/role/disclosureRef
-Topic 250
-SubTopic 10
-Name Accounting Standards Codification
-Section 50
-Paragraph 11
-Subparagraph (a)
-Publisher FASB
-URI https://asc.fasb.org//1943274/2147483443/250-10-50-11
Reference 11: http://www.xbrl.org/2003/role/disclosureRef
-Topic 250
-SubTopic 10
-Name Accounting Standards Codification
-Section 50
-Paragraph 11
-Subparagraph (b)
-Publisher FASB
-URI https://asc.fasb.org//1943274/2147483443/250-10-50-11
Reference 12: http://www.xbrl.org/2003/role/disclosureRef
-Topic 250
-SubTopic 10
-Name Accounting Standards Codification
-Section 50
-Paragraph 4
-Publisher FASB
-URI https://asc.fasb.org//1943274/2147483443/250-10-50-4
Reference 13: http://www.xbrl.org/2003/role/exampleRef
-Topic 946
-SubTopic 830
-Name Accounting Standards Codification
-Section 55
-Paragraph 10
-Publisher FASB
-URI https://asc.fasb.org//1943274/2147480167/946-830-55-10
Reference 14: http://www.xbrl.org/2003/role/disclosureRef
-Topic 946
-SubTopic 220
-Name Accounting Standards Codification
-Section 45
-Paragraph 7
-Publisher FASB
-URI https://asc.fasb.org//1943274/2147483581/946-220-45-7
Reference 15: http://www.xbrl.org/2003/role/disclosureRef
-Topic 944
-SubTopic 220
-Name Accounting Standards Codification
-Section S99
-Paragraph 1
-Subparagraph (SX 210.7-04(18))
-Publisher FASB
-URI https://asc.fasb.org//1943274/2147483586/944-220-S99-1
Reference 16: http://www.xbrl.org/2003/role/disclosureRef
-Topic 280
-SubTopic 10
-Name Accounting Standards Codification
-Section 50
-Paragraph 22
-Publisher FASB
-URI https://asc.fasb.org//1943274/2147482810/280-10-50-22
Reference 17: http://www.xbrl.org/2003/role/disclosureRef
-Topic 946
-SubTopic 220
-Name Accounting Standards Codification
-Section S99
-Paragraph 1
-Subparagraph (SX 210.6-07(9))
-Publisher FASB
-URI https://asc.fasb.org//1943274/2147483575/946-220-S99-1
Reference 18: http://www.xbrl.org/2003/role/disclosureRef
-Topic 946
-SubTopic 220
-Name Accounting Standards Codification
-Section S99
-Paragraph 3
-Subparagraph (SX 210.6-09(1)(d))
-Publisher FASB
-URI https://asc.fasb.org//1943274/2147483575/946-220-S99-3
Reference 19: http://www.xbrl.org/2003/role/disclosureRef
-Topic 470
-SubTopic 10
-Name Accounting Standards Codification
-Section S99
-Paragraph 1A
-Subparagraph (SX 210.13-01(a)(4)(i))
-Publisher FASB
-URI https://asc.fasb.org//1943274/2147480097/470-10-S99-1A
Reference 20: http://www.xbrl.org/2009/role/commonPracticeRef
-Topic 470
-SubTopic 10
-Name Accounting Standards Codification
-Section S99
-Paragraph 1A
-Subparagraph (SX 210.13-01(a)(4)(ii))
-Publisher FASB
-URI https://asc.fasb.org//1943274/2147480097/470-10-S99-1A
Reference 21: http://www.xbrl.org/2003/role/disclosureRef
-Topic 470
-SubTopic 10
-Name Accounting Standards Codification
-Section S99
-Paragraph 1A
-Subparagraph (SX 210.13-01(a)(4)(iii)(A))
-Publisher FASB
-URI https://asc.fasb.org//1943274/2147480097/470-10-S99-1A
Reference 22: http://www.xbrl.org/2003/role/disclosureRef
-Topic 470
-SubTopic 10
-Name Accounting Standards Codification
-Section S99
-Paragraph 1A
-Subparagraph (SX 210.13-01(a)(4)(iv))
-Publisher FASB
-URI https://asc.fasb.org//1943274/2147480097/470-10-S99-1A
Reference 23: http://www.xbrl.org/2003/role/disclosureRef
-Topic 470
-SubTopic 10
-Name Accounting Standards Codification
-Section S99
-Paragraph 1A
-Subparagraph (SX 210.13-01(a)(5))
-Publisher FASB
-URI https://asc.fasb.org//1943274/2147480097/470-10-S99-1A
Reference 24: http://www.xbrl.org/2003/role/disclosureRef
-Topic 470
-SubTopic 10
-Name Accounting Standards Codification
-Section S99
-Paragraph 1B
-Subparagraph (SX 210.13-02(a)(4)(i))
-Publisher FASB
-URI https://asc.fasb.org//1943274/2147480097/470-10-S99-1B
Reference 25: http://www.xbrl.org/2003/role/disclosureRef
-Topic 470
-SubTopic 10
-Name Accounting Standards Codification
-Section S99
-Paragraph 1B
-Subparagraph (SX 210.13-02(a)(4)(iii)(A))
-Publisher FASB
-URI https://asc.fasb.org//1943274/2147480097/470-10-S99-1B
Reference 26: http://www.xbrl.org/2003/role/disclosureRef
-Topic 470
-SubTopic 10
-Name Accounting Standards Codification
-Section S99
-Paragraph 1B
-Subparagraph (SX 210.13-02(a)(4)(iii)(B))
-Publisher FASB
-URI https://asc.fasb.org//1943274/2147480097/470-10-S99-1B
Reference 27: http://www.xbrl.org/2003/role/disclosureRef
-Topic 470
-SubTopic 10
-Name Accounting Standards Codification
-Section S99
-Paragraph 1B
-Subparagraph (SX 210.13-02(a)(4)(iv))
-Publisher FASB
-URI https://asc.fasb.org//1943274/2147480097/470-10-S99-1B
Reference 28: http://www.xbrl.org/2003/role/disclosureRef
-Topic 470
-SubTopic 10
-Name Accounting Standards Codification
-Section S99
-Paragraph 1B
-Subparagraph (SX 210.13-02(a)(5))
-Publisher FASB
-URI https://asc.fasb.org//1943274/2147480097/470-10-S99-1B
Reference 29: http://www.xbrl.org/2003/role/disclosureRef
-Topic 280
-SubTopic 10
-Name Accounting Standards Codification
-Section 50
-Paragraph 30
-Subparagraph (b)
-Publisher FASB
-URI https://asc.fasb.org//1943274/2147482810/280-10-50-30
Reference 30: http://www.xbrl.org/2003/role/disclosureRef
-Topic 280
-SubTopic 10
-Name Accounting Standards Codification
-Section 50
-Paragraph 32
-Subparagraph (f)
-Publisher FASB
-URI https://asc.fasb.org//1943274/2147482810/280-10-50-32
Reference 31: http://www.xbrl.org/2003/role/disclosureRef
-Topic 260
-SubTopic 10
-Name Accounting Standards Codification
-Section 45
-Paragraph 60B
-Subparagraph (a)
-Publisher FASB
-URI https://asc.fasb.org//1943274/2147482689/260-10-45-60B
Reference 32: http://www.xbrl.org/2003/role/exampleRef
-Topic 280
-SubTopic 10
-Name Accounting Standards Codification
-Section 50
-Paragraph 31
-Publisher FASB
-URI https://asc.fasb.org//1943274/2147482810/280-10-50-31
Reference 33: http://www.xbrl.org/2003/role/disclosureRef
-Topic 280
-SubTopic 10
-Name Accounting Standards Codification
-Section 50
-Paragraph 32
-Subparagraph (c)
-Publisher FASB
-URI https://asc.fasb.org//1943274/2147482810/280-10-50-32
Reference 34: http://www.xbrl.org/2003/role/disclosureRef
-Topic 205
-SubTopic 20
-Name Accounting Standards Codification
-Section 50
-Paragraph 7
-Publisher FASB
-URI https://asc.fasb.org//1943274/2147483499/205-20-50-7
Reference 35: http://fasb.org/us-gaap/role/ref/legacyRef
-Topic 230
-SubTopic 10
-Name Accounting Standards Codification
-Section 45
-Paragraph 28
-Publisher FASB
-URI https://asc.fasb.org//1943274/2147482740/230-10-45-28
Reference 36: http://www.xbrl.org/2003/role/disclosureRef
-Topic 220
-SubTopic 10
-Name Accounting Standards Codification
-Section 45
-Paragraph 1A
-Subparagraph (a)
-Publisher FASB
-URI https://asc.fasb.org//1943274/2147482790/220-10-45-1A
Reference 37: http://www.xbrl.org/2003/role/disclosureRef
-Topic 220
-SubTopic 10
-Name Accounting Standards Codification
-Section 45
-Paragraph 1B
-Subparagraph (a)
-Publisher FASB
-URI https://asc.fasb.org//1943274/2147482790/220-10-45-1B
Reference 38: http://fasb.org/us-gaap/role/ref/legacyRef
-Topic 220
-SubTopic 10
-Name Accounting Standards Codification
-Section S99
-Paragraph 2
-Subparagraph (SX 210.5-03(20))
-Publisher FASB
-URI https://asc.fasb.org//1943274/2147483621/220-10-S99-2
Reference 39: http://fasb.org/us-gaap/role/ref/legacyRef
-Topic 942
-SubTopic 220
-Name Accounting Standards Codification
-Section S99
-Paragraph 1
-Subparagraph (SX 210.9-04(22))
-Publisher FASB
-URI https://asc.fasb.org//1943274/2147483589/942-220-S99-1
| Name: |
us-gaap_NetIncomeLoss |
| Namespace Prefix: |
us-gaap_ |
| Data Type: |
xbrli:monetaryItemType |
| Balance Type: |
credit |
| Period Type: |
duration |
|
| X |
- DefinitionAmount of income (expense) included in net income that results in no cash inflow (outflow), classified as other. Reference 1: http://fasb.org/us-gaap/role/ref/legacyRef
-Topic 230
-SubTopic 10
-Name Accounting Standards Codification
-Section 45
-Paragraph 28
-Publisher FASB
-URI https://asc.fasb.org//1943274/2147482740/230-10-45-28
| Name: |
us-gaap_OtherNoncashIncomeExpense |
| Namespace Prefix: |
us-gaap_ |
| Data Type: |
xbrli:monetaryItemType |
| Balance Type: |
credit |
| Period Type: |
duration |
|
| X |
- DefinitionAmount of cash (inflow) outflow from investing activities classified as other. Reference 1: http://www.xbrl.org/2009/role/commonPracticeRef
-Topic 230
-SubTopic 10
-Name Accounting Standards Codification
-Section 45
-Paragraph 13
-Publisher FASB
-URI https://asc.fasb.org//1943274/2147482740/230-10-45-13
Reference 2: http://www.xbrl.org/2009/role/commonPracticeRef
-Name Accounting Standards Codification
-Section 45
-Paragraph 12
-SubTopic 10
-Topic 230
-Publisher FASB
-URI https://asc.fasb.org//1943274/2147482740/230-10-45-12
| Name: |
us-gaap_PaymentsForProceedsFromOtherInvestingActivities |
| Namespace Prefix: |
us-gaap_ |
| Data Type: |
xbrli:monetaryItemType |
| Balance Type: |
credit |
| Period Type: |
duration |
|
| X |
- DefinitionThe cash outflow to reacquire common stock during the period. Reference 1: http://fasb.org/us-gaap/role/ref/legacyRef
-Name Accounting Standards Codification
-Topic 230
-SubTopic 10
-Section 45
-Paragraph 15
-Subparagraph (a)
-Publisher FASB
-URI https://asc.fasb.org//1943274/2147482740/230-10-45-15
| Name: |
us-gaap_PaymentsForRepurchaseOfCommonStock |
| Namespace Prefix: |
us-gaap_ |
| Data Type: |
xbrli:monetaryItemType |
| Balance Type: |
credit |
| Period Type: |
duration |
|
| X |
- DefinitionThe cash outflow associated with the acquisition of a business, net of the cash acquired from the purchase. Reference 1: http://fasb.org/us-gaap/role/ref/legacyRef
-Name Accounting Standards Codification
-Topic 230
-SubTopic 10
-Section 45
-Paragraph 13
-Subparagraph (b)
-Publisher FASB
-URI https://asc.fasb.org//1943274/2147482740/230-10-45-13
| Name: |
us-gaap_PaymentsToAcquireBusinessesNetOfCashAcquired |
| Namespace Prefix: |
us-gaap_ |
| Data Type: |
xbrli:monetaryItemType |
| Balance Type: |
credit |
| Period Type: |
duration |
|
| X |
- DefinitionThe cash outflow associated with the acquisition of long-lived, physical assets that are used in the normal conduct of business to produce goods and services and not intended for resale; includes cash outflows to pay for construction of self-constructed assets. Reference 1: http://fasb.org/us-gaap/role/ref/legacyRef
-Topic 230
-SubTopic 10
-Name Accounting Standards Codification
-Section 45
-Paragraph 13
-Subparagraph (c)
-Publisher FASB
-URI https://asc.fasb.org//1943274/2147482740/230-10-45-13
| Name: |
us-gaap_PaymentsToAcquirePropertyPlantAndEquipment |
| Namespace Prefix: |
us-gaap_ |
| Data Type: |
xbrli:monetaryItemType |
| Balance Type: |
credit |
| Period Type: |
duration |
|
| X |
- DefinitionThe cash inflow from a debt initially having maturity due after one year or beyond the operating cycle, if longer. Reference 1: http://www.xbrl.org/2003/role/disclosureRef
-Topic 946
-SubTopic 10
-Name Accounting Standards Codification
-Section S99
-Paragraph 3
-Subparagraph (SX 210.6-03(i)(1))
-Publisher FASB
-URI https://asc.fasb.org//1943274/2147479886/946-10-S99-3
Reference 2: http://fasb.org/us-gaap/role/ref/legacyRef
-Name Accounting Standards Codification
-Topic 230
-SubTopic 10
-Section 45
-Paragraph 14
-Subparagraph (b)
-Publisher FASB
-URI https://asc.fasb.org//1943274/2147482740/230-10-45-14
| Name: |
us-gaap_ProceedsFromIssuanceOfLongTermDebt |
| Namespace Prefix: |
us-gaap_ |
| Data Type: |
xbrli:monetaryItemType |
| Balance Type: |
debit |
| Period Type: |
duration |
|
| X |
- DefinitionAmount of cash inflow (outflow) from financing activities classified as other. Reference 1: http://www.xbrl.org/2009/role/commonPracticeRef
-Topic 230
-SubTopic 10
-Name Accounting Standards Codification
-Section 45
-Paragraph 14
-Publisher FASB
-URI https://asc.fasb.org//1943274/2147482740/230-10-45-14
Reference 2: http://www.xbrl.org/2009/role/commonPracticeRef
-Name Accounting Standards Codification
-Section 45
-Paragraph 15
-SubTopic 10
-Topic 230
-Publisher FASB
-URI https://asc.fasb.org//1943274/2147482740/230-10-45-15
| Name: |
us-gaap_ProceedsFromPaymentsForOtherFinancingActivities |
| Namespace Prefix: |
us-gaap_ |
| Data Type: |
xbrli:monetaryItemType |
| Balance Type: |
debit |
| Period Type: |
duration |
|
| X |
- DefinitionThe cash outflow for debt initially having maturity due after one year or beyond the normal operating cycle, if longer. Reference 1: http://www.xbrl.org/2003/role/disclosureRef
-Topic 946
-SubTopic 10
-Name Accounting Standards Codification
-Section S99
-Paragraph 3
-Subparagraph (SX 210.6-03(i)(2))
-Publisher FASB
-URI https://asc.fasb.org//1943274/2147479886/946-10-S99-3
Reference 2: http://fasb.org/us-gaap/role/ref/legacyRef
-Name Accounting Standards Codification
-Topic 230
-SubTopic 10
-Section 45
-Paragraph 15
-Subparagraph (b)
-Publisher FASB
-URI https://asc.fasb.org//1943274/2147482740/230-10-45-15
| Name: |
us-gaap_RepaymentsOfLongTermDebt |
| Namespace Prefix: |
us-gaap_ |
| Data Type: |
xbrli:monetaryItemType |
| Balance Type: |
credit |
| Period Type: |
duration |
|
| X |
- DefinitionAmount, after cash payment, of expenses associated with exit or disposal activities pursuant to an authorized plan and expenses resulting from the write-down of assets. Excludes expenses related to a business combination, a discontinued operation or an asset retirement obligation. Reference 1: http://fasb.org/us-gaap/role/ref/legacyRef
-Name Accounting Standards Codification
-Section 45
-Paragraph 28
-Subparagraph (b)
-SubTopic 10
-Topic 230
-Publisher FASB
-URI https://asc.fasb.org//1943274/2147482740/230-10-45-28
| Name: |
us-gaap_RestructuringCostsAndAssetImpairmentCharges |
| Namespace Prefix: |
us-gaap_ |
| Data Type: |
xbrli:monetaryItemType |
| Balance Type: |
debit |
| Period Type: |
duration |
|
| X |
- DefinitionAmount of noncash expense for share-based payment arrangement. Reference 1: http://fasb.org/us-gaap/role/ref/legacyRef
-Name Accounting Standards Codification
-Section 45
-Paragraph 28
-Subparagraph (a)
-SubTopic 10
-Topic 230
-Publisher FASB
-URI https://asc.fasb.org//1943274/2147482740/230-10-45-28
| Name: |
us-gaap_ShareBasedCompensation |
| Namespace Prefix: |
us-gaap_ |
| Data Type: |
xbrli:monetaryItemType |
| Balance Type: |
debit |
| Period Type: |
duration |
|
v3.23.3
CONSOLIDATED STATEMENTS OF STOCKHOLDERS' EQUITY (UNAUDITED) - USD ($)
$ in Millions |
Total |
Common Stock |
Additional Paid-In Capital |
Retained Earnings |
Accumulated Other Comprehensive Loss |
Treasury Stock |
| Beginning of period at Dec. 31, 2021 |
$ 2,252
|
$ 0
|
$ 2,121
|
$ 317
|
$ (165)
|
$ (21)
|
| Shares outstanding, beginning (in shares) at Dec. 31, 2021 |
|
144,808,000
|
|
|
|
|
| Treasury stock, beginning (in shares) at Dec. 31, 2021 |
|
|
|
|
|
1,440,000
|
| Increase (Decrease) in Stockholders' Equity |
|
|
|
|
|
|
| Net income |
244
|
|
|
244
|
|
|
| Other comprehensive loss, net of tax |
(127)
|
|
|
|
(127)
|
|
| Common stock issuance, net of shares withheld for taxes |
(5)
|
|
5
|
|
|
$ (10)
|
| Common stock issuance, net of shares withheld for taxes (in shares) |
|
1,030,000
|
|
|
|
425,000
|
| Stock-based compensation expense |
36
|
|
36
|
|
|
|
| End of period at Oct. 01, 2022 |
2,400
|
$ 0
|
2,162
|
561
|
(292)
|
$ (31)
|
| Shares outstanding, ending (in shares) at Oct. 01, 2022 |
|
145,838,000
|
|
|
|
|
| Treasury stock, ending (in shares) at Oct. 01, 2022 |
|
|
|
|
|
1,865,000
|
| Beginning of period at Jul. 02, 2022 |
2,394
|
$ 0
|
2,147
|
498
|
(220)
|
$ (31)
|
| Shares outstanding, beginning (in shares) at Jul. 02, 2022 |
|
145,684,000
|
|
|
|
|
| Treasury stock, beginning (in shares) at Jul. 02, 2022 |
|
|
|
|
|
1,844,000
|
| Increase (Decrease) in Stockholders' Equity |
|
|
|
|
|
|
| Net income |
63
|
|
|
63
|
|
|
| Other comprehensive loss, net of tax |
(72)
|
|
|
|
(72)
|
|
| Common stock issuance, net of shares withheld for taxes |
2
|
|
2
|
|
|
|
| Common stock issuance, net of shares withheld for taxes (in shares) |
|
154,000
|
|
|
|
21,000
|
| Stock-based compensation expense |
13
|
|
13
|
|
|
|
| End of period at Oct. 01, 2022 |
2,400
|
$ 0
|
2,162
|
561
|
(292)
|
$ (31)
|
| Shares outstanding, ending (in shares) at Oct. 01, 2022 |
|
145,838,000
|
|
|
|
|
| Treasury stock, ending (in shares) at Oct. 01, 2022 |
|
|
|
|
|
1,865,000
|
| Beginning of period at Dec. 31, 2022 |
2,529
|
$ 0
|
2,176
|
600
|
(212)
|
$ (35)
|
| Shares outstanding, beginning (in shares) at Dec. 31, 2022 |
|
146,222,000
|
|
|
|
|
| Treasury stock, beginning (in shares) at Dec. 31, 2022 |
|
|
|
|
|
2,050,000
|
| Increase (Decrease) in Stockholders' Equity |
|
|
|
|
|
|
| Net income |
128
|
|
|
128
|
|
|
| Other comprehensive loss, net of tax |
(9)
|
|
|
|
(9)
|
|
| Common stock issuance, net of shares withheld for taxes |
(9)
|
|
7
|
|
|
$ (16)
|
| Common stock issuance, net of shares withheld for taxes (in shares) |
|
1,711,000
|
|
|
|
923,000
|
| Stock-based compensation expense |
36
|
|
36
|
|
|
|
| Common stock repurchases |
(30)
|
|
|
|
|
$ (30)
|
| Common stock repurchases (shares) |
|
(1,840,000)
|
|
|
|
(1,840,000)
|
| End of period at Sep. 30, 2023 |
2,645
|
$ 0
|
2,219
|
728
|
(221)
|
$ (81)
|
| Shares outstanding, ending (in shares) at Sep. 30, 2023 |
|
146,093,000
|
|
|
|
|
| Treasury stock, ending (in shares) at Sep. 30, 2023 |
|
|
|
|
|
4,813,000
|
| Beginning of period at Jul. 01, 2023 |
2,677
|
$ 0
|
2,204
|
707
|
(184)
|
$ (50)
|
| Shares outstanding, beginning (in shares) at Jul. 01, 2023 |
|
147,649,000
|
|
|
|
|
| Treasury stock, beginning (in shares) at Jul. 01, 2023 |
|
|
|
|
|
2,902,000
|
| Increase (Decrease) in Stockholders' Equity |
|
|
|
|
|
|
| Net income |
21
|
|
|
21
|
|
|
| Other comprehensive loss, net of tax |
(37)
|
|
|
|
(37)
|
|
| Common stock issuance, net of shares withheld for taxes |
3
|
|
4
|
|
|
$ (1)
|
| Common stock issuance, net of shares withheld for taxes (in shares) |
|
284,000
|
|
|
|
71,000
|
| Stock-based compensation expense |
11
|
|
11
|
|
|
|
| Common stock repurchases |
(30)
|
|
|
|
|
$ (30)
|
| Common stock repurchases (shares) |
|
(1,840,000)
|
|
|
|
(1,840,000)
|
| End of period at Sep. 30, 2023 |
$ 2,645
|
$ 0
|
$ 2,219
|
$ 728
|
$ (221)
|
$ (81)
|
| Shares outstanding, ending (in shares) at Sep. 30, 2023 |
|
146,093,000
|
|
|
|
|
| Treasury stock, ending (in shares) at Sep. 30, 2023 |
|
|
|
|
|
4,813,000
|
| X |
- DefinitionStock issued during period shares net of shares with held for employee taxes.
| Name: |
rezi_StockIssuedDuringPeriodSharesNetOfSharesWithheldForEmployeeTaxes |
| Namespace Prefix: |
rezi_ |
| Data Type: |
xbrli:sharesItemType |
| Balance Type: |
na |
| Period Type: |
duration |
|
| X |
- DefinitionStock issued during period value net of shares with held for employee taxes.
| Name: |
rezi_StockIssuedDuringPeriodValueNetOfSharesWithheldForEmployeeTaxes |
| Namespace Prefix: |
rezi_ |
| Data Type: |
xbrli:monetaryItemType |
| Balance Type: |
credit |
| Period Type: |
duration |
|
| X |
- DefinitionAmount of increase to additional paid-in capital (APIC) for recognition of cost for award under share-based payment arrangement. Reference 1: http://www.xbrl.org/2003/role/disclosureRef
-Topic 718
-SubTopic 10
-Name Accounting Standards Codification
-Section 35
-Paragraph 2
-Publisher FASB
-URI https://asc.fasb.org//1943274/2147480483/718-10-35-2
Reference 2: http://fasb.org/us-gaap/role/ref/legacyRef
-Name Accounting Standards Codification
-Topic 718
-SubTopic 20
-Section 55
-Paragraph 13
-Publisher FASB
-URI https://asc.fasb.org//1943274/2147481089/718-20-55-13
Reference 3: http://fasb.org/us-gaap/role/ref/legacyRef
-Name Accounting Standards Codification
-Topic 718
-SubTopic 20
-Section 55
-Paragraph 12
-Publisher FASB
-URI https://asc.fasb.org//1943274/2147481089/718-20-55-12
| Name: |
us-gaap_AdjustmentsToAdditionalPaidInCapitalSharebasedCompensationRequisiteServicePeriodRecognitionValue |
| Namespace Prefix: |
us-gaap_ |
| Data Type: |
xbrli:monetaryItemType |
| Balance Type: |
credit |
| Period Type: |
duration |
|
| X |
- DefinitionA roll forward is a reconciliation of a concept from the beginning of a period to the end of a period.
| Name: |
us-gaap_IncreaseDecreaseInStockholdersEquityRollForward |
| Namespace Prefix: |
us-gaap_ |
| Data Type: |
xbrli:stringItemType |
| Balance Type: |
na |
| Period Type: |
duration |
|
| X |
- DefinitionThe portion of profit or loss for the period, net of income taxes, which is attributable to the parent. Reference 1: http://www.xbrl.org/2003/role/disclosureRef
-Topic 235
-SubTopic 10
-Name Accounting Standards Codification
-Section S99
-Paragraph 1
-Subparagraph (SX 210.4-08(g)(1)(ii))
-Publisher FASB
-URI https://asc.fasb.org//1943274/2147480678/235-10-S99-1
Reference 2: http://www.xbrl.org/2003/role/disclosureRef
-Topic 323
-SubTopic 10
-Name Accounting Standards Codification
-Section 50
-Paragraph 3
-Subparagraph (c)
-Publisher FASB
-URI https://asc.fasb.org//1943274/2147481687/323-10-50-3
Reference 3: http://www.xbrl.org/2003/role/disclosureRef
-Topic 825
-SubTopic 10
-Name Accounting Standards Codification
-Section 50
-Paragraph 28
-Subparagraph (f)
-Publisher FASB
-URI https://asc.fasb.org//1943274/2147482907/825-10-50-28
Reference 4: http://www.xbrl.org/2003/role/disclosureRef
-Topic 220
-SubTopic 10
-Name Accounting Standards Codification
-Section 50
-Paragraph 6
-Publisher FASB
-URI https://asc.fasb.org//1943274/2147482765/220-10-50-6
Reference 5: http://www.xbrl.org/2003/role/disclosureRef
-Topic 250
-SubTopic 10
-Name Accounting Standards Codification
-Section 50
-Paragraph 3
-Publisher FASB
-URI https://asc.fasb.org//1943274/2147483443/250-10-50-3
Reference 6: http://www.xbrl.org/2003/role/disclosureRef
-Topic 250
-SubTopic 10
-Name Accounting Standards Codification
-Section 50
-Paragraph 1
-Subparagraph (b)(2)
-Publisher FASB
-URI https://asc.fasb.org//1943274/2147483443/250-10-50-1
Reference 7: http://www.xbrl.org/2003/role/disclosureRef
-Topic 815
-SubTopic 40
-Name Accounting Standards Codification
-Section 65
-Paragraph 1
-Subparagraph (f)
-Publisher FASB
-URI https://asc.fasb.org//1943274/2147480175/815-40-65-1
Reference 8: http://www.xbrl.org/2003/role/disclosureRef
-Topic 250
-SubTopic 10
-Name Accounting Standards Codification
-Section 50
-Paragraph 8
-Publisher FASB
-URI https://asc.fasb.org//1943274/2147483443/250-10-50-8
Reference 9: http://www.xbrl.org/2003/role/disclosureRef
-Topic 250
-SubTopic 10
-Name Accounting Standards Codification
-Section 50
-Paragraph 9
-Publisher FASB
-URI https://asc.fasb.org//1943274/2147483443/250-10-50-9
Reference 10: http://www.xbrl.org/2003/role/disclosureRef
-Topic 250
-SubTopic 10
-Name Accounting Standards Codification
-Section 50
-Paragraph 11
-Subparagraph (a)
-Publisher FASB
-URI https://asc.fasb.org//1943274/2147483443/250-10-50-11
Reference 11: http://www.xbrl.org/2003/role/disclosureRef
-Topic 250
-SubTopic 10
-Name Accounting Standards Codification
-Section 50
-Paragraph 11
-Subparagraph (b)
-Publisher FASB
-URI https://asc.fasb.org//1943274/2147483443/250-10-50-11
Reference 12: http://www.xbrl.org/2003/role/disclosureRef
-Topic 250
-SubTopic 10
-Name Accounting Standards Codification
-Section 50
-Paragraph 4
-Publisher FASB
-URI https://asc.fasb.org//1943274/2147483443/250-10-50-4
Reference 13: http://www.xbrl.org/2003/role/exampleRef
-Topic 946
-SubTopic 830
-Name Accounting Standards Codification
-Section 55
-Paragraph 10
-Publisher FASB
-URI https://asc.fasb.org//1943274/2147480167/946-830-55-10
Reference 14: http://www.xbrl.org/2003/role/disclosureRef
-Topic 946
-SubTopic 220
-Name Accounting Standards Codification
-Section 45
-Paragraph 7
-Publisher FASB
-URI https://asc.fasb.org//1943274/2147483581/946-220-45-7
Reference 15: http://www.xbrl.org/2003/role/disclosureRef
-Topic 944
-SubTopic 220
-Name Accounting Standards Codification
-Section S99
-Paragraph 1
-Subparagraph (SX 210.7-04(18))
-Publisher FASB
-URI https://asc.fasb.org//1943274/2147483586/944-220-S99-1
Reference 16: http://www.xbrl.org/2003/role/disclosureRef
-Topic 280
-SubTopic 10
-Name Accounting Standards Codification
-Section 50
-Paragraph 22
-Publisher FASB
-URI https://asc.fasb.org//1943274/2147482810/280-10-50-22
Reference 17: http://www.xbrl.org/2003/role/disclosureRef
-Topic 946
-SubTopic 220
-Name Accounting Standards Codification
-Section S99
-Paragraph 1
-Subparagraph (SX 210.6-07(9))
-Publisher FASB
-URI https://asc.fasb.org//1943274/2147483575/946-220-S99-1
Reference 18: http://www.xbrl.org/2003/role/disclosureRef
-Topic 946
-SubTopic 220
-Name Accounting Standards Codification
-Section S99
-Paragraph 3
-Subparagraph (SX 210.6-09(1)(d))
-Publisher FASB
-URI https://asc.fasb.org//1943274/2147483575/946-220-S99-3
Reference 19: http://www.xbrl.org/2003/role/disclosureRef
-Topic 470
-SubTopic 10
-Name Accounting Standards Codification
-Section S99
-Paragraph 1A
-Subparagraph (SX 210.13-01(a)(4)(i))
-Publisher FASB
-URI https://asc.fasb.org//1943274/2147480097/470-10-S99-1A
Reference 20: http://www.xbrl.org/2009/role/commonPracticeRef
-Topic 470
-SubTopic 10
-Name Accounting Standards Codification
-Section S99
-Paragraph 1A
-Subparagraph (SX 210.13-01(a)(4)(ii))
-Publisher FASB
-URI https://asc.fasb.org//1943274/2147480097/470-10-S99-1A
Reference 21: http://www.xbrl.org/2003/role/disclosureRef
-Topic 470
-SubTopic 10
-Name Accounting Standards Codification
-Section S99
-Paragraph 1A
-Subparagraph (SX 210.13-01(a)(4)(iii)(A))
-Publisher FASB
-URI https://asc.fasb.org//1943274/2147480097/470-10-S99-1A
Reference 22: http://www.xbrl.org/2003/role/disclosureRef
-Topic 470
-SubTopic 10
-Name Accounting Standards Codification
-Section S99
-Paragraph 1A
-Subparagraph (SX 210.13-01(a)(4)(iv))
-Publisher FASB
-URI https://asc.fasb.org//1943274/2147480097/470-10-S99-1A
Reference 23: http://www.xbrl.org/2003/role/disclosureRef
-Topic 470
-SubTopic 10
-Name Accounting Standards Codification
-Section S99
-Paragraph 1A
-Subparagraph (SX 210.13-01(a)(5))
-Publisher FASB
-URI https://asc.fasb.org//1943274/2147480097/470-10-S99-1A
Reference 24: http://www.xbrl.org/2003/role/disclosureRef
-Topic 470
-SubTopic 10
-Name Accounting Standards Codification
-Section S99
-Paragraph 1B
-Subparagraph (SX 210.13-02(a)(4)(i))
-Publisher FASB
-URI https://asc.fasb.org//1943274/2147480097/470-10-S99-1B
Reference 25: http://www.xbrl.org/2003/role/disclosureRef
-Topic 470
-SubTopic 10
-Name Accounting Standards Codification
-Section S99
-Paragraph 1B
-Subparagraph (SX 210.13-02(a)(4)(iii)(A))
-Publisher FASB
-URI https://asc.fasb.org//1943274/2147480097/470-10-S99-1B
Reference 26: http://www.xbrl.org/2003/role/disclosureRef
-Topic 470
-SubTopic 10
-Name Accounting Standards Codification
-Section S99
-Paragraph 1B
-Subparagraph (SX 210.13-02(a)(4)(iii)(B))
-Publisher FASB
-URI https://asc.fasb.org//1943274/2147480097/470-10-S99-1B
Reference 27: http://www.xbrl.org/2003/role/disclosureRef
-Topic 470
-SubTopic 10
-Name Accounting Standards Codification
-Section S99
-Paragraph 1B
-Subparagraph (SX 210.13-02(a)(4)(iv))
-Publisher FASB
-URI https://asc.fasb.org//1943274/2147480097/470-10-S99-1B
Reference 28: http://www.xbrl.org/2003/role/disclosureRef
-Topic 470
-SubTopic 10
-Name Accounting Standards Codification
-Section S99
-Paragraph 1B
-Subparagraph (SX 210.13-02(a)(5))
-Publisher FASB
-URI https://asc.fasb.org//1943274/2147480097/470-10-S99-1B
Reference 29: http://www.xbrl.org/2003/role/disclosureRef
-Topic 280
-SubTopic 10
-Name Accounting Standards Codification
-Section 50
-Paragraph 30
-Subparagraph (b)
-Publisher FASB
-URI https://asc.fasb.org//1943274/2147482810/280-10-50-30
Reference 30: http://www.xbrl.org/2003/role/disclosureRef
-Topic 280
-SubTopic 10
-Name Accounting Standards Codification
-Section 50
-Paragraph 32
-Subparagraph (f)
-Publisher FASB
-URI https://asc.fasb.org//1943274/2147482810/280-10-50-32
Reference 31: http://www.xbrl.org/2003/role/disclosureRef
-Topic 260
-SubTopic 10
-Name Accounting Standards Codification
-Section 45
-Paragraph 60B
-Subparagraph (a)
-Publisher FASB
-URI https://asc.fasb.org//1943274/2147482689/260-10-45-60B
Reference 32: http://www.xbrl.org/2003/role/exampleRef
-Topic 280
-SubTopic 10
-Name Accounting Standards Codification
-Section 50
-Paragraph 31
-Publisher FASB
-URI https://asc.fasb.org//1943274/2147482810/280-10-50-31
Reference 33: http://www.xbrl.org/2003/role/disclosureRef
-Topic 280
-SubTopic 10
-Name Accounting Standards Codification
-Section 50
-Paragraph 32
-Subparagraph (c)
-Publisher FASB
-URI https://asc.fasb.org//1943274/2147482810/280-10-50-32
Reference 34: http://www.xbrl.org/2003/role/disclosureRef
-Topic 205
-SubTopic 20
-Name Accounting Standards Codification
-Section 50
-Paragraph 7
-Publisher FASB
-URI https://asc.fasb.org//1943274/2147483499/205-20-50-7
Reference 35: http://fasb.org/us-gaap/role/ref/legacyRef
-Topic 230
-SubTopic 10
-Name Accounting Standards Codification
-Section 45
-Paragraph 28
-Publisher FASB
-URI https://asc.fasb.org//1943274/2147482740/230-10-45-28
Reference 36: http://www.xbrl.org/2003/role/disclosureRef
-Topic 220
-SubTopic 10
-Name Accounting Standards Codification
-Section 45
-Paragraph 1A
-Subparagraph (a)
-Publisher FASB
-URI https://asc.fasb.org//1943274/2147482790/220-10-45-1A
Reference 37: http://www.xbrl.org/2003/role/disclosureRef
-Topic 220
-SubTopic 10
-Name Accounting Standards Codification
-Section 45
-Paragraph 1B
-Subparagraph (a)
-Publisher FASB
-URI https://asc.fasb.org//1943274/2147482790/220-10-45-1B
Reference 38: http://fasb.org/us-gaap/role/ref/legacyRef
-Topic 220
-SubTopic 10
-Name Accounting Standards Codification
-Section S99
-Paragraph 2
-Subparagraph (SX 210.5-03(20))
-Publisher FASB
-URI https://asc.fasb.org//1943274/2147483621/220-10-S99-2
Reference 39: http://fasb.org/us-gaap/role/ref/legacyRef
-Topic 942
-SubTopic 220
-Name Accounting Standards Codification
-Section S99
-Paragraph 1
-Subparagraph (SX 210.9-04(22))
-Publisher FASB
-URI https://asc.fasb.org//1943274/2147483589/942-220-S99-1
| Name: |
us-gaap_NetIncomeLoss |
| Namespace Prefix: |
us-gaap_ |
| Data Type: |
xbrli:monetaryItemType |
| Balance Type: |
credit |
| Period Type: |
duration |
|
| X |
- DefinitionAmount after tax and reclassification adjustments of other comprehensive income (loss). Reference 1: http://fasb.org/us-gaap/role/ref/legacyRef
-Name Accounting Standards Codification
-Section 50
-Paragraph 2
-SubTopic 10
-Topic 505
-Publisher FASB
-URI https://asc.fasb.org//1943274/2147481112/505-10-50-2
Reference 2: http://www.xbrl.org/2003/role/disclosureRef
-Topic 830
-SubTopic 30
-Name Accounting Standards Codification
-Section 50
-Paragraph 1
-Publisher FASB
-URI https://asc.fasb.org//1943274/2147481674/830-30-50-1
Reference 3: http://www.xbrl.org/2003/role/disclosureRef
-Topic 830
-SubTopic 30
-Name Accounting Standards Codification
-Section 45
-Paragraph 17
-Publisher FASB
-URI https://asc.fasb.org//1943274/2147481694/830-30-45-17
Reference 4: http://www.xbrl.org/2003/role/disclosureRef
-Topic 944
-SubTopic 220
-Name Accounting Standards Codification
-Section S99
-Paragraph 1
-Subparagraph (SX 210.7-04(19))
-Publisher FASB
-URI https://asc.fasb.org//1943274/2147483586/944-220-S99-1
Reference 5: http://www.xbrl.org/2009/role/commonPracticeRef
-Topic 220
-SubTopic 10
-Name Accounting Standards Codification
-Section 50
-Paragraph 4
-Publisher FASB
-URI https://asc.fasb.org//1943274/2147482765/220-10-50-4
Reference 6: http://www.xbrl.org/2009/role/commonPracticeRef
-Topic 220
-SubTopic 10
-Name Accounting Standards Codification
-Section 50
-Paragraph 5
-Publisher FASB
-URI https://asc.fasb.org//1943274/2147482765/220-10-50-5
Reference 7: http://www.xbrl.org/2003/role/disclosureRef
-Topic 830
-SubTopic 30
-Name Accounting Standards Codification
-Section 45
-Paragraph 20
-Publisher FASB
-URI https://asc.fasb.org//1943274/2147481694/830-30-45-20
Reference 8: http://www.xbrl.org/2003/role/disclosureRef
-Topic 220
-SubTopic 10
-Name Accounting Standards Codification
-Section S99
-Paragraph 2
-Subparagraph (SX 210.5-03(21))
-Publisher FASB
-URI https://asc.fasb.org//1943274/2147483621/220-10-S99-2
Reference 9: http://www.xbrl.org/2003/role/disclosureRef
-Topic 942
-SubTopic 220
-Name Accounting Standards Codification
-Section S99
-Paragraph 1
-Subparagraph (SX 210.9-04(23))
-Publisher FASB
-URI https://asc.fasb.org//1943274/2147483589/942-220-S99-1
Reference 10: http://www.xbrl.org/2003/role/disclosureRef
-Topic 220
-SubTopic 10
-Name Accounting Standards Codification
-Section 45
-Paragraph 1B
-Subparagraph (b)
-Publisher FASB
-URI https://asc.fasb.org//1943274/2147482790/220-10-45-1B
Reference 11: http://fasb.org/us-gaap/role/ref/legacyRef
-Name Accounting Standards Codification
-Section 55
-Paragraph 15
-SubTopic 10
-Topic 220
-Publisher FASB
-URI https://asc.fasb.org//1943274/2147482739/220-10-55-15
Reference 12: http://www.xbrl.org/2003/role/disclosureRef
-Topic 220
-SubTopic 10
-Name Accounting Standards Codification
-Section 45
-Paragraph 1A
-Subparagraph (b)
-Publisher FASB
-URI https://asc.fasb.org//1943274/2147482790/220-10-45-1A
| Name: |
us-gaap_OtherComprehensiveIncomeLossNetOfTax |
| Namespace Prefix: |
us-gaap_ |
| Data Type: |
xbrli:monetaryItemType |
| Balance Type: |
credit |
| Period Type: |
duration |
|
| X |
- DefinitionNumber of shares issued which are neither cancelled nor held in the treasury.
| Name: |
us-gaap_SharesOutstanding |
| Namespace Prefix: |
us-gaap_ |
| Data Type: |
xbrli:sharesItemType |
| Balance Type: |
na |
| Period Type: |
instant |
|
| X |
- DefinitionAmount of equity (deficit) attributable to parent. Excludes temporary equity and equity attributable to noncontrolling interest. Reference 1: http://www.xbrl.org/2003/role/exampleRef
-Topic 852
-SubTopic 10
-Name Accounting Standards Codification
-Section 55
-Paragraph 10
-Publisher FASB
-URI https://asc.fasb.org//1943274/2147481372/852-10-55-10
Reference 2: http://www.xbrl.org/2003/role/exampleRef
-Topic 946
-SubTopic 830
-Name Accounting Standards Codification
-Section 55
-Paragraph 12
-Publisher FASB
-URI https://asc.fasb.org//1943274/2147480167/946-830-55-12
Reference 3: http://www.xbrl.org/2003/role/disclosureRef
-Topic 946
-SubTopic 210
-Name Accounting Standards Codification
-Section S99
-Paragraph 1
-Subparagraph (SX 210.6-04(19))
-Publisher FASB
-URI https://asc.fasb.org//1943274/2147479617/946-210-S99-1
Reference 4: http://www.xbrl.org/2003/role/disclosureRef
-Topic 946
-SubTopic 210
-Name Accounting Standards Codification
-Section S99
-Paragraph 2
-Subparagraph (SX 210.6-05(4))
-Publisher FASB
-URI https://asc.fasb.org//1943274/2147479617/946-210-S99-2
Reference 5: http://www.xbrl.org/2009/role/commonPracticeRef
-Topic 946
-SubTopic 220
-Name Accounting Standards Codification
-Section S99
-Paragraph 3
-Subparagraph (SX 210.6-09(4)(b))
-Publisher FASB
-URI https://asc.fasb.org//1943274/2147483575/946-220-S99-3
Reference 6: http://www.xbrl.org/2003/role/disclosureRef
-Topic 946
-SubTopic 220
-Name Accounting Standards Codification
-Section S99
-Paragraph 3
-Subparagraph (SX 210.6-09(6))
-Publisher FASB
-URI https://asc.fasb.org//1943274/2147483575/946-220-S99-3
Reference 7: http://www.xbrl.org/2003/role/disclosureRef
-Topic 946
-SubTopic 220
-Name Accounting Standards Codification
-Section S99
-Paragraph 3
-Subparagraph (SX 210.6-09(7))
-Publisher FASB
-URI https://asc.fasb.org//1943274/2147483575/946-220-S99-3
Reference 8: http://www.xbrl.org/2009/role/commonPracticeRef
-Topic 235
-SubTopic 10
-Name Accounting Standards Codification
-Section S99
-Paragraph 1
-Subparagraph (SX 210.4-08(g)(1)(ii))
-Publisher FASB
-URI https://asc.fasb.org//1943274/2147480678/235-10-S99-1
Reference 9: http://www.xbrl.org/2009/role/commonPracticeRef
-Topic 323
-SubTopic 10
-Name Accounting Standards Codification
-Section 50
-Paragraph 3
-Subparagraph (c)
-Publisher FASB
-URI https://asc.fasb.org//1943274/2147481687/323-10-50-3
Reference 10: http://www.xbrl.org/2009/role/commonPracticeRef
-Topic 825
-SubTopic 10
-Name Accounting Standards Codification
-Section 50
-Paragraph 28
-Subparagraph (f)
-Publisher FASB
-URI https://asc.fasb.org//1943274/2147482907/825-10-50-28
Reference 11: http://fasb.org/us-gaap/role/ref/legacyRef
-Topic 210
-SubTopic 10
-Name Accounting Standards Codification
-Section S99
-Paragraph 1
-Subparagraph (SX 210.5-02(29))
-Publisher FASB
-URI https://asc.fasb.org//1943274/2147480566/210-10-S99-1
Reference 12: http://fasb.org/us-gaap/role/ref/legacyRef
-Topic 210
-SubTopic 10
-Name Accounting Standards Codification
-Section S99
-Paragraph 1
-Subparagraph (SX 210.5-02(31))
-Publisher FASB
-URI https://asc.fasb.org//1943274/2147480566/210-10-S99-1
Reference 13: http://fasb.org/us-gaap/role/ref/legacyRef
-Topic 210
-SubTopic 10
-Name Accounting Standards Codification
-Section S99
-Paragraph 1
-Subparagraph (SX 210.5-02(30))
-Publisher FASB
-URI https://asc.fasb.org//1943274/2147480566/210-10-S99-1
Reference 14: http://fasb.org/us-gaap/role/ref/legacyRef
-Topic 310
-SubTopic 10
-Name Accounting Standards Codification
-Section S99
-Paragraph 2
-Subparagraph (SAB Topic 4.E)
-Publisher FASB
-URI https://asc.fasb.org//1943274/2147480418/310-10-S99-2
| Name: |
us-gaap_StockholdersEquity |
| Namespace Prefix: |
us-gaap_ |
| Data Type: |
xbrli:monetaryItemType |
| Balance Type: |
credit |
| Period Type: |
instant |
|
| X |
- DefinitionNumber of previously issued common shares repurchased by the issuing entity and held in treasury. Reference 1: http://fasb.org/us-gaap/role/ref/legacyRef
-Name Accounting Standards Codification
-Topic 505
-SubTopic 30
-Section 45
-Paragraph 1
-Publisher FASB
-URI https://asc.fasb.org//1943274/2147481549/505-30-45-1
| Name: |
us-gaap_TreasuryStockCommonShares |
| Namespace Prefix: |
us-gaap_ |
| Data Type: |
xbrli:sharesItemType |
| Balance Type: |
na |
| Period Type: |
instant |
|
| X |
- DefinitionNumber of shares that have been repurchased during the period and are being held in treasury. Reference 1: http://fasb.org/us-gaap/role/ref/legacyRef
-Name Accounting Standards Codification
-Section 50
-Paragraph 2
-SubTopic 10
-Topic 505
-Publisher FASB
-URI https://asc.fasb.org//1943274/2147481112/505-10-50-2
Reference 2: http://fasb.org/us-gaap/role/ref/legacyRef
-Topic 505
-SubTopic 10
-Name Accounting Standards Codification
-Section S99
-Paragraph 1
-Subparagraph (SX 210.3-04)
-Publisher FASB
-URI https://asc.fasb.org//1943274/2147480008/505-10-S99-1
Reference 3: http://fasb.org/us-gaap/role/ref/legacyRef
-Topic 210
-SubTopic 10
-Name Accounting Standards Codification
-Section S99
-Paragraph 1
-Subparagraph (SX 210.5-02(29))
-Publisher FASB
-URI https://asc.fasb.org//1943274/2147480566/210-10-S99-1
| Name: |
us-gaap_TreasuryStockSharesAcquired |
| Namespace Prefix: |
us-gaap_ |
| Data Type: |
xbrli:sharesItemType |
| Balance Type: |
na |
| Period Type: |
duration |
|
| X |
- DefinitionEquity impact of the cost of common and preferred stock that were repurchased during the period. Recorded using the cost method. Reference 1: http://fasb.org/us-gaap/role/ref/legacyRef
-Name Accounting Standards Codification
-Section 50
-Paragraph 2
-SubTopic 10
-Topic 505
-Publisher FASB
-URI https://asc.fasb.org//1943274/2147481112/505-10-50-2
Reference 2: http://fasb.org/us-gaap/role/ref/legacyRef
-Topic 505
-SubTopic 10
-Name Accounting Standards Codification
-Section S99
-Paragraph 1
-Subparagraph (SX 210.3-04)
-Publisher FASB
-URI https://asc.fasb.org//1943274/2147480008/505-10-S99-1
Reference 3: http://fasb.org/us-gaap/role/ref/legacyRef
-Name Accounting Standards Codification
-Topic 505
-SubTopic 30
-Section 45
-Paragraph 1
-Publisher FASB
-URI https://asc.fasb.org//1943274/2147481549/505-30-45-1
| Name: |
us-gaap_TreasuryStockValueAcquiredCostMethod |
| Namespace Prefix: |
us-gaap_ |
| Data Type: |
xbrli:monetaryItemType |
| Balance Type: |
debit |
| Period Type: |
duration |
|
v3.23.3
Nature of Operations and Basis of Presentation
|
9 Months Ended |
Sep. 30, 2023 |
|---|
| Organization, Consolidation and Presentation of Financial Statements [Abstract] |
|
| Nature of Operations and Basis of Presentation |
Nature of Operations and Basis of Presentation Nature of Operations
Resideo Technologies, Inc. (“Resideo”, the “Company”, “we”, “us”, or “our”) is a leading manufacturer and developer of technology-driven products that provide critical comfort, energy, smoke and carbon monoxide detection home safety products, and security solutions to homes globally. We are also a leading wholesale distributor of low-voltage security products including access control, fire detection, fire suppression, security, and video products, and participate significantly in the broader related markets of audio, communications, data communications, networking, power, ProAV, smart home, and wire and cable. Our global footprint serves both commercial and residential end markets.
Basis of Consolidation and Reporting
The accompanying Unaudited Consolidated Financial Statements have been prepared in accordance with United States (“U.S.”) generally accepted accounting principles (“GAAP”) for interim financial information and with the instructions to Form 10-Q and Article 10 of Regulation S-X. Accordingly, the Unaudited Consolidated Financial Statements do not include all of the information and notes required by GAAP for complete financial statements. In the opinion of management, the Unaudited Consolidated Financial Statements included herein contain all adjustments, which consist of normal recurring adjustments, necessary to fairly present our financial position, results of operations and cash flows for the periods indicated. Operating results for the period from January 1, 2023 through September 30, 2023 are not necessarily indicative of the results that may be expected for the fiscal year ending December 31, 2023.
For additional information, refer to the consolidated financial statements and notes thereto included in our Annual Report on Form 10-K for the fiscal year ended December 31, 2022 (the “2022 Annual Report on Form 10-K”), filed with the United States Securities and Exchange Commission (the “SEC”) on February 21, 2023.
Reporting Period
We report financial information on a fiscal quarter basis using a modified four-four-five week calendar. Our fiscal calendar begins on January 1 and ends on December 31. We have elected the first, second and third quarters to end on a Saturday in order to not disrupt business processes. The effects of this election are generally not significant to reported results for any quarter and only exist within a reporting year.
Reclassification
For the purpose of comparability, certain prior period amounts have been reclassified to conform to current period classification.
Assets and Liabilities Held for Sale
On September 19 2023, we announced that we entered into a definitive agreement to sell the Genesis Wire & Cable (“Genesis”) business in a cash transaction to Southwire Company, LLC (the “buyer”) for $87.5 million, subject to customary adjustments. Genesis is reported within the Products and Solutions Segment. The divestiture does not represent a strategic shift, nor will it have a significant impact on our Unaudited Consolidated Statements of Operations. As such, we have reclassified the related assets and liabilities to held for sale within other current assets and accrued liabilities, respectively, on the Unaudited Consolidated Balance Sheets. The estimated fair value less costs exceeds the carrying amount for Genesis, therefore no impairment was recognized for the three and nine months ended September 30, 2023. The transaction closed in October 2023. The following is a summary of the major categories of assets and liabilities that have been classified as held for sale within other current assets and accrued liabilities on the Unaudited Consolidated Balance Sheets at September 30, 2023:
| | | | | | | (in millions) | September 30, 2023 | | Accounts receivables, net | $ | 20 | | | Inventories, net | 14 | | | Property, plant and equipment, net | 7 | | | Goodwill | 40 | | | Other assets | 5 | | | Total assets held for sale | $ | 86 | | | | | Accounts payable | $ | 18 | | | Accrued liabilities | 8 | | | Other liabilities | 5 | | | Total liabilities held for sale | $ | 31 | |
|
| X |
- References
+ Details
| Name: |
us-gaap_OrganizationConsolidationAndPresentationOfFinancialStatementsAbstract |
| Namespace Prefix: |
us-gaap_ |
| Data Type: |
xbrli:stringItemType |
| Balance Type: |
na |
| Period Type: |
duration |
|
| X |
- DefinitionThe entire disclosure for organization, consolidation and basis of presentation of financial statements disclosure. Reference 1: http://www.xbrl.org/2003/role/disclosureRef
-Topic 946
-SubTopic 10
-Name Accounting Standards Codification
-Section 50
-Paragraph 1
-Publisher FASB
-URI https://asc.fasb.org//1943274/2147480424/946-10-50-1
Reference 2: http://www.xbrl.org/2003/role/disclosureRef
-Topic 946
-SubTopic 10
-Name Accounting Standards Codification
-Section 50
-Paragraph 2
-Publisher FASB
-URI https://asc.fasb.org//1943274/2147480424/946-10-50-2
Reference 3: http://fasb.org/us-gaap/role/ref/legacyRef
-Topic 810
-Name Accounting Standards Codification
-Publisher FASB
-URI https://asc.fasb.org//810/tableOfContent
Reference 4: http://fasb.org/us-gaap/role/ref/legacyRef
-Topic 205
-Name Accounting Standards Codification
-Publisher FASB
-URI https://asc.fasb.org//205/tableOfContent
| Name: |
us-gaap_OrganizationConsolidationAndPresentationOfFinancialStatementsDisclosureTextBlock |
| Namespace Prefix: |
us-gaap_ |
| Data Type: |
dtr-types:textBlockItemType |
| Balance Type: |
na |
| Period Type: |
duration |
|
v3.23.3
Summary of Significant Accounting Policies
|
9 Months Ended |
Sep. 30, 2023 |
|---|
| Accounting Policies [Abstract] |
|
| Summary of Significant Accounting Policies |
Summary of Significant Accounting Policies Our significant accounting policies are detailed in Note 2. Summary of Significant Accounting Policies of the Annual Report on Form 10-K for the year ended December 31, 2022. There have been no significant changes to these policies that have had a material impact on the Unaudited Consolidated Financial Statements and accompanying notes for the three and nine months ended September 30, 2023.
We consider the applicability and impact of all recent accounting standards updates (“ASUs”) issued by the Financial Accounting Standards Board (“FASB”) and disclose only those that may have a material impact.
Adopted Accounting Pronouncements In March 2020, the FASB issued ASU 2020-04, Reference Rate Reform (Topic 848): Facilitation of the Effects of Reference Rate Reform on Financial Reporting, and subsequent amendment to the initial guidance: ASU 2021-01, Reference Rate Reform (Topic 848): Scope (collectively, “Topic 848”). Topic 848 provides optional expedients and exceptions for applying GAAP to contracts, hedging relationships, and other transactions affected by reference rate reform if certain criteria are met. The amendments apply only to contracts, hedging relationships, and other transactions that reference London Interbank Offered Rate (“LIBOR”) or another reference rate expected to be discontinued because of reference rate reform. In December 2022, the FASB issued ASU 2022-06, Reference Rate Reform (Topic 848): Deferral of the Sunset Date of Topic 848. ASU 2022-06 defers the sunset date of Topic 848 from December 31, 2022 to December 31, 2024. This guidance may be applied prospectively to contract modifications made and hedging relationships entered into or evaluated on or before December 31, 2024. The impact of the adoption of this standard on our financial statements and related disclosures, including accounting policies, processes, and systems, was not material. Refer to Note 12. Long-Term Debt and Note 13. Derivative Financial Instruments to the Unaudited Consolidated Financial Statements for further discussion.
|
| X |
- References
+ Details
| Name: |
us-gaap_AccountingPoliciesAbstract |
| Namespace Prefix: |
us-gaap_ |
| Data Type: |
xbrli:stringItemType |
| Balance Type: |
na |
| Period Type: |
duration |
|
| X |
- DefinitionThe entire disclosure for all significant accounting policies of the reporting entity. Reference 1: http://www.xbrl.org/2003/role/disclosureRef
-Topic 235
-SubTopic 10
-Name Accounting Standards Codification
-Section 50
-Paragraph 1
-Publisher FASB
-URI https://asc.fasb.org//1943274/2147483426/235-10-50-1
Reference 2: http://fasb.org/us-gaap/role/ref/legacyRef
-Topic 235
-Name Accounting Standards Codification
-Publisher FASB
-URI https://asc.fasb.org//235/tableOfContent
| Name: |
us-gaap_SignificantAccountingPoliciesTextBlock |
| Namespace Prefix: |
us-gaap_ |
| Data Type: |
dtr-types:textBlockItemType |
| Balance Type: |
na |
| Period Type: |
duration |
|
v3.23.3
Acquisitions
|
9 Months Ended |
Sep. 30, 2023 |
|---|
| Business Combination and Asset Acquisition [Abstract] |
|
| Acquisitions |
Acquisitions Pro forma results of operations for the following acquisitions have not been presented, as the impacts on our consolidated financial results were not material.
2023 Acquisitions
Sfty SA—On August 9, 2023, we acquired 100% of the outstanding equity of Sfty SA, a developer of cloud-based services providing alerts to multifamily homes and property managers with smoke, carbon monoxide and water leak detection products. We report Sfty SA’s results within the Products and Solutions segment. We have made a preliminary purchase price allocation that is subject to change as additional information is obtained.
BTX Technologies, Inc.—On January 23, 2023, we acquired 100% of the outstanding equity of BTX Technologies, Inc., (“BTX”) a leading distributor of professional audio, video, data communications, and broadcast equipment. We report BTX’s results within the ADI Global Distribution segment. We have made a preliminary purchase price allocation that is subject to change as additional information is obtained.
2022 Acquisitions
Teknique Limited—On December 23, 2022, we acquired 100% of the outstanding equity of Teknique Limited, a developer and producer of edge-based, artificial intelligence-enabled video camera solutions. We report Teknique Limited’s results within the Products and Solutions segment. Purchase consideration included cash and a note payable with the former owner. We have made a preliminary purchase price allocation that is subject to change as additional information is obtained.
Electronic Custom Distributors, Inc.—On July 5, 2022, we acquired 100% of the outstanding equity of Electronic Custom Distributors, Inc., a regional distributor of residential audio, video, automation, security, wire and telecommunication products. We report Electronic Customer Distributors, Inc.’s results within the ADI Global Distribution segment. We completed the accounting for the acquisition during the first quarter of 2023, which did not result in any adjustments.
First Alert, Inc.—On March 31, 2022, we acquired 100% of the outstanding equity of First Alert, Inc., a leading provider of home safety products. We report First Alert, Inc.’s results within the Products and Solutions segment. We completed the accounting for the acquisition during the first quarter of 2023, which did not result in any adjustments.
|
| X |
- References
+ Details
| Name: |
us-gaap_BusinessCombinationAndAssetAcquisitionAbstract |
| Namespace Prefix: |
us-gaap_ |
| Data Type: |
xbrli:stringItemType |
| Balance Type: |
na |
| Period Type: |
duration |
|
| X |
- DefinitionThe entire disclosure for a business combination (or series of individually immaterial business combinations) completed during the period, including background, timing, and recognized assets and liabilities. The disclosure may include leverage buyout transactions (as applicable). Reference 1: http://www.xbrl.org/2003/role/disclosureRef
-Topic 805
-SubTopic 20
-Name Accounting Standards Codification
-Section 50
-Paragraph 5
-Subparagraph (b)
-Publisher FASB
-URI https://asc.fasb.org//1943274/2147479907/805-20-50-5
Reference 2: http://fasb.org/us-gaap/role/ref/legacyRef
-Topic 805
-Name Accounting Standards Codification
-Publisher FASB
-URI https://asc.fasb.org//805/tableOfContent
| Name: |
us-gaap_BusinessCombinationDisclosureTextBlock |
| Namespace Prefix: |
us-gaap_ |
| Data Type: |
dtr-types:textBlockItemType |
| Balance Type: |
na |
| Period Type: |
duration |
|
v3.23.3
Segment Financial Data
|
9 Months Ended |
Sep. 30, 2023 |
|---|
| Segment Reporting [Abstract] |
|
| Segment Financial Data |
Segment Financial Data We monitor our business operations through our two operating segments: Products and Solutions and ADI Global Distribution.
These operating segments follow the same accounting policies used for the financial statements. We evaluate a segment’s performance on a GAAP basis, primarily operating income before corporate expenses.
Corporate expenses relate to functions within the corporate office that support the operating segments such as acquisition-related costs, legal, tax, treasury, human resources, IT, strategy, accounting, communications, innovation, business development, facilities management, corporate travel expenses and other executive costs. Additionally, included within Corporate are unallocated non-operating items such as pension expense, Reimbursement Agreement expense, interest income, interest expense, and other income (expense).
Segment information is consistent with how management reviews the businesses, makes investing and resource allocation decisions, and assesses operating performance.
The following table represents summary financial data attributable to the segments:
| | | | | | | | | | | | | | | | | | | | | | | | | Three Months Ended | | Nine Months Ended | | (in millions) | September 30, 2023 | | October 1, 2022 | | September 30, 2023 | | October 1, 2022 | | Net revenue | | | | | | | | | Products and Solutions | $ | 654 | | | $ | 707 | | | $ | 1,989 | | | $ | 2,090 | | | ADI Global Distribution | 900 | | | 911 | | | 2,716 | | | 2,720 | | | Total net revenue | $ | 1,554 | | | $ | 1,618 | | | $ | 4,705 | | | $ | 4,810 | |
| | | | | | | | | | | | | | | | | | | | | | | | | Three Months Ended | | Nine Months Ended | | (in millions) | September 30, 2023 | | October 1, 2022 | | September 30, 2023 | | October 1, 2022 | | Income from operations | | | | | | | | | Products and Solutions | $ | 107 | | | $ | 124 | | | $ | 352 | | | $ | 431 | | | ADI Global Distribution | 60 | | | 78 | | | 211 | | | 244 | | | Corporate | (58) | | | (47) | | | (163) | | | (162) | | | Total income from operations | $ | 109 | | | $ | 155 | | | $ | 400 | | | $ | 513 | |
The Company’s Chief Executive Officer, its Chief Operating Decision Maker, does not use segment assets information to allocate resources or to assess performance of the segments and therefore, total segment assets have not been reported.
|
| X |
- References
+ Details
| Name: |
us-gaap_SegmentReportingAbstract |
| Namespace Prefix: |
us-gaap_ |
| Data Type: |
xbrli:stringItemType |
| Balance Type: |
na |
| Period Type: |
duration |
|
| X |
- DefinitionThe entire disclosure for reporting segments including data and tables. Reportable segments include those that meet any of the following quantitative thresholds a) it's reported revenue, including sales to external customers and intersegment sales or transfers is 10 percent or more of the combined revenue, internal and external, of all operating segments b) the absolute amount of its reported profit or loss is 10 percent or more of the greater, in absolute amount of 1) the combined reported profit of all operating segments that did not report a loss or 2) the combined reported loss of all operating segments that did report a loss c) its assets are 10 percent or more of the combined assets of all operating segments. Reference 1: http://www.xbrl.org/2003/role/disclosureRef
-Topic 280
-SubTopic 10
-Name Accounting Standards Codification
-Section 50
-Paragraph 22
-Publisher FASB
-URI https://asc.fasb.org//1943274/2147482810/280-10-50-22
Reference 2: http://www.xbrl.org/2003/role/disclosureRef
-Topic 280
-SubTopic 10
-Name Accounting Standards Codification
-Section 50
-Paragraph 15
-Publisher FASB
-URI https://asc.fasb.org//1943274/2147482810/280-10-50-15
Reference 3: http://www.xbrl.org/2003/role/disclosureRef
-Topic 280
-SubTopic 10
-Name Accounting Standards Codification
-Section 50
-Paragraph 31
-Publisher FASB
-URI https://asc.fasb.org//1943274/2147482810/280-10-50-31
Reference 4: http://www.xbrl.org/2003/role/disclosureRef
-Topic 280
-SubTopic 10
-Name Accounting Standards Codification
-Section 50
-Paragraph 32
-Subparagraph (d)
-Publisher FASB
-URI https://asc.fasb.org//1943274/2147482810/280-10-50-32
Reference 5: http://www.xbrl.org/2003/role/disclosureRef
-Topic 280
-SubTopic 10
-Name Accounting Standards Codification
-Section 50
-Paragraph 42
-Publisher FASB
-URI https://asc.fasb.org//1943274/2147482810/280-10-50-42
Reference 6: http://www.xbrl.org/2003/role/disclosureRef
-Topic 280
-SubTopic 10
-Name Accounting Standards Codification
-Section 50
-Paragraph 32
-Subparagraph (f)
-Publisher FASB
-URI https://asc.fasb.org//1943274/2147482810/280-10-50-32
Reference 7: http://www.xbrl.org/2003/role/disclosureRef
-Topic 280
-SubTopic 10
-Name Accounting Standards Codification
-Section 50
-Paragraph 40
-Publisher FASB
-URI https://asc.fasb.org//1943274/2147482810/280-10-50-40
Reference 8: http://www.xbrl.org/2003/role/disclosureRef
-Topic 280
-Name Accounting Standards Codification
-Publisher FASB
-URI https://asc.fasb.org//280/tableOfContent
Reference 9: http://www.xbrl.org/2003/role/disclosureRef
-Topic 280
-SubTopic 10
-Name Accounting Standards Codification
-Section 50
-Paragraph 26
-Publisher FASB
-URI https://asc.fasb.org//1943274/2147482810/280-10-50-26
Reference 10: http://www.xbrl.org/2003/role/disclosureRef
-Topic 280
-SubTopic 10
-Name Accounting Standards Codification
-Section 50
-Paragraph 34
-Publisher FASB
-URI https://asc.fasb.org//1943274/2147482810/280-10-50-34
Reference 11: http://www.xbrl.org/2003/role/disclosureRef
-Topic 280
-SubTopic 10
-Name Accounting Standards Codification
-Section 50
-Paragraph 41
-Publisher FASB
-URI https://asc.fasb.org//1943274/2147482810/280-10-50-41
Reference 12: http://www.xbrl.org/2003/role/disclosureRef
-Topic 280
-SubTopic 10
-Name Accounting Standards Codification
-Section 50
-Paragraph 21
-Subparagraph (a)
-Publisher FASB
-URI https://asc.fasb.org//1943274/2147482810/280-10-50-21
Reference 13: http://www.xbrl.org/2003/role/disclosureRef
-Topic 280
-SubTopic 10
-Name Accounting Standards Codification
-Section 50
-Paragraph 21
-Subparagraph (b)
-Publisher FASB
-URI https://asc.fasb.org//1943274/2147482810/280-10-50-21
Reference 14: http://www.xbrl.org/2003/role/disclosureRef
-Topic 280
-SubTopic 10
-Name Accounting Standards Codification
-Section 50
-Paragraph 32
-Subparagraph (e)
-Publisher FASB
-URI https://asc.fasb.org//1943274/2147482810/280-10-50-32
| Name: |
us-gaap_SegmentReportingDisclosureTextBlock |
| Namespace Prefix: |
us-gaap_ |
| Data Type: |
dtr-types:textBlockItemType |
| Balance Type: |
na |
| Period Type: |
duration |
|
v3.23.3
Revenue Recognition
|
9 Months Ended |
Sep. 30, 2023 |
|---|
| Revenue from Contract with Customer [Abstract] |
|
| Revenue Recognition |
Revenue Recognition We have two operating segments, Products and Solutions and ADI Global Distribution. Disaggregated revenue information for Products and Solutions is presented by product grouping, while ADI Global Distribution is presented by region.
The following table presents revenue by business line and geographic location, as we believe this presentation best depicts how the nature, amount, timing, and uncertainty of net revenue and cash flows are affected by economic factors:
| | | | | | | | | | | | | | | | | | | | | | | | | Three Months Ended | | Nine Months Ended | | (in millions) | September 30, 2023 | | October 1, 2022 | | September 30, 2023 | | October 1, 2022 | | Products and Solutions | | | | | | | | | Air | $ | 211 | | | $ | 245 | | | $ | 640 | | | $ | 721 | | | Safety and Security | 245 | | | 248 | | | 721 | | | 670 | | | Energy | 123 | | | 142 | | | 391 | | | 455 | | | Water | 75 | | | 72 | | | 237 | | | 244 | | | Total Products and Solutions | 654 | | | 707 | | | 1,989 | | | 2,090 | | | | | | | | | | | ADI Global Distribution | | | | | | | | | U.S. and Canada | 780 | | | 792 | | | 2,354 | | | 2,335 | | EMEA (1) | 120 | | | 111 | | | 362 | | | 360 | | APAC (2) | — | | | 8 | | | — | | | 25 | | | Total ADI Global Distribution | 900 | | | 911 | | | 2,716 | | | 2,720 | | | | | | | | | | | Total net revenue | $ | 1,554 | | | $ | 1,618 | | | $ | 4,705 | | | $ | 4,810 | |
(1)EMEA represents Europe, the Middle East and Africa. (2)APAC represents Asia and Pacific countries.
|
| X |
- References
+ Details
| Name: |
us-gaap_RevenueFromContractWithCustomerAbstract |
| Namespace Prefix: |
us-gaap_ |
| Data Type: |
xbrli:stringItemType |
| Balance Type: |
na |
| Period Type: |
duration |
|
| X |
- DefinitionThe entire disclosure of revenue from contract with customer to transfer good or service and to transfer nonfinancial asset. Includes, but is not limited to, disaggregation of revenue, credit loss recognized from contract with customer, judgment and change in judgment related to contract with customer, and asset recognized from cost incurred to obtain or fulfill contract with customer. Excludes insurance and lease contracts. Reference 1: http://www.xbrl.org/2003/role/disclosureRef
-Topic 606
-SubTopic 10
-Name Accounting Standards Codification
-Section 50
-Paragraph 9
-Publisher FASB
-URI https://asc.fasb.org//1943274/2147479806/606-10-50-9
Reference 2: http://www.xbrl.org/2003/role/disclosureRef
-Topic 606
-SubTopic 10
-Name Accounting Standards Codification
-Section 50
-Paragraph 10
-Publisher FASB
-URI https://asc.fasb.org//1943274/2147479806/606-10-50-10
Reference 3: http://www.xbrl.org/2003/role/disclosureRef
-Topic 606
-SubTopic 10
-Name Accounting Standards Codification
-Section 50
-Paragraph 15
-Publisher FASB
-URI https://asc.fasb.org//1943274/2147479806/606-10-50-15
Reference 4: http://www.xbrl.org/2003/role/disclosureRef
-Topic 606
-SubTopic 10
-Name Accounting Standards Codification
-Section 50
-Paragraph 12
-Subparagraph (a)
-Publisher FASB
-URI https://asc.fasb.org//1943274/2147479806/606-10-50-12
Reference 5: http://www.xbrl.org/2003/role/disclosureRef
-Topic 606
-SubTopic 10
-Name Accounting Standards Codification
-Section 50
-Paragraph 12
-Subparagraph (b)
-Publisher FASB
-URI https://asc.fasb.org//1943274/2147479806/606-10-50-12
Reference 6: http://www.xbrl.org/2003/role/disclosureRef
-Topic 606
-SubTopic 10
-Name Accounting Standards Codification
-Section 50
-Paragraph 12
-Subparagraph (c)
-Publisher FASB
-URI https://asc.fasb.org//1943274/2147479806/606-10-50-12
Reference 7: http://www.xbrl.org/2003/role/disclosureRef
-Topic 606
-SubTopic 10
-Name Accounting Standards Codification
-Section 50
-Paragraph 12
-Subparagraph (d)
-Publisher FASB
-URI https://asc.fasb.org//1943274/2147479806/606-10-50-12
Reference 8: http://www.xbrl.org/2003/role/disclosureRef
-Topic 606
-SubTopic 10
-Name Accounting Standards Codification
-Section 50
-Paragraph 12
-Subparagraph (e)
-Publisher FASB
-URI https://asc.fasb.org//1943274/2147479806/606-10-50-12
Reference 9: http://www.xbrl.org/2003/role/disclosureRef
-Topic 606
-SubTopic 10
-Name Accounting Standards Codification
-Section 50
-Paragraph 13
-Subparagraph (b)(2)
-Publisher FASB
-URI https://asc.fasb.org//1943274/2147479806/606-10-50-13
Reference 10: http://www.xbrl.org/2003/role/disclosureRef
-Name Accounting Standards Codification
-Topic 606
-Publisher FASB
-URI https://asc.fasb.org//606/tableOfContent
| Name: |
us-gaap_RevenueFromContractWithCustomerTextBlock |
| Namespace Prefix: |
us-gaap_ |
| Data Type: |
dtr-types:textBlockItemType |
| Balance Type: |
na |
| Period Type: |
duration |
|
v3.23.3
Restructuring
|
9 Months Ended |
Sep. 30, 2023 |
|---|
| Restructuring and Related Activities [Abstract] |
|
| Restructuring |
Restructuring During the third quarter of 2023, we initiated additional restructuring programs (“2023 Plan”) in order to align our cost structure with market conditions. For the three and nine months ended September 30, 2023, we recognized restructuring and impairment expenses of $38 million and $42 million, respectively. These expenses primarily related to workforce reductions.
Restructuring and impairment expenses recognized were $25 million in the Product and Solutions segment, $10 million in the ADI Global Distribution segment and $3 million in the Corporate segment, respectively, for the three months ended September 30, 2023, and $27 million in the Product and Solutions segment, $12 million in the ADI Global Distribution segment and $3 million in the Corporate segment, respectively, for the nine months ended September 30, 2023. No restructuring and impairment expenses were recognized for the three and nine months ended October 1, 2022.
In 2022, we initiated certain restructuring programs to lower costs, increase gross and operating margins and position us for growth. Refer to Note 6. Restructuring Expenses in our 2022 Annual Report on Form 10-K for further discussion of our 2022 restructuring programs.
We expect to fully execute our restructuring initiatives and programs over the next 12 to 24 months, and we may incur future additional restructuring expenses associated with these plans. We are unable at this time to make a good faith determination of cost estimates, or ranges of cost estimates, associated with future phases of the plans or the total costs we may incur in connection with these plans.
The following table summarizes the status of our restructuring expenses included within accrued liabilities on the Unaudited Consolidated Balance Sheets.
| | | | | | | | | | | | | Nine Months Ended | | Twelve Months Ended | | (in millions) | September 30, 2023 | | December 31, 2022 | | Beginning of period | $ | 27 | | | $ | 9 | | | Charges | 36 | | | 26 | | Usage (1) | (22) | | | (5) | | | Other | — | | | (3) | | | End of period | $ | 41 | | | $ | 27 | |
(1) Usage primarily relates to cash payments associated with employee termination costs.
|
| X |
- DefinitionThe entire disclosure for restructuring and related activities. Description of restructuring activities such as exit and disposal activities, include facts and circumstances leading to the plan, the expected plan completion date, the major types of costs associated with the plan activities, total expected costs, the accrual balance at the end of the period, and the periods over which the remaining accrual will be settled. Reference 1: http://www.xbrl.org/2003/role/disclosureRef
-Topic 420
-SubTopic 10
-Name Accounting Standards Codification
-Section 50
-Paragraph 1
-Subparagraph (b)(2)
-Publisher FASB
-URI https://asc.fasb.org//1943274/2147482017/420-10-50-1
Reference 2: http://www.xbrl.org/2003/role/disclosureRef
-Topic 420
-SubTopic 10
-Name Accounting Standards Codification
-Section 50
-Paragraph 1
-Subparagraph (a)
-Publisher FASB
-URI https://asc.fasb.org//1943274/2147482017/420-10-50-1
Reference 3: http://www.xbrl.org/2003/role/disclosureRef
-Topic 420
-Name Accounting Standards Codification
-Publisher FASB
-URI https://asc.fasb.org//420/tableOfContent
Reference 4: http://www.xbrl.org/2003/role/disclosureRef
-Topic 420
-SubTopic 10
-Name Accounting Standards Codification
-Section 50
-Paragraph 1
-Subparagraph (e)
-Publisher FASB
-URI https://asc.fasb.org//1943274/2147482017/420-10-50-1
Reference 5: http://www.xbrl.org/2003/role/disclosureRef
-Topic 420
-SubTopic 10
-Name Accounting Standards Codification
-Section S99
-Paragraph 2
-Subparagraph (SAB Topic 5.P.4(e))
-Publisher FASB
-URI https://asc.fasb.org//1943274/2147479823/420-10-S99-2
| Name: |
us-gaap_RestructuringAndRelatedActivitiesDisclosureTextBlock |
| Namespace Prefix: |
us-gaap_ |
| Data Type: |
dtr-types:textBlockItemType |
| Balance Type: |
na |
| Period Type: |
duration |
|
v3.23.3
Pension Plans
|
9 Months Ended |
Sep. 30, 2023 |
|---|
| Retirement Benefits [Abstract] |
|
| Pension Plans |
Pension PlansAs a result of a voluntary lump sum window offering and the purchase of a group annuity contract that transferred a portion of the assets and liabilities to an insurance company during the first quarter of 2023, we triggered settlement accounting and performed a remeasurement of our U.S. qualified defined benefit pension plan. As a result, we recognized non-cash pension settlement losses within other expense, net in the Unaudited Consolidated Statements of Operations of $3 million and $6 million for the three and nine months ended September 30, 2023, respectively. The loss for the three months ended September 30, 2023 is mainly related to an adjustment to our estimate of the losses from settlements that occurred during the first quarter of 2023. The corresponding remeasurement of our U.S. qualified defined benefit pension plan resulted in decreases of $80 million in plan assets and $75 million in liabilities for the nine months ended September 30, 2023.
|
| X |
- References
+ Details
| Name: |
us-gaap_CompensationAndRetirementDisclosureAbstract |
| Namespace Prefix: |
us-gaap_ |
| Data Type: |
xbrli:stringItemType |
| Balance Type: |
na |
| Period Type: |
duration |
|
| X |
- DefinitionThe entire disclosure for retirement benefits. Reference 1: http://www.xbrl.org/2003/role/disclosureRef
-Topic 715
-SubTopic 70
-Name Accounting Standards Codification
-Section 50
-Paragraph 1
-Publisher FASB
-URI https://asc.fasb.org//1943274/2147480794/715-70-50-1
Reference 2: http://www.xbrl.org/2003/role/exampleRef
-Topic 715
-SubTopic 20
-Name Accounting Standards Codification
-Section 55
-Paragraph 17
-Publisher FASB
-URI https://asc.fasb.org//1943274/2147480482/715-20-55-17
Reference 3: http://www.xbrl.org/2003/role/disclosureRef
-Topic 715
-SubTopic 20
-Name Accounting Standards Codification
-Section 50
-Paragraph 1
-Subparagraph (d)(iv)(03)
-Publisher FASB
-URI https://asc.fasb.org//1943274/2147480506/715-20-50-1
Reference 4: http://www.xbrl.org/2003/role/disclosureRef
-Topic 715
-SubTopic 20
-Name Accounting Standards Codification
-Section 50
-Paragraph 1
-Subparagraph (d)(i)
-Publisher FASB
-URI https://asc.fasb.org//1943274/2147480506/715-20-50-1
Reference 5: http://www.xbrl.org/2003/role/disclosureRef
-Topic 715
-SubTopic 20
-Name Accounting Standards Codification
-Section 50
-Paragraph 1
-Subparagraph (q)
-Publisher FASB
-URI https://asc.fasb.org//1943274/2147480506/715-20-50-1
Reference 6: http://www.xbrl.org/2003/role/disclosureRef
-Topic 715
-SubTopic 20
-Name Accounting Standards Codification
-Section 50
-Paragraph 1
-Subparagraph (l)
-Publisher FASB
-URI https://asc.fasb.org//1943274/2147480506/715-20-50-1
Reference 7: http://www.xbrl.org/2003/role/disclosureRef
-Topic 715
-Name Accounting Standards Codification
-Publisher FASB
-URI https://asc.fasb.org//715/tableOfContent
Reference 8: http://www.xbrl.org/2003/role/disclosureRef
-Topic 715
-SubTopic 20
-Name Accounting Standards Codification
-Section 50
-Paragraph 1
-Subparagraph (d)(iii)
-Publisher FASB
-URI https://asc.fasb.org//1943274/2147480506/715-20-50-1
Reference 9: http://www.xbrl.org/2003/role/disclosureRef
-Topic 715
-SubTopic 20
-Name Accounting Standards Codification
-Section 50
-Paragraph 1
-Subparagraph (o)
-Publisher FASB
-URI https://asc.fasb.org//1943274/2147480506/715-20-50-1
Reference 10: http://www.xbrl.org/2003/role/disclosureRef
-Topic 715
-SubTopic 20
-Name Accounting Standards Codification
-Section 50
-Paragraph 1
-Subparagraph (p)
-Publisher FASB
-URI https://asc.fasb.org//1943274/2147480506/715-20-50-1
Reference 11: http://www.xbrl.org/2003/role/disclosureRef
-Topic 715
-SubTopic 20
-Name Accounting Standards Codification
-Section 50
-Paragraph 1
-Subparagraph (r)(1)
-Publisher FASB
-URI https://asc.fasb.org//1943274/2147480506/715-20-50-1
Reference 12: http://www.xbrl.org/2003/role/disclosureRef
-Topic 715
-SubTopic 20
-Name Accounting Standards Codification
-Section 50
-Paragraph 1
-Subparagraph (r)(2)
-Publisher FASB
-URI https://asc.fasb.org//1943274/2147480506/715-20-50-1
Reference 13: http://www.xbrl.org/2003/role/disclosureRef
-Topic 715
-SubTopic 20
-Name Accounting Standards Codification
-Section S99
-Paragraph 2
-Publisher FASB
-URI https://asc.fasb.org//1943274/2147480126/715-20-S99-2
Reference 14: http://www.xbrl.org/2003/role/disclosureRef
-Topic 715
-SubTopic 60
-Name Accounting Standards Codification
-Section 50
-Paragraph 3
-Subparagraph (c)
-Publisher FASB
-URI https://asc.fasb.org//1943274/2147480266/715-60-50-3
| Name: |
us-gaap_PensionAndOtherPostretirementBenefitsDisclosureTextBlock |
| Namespace Prefix: |
us-gaap_ |
| Data Type: |
dtr-types:textBlockItemType |
| Balance Type: |
na |
| Period Type: |
duration |
|
v3.23.3
Stock-Based Compensation Plans
|
9 Months Ended |
Sep. 30, 2023 |
|---|
| Share-Based Payment Arrangement [Abstract] |
|
| Stock-Based Compensation Plans |
Stock-Based Compensation Plans The Stock Incentive Plans, which consists of the Amended and Restated 2018 Stock Incentive Plan of Resideo Technologies, Inc. and its Affiliates and the 2018 Stock Incentive Plan for Non-Employee Directors of Resideo Technologies, Inc., provide for the grant of stock options, stock appreciation rights, restricted stock units, restricted stock, and other stock-based awards.
During the second quarter of 2023, the Amended and Restated 2018 Stock Incentive Plan of Resideo Technologies, Inc. and its Affiliates was further amended to increase the number of shares of our common stock available for issuance by 3.5 million shares for an aggregate of 19.5 million shares with no more than 7.5 million shares being available for grant in the form of stock options.
A summary of awards granted as part of our annual long-term compensation follows: | | | | | | | | | | | | | | | | | | | | | | | | | Nine Months Ended September 30, 2023 | | Nine Months Ended October 1, 2022 | | Number of Stock Units Granted | | Weighted average grant date fair value per share | | Number of Stock Units Granted | | Weighted average grant date fair value per share | Performance Stock Units (“PSUs”) | 553,071 | | $ | 29.89 | | | 669,551 | | $ | 36.11 | | Restricted Stock Units (“RSUs”) | 2,232,465 | | $ | 18.85 | | | 1,711,282 | | $ | 22.68 | |
Annual RSU awards to our key employees generally have a three-year service or performance period. RSU awards to our non-employee directors have a one-year service period. The fair value is determined at the grant date. PSUs granted in 2023 were issued with the shares awarded per unit being based on the difference in performance between the total stockholders’ return of our common stock against that of the S&P 600 Industrials Index. PSUs granted prior to 2023 were issued with the shares awarded per unit being based on the difference in performance between the total stockholders’ return of our common stock against that of the S&P 400 Industrials Index.
Stock-based compensation expense, net of tax was $11 million and $36 million for the three and nine months ended September 30, 2023, respectively. For the three and nine months ended October 1, 2022, stock-based compensation expense, net of tax was $13 million and $36 million, respectively.
|
| X |
- DefinitionThe entire disclosure for share-based payment arrangement. Reference 1: http://www.xbrl.org/2003/role/exampleRef
-Topic 718
-SubTopic 10
-Name Accounting Standards Codification
-Section 50
-Paragraph 2
-Subparagraph (a)(1)
-Publisher FASB
-URI https://asc.fasb.org//1943274/2147480429/718-10-50-2
Reference 2: http://www.xbrl.org/2003/role/disclosureRef
-Topic 718
-Name Accounting Standards Codification
-Publisher FASB
-URI https://asc.fasb.org//718/tableOfContent
Reference 3: http://www.xbrl.org/2003/role/disclosureRef
-Topic 718
-SubTopic 10
-Name Accounting Standards Codification
-Section 50
-Paragraph 2
-Subparagraph (a)
-Publisher FASB
-URI https://asc.fasb.org//1943274/2147480429/718-10-50-2
Reference 4: http://www.xbrl.org/2003/role/disclosureRef
-Topic 718
-SubTopic 10
-Name Accounting Standards Codification
-Section 50
-Paragraph 2
-Subparagraph (h)(2)
-Publisher FASB
-URI https://asc.fasb.org//1943274/2147480429/718-10-50-2
Reference 5: http://www.xbrl.org/2003/role/disclosureRef
-Topic 718
-SubTopic 10
-Name Accounting Standards Codification
-Section 50
-Paragraph 2
-Subparagraph (h)(2)(i)
-Publisher FASB
-URI https://asc.fasb.org//1943274/2147480429/718-10-50-2
Reference 6: http://www.xbrl.org/2003/role/disclosureRef
-Topic 718
-SubTopic 10
-Name Accounting Standards Codification
-Section 50
-Paragraph 2
-Subparagraph (l)
-Publisher FASB
-URI https://asc.fasb.org//1943274/2147480429/718-10-50-2
| Name: |
us-gaap_DisclosureOfCompensationRelatedCostsShareBasedPaymentsTextBlock |
| Namespace Prefix: |
us-gaap_ |
| Data Type: |
dtr-types:textBlockItemType |
| Balance Type: |
na |
| Period Type: |
duration |
|
v3.23.3
Inventories, net
|
9 Months Ended |
Sep. 30, 2023 |
|---|
| Inventory Disclosure [Abstract] |
|
| Inventories, net |
Inventories, net The following table summarizes the details of our inventories, net:
| | | | | | | | | | | | | | | | (in millions) | | September 30, 2023 | | December 31, 2022 | | Raw materials | | $ | 229 | | | $ | 251 | | | Work in process | | 21 | | | 25 | | | Finished products | | 720 | | | 699 | | | | | | | | | | | | | Total inventories, net | | $ | 970 | | | $ | 975 | |
|
| X |
- References
+ Details
| Name: |
us-gaap_InventoryDisclosureAbstract |
| Namespace Prefix: |
us-gaap_ |
| Data Type: |
xbrli:stringItemType |
| Balance Type: |
na |
| Period Type: |
duration |
|
| X |
- DefinitionThe entire disclosure for inventory. Includes, but is not limited to, the basis of stating inventory, the method of determining inventory cost, the classes of inventory, and the nature of the cost elements included in inventory. Reference 1: http://www.xbrl.org/2003/role/disclosureRef
-Topic 330
-Name Accounting Standards Codification
-Publisher FASB
-URI https://asc.fasb.org//330/tableOfContent
| Name: |
us-gaap_InventoryDisclosureTextBlock |
| Namespace Prefix: |
us-gaap_ |
| Data Type: |
dtr-types:textBlockItemType |
| Balance Type: |
na |
| Period Type: |
duration |
|
v3.23.3
Goodwill and Intangible Assets, net
|
9 Months Ended |
Sep. 30, 2023 |
|---|
| Goodwill and Intangible Assets Disclosure [Abstract] |
|
| Goodwill and Intangible Assets, net |
Goodwill and Intangible Assets, net Our goodwill balance and changes in carrying value by segment are as follows:
| | | | | | | | | | | | | | | | | | | (in millions) | Products and Solutions | | ADI Global Distribution | | Total | Balance at December 31, 2022 | $ | 2,072 | | | $ | 652 | | | $ | 2,724 | | | Acquisitions | 10 | | | 3 | | | 13 | | Adjustments(1) | (42) | | | — | | | (42) | | | | | | | | | | | | | | | Impact of foreign currency translation | (6) | | | (2) | | | (8) | | | Balance at September 30, 2023 | $ | 2,034 | | | $ | 653 | | | $ | 2,687 | |
(1) Primarily relates to the divestiture of our Genesis business as discussed in Note 1. Nature of Operations and Basis of Presentation.
The following table summarizes the net carrying amount of intangible assets:
| | | | | | | | | | | | | (in millions) | September 30, 2023 | | December 31, 2022 | | Intangible assets subject to amortization | $ | 276 | | | $ | 295 | | | Indefinite-lived intangible assets | 180 | | | 180 | | | Total intangible assets | $ | 456 | | | $ | 475 | |
Intangible assets subject to amortization consisted of the following:
| | | | | | | | | | | | | | | | | | | | | | | | | | | | | | | | | | | | | | | | | September 30, 2023 | | December 31, 2022 | | | | | | (in millions) | Gross
Carrying
Amount | | Accumulated
Amortization | | Net
Carrying
Amount | | Gross
Carrying
Amount | | Accumulated
Amortization | | Net
Carrying
Amount | | | | | | Patents and technology | $ | 57 | | | $ | (23) | | | $ | 34 | | | $ | 65 | | | $ | (28) | | | $ | 37 | | | | | | | Customer relationships | 311 | | | (129) | | | 182 | | | 313 | | | (117) | | | 196 | | | | | | | Trademarks | 8 | | | (8) | | | — | | | 14 | | | (8) | | | 6 | | | | | | | Software | 187 | | | (127) | | | 60 | | | 175 | | | (119) | | | 56 | | | | | | | Intangible assets subject to amortization | $ | 563 | | | $ | (287) | | | $ | 276 | | | $ | 567 | | | $ | (272) | | | $ | 295 | | | | | |
|
| X |
- References
+ Details
| Name: |
us-gaap_GoodwillAndIntangibleAssetsDisclosureAbstract |
| Namespace Prefix: |
us-gaap_ |
| Data Type: |
xbrli:stringItemType |
| Balance Type: |
na |
| Period Type: |
duration |
|
| X |
- DefinitionThe entire disclosure for goodwill and intangible assets. Reference 1: http://fasb.org/us-gaap/role/ref/legacyRef
-Topic 350
-Name Accounting Standards Codification
-Publisher FASB
-URI https://asc.fasb.org//350/tableOfContent
| Name: |
us-gaap_GoodwillAndIntangibleAssetsDisclosureTextBlock |
| Namespace Prefix: |
us-gaap_ |
| Data Type: |
dtr-types:textBlockItemType |
| Balance Type: |
na |
| Period Type: |
duration |
|
v3.23.3
Leases
|
9 Months Ended |
Sep. 30, 2023 |
|---|
| Leases [Abstract] |
|
| Leases |
Leases Total operating lease costs are as follows:
| | | | | | | | | | | | | | | | | | | | | | | | | Three Months Ended | | Nine Months Ended | | (in millions) | September 30, 2023 | | October 1, 2022 | | September 30, 2023 | | October 1, 2022 | | Operating lease costs | | | | | | | | | Cost of goods sold | $ | 5 | | | $ | 3 | | | $ | 15 | | | $ | 13 | | | Selling, general and administrative expenses | 14 | | | 13 | | | 43 | | | 38 | | | Total operating lease costs | $ | 19 | | | $ | 16 | | | $ | 58 | | | $ | 51 | |
Total operating lease costs include variable lease costs of $6 million and $18 million for the three and nine months ended September 30, 2023, respectively. For the three and nine months ended October 1, 2022, total operating lease costs include variable lease costs of $6 million and $15 million, respectively.
The following table summarizes the carrying amounts of our operating lease assets and liabilities:
| | | | | | | | | | | | | | | | | | | (in millions) | Financial Statement Line Item | | September 30, 2023 | | December 31, 2022 | | Operating lease assets | Other assets | | $ | 197 | | | $ | 191 | | | Operating lease liabilities - current | Accrued liabilities | | $ | 36 | | | $ | 37 | | | Operating lease liabilities - non-current | Other liabilities | | $ | 174 | | | $ | 166 | | | | | | | | | | | | | |
Supplemental cash flow information related to operating leases was as follows:
| | | | | | | | | | | | | | | Nine Months Ended | | (in millions) | September 30, 2023 | | October 1, 2022 | | | | Cash paid for operating lease liabilities | $ | 27 | | | $ | 25 | | | | | Non-cash activities: operating lease assets obtained in exchange for new operating lease liabilities | $ | 37 | | | $ | 84 | | | |
|
| X |
- References
+ Details
| Name: |
us-gaap_LeasesAbstract |
| Namespace Prefix: |
us-gaap_ |
| Data Type: |
xbrli:stringItemType |
| Balance Type: |
na |
| Period Type: |
duration |
|
| X |
- DefinitionThe entire disclosure for operating leases of lessee. Includes, but is not limited to, description of operating lease and maturity analysis of operating lease liability. Reference 1: http://www.xbrl.org/2003/role/disclosureRef
-Topic 842
-SubTopic 20
-Name Accounting Standards Codification
-Publisher FASB
-URI https://asc.fasb.org//842-20/tableOfContent
| Name: |
us-gaap_LesseeOperatingLeasesTextBlock |
| Namespace Prefix: |
us-gaap_ |
| Data Type: |
dtr-types:textBlockItemType |
| Balance Type: |
na |
| Period Type: |
duration |
|
v3.23.3
Long-Term Debt
|
9 Months Ended |
Sep. 30, 2023 |
|---|
| Debt Disclosure [Abstract] |
|
| Long-Term Debt |
Long-Term Debt Long-term debt is comprised of the following:
| | | | | | | | | | | | | | | (in millions) | September 30, 2023 | | December 31, 2022 | | | | | 4.000% Senior Notes due 2029 | $ | 300 | | | $ | 300 | | | | | | | | | | | Variable rate A&R Term B Facility | 1,123 | | | 1,131 | | | | | | | Gross debt | 1,423 | | | 1,431 | | | Less: current portion of long-term debt | (12) | | | (12) | | | Less: unamortized deferred financing costs | (14) | | | (15) | | | Total long-term debt | $ | 1,397 | | | $ | 1,404 | |
A&R Senior Credit Facilities
On February 12, 2021, we entered into an Amendment and Restatement Agreement with JP Morgan Chase Bank N.A. as administrative agent (the “A&R Credit Agreement”). The A&R Credit Agreement provides for (i) an initial seven-year senior secured Term B loan facility in an aggregate principal amount of $950 million, which was later amended to add $200 million in additional term loans (the “A&R Term B Facility”) and (ii) a five-year senior secured revolving credit facility in an aggregate principal amount of $500 million (the “A&R Revolving Credit Facility” and, together with the A&R Term B Facility, the “A&R Senior Credit Facilities”).
The A&R Senior Credit Facilities contain customary LIBOR replacement language, including, but not limited to, the use of rates based on secured overnight financing rate (“SOFR”), which is a broad measure of the cost of borrowing cash overnight collateralized by U.S. Treasury securities in the repurchase agreement market and is administered by the Federal Reserve Bank of New York. On June 30, 2023, we modified the calculation of interest under the A&R Senior Credit Facilities from being calculated based on LIBOR to being calculated based on SOFR. Therefore, the A&R Senior Credit Facilities bears interest at a rate per annum of Term SOFR plus a credit spread adjustment of 10 basis points for the A&R Revolving Credit Facility and varying credit spread adjustments for the A&R Term B Facility, based on the tenor of each individual borrowing. No other material terms of the A&R Senior Credit Facilities were amended.
At September 30, 2023 and December 31, 2022, the weighted average interest rate for the A&R Term B Facility, excluding the effect of the interest rate swaps, was 7.69% and 6.78%, respectively, and there were no borrowings and no letters of credit issued under the A&R Revolving Credit Facility. As of September 30, 2023, we were in compliance with all covenants related to the A&R Senior Credit Facilities.
We entered into certain interest rate swap agreements in March 2021, which were amended in June 2023, to transition from a hedge of LIBOR-based cash flows to a hedge of SOFR-based cash flows. These interest rate swap agreements effectively convert a portion of our variable-rate debt to fixed rate debt. Refer to Note 13. Derivative Financial Instruments for further discussion.
Refer to Note 11. Long-Term Debt in our 2022 Annual Report on Form 10-K for further discussion.
|
| X |
- References
+ Details
| Name: |
us-gaap_DebtDisclosureAbstract |
| Namespace Prefix: |
us-gaap_ |
| Data Type: |
xbrli:stringItemType |
| Balance Type: |
na |
| Period Type: |
duration |
|
| X |
- DefinitionThe entire disclosure for information about short-term and long-term debt arrangements, which includes amounts of borrowings under each line of credit, note payable, commercial paper issue, bonds indenture, debenture issue, own-share lending arrangements and any other contractual agreement to repay funds, and about the underlying arrangements, rationale for a classification as long-term, including repayment terms, interest rates, collateral provided, restrictions on use of assets and activities, whether or not in compliance with debt covenants, and other matters important to users of the financial statements, such as the effects of refinancing and noncompliance with debt covenants. Reference 1: http://www.xbrl.org/2003/role/disclosureRef
-Topic 470
-SubTopic 20
-Name Accounting Standards Codification
-Section 50
-Paragraph 1B
-Subparagraph (h)
-Publisher FASB
-URI https://asc.fasb.org//1943274/2147481139/470-20-50-1B
Reference 2: http://www.xbrl.org/2003/role/disclosureRef
-Topic 235
-SubTopic 10
-Name Accounting Standards Codification
-Section S99
-Paragraph 1
-Subparagraph (SX 210.4-08(c))
-Publisher FASB
-URI https://asc.fasb.org//1943274/2147480678/235-10-S99-1
Reference 3: http://fasb.org/us-gaap/role/ref/legacyRef
-Topic 470
-Name Accounting Standards Codification
-Publisher FASB
-URI https://asc.fasb.org//470/tableOfContent
Reference 4: http://www.xbrl.org/2003/role/disclosureRef
-Topic 470
-SubTopic 20
-Name Accounting Standards Codification
-Section 50
-Paragraph 1B
-Publisher FASB
-URI https://asc.fasb.org//1943274/2147481139/470-20-50-1B
Reference 5: http://www.xbrl.org/2003/role/disclosureRef
-Topic 470
-SubTopic 20
-Name Accounting Standards Codification
-Section 50
-Paragraph 1B
-Subparagraph (g)
-Publisher FASB
-URI https://asc.fasb.org//1943274/2147481139/470-20-50-1B
Reference 6: http://www.xbrl.org/2003/role/disclosureRef
-Topic 470
-SubTopic 20
-Name Accounting Standards Codification
-Section 50
-Paragraph 1B
-Subparagraph (i)
-Publisher FASB
-URI https://asc.fasb.org//1943274/2147481139/470-20-50-1B
Reference 7: http://www.xbrl.org/2003/role/disclosureRef
-Topic 470
-SubTopic 20
-Name Accounting Standards Codification
-Section 50
-Paragraph 1C
-Subparagraph (a)
-Publisher FASB
-URI https://asc.fasb.org//1943274/2147481139/470-20-50-1C
Reference 8: http://www.xbrl.org/2003/role/disclosureRef
-Topic 470
-SubTopic 20
-Name Accounting Standards Codification
-Section 50
-Paragraph 1C
-Subparagraph (b)
-Publisher FASB
-URI https://asc.fasb.org//1943274/2147481139/470-20-50-1C
Reference 9: http://www.xbrl.org/2003/role/disclosureRef
-Topic 470
-SubTopic 20
-Name Accounting Standards Codification
-Section 50
-Paragraph 1C
-Subparagraph (c)
-Publisher FASB
-URI https://asc.fasb.org//1943274/2147481139/470-20-50-1C
Reference 10: http://www.xbrl.org/2003/role/disclosureRef
-Topic 470
-SubTopic 20
-Name Accounting Standards Codification
-Section 50
-Paragraph 1E
-Subparagraph (b)
-Publisher FASB
-URI https://asc.fasb.org//1943274/2147481139/470-20-50-1E
Reference 11: http://www.xbrl.org/2003/role/disclosureRef
-Topic 470
-SubTopic 20
-Name Accounting Standards Codification
-Section 50
-Paragraph 1I
-Subparagraph (a)
-Publisher FASB
-URI https://asc.fasb.org//1943274/2147481139/470-20-50-1I
Reference 12: http://www.xbrl.org/2003/role/disclosureRef
-Topic 470
-SubTopic 20
-Name Accounting Standards Codification
-Section 50
-Paragraph 1I
-Subparagraph (b)
-Publisher FASB
-URI https://asc.fasb.org//1943274/2147481139/470-20-50-1I
Reference 13: http://www.xbrl.org/2003/role/disclosureRef
-Topic 470
-SubTopic 20
-Name Accounting Standards Codification
-Section 50
-Paragraph 1I
-Subparagraph (d)
-Publisher FASB
-URI https://asc.fasb.org//1943274/2147481139/470-20-50-1I
| Name: |
us-gaap_DebtDisclosureTextBlock |
| Namespace Prefix: |
us-gaap_ |
| Data Type: |
dtr-types:textBlockItemType |
| Balance Type: |
na |
| Period Type: |
duration |
|
v3.23.3
Derivative Financial Instruments
|
9 Months Ended |
Sep. 30, 2023 |
|---|
| Derivative Instruments and Hedging Activities Disclosure [Abstract] |
|
| Derivative Financial Instruments |
Derivative Financial InstrumentsIn March 2021, we entered into eight interest rate swap agreements (“Swap Agreements”) with several financial institutions for a combined notional value of $560 million. The Swap Agreements were entered into to reduce the consolidated interest rate risk associated with variable rate, long-term debt. In March and April 2023, we modified two of the eight Swap Agreements, each with a notional value of $70 million that matures in May 2024 as follows: (i) the original interest rate swap agreements were cancelled for no termination payment and (ii) we simultaneously entered into new pay-fixed interest rate swap agreements with a notional amount of $70 million each, effectively blending the asset positions of the original interest rate swap agreements into new interest swap agreements and extending the term of our hedged positions to February 2027. In connection with these transactions, no cash was exchanged between us and the counterparty. The new pay-fixed interest rate swap agreements qualify as a hybrid instrument in accordance with Accounting Standards Codification 815, Derivatives and Hedging, consisting of financing components and embedded at-market derivatives that were designated as cash flow hedges. The amounts remaining in accumulated other comprehensive loss for the modified interest rate swap agreements as of September 30, 2023 were approximately $4 million in aggregate and are being amortized as a reduction to interest expense over the effective period of the original interest rate swap agreements, or May 2024. The financing components are accounted for at amortized cost over the life of the swap while the embedded at-market derivatives are accounted for at fair value.
On June 23, 2023, we amended the Swap Agreements to transition from a hedge of LIBOR-based cash flows to a hedge of SOFR-based cash flows. Under the amended Swap Agreements, we convert a portion of our variable interest rate obligations based on Term SOFR with a minimum rate of 0.39% per annum to a base fixed weighted average rate of 1.13% over the remaining terms. We designated the Swap Agreements as cash flow hedges of the variability in expected cash outflows for interest payments.
The Swap Agreements are adjusted to fair value on a quarterly basis. The fair value of each swap is presented within the Unaudited Consolidated Balance Sheets, and we recognize any changes in the fair value as an adjustment of accumulated other comprehensive loss within equity to the extent the swap is effective. As interest expense is accrued on the debt obligation, amounts in accumulated other comprehensive loss related to the Swap Agreements are reclassified into income resulting in a net interest expense on the hedged amount of the underlying debt obligation equal to the effective yield of the fixed rate of the swap.
The following table summarizes the fair value and presentation of derivative instruments in the Unaudited Consolidated Balance Sheets as well as the changes in fair value recorded in accumulated other comprehensive loss:
| | | | | | | | | | | | | | | | | | | Fair Value of Derivative Assets | | (in millions) | Financial Statement Line Item | | September 30, 2023 | | December 31, 2022 | | | | | | | | | | | | | | | | | | | | | | | | | | | | | | Derivatives designated as hedging instruments | | | | | | Interest rate swaps | Other current assets | | $ | 23 | | | $ | 23 | | | Interest rate swaps | Other assets | | 18 | | | 22 | | | Total derivative assets designated as hedging instruments | | $ | 41 | | | $ | 45 | | | | | | | | | | | | | | | | | | | | | | | | | | | | | | | | | | | | | | | | | | | | Unrealized gain | Accumulated other comprehensive loss | | $ | 38 | | | $ | 42 | |
The following table summarizes the effect of derivative instruments designated as cash flow hedges in other comprehensive income and the Unaudited Consolidated Statements of Operations:
| | | | | | | | | | | | | | | | | | | | | | | | | Three Months Ended | | Nine Months Ended | | (in millions) | September 30, 2023 | | October 1, 2022 | | September 30, 2023 | | October 1, 2022 | | Gains recorded in accumulated other comprehensive loss, beginning of period | $ | 40 | | | $ | 30 | | | $ | 42 | | | $ | 6 | | | Current period (loss) gain recognized in/reclassified from other comprehensive income | (2) | | | 14 | | | (4) | | | 38 | | | Gains recorded in accumulated other comprehensive loss, end of period | $ | 38 | | | $ | 44 | | | $ | 38 | | | $ | 44 | |
Unrealized gains expected to be reclassified from accumulated other comprehensive loss in the next 12 months are estimated to be $27 million as of September 30, 2023.
|
| X |
- References
+ Details
| Name: |
us-gaap_DerivativeInstrumentsAndHedgingActivitiesDisclosureAbstract |
| Namespace Prefix: |
us-gaap_ |
| Data Type: |
xbrli:stringItemType |
| Balance Type: |
na |
| Period Type: |
duration |
|
| X |
- DefinitionThe entire disclosure for derivative instruments and hedging activities including, but not limited to, risk management strategies, non-hedging derivative instruments, assets, liabilities, revenue and expenses, and methodologies and assumptions used in determining the amounts. Reference 1: http://www.xbrl.org/2003/role/disclosureRef
-Topic 815
-SubTopic 40
-Name Accounting Standards Codification
-Section 50
-Paragraph 5
-Subparagraph (f)
-Publisher FASB
-URI https://asc.fasb.org//1943274/2147480237/815-40-50-5
Reference 2: http://www.xbrl.org/2003/role/disclosureRef
-Topic 815
-SubTopic 10
-Name Accounting Standards Codification
-Section 50
-Paragraph 5C
-Subparagraph (b)
-Publisher FASB
-URI https://asc.fasb.org//1943274/2147480434/815-10-50-5C
Reference 3: http://fasb.org/us-gaap/role/ref/legacyRef
-Topic 815
-Name Accounting Standards Codification
-Publisher FASB
-URI https://asc.fasb.org//815/tableOfContent
| Name: |
us-gaap_DerivativeInstrumentsAndHedgingActivitiesDisclosureTextBlock |
| Namespace Prefix: |
us-gaap_ |
| Data Type: |
dtr-types:textBlockItemType |
| Balance Type: |
na |
| Period Type: |
duration |
|
v3.23.3
Fair Value
|
9 Months Ended |
Sep. 30, 2023 |
|---|
| Fair Value Disclosures [Abstract] |
|
| Fair Value |
Fair Value The estimated fair value of our financial instruments held, and when applicable, issued to finance our operations, is summarized below. Certain estimates and judgments were required to develop the fair value amounts. The fair value amounts shown below are not necessarily indicative of the amounts that we would realize upon disposition, nor do they indicate our intent or ability to dispose of the financial instrument. Assets and liabilities that are carried at fair value are required to be classified and disclosed in one of the following three categories:
Level 1—quoted market prices in active markets for identical assets and liabilities Level 2—observable market-based inputs or unobservable inputs that are corroborated by market data Level 3—unobservable inputs that are not corroborated by market data
Financial and non-financial assets and liabilities are classified in their entirety based on the lowest level of input that is significant to the fair value measurement. There were no changes in the methodologies used in our valuation practices as of September 30, 2023.
The fair values of long-term debt instruments were determined using quoted market prices in inactive markets or discounted cash flows based upon current observable market interest rates and therefore were classified as Level 2 measurements in the fair value hierarchy.
The following table provides a summary of the carrying amount and fair value of outstanding debt:
| | | | | | | | | | | | | | | | | | | | | | | | | September 30, 2023 | | December 31, 2022 | | (in millions) | Carrying Value | | Fair Value | | Carrying Value | | Fair Value | | Debt | | | | | | | | 4.000% Senior Notes due 2029 | $ | 300 | | | $ | 246 | | | $ | 300 | | | $ | 242 | | | Variable rate A&R Term B Facility | 1,123 | | | 1,127 | | | 1,131 | | | 1,125 | | | Total debt | $ | 1,423 | | | $ | 1,373 | | | $ | 1,431 | | | $ | 1,367 | |
Refer to Note 12. Long-Term Debt to the Unaudited Consolidated Financial Statements for further discussion.
Interest Rate Risk—We have exposure to movements in interest rates associated with cash and borrowings. We have entered, and in the future may enter, into various interest rate protection agreements in order to limit the impact of movements in interest rates. The fair values of interest rate swaps have been determined based on market value equivalents at the balance sheet date, taking into account the current interest rate environment and therefore, were classified as Level 2 measurements in the fair value hierarchy.
The following table provides a summary of the carrying amount and fair value of our interest rate swaps:
| | | | | | | | | | | | | | | | | | | | | | | | | | | | | September 30, 2023 | | December 31, 2022 | | (in millions) | Carrying Value | | | | Fair Value | | Carrying Value | | | | Fair Value | | Assets: | | | | | | | | | | | | | Interest rate swaps | $ | 41 | | | | | $ | 41 | | | $ | 45 | | | | | $ | 45 | | | | | | | | | | | | | | | | | | | | | | | | | | | | | | | | | | | | | |
Refer to Note 13. Derivative Financial Instruments to the Unaudited Consolidated Financial Statements for further discussion. There are no Level 1 or Level 3 assets or liabilities for the periods presented. The carrying amounts of cash and cash equivalents, accounts receivable, other current assets, accounts payable, accrued and other liabilities approximate fair value because of the short-term maturity of these amounts.
|
| X |
- References
+ Details
| Name: |
us-gaap_FairValueDisclosuresAbstract |
| Namespace Prefix: |
us-gaap_ |
| Data Type: |
xbrli:stringItemType |
| Balance Type: |
na |
| Period Type: |
duration |
|
| X |
- DefinitionThe entire disclosure for financial instruments. This disclosure includes, but is not limited to, fair value measurements of short and long term marketable securities, international currencies forward contracts, and auction rate securities. Financial instruments may include hedging and non-hedging currency exchange instruments, derivatives, securitizations and securities available for sale at fair value. Also included are investment results, realized and unrealized gains and losses as well as impairments and risk management disclosures.
| Name: |
us-gaap_FinancialInstrumentsDisclosureTextBlock |
| Namespace Prefix: |
us-gaap_ |
| Data Type: |
dtr-types:textBlockItemType |
| Balance Type: |
na |
| Period Type: |
duration |
|
v3.23.3
Accrued Liabilities
|
9 Months Ended |
Sep. 30, 2023 |
|---|
| Payables and Accruals [Abstract] |
|
| Accrued Liabilities |
Accrued Liabilities Accrued liabilities consist of the following:
| | | | | | | | | | | | | | | (in millions) | September 30, 2023 | | December 31, 2022 | | Obligations payable under Indemnification Agreements | $ | 140 | | | $ | 140 | | | Compensation, benefit and other employee-related | 100 | | | 108 | | | Customer rebate reserve | 92 | | | 98 | | Restructuring | 41 | | | 27 | | | Current operating lease liability | 36 | | | 37 | | Held for sale (1) | 31 | | | — | | | Product warranties | 24 | | | 40 | | | Taxes payable | 17 | | | 38 | | Other (2) | 111 | | | 152 | | | Total accrued liabilities | $ | 592 | | | $ | 640 | |
(1) Relates to the divestiture of our Genesis business as discussed in Note 1. Nature of Operations and Basis of Presentation. (2) Other includes accruals for advertising, legal and professional reserves, freight, royalties, interest, and other miscellaneous items.
The Indemnification Agreements are further described in Note 16. Commitments and Contingencies to the Unaudited Consolidated Financial Statements.
|
| X |
- DefinitionThe entire disclosure for accounts payable and accrued liabilities at the end of the reporting period. Reference 1: http://fasb.org/us-gaap/role/ref/legacyRef
-Name Accounting Standards Codification
-Topic 210
-SubTopic 10
-Section S99
-Paragraph 1
-Subparagraph (SX 210.5-02.19(a),20,24)
-Publisher FASB
-URI https://asc.fasb.org//1943274/2147480566/210-10-S99-1
| Name: |
us-gaap_AccountsPayableAndAccruedLiabilitiesDisclosureTextBlock |
| Namespace Prefix: |
us-gaap_ |
| Data Type: |
dtr-types:textBlockItemType |
| Balance Type: |
na |
| Period Type: |
duration |
|
| X |
- References
+ Details
| Name: |
us-gaap_PayablesAndAccrualsAbstract |
| Namespace Prefix: |
us-gaap_ |
| Data Type: |
xbrli:stringItemType |
| Balance Type: |
na |
| Period Type: |
duration |
|
v3.23.3
Commitments and Contingencies
|
9 Months Ended |
Sep. 30, 2023 |
|---|
| Commitments and Contingencies Disclosure [Abstract] |
|
| Commitments and Contingencies |
Commitments and Contingencies Environmental Matters
We are subject to various federal, state, local, and foreign government requirements relating to the protection of the environment and accrue costs related to environmental matters when it is probable that we have incurred a liability related to a contaminated site and the amount can be reasonably estimated. We believe that, as a general matter, our policies, practices and procedures are properly designed to prevent unreasonable risk of environmental damage and personal injury and that our handling, manufacture, use and disposal of hazardous substances are in accordance with environmental and safety laws and regulations. We have incurred remedial response and voluntary cleanup costs for site contamination and are a party to claims associated with environmental and safety matters, including products containing hazardous substances. Additional claims and costs involving environmental matters are likely to continue to arise in the future.
Environment-related expenses for sites owned and operated by us are presented within cost of goods sold for operating sites. For the three and nine months ended September 30, 2023 and October 1, 2022, environmental expenses related to these operating sites were not material. Liabilities for environmental costs were $22 million at September 30, 2023 and December 31, 2022.
Obligations Payable Under Indemnification Agreements
The Reimbursement Agreement and the Tax Matters Agreement (collectively, the “Indemnification Agreements”) are further described below.
Reimbursement Agreement
We separated from Honeywell International Inc. (“Honeywell”) on October 29, 2018, becoming an independent publicly traded company as a result of a pro rata distribution of our common stock to shareholders of Honeywell (the “Spin-off”). In connection with the Spin-Off, we entered into the Reimbursement Agreement, pursuant to which we have an obligation to make cash payments to Honeywell in amounts equal to 90% of payments for certain Honeywell environmental-liability payments, which include amounts billed (payments), less 90% of Honeywell’s net insurance receipts relating to such liabilities, and less 90% of the net proceeds received by Honeywell in connection with (i) affirmative claims relating to such liabilities, (ii) contributions by other parties relating to such liabilities and (iii) certain property sales (the recoveries). While the amount payable by us in respect of such liabilities arising in any given year is subject to a cap of $140 million under the Reimbursement Agreement, the estimated liability for resolution of pending and future environmental-related liabilities recorded on our balance sheets are calculated as if we were responsible for 100% of the environmental-liability payments associated with certain sites. Refer to Note 15. Commitments and Contingencies in our 2022 Annual Report on Form 10-K for further discussion.
Tax Matters Agreement
In connection with the Spin-Off, we entered into the Tax Matters Agreement with Honeywell, pursuant to which we are responsible and will indemnify Honeywell for certain taxes, including certain income taxes, sales taxes, VAT and payroll taxes, relating to the business for all periods, including periods prior to the consummation of the Spin-Off. In addition, the Tax Matters Agreement addresses the allocation of liability for taxes that are incurred as a result of restructuring activities undertaken to effectuate the Spin-Off.
We are required to indemnify Honeywell for any taxes resulting from the failure of the Spin-Off and related internal transactions to qualify for their intended tax treatment under U.S. federal, state and local income tax law, as well as foreign tax law, where such taxes result from our action or omission not permitted by the Separation and Distribution Agreement between Honeywell and Resideo dated as of October 19, 2018 or the Tax Matters Agreement.
The following table summarizes information concerning the Reimbursement and Tax Matter Agreements’ liabilities:
| | | | | | | | | | | | | | | | | | | (in millions) | Reimbursement Agreement | | Tax Matters Agreement | | Total | | Balance as of December 31, 2022 | $ | 614 | | | $ | 106 | | | $ | 720 | | Accruals for liabilities deemed probable and reasonably estimable (1) | 128 | | | (4) | | | 124 | | | Payments to Honeywell | (105) | | | — | | | (105) | | | Balance as of September 30, 2023 | $ | 637 | | | $ | 102 | | | $ | 739 | |
(1) Reimbursement Agreement liabilities deemed probable and reasonably estimable; however, it is possible we could pay $140 million per year (exclusive of any late payment fees up to 5% per annum) until the earlier of (1) December 31, 2043; or (2) December 31 of the third consecutive year during which the annual reimbursement obligation (including in respect of deferred payment amounts) has been less than $25 million.
The liabilities related to the Reimbursement and Tax Matters Agreements are included in the following balance sheet accounts:
| | | | | | | | | | | | | (in millions) | September 30, 2023 | | December 31, 2022 | | Accrued liabilities | $ | 140 | | | $ | 140 | | | Obligations payable under Indemnification Agreements | 599 | | | 580 | | | Total indemnification liabilities | $ | 739 | | | $ | 720 | |
For the three and nine months ended September 30, 2023, net expenses related to the Reimbursement Agreement were $43 million and $128 million, respectively, and for the three and nine months ended October 1, 2022, net expenses related to the Reimbursement Agreement were $30 million and $116 million, respectively, and are recorded in other expense, net.
We do not currently possess sufficient information to reasonably estimate the amounts of indemnification liabilities to be recorded upon future completion of studies, litigation or settlements, and neither the timing nor the amount of the ultimate costs associated with such indemnification liability payments can be determined although they could be material to our consolidated results of operations and operating cash flows in the periods recognized or paid.
Independent of our payments under the Reimbursement Agreement, we will have ongoing liability for certain environmental claims, which are part of our ongoing business.
Trademark Agreement
We entered into a 40-year Trademark Agreement with Honeywell that authorizes our use of the Honeywell Home trademark in the operation of our business for the advertising, sale and distribution of certain licensed products. In exchange, we pay Honeywell a royalty fee based on net revenue related to such licensed products, which is recorded in selling, general and administrative expense in the Unaudited Consolidated Statements of Operations. For the three and nine months ended September 30, 2023, royalty fees were $4 million and $13 million, respectively. For the three and nine months ended October 1, 2022, royalty fees were $7 million and $16 million, respectively.
Other Matters
We are subject to lawsuits, investigations and disputes arising out of the conduct of our business, including matters relating to commercial transactions, government contracts, product liability, acquisitions and divestitures, employee matters, intellectual property, and environmental, health, and safety matters. We recognize a liability for any contingency that is probable of occurrence and reasonably estimable. We continually assess the likelihood of adverse judgments or outcomes in these matters, as well as potential ranges of possible losses, based on a careful analysis of each matter with the assistance of outside legal counsel and, if applicable, other experts. No such matters are material to our financial statements. Refer to Note 15. Commitments and Contingencies in our 2022 Annual Report on Form 10-K for further discussion of these matters.
Certain current or former directors and officers were defendants in a consolidated derivative action, In re Resideo Technologies, Inc. Derivative Litigation (the “Consolidated Federal Derivative Action”), which was stayed pending entry of final judgment in the related securities litigation and Delaware Chancery derivative action. An additional suit was filed in the Court of Chancery of the State of Delaware in 2021 and not consolidated with the Consolidated Federal Derivative Action. On November 17, 2022, the parties executed a Confidential Term Sheet summarizing the agreed terms of a global settlement to resolve all of the pending lawsuits and derivative claims. Under the terms of the settlement, we agreed to implement or codify certain corporate governance reforms and reimburse the plaintiffs’ attorneys’ fees of up to $1.6 million. On February 3, 2023, the parties executed a definitive stipulation of settlement. The U.S. District Court for the District of Minnesota preliminarily approved the settlement, and a fairness hearing was held on June 22, 2023. The final settlement remains subject to, among other things, court approval. The settlement liability is included in the other accrued liabilities in the Unaudited Consolidated Balance Sheets, and the expected insurance recovery of approximately $0.6 million is included in accounts receivable, net.
On September 16, 2022, Salvatore Badalamenti (“Plaintiff”) filed a putative class action lawsuit (the “Badalamenti Lawsuit”) in the U.S. District Court for the District of New Jersey against Honeywell International Inc. and the Company. Plaintiff alleges, among other things, that the Company violated certain consumer protection laws by falsely advertising the Company’s combination-listed single data-bus burglar and fire alarms system control units (the “Products”) as conforming to Underwriters Laboratories, Inc. (the “UL”) or the National Fire Protection Association (“NFPA”) standards and/or failing to disclose such nonconformance. Plaintiff further alleges that the Products are defective because they do not conform to the UL and NFPA industry standards. Plaintiff does not allege that he, or anyone else, has experienced any adverse event due to the alleged product defect or that the Products did not work. Plaintiff alleges causes of action for violation of the New Jersey Consumer Fraud Act, fraud, negligent misrepresentation, breach of express and implied warranties, violation of the Magnuson-Moss Warranty Act, unjust enrichment, and violation of the Truth-in-Consumer Contract, Warranty, and Notice Act.
Plaintiff seeks to represent a putative class of other persons in the U.S. who purchased the Products. Plaintiff, on behalf of himself and the putative class, seeks damages in an unknown amount, which he describes as the cost to repair and/or replace the Products and/or the diminution in value of the Products.
We believe we have strong defenses against the allegations and claims asserted in the Badalamenti Lawsuit and our motion to dismiss Plaintiff's complaint was fully briefed on March 3, 2023. We continue to defend the matter vigorously; however, there can be no assurance that we will be successful in such defense. In light of the early stage of the Badalamenti Lawsuit, we are unable to estimate the total costs to defend the matter or the potential liability to us in the event that we are not successful in our defense.
On June 28, 2023, Lisset Tredo, a Company employee, filed a putative class action complaint in the San Diego County Superior Court on behalf of all non-exempt employees in California, in which she alleges violations by the Company of the California Labor Code related to sick leave pay, accurate wage statements, recordkeeping, and pay timing, and on August 28, 2023 she filed a first amended complaint adding a claim under the California Private Attorneys General Act (the “Tredo Lawsuit”). In the Tredo Lawsuit, Tredo seeks alleged unpaid wages, restitution, interest, statutory penalties, attorneys’ fees and costs in an unknown amount. The Company answered the Tredo lawsuit in which it asserted a general denial of plaintiff’s allegations and asserted various defenses.
We are investigating the allegations and defenses. The parties have agreed to attend mediation in January 2024 and to stay formal discovery pending the outcome of the mediation. If the case is not resolved at mediation, we intend to defend the matter vigorously; however, there can be no assurance that we will be successful in such defense. In light of the early stage of the Tredo Lawsuit, we are unable to estimate the total costs to defend the matter or the potential liability to us in the event that we are not successful in our defense.
Warranties and Guarantees
In the normal course of business, we issue product warranties and product performance guarantees. We accrue for the estimated cost of product warranties and product performance guarantees based on contract terms and historical experience at the time of sale. Adjustments to initial obligations for warranties and guarantees are made as changes to the obligations become reasonably estimable. Product warranties and product performance guarantees are included in accrued and other liabilities. The following table summarizes information concerning recorded obligations for product warranties and product performance guarantees:
| | | | | | | | | | | | | (in millions) | September 30, 2023 | | December 31, 2022 | | Beginning balance | $ | 48 | | | $ | 23 | | | Accruals for warranties/guarantees issued during the year | 19 | | | 30 | | | Adjustment of pre-existing warranties/guarantees | (2) | | | (2) | | | Settlement of warranty/guarantee claims | (32) | | | (17) | | | Reserve of acquired company at date of acquisition | — | | | 14 | | | Ending balance | $ | 33 | | | $ | 48 | |
|
| X |
- References
+ Details
| Name: |
us-gaap_CommitmentsAndContingenciesDisclosureAbstract |
| Namespace Prefix: |
us-gaap_ |
| Data Type: |
xbrli:stringItemType |
| Balance Type: |
na |
| Period Type: |
duration |
|
| X |
- DefinitionThe entire disclosure for commitments and contingencies. Reference 1: http://www.xbrl.org/2003/role/disclosureRef
-Topic 440
-SubTopic 10
-Name Accounting Standards Codification
-Section 50
-Paragraph 4
-Subparagraph (a)
-Publisher FASB
-URI https://asc.fasb.org//1943274/2147482648/440-10-50-4
Reference 2: http://www.xbrl.org/2009/role/commonPracticeRef
-Topic 450
-Name Accounting Standards Codification
-Publisher FASB
-URI https://asc.fasb.org//450/tableOfContent
Reference 3: http://www.xbrl.org/2003/role/disclosureRef
-Topic 954
-SubTopic 440
-Name Accounting Standards Codification
-Section 50
-Paragraph 1
-Subparagraph (a)
-Publisher FASB
-URI https://asc.fasb.org//1943274/2147480327/954-440-50-1
Reference 4: http://www.xbrl.org/2003/role/disclosureRef
-Topic 440
-SubTopic 10
-Name Accounting Standards Codification
-Section 50
-Paragraph 4
-Subparagraph (c)
-Publisher FASB
-URI https://asc.fasb.org//1943274/2147482648/440-10-50-4
Reference 5: http://fasb.org/us-gaap/role/ref/legacyRef
-Topic 440
-Name Accounting Standards Codification
-Publisher FASB
-URI https://asc.fasb.org//440/tableOfContent
| Name: |
us-gaap_CommitmentsAndContingenciesDisclosureTextBlock |
| Namespace Prefix: |
us-gaap_ |
| Data Type: |
dtr-types:textBlockItemType |
| Balance Type: |
na |
| Period Type: |
duration |
|
v3.23.3
Income Taxes
|
9 Months Ended |
Sep. 30, 2023 |
|---|
| Income Tax Disclosure [Abstract] |
|
| Income Taxes |
Income Taxes For interim periods, income tax is equal to the total of (1) year-to-date pretax income multiplied by the forecasted effective tax rate plus (2) tax expense items specific to the period. In situations where we expect to report losses and where we do not expect to receive tax benefits, we apply separate forecast effective tax rates to those jurisdictions rather than including them in the consolidated forecast effective tax rate.
For the three and nine months ended September 30, 2023, the net tax expense was $16 million and $84 million, respectively, and for the three and nine months ended October 1, 2022, net tax expense was $33 million and $104 million, respectively, and consists primarily of interim period tax expense based on year-to-date pretax income multiplied by our forecasted effective tax rate. In addition to items specific to the period, our income tax rate is impacted by the mix of earnings across the jurisdictions in which we operate, non-deductible expenses, and U.S. taxation of foreign earnings.
|
| X |
- DefinitionThe entire disclosure for income taxes. Disclosures may include net deferred tax liability or asset recognized in an enterprise's statement of financial position, net change during the year in the total valuation allowance, approximate tax effect of each type of temporary difference and carryforward that gives rise to a significant portion of deferred tax liabilities and deferred tax assets, utilization of a tax carryback, and tax uncertainties information. Reference 1: http://www.xbrl.org/2003/role/disclosureRef
-Topic 946
-SubTopic 20
-Name Accounting Standards Codification
-Section 50
-Paragraph 13
-Publisher FASB
-URI https://asc.fasb.org//1943274/2147480990/946-20-50-13
Reference 2: http://www.xbrl.org/2003/role/disclosureRef
-Topic 235
-SubTopic 10
-Name Accounting Standards Codification
-Section S99
-Paragraph 1
-Subparagraph (SX 210.4-08(h)(2))
-Publisher FASB
-URI https://asc.fasb.org//1943274/2147480678/235-10-S99-1
Reference 3: http://www.xbrl.org/2003/role/disclosureRef
-Topic 740
-Name Accounting Standards Codification
-Publisher FASB
-URI https://asc.fasb.org//740/tableOfContent
Reference 4: http://www.xbrl.org/2003/role/disclosureRef
-Topic 740
-SubTopic 10
-Name Accounting Standards Codification
-Section 50
-Paragraph 14
-Publisher FASB
-URI https://asc.fasb.org//1943274/2147482685/740-10-50-14
Reference 5: http://www.xbrl.org/2003/role/disclosureRef
-Topic 740
-SubTopic 10
-Name Accounting Standards Codification
-Section 50
-Paragraph 21
-Publisher FASB
-URI https://asc.fasb.org//1943274/2147482685/740-10-50-21
Reference 6: http://www.xbrl.org/2003/role/disclosureRef
-Topic 740
-SubTopic 270
-Name Accounting Standards Codification
-Section 50
-Paragraph 1
-Publisher FASB
-URI https://asc.fasb.org//1943274/2147482526/740-270-50-1
Reference 7: http://www.xbrl.org/2003/role/disclosureRef
-Topic 740
-SubTopic 10
-Name Accounting Standards Codification
-Section 50
-Paragraph 17
-Subparagraph (b)
-Publisher FASB
-URI https://asc.fasb.org//1943274/2147482685/740-10-50-17
Reference 8: http://www.xbrl.org/2003/role/disclosureRef
-Topic 740
-SubTopic 10
-Name Accounting Standards Codification
-Section S99
-Paragraph 1
-Subparagraph (SAB TOPIC 6.I.5.Q1)
-Publisher FASB
-URI https://asc.fasb.org//1943274/2147479360/740-10-S99-1
Reference 9: http://www.xbrl.org/2003/role/disclosureRef
-Topic 740
-SubTopic 10
-Name Accounting Standards Codification
-Section S99
-Paragraph 2
-Subparagraph (SAB Topic 11.C)
-Publisher FASB
-URI https://asc.fasb.org//1943274/2147479360/740-10-S99-2
Reference 10: http://www.xbrl.org/2003/role/disclosureRef
-Topic 740
-SubTopic 30
-Name Accounting Standards Codification
-Section 50
-Paragraph 2
-Subparagraph (a)
-Publisher FASB
-URI https://asc.fasb.org//1943274/2147482603/740-30-50-2
| Name: |
us-gaap_IncomeTaxDisclosureTextBlock |
| Namespace Prefix: |
us-gaap_ |
| Data Type: |
dtr-types:textBlockItemType |
| Balance Type: |
na |
| Period Type: |
duration |
|
v3.23.3
Earnings Per Share
|
9 Months Ended |
Sep. 30, 2023 |
|---|
| Earnings Per Share [Abstract] |
|
| Earnings Per Share |
Earnings Per Share The reconciliation of the numerator and denominator used for the computation of basic and diluted earnings per share follows: | | | | | | | | | | | | | | | | | | | | | | | | | Three Months Ended | | Nine Months Ended | | (in millions, except per share data) | September 30, 2023 | | October 1, 2022 | | September 30, 2023 | | October 1, 2022 | | Numerator for basic and diluted earnings per share: | | | | | | | | | | | | | | | | | | | | | | | | | Net income | $ | 21 | | | $ | 63 | | | $ | 128 | | | $ | 244 | | | | | | | | | | | Denominator for basic and diluted earnings per share: | | | | | | | | | Weighted average basic number of common shares outstanding | 147 | | | 146 | | | 147 | | | 145 | | | Plus: dilutive effect of common stock equivalents | 1 | | | 3 | | | 2 | | | 4 | | | Weighted average diluted number of common shares outstanding | 148 | | | 149 | | | 149 | | | 149 | | | | | | | | | | | Earnings per share: | | | | | | | | | | | | | | | | | | | | | | | | | | | | | | | | | Basic | $ | 0.14 | | | $ | 0.43 | | | $ | 0.87 | | | $ | 1.68 | | | | | | | | | | | | | | | | | | | | | | | | | | | | | | | | | | | Diluted | $ | 0.14 | | | $ | 0.42 | | | $ | 0.86 | | | $ | 1.64 | |
|
| X |
- References
+ Details
| Name: |
us-gaap_EarningsPerShareAbstract |
| Namespace Prefix: |
us-gaap_ |
| Data Type: |
xbrli:stringItemType |
| Balance Type: |
na |
| Period Type: |
duration |
|
| X |
- DefinitionThe entire disclosure for earnings per share. Reference 1: http://www.xbrl.org/2003/role/disclosureRef
-Topic 260
-SubTopic 10
-Name Accounting Standards Codification
-Section 50
-Paragraph 1
-Subparagraph (c)
-Publisher FASB
-URI https://asc.fasb.org//1943274/2147482662/260-10-50-1
Reference 2: http://www.xbrl.org/2003/role/disclosureRef
-Topic 260
-Name Accounting Standards Codification
-Publisher FASB
-URI https://asc.fasb.org//260/tableOfContent
Reference 3: http://www.xbrl.org/2003/role/disclosureRef
-Topic 260
-SubTopic 10
-Name Accounting Standards Codification
-Section 50
-Paragraph 2
-Publisher FASB
-URI https://asc.fasb.org//1943274/2147482662/260-10-50-2
Reference 4: http://www.xbrl.org/2003/role/disclosureRef
-Topic 260
-SubTopic 10
-Name Accounting Standards Codification
-Section 50
-Paragraph 3
-Publisher FASB
-URI https://asc.fasb.org//1943274/2147482662/260-10-50-3
| Name: |
us-gaap_EarningsPerShareTextBlock |
| Namespace Prefix: |
us-gaap_ |
| Data Type: |
dtr-types:textBlockItemType |
| Balance Type: |
na |
| Period Type: |
duration |
|
v3.23.3
Shareholders' Equity
|
9 Months Ended |
Sep. 30, 2023 |
|---|
| Stockholders' Equity Note [Abstract] |
|
| Shareholders' Equity |
Shareholders’ Equity On August 3, 2023, we announced that our Board of Directors authorized a share repurchase program for the repurchase of up to $150 million of our common stock over an unlimited time period (the “Share Repurchase Program”). Under the Share Repurchase Program, we may repurchase common stock from time-to-time through various methods, including in open market transactions, block trades, accelerated share repurchases, privately negotiated transactions, derivative transactions or otherwise, certain of which may be made pursuant to a trading plan meeting the requirements of Rule 10b5-1 under the Securities Exchange Act of 1934, as amended, in compliance with applicable state and federal securities laws. The Share Repurchase Program can be modified or terminated by our Board of Directors at any time.
The timing, as well as the number and value of common stock repurchased under the Share Repurchase Program, will be determined at our discretion and will depend on a variety of factors, including our assessment of the intrinsic value and market price of our common stock, general market and economic conditions, available liquidity, compliance with our debt and other agreements, applicable legal requirements, the nature of other investment opportunities available to us and other considerations. During the three months ended September 30, 2023, we repurchased 1.8 million shares of common stock in the open market at a total cost of $30 million. As of September 30, 2023, the Company had approximately $120 million of authorized repurchases remaining under the Share Repurchase Program. Common stock repurchases are recorded at cost and presented as a deduction from stockholders’ equity.
|
| X |
- DefinitionThe entire disclosure for shareholders' equity and share-based payment arrangement. Includes, but is not limited to, disclosure of policy and terms of share-based payment arrangement, deferred compensation arrangement, and employee stock purchase plan (ESPP). Reference 1: http://fasb.org/us-gaap/role/ref/legacyRef
-Topic 505
-Name Accounting Standards Codification
-Publisher FASB
-URI https://asc.fasb.org//505/tableOfContent
Reference 2: http://fasb.org/us-gaap/role/ref/legacyRef
-Topic 718
-Name Accounting Standards Codification
-Publisher FASB
-URI https://asc.fasb.org//718/tableOfContent
| Name: |
us-gaap_ShareholdersEquityAndShareBasedPaymentsTextBlock |
| Namespace Prefix: |
us-gaap_ |
| Data Type: |
dtr-types:textBlockItemType |
| Balance Type: |
na |
| Period Type: |
duration |
|
| X |
- References
+ Details
| Name: |
us-gaap_StockholdersEquityNoteAbstract |
| Namespace Prefix: |
us-gaap_ |
| Data Type: |
xbrli:stringItemType |
| Balance Type: |
na |
| Period Type: |
duration |
|
v3.23.3
Pay vs Performance Disclosure - USD ($)
$ in Millions |
3 Months Ended |
9 Months Ended |
Sep. 30, 2023 |
Oct. 01, 2022 |
Sep. 30, 2023 |
Oct. 01, 2022 |
| Pay vs Performance Disclosure |
|
|
|
|
| Net income |
$ 21
|
$ 63
|
$ 128
|
$ 244
|
| X |
- ReferencesReference 1: http://www.xbrl.org/2003/role/presentationRef
-Publisher SEC
-Name Regulation S-K
-Number 229
-Section 402
-Subsection v
-Paragraph 1
| Name: |
ecd_PvpTable |
| Namespace Prefix: |
ecd_ |
| Data Type: |
xbrli:stringItemType |
| Balance Type: |
na |
| Period Type: |
duration |
|
| X |
- DefinitionThe portion of profit or loss for the period, net of income taxes, which is attributable to the parent. Reference 1: http://www.xbrl.org/2003/role/disclosureRef
-Topic 235
-SubTopic 10
-Name Accounting Standards Codification
-Section S99
-Paragraph 1
-Subparagraph (SX 210.4-08(g)(1)(ii))
-Publisher FASB
-URI https://asc.fasb.org//1943274/2147480678/235-10-S99-1
Reference 2: http://www.xbrl.org/2003/role/disclosureRef
-Topic 323
-SubTopic 10
-Name Accounting Standards Codification
-Section 50
-Paragraph 3
-Subparagraph (c)
-Publisher FASB
-URI https://asc.fasb.org//1943274/2147481687/323-10-50-3
Reference 3: http://www.xbrl.org/2003/role/disclosureRef
-Topic 825
-SubTopic 10
-Name Accounting Standards Codification
-Section 50
-Paragraph 28
-Subparagraph (f)
-Publisher FASB
-URI https://asc.fasb.org//1943274/2147482907/825-10-50-28
Reference 4: http://www.xbrl.org/2003/role/disclosureRef
-Topic 220
-SubTopic 10
-Name Accounting Standards Codification
-Section 50
-Paragraph 6
-Publisher FASB
-URI https://asc.fasb.org//1943274/2147482765/220-10-50-6
Reference 5: http://www.xbrl.org/2003/role/disclosureRef
-Topic 250
-SubTopic 10
-Name Accounting Standards Codification
-Section 50
-Paragraph 3
-Publisher FASB
-URI https://asc.fasb.org//1943274/2147483443/250-10-50-3
Reference 6: http://www.xbrl.org/2003/role/disclosureRef
-Topic 250
-SubTopic 10
-Name Accounting Standards Codification
-Section 50
-Paragraph 1
-Subparagraph (b)(2)
-Publisher FASB
-URI https://asc.fasb.org//1943274/2147483443/250-10-50-1
Reference 7: http://www.xbrl.org/2003/role/disclosureRef
-Topic 815
-SubTopic 40
-Name Accounting Standards Codification
-Section 65
-Paragraph 1
-Subparagraph (f)
-Publisher FASB
-URI https://asc.fasb.org//1943274/2147480175/815-40-65-1
Reference 8: http://www.xbrl.org/2003/role/disclosureRef
-Topic 250
-SubTopic 10
-Name Accounting Standards Codification
-Section 50
-Paragraph 8
-Publisher FASB
-URI https://asc.fasb.org//1943274/2147483443/250-10-50-8
Reference 9: http://www.xbrl.org/2003/role/disclosureRef
-Topic 250
-SubTopic 10
-Name Accounting Standards Codification
-Section 50
-Paragraph 9
-Publisher FASB
-URI https://asc.fasb.org//1943274/2147483443/250-10-50-9
Reference 10: http://www.xbrl.org/2003/role/disclosureRef
-Topic 250
-SubTopic 10
-Name Accounting Standards Codification
-Section 50
-Paragraph 11
-Subparagraph (a)
-Publisher FASB
-URI https://asc.fasb.org//1943274/2147483443/250-10-50-11
Reference 11: http://www.xbrl.org/2003/role/disclosureRef
-Topic 250
-SubTopic 10
-Name Accounting Standards Codification
-Section 50
-Paragraph 11
-Subparagraph (b)
-Publisher FASB
-URI https://asc.fasb.org//1943274/2147483443/250-10-50-11
Reference 12: http://www.xbrl.org/2003/role/disclosureRef
-Topic 250
-SubTopic 10
-Name Accounting Standards Codification
-Section 50
-Paragraph 4
-Publisher FASB
-URI https://asc.fasb.org//1943274/2147483443/250-10-50-4
Reference 13: http://www.xbrl.org/2003/role/exampleRef
-Topic 946
-SubTopic 830
-Name Accounting Standards Codification
-Section 55
-Paragraph 10
-Publisher FASB
-URI https://asc.fasb.org//1943274/2147480167/946-830-55-10
Reference 14: http://www.xbrl.org/2003/role/disclosureRef
-Topic 946
-SubTopic 220
-Name Accounting Standards Codification
-Section 45
-Paragraph 7
-Publisher FASB
-URI https://asc.fasb.org//1943274/2147483581/946-220-45-7
Reference 15: http://www.xbrl.org/2003/role/disclosureRef
-Topic 944
-SubTopic 220
-Name Accounting Standards Codification
-Section S99
-Paragraph 1
-Subparagraph (SX 210.7-04(18))
-Publisher FASB
-URI https://asc.fasb.org//1943274/2147483586/944-220-S99-1
Reference 16: http://www.xbrl.org/2003/role/disclosureRef
-Topic 280
-SubTopic 10
-Name Accounting Standards Codification
-Section 50
-Paragraph 22
-Publisher FASB
-URI https://asc.fasb.org//1943274/2147482810/280-10-50-22
Reference 17: http://www.xbrl.org/2003/role/disclosureRef
-Topic 946
-SubTopic 220
-Name Accounting Standards Codification
-Section S99
-Paragraph 1
-Subparagraph (SX 210.6-07(9))
-Publisher FASB
-URI https://asc.fasb.org//1943274/2147483575/946-220-S99-1
Reference 18: http://www.xbrl.org/2003/role/disclosureRef
-Topic 946
-SubTopic 220
-Name Accounting Standards Codification
-Section S99
-Paragraph 3
-Subparagraph (SX 210.6-09(1)(d))
-Publisher FASB
-URI https://asc.fasb.org//1943274/2147483575/946-220-S99-3
Reference 19: http://www.xbrl.org/2003/role/disclosureRef
-Topic 470
-SubTopic 10
-Name Accounting Standards Codification
-Section S99
-Paragraph 1A
-Subparagraph (SX 210.13-01(a)(4)(i))
-Publisher FASB
-URI https://asc.fasb.org//1943274/2147480097/470-10-S99-1A
Reference 20: http://www.xbrl.org/2009/role/commonPracticeRef
-Topic 470
-SubTopic 10
-Name Accounting Standards Codification
-Section S99
-Paragraph 1A
-Subparagraph (SX 210.13-01(a)(4)(ii))
-Publisher FASB
-URI https://asc.fasb.org//1943274/2147480097/470-10-S99-1A
Reference 21: http://www.xbrl.org/2003/role/disclosureRef
-Topic 470
-SubTopic 10
-Name Accounting Standards Codification
-Section S99
-Paragraph 1A
-Subparagraph (SX 210.13-01(a)(4)(iii)(A))
-Publisher FASB
-URI https://asc.fasb.org//1943274/2147480097/470-10-S99-1A
Reference 22: http://www.xbrl.org/2003/role/disclosureRef
-Topic 470
-SubTopic 10
-Name Accounting Standards Codification
-Section S99
-Paragraph 1A
-Subparagraph (SX 210.13-01(a)(4)(iv))
-Publisher FASB
-URI https://asc.fasb.org//1943274/2147480097/470-10-S99-1A
Reference 23: http://www.xbrl.org/2003/role/disclosureRef
-Topic 470
-SubTopic 10
-Name Accounting Standards Codification
-Section S99
-Paragraph 1A
-Subparagraph (SX 210.13-01(a)(5))
-Publisher FASB
-URI https://asc.fasb.org//1943274/2147480097/470-10-S99-1A
Reference 24: http://www.xbrl.org/2003/role/disclosureRef
-Topic 470
-SubTopic 10
-Name Accounting Standards Codification
-Section S99
-Paragraph 1B
-Subparagraph (SX 210.13-02(a)(4)(i))
-Publisher FASB
-URI https://asc.fasb.org//1943274/2147480097/470-10-S99-1B
Reference 25: http://www.xbrl.org/2003/role/disclosureRef
-Topic 470
-SubTopic 10
-Name Accounting Standards Codification
-Section S99
-Paragraph 1B
-Subparagraph (SX 210.13-02(a)(4)(iii)(A))
-Publisher FASB
-URI https://asc.fasb.org//1943274/2147480097/470-10-S99-1B
Reference 26: http://www.xbrl.org/2003/role/disclosureRef
-Topic 470
-SubTopic 10
-Name Accounting Standards Codification
-Section S99
-Paragraph 1B
-Subparagraph (SX 210.13-02(a)(4)(iii)(B))
-Publisher FASB
-URI https://asc.fasb.org//1943274/2147480097/470-10-S99-1B
Reference 27: http://www.xbrl.org/2003/role/disclosureRef
-Topic 470
-SubTopic 10
-Name Accounting Standards Codification
-Section S99
-Paragraph 1B
-Subparagraph (SX 210.13-02(a)(4)(iv))
-Publisher FASB
-URI https://asc.fasb.org//1943274/2147480097/470-10-S99-1B
Reference 28: http://www.xbrl.org/2003/role/disclosureRef
-Topic 470
-SubTopic 10
-Name Accounting Standards Codification
-Section S99
-Paragraph 1B
-Subparagraph (SX 210.13-02(a)(5))
-Publisher FASB
-URI https://asc.fasb.org//1943274/2147480097/470-10-S99-1B
Reference 29: http://www.xbrl.org/2003/role/disclosureRef
-Topic 280
-SubTopic 10
-Name Accounting Standards Codification
-Section 50
-Paragraph 30
-Subparagraph (b)
-Publisher FASB
-URI https://asc.fasb.org//1943274/2147482810/280-10-50-30
Reference 30: http://www.xbrl.org/2003/role/disclosureRef
-Topic 280
-SubTopic 10
-Name Accounting Standards Codification
-Section 50
-Paragraph 32
-Subparagraph (f)
-Publisher FASB
-URI https://asc.fasb.org//1943274/2147482810/280-10-50-32
Reference 31: http://www.xbrl.org/2003/role/disclosureRef
-Topic 260
-SubTopic 10
-Name Accounting Standards Codification
-Section 45
-Paragraph 60B
-Subparagraph (a)
-Publisher FASB
-URI https://asc.fasb.org//1943274/2147482689/260-10-45-60B
Reference 32: http://www.xbrl.org/2003/role/exampleRef
-Topic 280
-SubTopic 10
-Name Accounting Standards Codification
-Section 50
-Paragraph 31
-Publisher FASB
-URI https://asc.fasb.org//1943274/2147482810/280-10-50-31
Reference 33: http://www.xbrl.org/2003/role/disclosureRef
-Topic 280
-SubTopic 10
-Name Accounting Standards Codification
-Section 50
-Paragraph 32
-Subparagraph (c)
-Publisher FASB
-URI https://asc.fasb.org//1943274/2147482810/280-10-50-32
Reference 34: http://www.xbrl.org/2003/role/disclosureRef
-Topic 205
-SubTopic 20
-Name Accounting Standards Codification
-Section 50
-Paragraph 7
-Publisher FASB
-URI https://asc.fasb.org//1943274/2147483499/205-20-50-7
Reference 35: http://fasb.org/us-gaap/role/ref/legacyRef
-Topic 230
-SubTopic 10
-Name Accounting Standards Codification
-Section 45
-Paragraph 28
-Publisher FASB
-URI https://asc.fasb.org//1943274/2147482740/230-10-45-28
Reference 36: http://www.xbrl.org/2003/role/disclosureRef
-Topic 220
-SubTopic 10
-Name Accounting Standards Codification
-Section 45
-Paragraph 1A
-Subparagraph (a)
-Publisher FASB
-URI https://asc.fasb.org//1943274/2147482790/220-10-45-1A
Reference 37: http://www.xbrl.org/2003/role/disclosureRef
-Topic 220
-SubTopic 10
-Name Accounting Standards Codification
-Section 45
-Paragraph 1B
-Subparagraph (a)
-Publisher FASB
-URI https://asc.fasb.org//1943274/2147482790/220-10-45-1B
Reference 38: http://fasb.org/us-gaap/role/ref/legacyRef
-Topic 220
-SubTopic 10
-Name Accounting Standards Codification
-Section S99
-Paragraph 2
-Subparagraph (SX 210.5-03(20))
-Publisher FASB
-URI https://asc.fasb.org//1943274/2147483621/220-10-S99-2
Reference 39: http://fasb.org/us-gaap/role/ref/legacyRef
-Topic 942
-SubTopic 220
-Name Accounting Standards Codification
-Section S99
-Paragraph 1
-Subparagraph (SX 210.9-04(22))
-Publisher FASB
-URI https://asc.fasb.org//1943274/2147483589/942-220-S99-1
| Name: |
us-gaap_NetIncomeLoss |
| Namespace Prefix: |
us-gaap_ |
| Data Type: |
xbrli:monetaryItemType |
| Balance Type: |
credit |
| Period Type: |
duration |
|
v3.23.3
| X |
- ReferencesReference 1: http://www.xbrl.org/2003/role/presentationRef
-Publisher SEC
-Name Regulation S-K
-Number 229
-Section 408
-Subsection a
-Paragraph 1
| Name: |
ecd_NonRule10b51ArrAdoptedFlag |
| Namespace Prefix: |
ecd_ |
| Data Type: |
xbrli:booleanItemType |
| Balance Type: |
na |
| Period Type: |
duration |
|
| X |
- ReferencesReference 1: http://www.xbrl.org/2003/role/presentationRef
-Publisher SEC
-Name Regulation S-K
-Number 229
-Section 408
-Subsection a
-Paragraph 1
| Name: |
ecd_NonRule10b51ArrTrmntdFlag |
| Namespace Prefix: |
ecd_ |
| Data Type: |
xbrli:booleanItemType |
| Balance Type: |
na |
| Period Type: |
duration |
|
| X |
- ReferencesReference 1: http://www.xbrl.org/2003/role/presentationRef
-Publisher SEC
-Name Regulation S-K
-Number 229
-Section 408
-Subsection a
-Paragraph 1
| Name: |
ecd_Rule10b51ArrAdoptedFlag |
| Namespace Prefix: |
ecd_ |
| Data Type: |
xbrli:booleanItemType |
| Balance Type: |
na |
| Period Type: |
duration |
|
| X |
- ReferencesReference 1: http://www.xbrl.org/2003/role/presentationRef
-Publisher SEC
-Name Regulation S-K
-Number 229
-Section 408
-Subsection a
-Paragraph 1
| Name: |
ecd_Rule10b51ArrTrmntdFlag |
| Namespace Prefix: |
ecd_ |
| Data Type: |
xbrli:booleanItemType |
| Balance Type: |
na |
| Period Type: |
duration |
|
| X |
- ReferencesReference 1: http://www.xbrl.org/2003/role/presentationRef
-Publisher SEC
-Name Regulation S-K
-Number 229
-Section 408
-Subsection a
-Paragraph 2
-Subparagraph A
| Name: |
ecd_TradingArrByIndTable |
| Namespace Prefix: |
ecd_ |
| Data Type: |
xbrli:stringItemType |
| Balance Type: |
na |
| Period Type: |
duration |
|
v3.23.3
Nature of Operations and Basis of Presentation (Policies)
|
9 Months Ended |
Sep. 30, 2023 |
|---|
| Organization, Consolidation and Presentation of Financial Statements [Abstract] |
|
| Basis of Consolidation and Reporting |
Basis of Consolidation and Reporting
The accompanying Unaudited Consolidated Financial Statements have been prepared in accordance with United States (“U.S.”) generally accepted accounting principles (“GAAP”) for interim financial information and with the instructions to Form 10-Q and Article 10 of Regulation S-X. Accordingly, the Unaudited Consolidated Financial Statements do not include all of the information and notes required by GAAP for complete financial statements. In the opinion of management, the Unaudited Consolidated Financial Statements included herein contain all adjustments, which consist of normal recurring adjustments, necessary to fairly present our financial position, results of operations and cash flows for the periods indicated. Operating results for the period from January 1, 2023 through September 30, 2023 are not necessarily indicative of the results that may be expected for the fiscal year ending December 31, 2023.
For additional information, refer to the consolidated financial statements and notes thereto included in our Annual Report on Form 10-K for the fiscal year ended December 31, 2022 (the “2022 Annual Report on Form 10-K”), filed with the United States Securities and Exchange Commission (the “SEC”) on February 21, 2023.
Reporting Period We report financial information on a fiscal quarter basis using a modified four-four-five week calendar. Our fiscal calendar begins on January 1 and ends on December 31. We have elected the first, second and third quarters to end on a Saturday in order to not disrupt business processes. The effects of this election are generally not significant to reported results for any quarter and only exist within a reporting year.
|
| Reclassification |
Reclassification
For the purpose of comparability, certain prior period amounts have been reclassified to conform to current period classification.
|
| Adopted Accounting Pronouncements |
Our significant accounting policies are detailed in Note 2. Summary of Significant Accounting Policies of the Annual Report on Form 10-K for the year ended December 31, 2022. There have been no significant changes to these policies that have had a material impact on the Unaudited Consolidated Financial Statements and accompanying notes for the three and nine months ended September 30, 2023.
We consider the applicability and impact of all recent accounting standards updates (“ASUs”) issued by the Financial Accounting Standards Board (“FASB”) and disclose only those that may have a material impact.
Adopted Accounting Pronouncements In March 2020, the FASB issued ASU 2020-04, Reference Rate Reform (Topic 848): Facilitation of the Effects of Reference Rate Reform on Financial Reporting, and subsequent amendment to the initial guidance: ASU 2021-01, Reference Rate Reform (Topic 848): Scope (collectively, “Topic 848”). Topic 848 provides optional expedients and exceptions for applying GAAP to contracts, hedging relationships, and other transactions affected by reference rate reform if certain criteria are met. The amendments apply only to contracts, hedging relationships, and other transactions that reference London Interbank Offered Rate (“LIBOR”) or another reference rate expected to be discontinued because of reference rate reform. In December 2022, the FASB issued ASU 2022-06, Reference Rate Reform (Topic 848): Deferral of the Sunset Date of Topic 848. ASU 2022-06 defers the sunset date of Topic 848 from December 31, 2022 to December 31, 2024. This guidance may be applied prospectively to contract modifications made and hedging relationships entered into or evaluated on or before December 31, 2024. The impact of the adoption of this standard on our financial statements and related disclosures, including accounting policies, processes, and systems, was not material. Refer to Note 12. Long-Term Debt and Note 13. Derivative Financial Instruments to the Unaudited Consolidated Financial Statements for further discussion.
|
| X |
- DefinitionDisclosure of accounting policy for basis of accounting, or basis of presentation, used to prepare the financial statements (for example, US Generally Accepted Accounting Principles, Other Comprehensive Basis of Accounting, IFRS).
| Name: |
us-gaap_BasisOfAccountingPolicyPolicyTextBlock |
| Namespace Prefix: |
us-gaap_ |
| Data Type: |
dtr-types:textBlockItemType |
| Balance Type: |
na |
| Period Type: |
duration |
|
| X |
- DefinitionDisclosure of accounting policy pertaining to new accounting pronouncements that may impact the entity's financial reporting. Includes, but is not limited to, quantification of the expected or actual impact.
| Name: |
us-gaap_NewAccountingPronouncementsPolicyPolicyTextBlock |
| Namespace Prefix: |
us-gaap_ |
| Data Type: |
dtr-types:textBlockItemType |
| Balance Type: |
na |
| Period Type: |
duration |
|
| X |
- References
+ Details
| Name: |
us-gaap_OrganizationConsolidationAndPresentationOfFinancialStatementsAbstract |
| Namespace Prefix: |
us-gaap_ |
| Data Type: |
xbrli:stringItemType |
| Balance Type: |
na |
| Period Type: |
duration |
|
| X |
- DefinitionDisclosure of accounting policy for reclassification affecting comparability of financial statement. Excludes amendment to accounting standards, other change in accounting principle, and correction of error. Reference 1: http://www.xbrl.org/2009/role/commonPracticeRef
-Topic 205
-SubTopic 10
-Name Accounting Standards Codification
-Section 50
-Paragraph 1
-Publisher FASB
-URI https://asc.fasb.org//1943274/2147483504/205-10-50-1
| Name: |
us-gaap_PriorPeriodReclassificationAdjustmentDescription |
| Namespace Prefix: |
us-gaap_ |
| Data Type: |
dtr-types:textBlockItemType |
| Balance Type: |
na |
| Period Type: |
duration |
|
v3.23.3
| X |
- References
+ Details
| Name: |
us-gaap_OrganizationConsolidationAndPresentationOfFinancialStatementsAbstract |
| Namespace Prefix: |
us-gaap_ |
| Data Type: |
xbrli:stringItemType |
| Balance Type: |
na |
| Period Type: |
duration |
|
| X |
- DefinitionTabular disclosure of information related to a disposal group. Includes, but is not limited to, a discontinued operation, disposal classified as held-for-sale or disposed of by means other than sale or disposal of an individually significant component. Reference 1: http://fasb.org/us-gaap/role/ref/legacyRef
-Name Accounting Standards Codification
-Section 50
-Paragraph 3
-SubTopic 10
-Topic 360
-Publisher FASB
-URI https://asc.fasb.org//1943274/2147482099/360-10-50-3
Reference 2: http://fasb.org/us-gaap/role/ref/legacyRef
-Topic 205
-SubTopic 20
-Name Accounting Standards Codification
-Section 45
-Paragraph 11
-Publisher FASB
-URI https://asc.fasb.org//1943274/2147483475/205-20-45-11
Reference 3: http://fasb.org/us-gaap/role/ref/legacyRef
-Topic 205
-SubTopic 20
-Name Accounting Standards Codification
-Section 50
-Paragraph 3A
-Publisher FASB
-URI https://asc.fasb.org//1943274/2147483499/205-20-50-3A
Reference 4: http://fasb.org/us-gaap/role/ref/legacyRef
-Topic 205
-SubTopic 20
-Name Accounting Standards Codification
-Section 50
-Paragraph 4A
-Publisher FASB
-URI https://asc.fasb.org//1943274/2147483499/205-20-50-4A
Reference 5: http://fasb.org/us-gaap/role/ref/legacyRef
-Topic 205
-SubTopic 20
-Name Accounting Standards Codification
-Section 50
-Paragraph 4B
-Publisher FASB
-URI https://asc.fasb.org//1943274/2147483499/205-20-50-4B
Reference 6: http://fasb.org/us-gaap/role/ref/legacyRef
-Topic 205
-SubTopic 20
-Name Accounting Standards Codification
-Section 50
-Paragraph 5A
-Publisher FASB
-URI https://asc.fasb.org//1943274/2147483499/205-20-50-5A
Reference 7: http://fasb.org/us-gaap/role/ref/legacyRef
-Topic 205
-SubTopic 20
-Name Accounting Standards Codification
-Section 50
-Paragraph 5B
-Publisher FASB
-URI https://asc.fasb.org//1943274/2147483499/205-20-50-5B
Reference 8: http://fasb.org/us-gaap/role/ref/legacyRef
-Topic 205
-SubTopic 20
-Name Accounting Standards Codification
-Section 50
-Paragraph 5C
-Publisher FASB
-URI https://asc.fasb.org//1943274/2147483499/205-20-50-5C
Reference 9: http://fasb.org/us-gaap/role/ref/legacyRef
-Topic 205
-SubTopic 20
-Name Accounting Standards Codification
-Section 50
-Paragraph 5D
-Publisher FASB
-URI https://asc.fasb.org//1943274/2147483499/205-20-50-5D
Reference 10: http://fasb.org/us-gaap/role/ref/legacyRef
-Topic 205
-SubTopic 20
-Name Accounting Standards Codification
-Section 50
-Paragraph 7
-Publisher FASB
-URI https://asc.fasb.org//1943274/2147483499/205-20-50-7
Reference 11: http://fasb.org/us-gaap/role/ref/legacyRef
-Topic 360
-SubTopic 10
-Name Accounting Standards Codification
-Section 50
-Paragraph 3A
-Publisher FASB
-URI https://asc.fasb.org//1943274/2147482099/360-10-50-3A
Reference 12: http://fasb.org/us-gaap/role/ref/legacyRef
-Name Accounting Standards Codification
-Section 50
-Paragraph 1
-SubTopic 20
-Topic 205
-Publisher FASB
-URI https://asc.fasb.org//1943274/2147483499/205-20-50-1
Reference 13: http://fasb.org/us-gaap/role/ref/legacyRef
-Name Accounting Standards Codification
-Topic 205
-SubTopic 20
-Section 50
-Paragraph 3
-Publisher FASB
-URI https://asc.fasb.org//1943274/2147483499/205-20-50-3
| Name: |
us-gaap_ScheduleOfDisposalGroupsIncludingDiscontinuedOperationsIncomeStatementBalanceSheetAndAdditionalDisclosuresTextBlock |
| Namespace Prefix: |
us-gaap_ |
| Data Type: |
dtr-types:textBlockItemType |
| Balance Type: |
na |
| Period Type: |
duration |
|
v3.23.3
Segment Financial Data (Tables)
|
9 Months Ended |
Sep. 30, 2023 |
|---|
| Segment Reporting [Abstract] |
|
| Schedule of Segment Information |
The following table represents summary financial data attributable to the segments:
| | | | | | | | | | | | | | | | | | | | | | | | | Three Months Ended | | Nine Months Ended | | (in millions) | September 30, 2023 | | October 1, 2022 | | September 30, 2023 | | October 1, 2022 | | Net revenue | | | | | | | | | Products and Solutions | $ | 654 | | | $ | 707 | | | $ | 1,989 | | | $ | 2,090 | | | ADI Global Distribution | 900 | | | 911 | | | 2,716 | | | 2,720 | | | Total net revenue | $ | 1,554 | | | $ | 1,618 | | | $ | 4,705 | | | $ | 4,810 | |
| | | | | | | | | | | | | | | | | | | | | | | | | Three Months Ended | | Nine Months Ended | | (in millions) | September 30, 2023 | | October 1, 2022 | | September 30, 2023 | | October 1, 2022 | | Income from operations | | | | | | | | | Products and Solutions | $ | 107 | | | $ | 124 | | | $ | 352 | | | $ | 431 | | | ADI Global Distribution | 60 | | | 78 | | | 211 | | | 244 | | | Corporate | (58) | | | (47) | | | (163) | | | (162) | | | Total income from operations | $ | 109 | | | $ | 155 | | | $ | 400 | | | $ | 513 | |
|
| X |
- DefinitionTabular disclosure of the profit or loss and total assets for each reportable segment. An entity discloses certain information on each reportable segment if the amounts (a) are included in the measure of segment profit or loss reviewed by the chief operating decision maker or (b) are otherwise regularly provided to the chief operating decision maker, even if not included in that measure of segment profit or loss. Reference 1: http://fasb.org/us-gaap/role/ref/legacyRef
-Name Accounting Standards Codification
-Topic 350
-SubTopic 20
-Section 50
-Paragraph 1
-Publisher FASB
-URI https://asc.fasb.org//1943274/2147482573/350-20-50-1
Reference 2: http://fasb.org/us-gaap/role/ref/legacyRef
-Name Accounting Standards Codification
-Topic 280
-SubTopic 10
-Section 50
-Paragraph 25
-Publisher FASB
-URI https://asc.fasb.org//1943274/2147482810/280-10-50-25
Reference 3: http://fasb.org/us-gaap/role/ref/legacyRef
-Name Accounting Standards Codification
-Topic 280
-SubTopic 10
-Section 50
-Paragraph 22
-Publisher FASB
-URI https://asc.fasb.org//1943274/2147482810/280-10-50-22
Reference 4: http://fasb.org/us-gaap/role/ref/legacyRef
-Name Accounting Standards Codification
-Topic 280
-SubTopic 10
-Section 50
-Paragraph 30
-Publisher FASB
-URI https://asc.fasb.org//1943274/2147482810/280-10-50-30
| Name: |
us-gaap_ScheduleOfSegmentReportingInformationBySegmentTextBlock |
| Namespace Prefix: |
us-gaap_ |
| Data Type: |
dtr-types:textBlockItemType |
| Balance Type: |
na |
| Period Type: |
duration |
|
| X |
- References
+ Details
| Name: |
us-gaap_SegmentReportingAbstract |
| Namespace Prefix: |
us-gaap_ |
| Data Type: |
xbrli:stringItemType |
| Balance Type: |
na |
| Period Type: |
duration |
|
v3.23.3
Revenue Recognition (Tables)
|
9 Months Ended |
Sep. 30, 2023 |
|---|
| Revenue from Contract with Customer [Abstract] |
|
| Schedule of Revenue By Business Line and Geographic Location |
The following table presents revenue by business line and geographic location, as we believe this presentation best depicts how the nature, amount, timing, and uncertainty of net revenue and cash flows are affected by economic factors:
| | | | | | | | | | | | | | | | | | | | | | | | | Three Months Ended | | Nine Months Ended | | (in millions) | September 30, 2023 | | October 1, 2022 | | September 30, 2023 | | October 1, 2022 | | Products and Solutions | | | | | | | | | Air | $ | 211 | | | $ | 245 | | | $ | 640 | | | $ | 721 | | | Safety and Security | 245 | | | 248 | | | 721 | | | 670 | | | Energy | 123 | | | 142 | | | 391 | | | 455 | | | Water | 75 | | | 72 | | | 237 | | | 244 | | | Total Products and Solutions | 654 | | | 707 | | | 1,989 | | | 2,090 | | | | | | | | | | | ADI Global Distribution | | | | | | | | | U.S. and Canada | 780 | | | 792 | | | 2,354 | | | 2,335 | | EMEA (1) | 120 | | | 111 | | | 362 | | | 360 | | APAC (2) | — | | | 8 | | | — | | | 25 | | | Total ADI Global Distribution | 900 | | | 911 | | | 2,716 | | | 2,720 | | | | | | | | | | | Total net revenue | $ | 1,554 | | | $ | 1,618 | | | $ | 4,705 | | | $ | 4,810 | |
(1)EMEA represents Europe, the Middle East and Africa. (2)APAC represents Asia and Pacific countries.
|
| X |
- DefinitionTabular disclosure of disaggregation of revenue into categories depicting how nature, amount, timing, and uncertainty of revenue and cash flows are affected by economic factor. Reference 1: http://www.xbrl.org/2009/role/commonPracticeRef
-Topic 606
-SubTopic 10
-Name Accounting Standards Codification
-Section 50
-Paragraph 5
-Publisher FASB
-URI https://asc.fasb.org//1943274/2147479806/606-10-50-5
| Name: |
us-gaap_DisaggregationOfRevenueTableTextBlock |
| Namespace Prefix: |
us-gaap_ |
| Data Type: |
dtr-types:textBlockItemType |
| Balance Type: |
na |
| Period Type: |
duration |
|
| X |
- References
+ Details
| Name: |
us-gaap_RevenueFromContractWithCustomerAbstract |
| Namespace Prefix: |
us-gaap_ |
| Data Type: |
xbrli:stringItemType |
| Balance Type: |
na |
| Period Type: |
duration |
|
v3.23.3
Restructuring (Tables)
|
9 Months Ended |
Sep. 30, 2023 |
|---|
| Restructuring and Related Activities [Abstract] |
|
| Schedule of Restructuring Expenses |
The following table summarizes the status of our restructuring expenses included within accrued liabilities on the Unaudited Consolidated Balance Sheets.
| | | | | | | | | | | | | Nine Months Ended | | Twelve Months Ended | | (in millions) | September 30, 2023 | | December 31, 2022 | | Beginning of period | $ | 27 | | | $ | 9 | | | Charges | 36 | | | 26 | | Usage (1) | (22) | | | (5) | | | Other | — | | | (3) | | | End of period | $ | 41 | | | $ | 27 | |
(1) Usage primarily relates to cash payments associated with employee termination costs.
|
| X |
- DefinitionTabular disclosure of costs incurred for restructuring including, but not limited to, exit and disposal activities, remediation, implementation, integration, asset impairment, and charges against earnings from the write-down of assets. Reference 1: http://fasb.org/us-gaap/role/ref/legacyRef
-Name Accounting Standards Codification
-Topic 420
-SubTopic 10
-Section S99
-Paragraph 1
-Subparagraph (SAB TOPIC 5.P.3)
-Publisher FASB
-URI https://asc.fasb.org//1943274/2147479823/420-10-S99-1
Reference 2: http://fasb.org/us-gaap/role/ref/legacyRef
-Name Accounting Standards Codification
-Topic 420
-SubTopic 10
-Section 50
-Paragraph 1
-Publisher FASB
-URI https://asc.fasb.org//1943274/2147482017/420-10-50-1
Reference 3: http://fasb.org/us-gaap/role/ref/legacyRef
-Name Accounting Standards Codification
-Topic 420
-SubTopic 10
-Section S99
-Paragraph 2
-Subparagraph (SAB TOPIC 5.P.4)
-Publisher FASB
-URI https://asc.fasb.org//1943274/2147479823/420-10-S99-2
| Name: |
us-gaap_ScheduleOfRestructuringAndRelatedCostsTextBlock |
| Namespace Prefix: |
us-gaap_ |
| Data Type: |
dtr-types:textBlockItemType |
| Balance Type: |
na |
| Period Type: |
duration |
|
v3.23.3
Stock-Based Compensation Plans (Tables)
|
9 Months Ended |
Sep. 30, 2023 |
|---|
| Share-Based Payment Arrangement [Abstract] |
|
| Schedule of Stock Incentive Plan For Employees and Non-Employee Directors |
A summary of awards granted as part of our annual long-term compensation follows: | | | | | | | | | | | | | | | | | | | | | | | | | Nine Months Ended September 30, 2023 | | Nine Months Ended October 1, 2022 | | Number of Stock Units Granted | | Weighted average grant date fair value per share | | Number of Stock Units Granted | | Weighted average grant date fair value per share | Performance Stock Units (“PSUs”) | 553,071 | | $ | 29.89 | | | 669,551 | | $ | 36.11 | | Restricted Stock Units (“RSUs”) | 2,232,465 | | $ | 18.85 | | | 1,711,282 | | $ | 22.68 | |
|
| X |
- DefinitionTabular disclosure of the changes in outstanding nonvested restricted stock units. Reference 1: http://fasb.org/us-gaap/role/ref/legacyRef
-Name Accounting Standards Codification
-Topic 718
-SubTopic 10
-Section 50
-Paragraph 2
-Subparagraph (c)(2)
-Publisher FASB
-URI https://asc.fasb.org//1943274/2147480429/718-10-50-2
| Name: |
us-gaap_ScheduleOfNonvestedRestrictedStockUnitsActivityTableTextBlock |
| Namespace Prefix: |
us-gaap_ |
| Data Type: |
dtr-types:textBlockItemType |
| Balance Type: |
na |
| Period Type: |
duration |
|
v3.23.3
Inventories, net (Tables)
|
9 Months Ended |
Sep. 30, 2023 |
|---|
| Inventory Disclosure [Abstract] |
|
| Schedule of Inventories |
The following table summarizes the details of our inventories, net:
| | | | | | | | | | | | | | | | (in millions) | | September 30, 2023 | | December 31, 2022 | | Raw materials | | $ | 229 | | | $ | 251 | | | Work in process | | 21 | | | 25 | | | Finished products | | 720 | | | 699 | | | | | | | | | | | | | Total inventories, net | | $ | 970 | | | $ | 975 | |
|
| X |
- References
+ Details
| Name: |
us-gaap_InventoryDisclosureAbstract |
| Namespace Prefix: |
us-gaap_ |
| Data Type: |
xbrli:stringItemType |
| Balance Type: |
na |
| Period Type: |
duration |
|
| X |
- DefinitionTabular disclosure of the carrying amount as of the balance sheet date of merchandise, goods, commodities, or supplies held for future sale or to be used in manufacturing, servicing or production process. Reference 1: http://fasb.org/us-gaap/role/ref/legacyRef
-Topic 210
-SubTopic 10
-Name Accounting Standards Codification
-Section S99
-Paragraph 1
-Subparagraph (SX 210.5-02(6)(a))
-Publisher FASB
-URI https://asc.fasb.org//1943274/2147480566/210-10-S99-1
Reference 2: http://fasb.org/us-gaap/role/ref/legacyRef
-Topic 210
-SubTopic 10
-Name Accounting Standards Codification
-Section S99
-Paragraph 1
-Subparagraph (SX 210.5-02(6)(b))
-Publisher FASB
-URI https://asc.fasb.org//1943274/2147480566/210-10-S99-1
Reference 3: http://fasb.org/us-gaap/role/ref/legacyRef
-Topic 210
-SubTopic 10
-Name Accounting Standards Codification
-Section S99
-Paragraph 1
-Subparagraph (SX 210.5-02(6)(c))
-Publisher FASB
-URI https://asc.fasb.org//1943274/2147480566/210-10-S99-1
Reference 4: http://fasb.org/us-gaap/role/ref/legacyRef
-Name Accounting Standards Codification
-Topic 210
-SubTopic 10
-Section 50
-Paragraph 1
-Publisher FASB
-URI https://asc.fasb.org//1943274/2147483489/210-10-50-1
| Name: |
us-gaap_ScheduleOfInventoryCurrentTableTextBlock |
| Namespace Prefix: |
us-gaap_ |
| Data Type: |
dtr-types:textBlockItemType |
| Balance Type: |
na |
| Period Type: |
duration |
|
v3.23.3
Goodwill and Intangible Assets, net (Tables)
|
9 Months Ended |
Sep. 30, 2023 |
|---|
| Goodwill and Intangible Assets Disclosure [Abstract] |
|
| Schedule of Goodwill |
Our goodwill balance and changes in carrying value by segment are as follows:
| | | | | | | | | | | | | | | | | | | (in millions) | Products and Solutions | | ADI Global Distribution | | Total | Balance at December 31, 2022 | $ | 2,072 | | | $ | 652 | | | $ | 2,724 | | | Acquisitions | 10 | | | 3 | | | 13 | | Adjustments(1) | (42) | | | — | | | (42) | | | | | | | | | | | | | | | Impact of foreign currency translation | (6) | | | (2) | | | (8) | | | Balance at September 30, 2023 | $ | 2,034 | | | $ | 653 | | | $ | 2,687 | |
(1) Primarily relates to the divestiture of our Genesis business as discussed in Note 1. Nature of Operations and Basis of Presentation.
|
| Schedule of Indefinite-Lived Intangible Assets |
The following table summarizes the net carrying amount of intangible assets:
| | | | | | | | | | | | | (in millions) | September 30, 2023 | | December 31, 2022 | | Intangible assets subject to amortization | $ | 276 | | | $ | 295 | | | Indefinite-lived intangible assets | 180 | | | 180 | | | Total intangible assets | $ | 456 | | | $ | 475 | |
|
| Schedule of Intangible Assets With Finite Lives |
The following table summarizes the net carrying amount of intangible assets:
| | | | | | | | | | | | | (in millions) | September 30, 2023 | | December 31, 2022 | | Intangible assets subject to amortization | $ | 276 | | | $ | 295 | | | Indefinite-lived intangible assets | 180 | | | 180 | | | Total intangible assets | $ | 456 | | | $ | 475 | |
Intangible assets subject to amortization consisted of the following:
| | | | | | | | | | | | | | | | | | | | | | | | | | | | | | | | | | | | | | | | | September 30, 2023 | | December 31, 2022 | | | | | | (in millions) | Gross
Carrying
Amount | | Accumulated
Amortization | | Net
Carrying
Amount | | Gross
Carrying
Amount | | Accumulated
Amortization | | Net
Carrying
Amount | | | | | | Patents and technology | $ | 57 | | | $ | (23) | | | $ | 34 | | | $ | 65 | | | $ | (28) | | | $ | 37 | | | | | | | Customer relationships | 311 | | | (129) | | | 182 | | | 313 | | | (117) | | | 196 | | | | | | | Trademarks | 8 | | | (8) | | | — | | | 14 | | | (8) | | | 6 | | | | | | | Software | 187 | | | (127) | | | 60 | | | 175 | | | (119) | | | 56 | | | | | | | Intangible assets subject to amortization | $ | 563 | | | $ | (287) | | | $ | 276 | | | $ | 567 | | | $ | (272) | | | $ | 295 | | | | | |
|
| X |
- References
+ Details
| Name: |
us-gaap_GoodwillAndIntangibleAssetsDisclosureAbstract |
| Namespace Prefix: |
us-gaap_ |
| Data Type: |
xbrli:stringItemType |
| Balance Type: |
na |
| Period Type: |
duration |
|
| X |
- DefinitionTabular disclosure of assets, excluding financial assets and goodwill, lacking physical substance with a finite life, by either major class or business segment. Reference 1: http://fasb.org/us-gaap/role/ref/legacyRef
-Name Accounting Standards Codification
-Topic 350
-SubTopic 30
-Section 50
-Paragraph 1
-Subparagraph (a)
-Publisher FASB
-URI https://asc.fasb.org//1943274/2147482665/350-30-50-1
Reference 2: http://fasb.org/us-gaap/role/ref/legacyRef
-Name Accounting Standards Codification
-Topic 350
-SubTopic 30
-Section 50
-Paragraph 2
-Subparagraph (a)
-Publisher FASB
-URI https://asc.fasb.org//1943274/2147482665/350-30-50-2
| Name: |
us-gaap_ScheduleOfFiniteLivedIntangibleAssetsTableTextBlock |
| Namespace Prefix: |
us-gaap_ |
| Data Type: |
dtr-types:textBlockItemType |
| Balance Type: |
na |
| Period Type: |
duration |
|
| X |
- DefinitionTabular disclosure of goodwill by reportable segment and in total which includes a rollforward schedule. Reference 1: http://www.xbrl.org/2003/role/exampleRef
-Topic 350
-SubTopic 20
-Name Accounting Standards Codification
-Section 55
-Paragraph 24
-Publisher FASB
-URI https://asc.fasb.org//1943274/2147482548/350-20-55-24
Reference 2: http://www.xbrl.org/2009/role/commonPracticeRef
-Topic 350
-SubTopic 20
-Name Accounting Standards Codification
-Section 50
-Paragraph 1
-Subparagraph (a)
-Publisher FASB
-URI https://asc.fasb.org//1943274/2147482573/350-20-50-1
Reference 3: http://www.xbrl.org/2009/role/commonPracticeRef
-Topic 350
-SubTopic 20
-Name Accounting Standards Codification
-Section 50
-Paragraph 1
-Subparagraph (h)
-Publisher FASB
-URI https://asc.fasb.org//1943274/2147482573/350-20-50-1
Reference 4: http://www.xbrl.org/2009/role/commonPracticeRef
-Topic 350
-SubTopic 20
-Name Accounting Standards Codification
-Section 50
-Paragraph 1
-Publisher FASB
-URI https://asc.fasb.org//1943274/2147482573/350-20-50-1
Reference 5: http://www.xbrl.org/2009/role/commonPracticeRef
-Topic 350
-SubTopic 20
-Name Accounting Standards Codification
-Section 50
-Paragraph 1
-Subparagraph (b)
-Publisher FASB
-URI https://asc.fasb.org//1943274/2147482573/350-20-50-1
Reference 6: http://www.xbrl.org/2009/role/commonPracticeRef
-Topic 350
-SubTopic 20
-Name Accounting Standards Codification
-Section 50
-Paragraph 1
-Subparagraph (c)
-Publisher FASB
-URI https://asc.fasb.org//1943274/2147482573/350-20-50-1
Reference 7: http://www.xbrl.org/2009/role/commonPracticeRef
-Topic 350
-SubTopic 20
-Name Accounting Standards Codification
-Section 50
-Paragraph 1
-Subparagraph (d)
-Publisher FASB
-URI https://asc.fasb.org//1943274/2147482573/350-20-50-1
Reference 8: http://www.xbrl.org/2009/role/commonPracticeRef
-Topic 350
-SubTopic 20
-Name Accounting Standards Codification
-Section 50
-Paragraph 1
-Subparagraph (e)
-Publisher FASB
-URI https://asc.fasb.org//1943274/2147482573/350-20-50-1
Reference 9: http://www.xbrl.org/2009/role/commonPracticeRef
-Topic 350
-SubTopic 20
-Name Accounting Standards Codification
-Section 50
-Paragraph 1
-Subparagraph (f)
-Publisher FASB
-URI https://asc.fasb.org//1943274/2147482573/350-20-50-1
Reference 10: http://www.xbrl.org/2009/role/commonPracticeRef
-Topic 350
-SubTopic 20
-Name Accounting Standards Codification
-Section 50
-Paragraph 1
-Subparagraph (g)
-Publisher FASB
-URI https://asc.fasb.org//1943274/2147482573/350-20-50-1
Reference 11: http://www.xbrl.org/2009/role/commonPracticeRef
-Topic 350
-SubTopic 20
-Name Accounting Standards Codification
-Section 50
-Paragraph 1A
-Publisher FASB
-URI https://asc.fasb.org//1943274/2147482573/350-20-50-1A
Reference 12: http://www.xbrl.org/2009/role/commonPracticeRef
-Topic 350
-SubTopic 20
-Name Accounting Standards Codification
-Section 50
-Paragraph 2
-Subparagraph (b)
-Publisher FASB
-URI https://asc.fasb.org//1943274/2147482573/350-20-50-2
| Name: |
us-gaap_ScheduleOfGoodwillTextBlock |
| Namespace Prefix: |
us-gaap_ |
| Data Type: |
dtr-types:textBlockItemType |
| Balance Type: |
na |
| Period Type: |
duration |
|
| X |
- DefinitionTabular disclosure of assets, excluding financial assets and goodwill, lacking physical substance and exist in perpetuity, by either major class or business segment. Reference 1: http://fasb.org/us-gaap/role/ref/legacyRef
-Topic 350
-SubTopic 30
-Name Accounting Standards Codification
-Section 50
-Paragraph 2
-Subparagraph (b)
-Publisher FASB
-URI https://asc.fasb.org//1943274/2147482665/350-30-50-2
Reference 2: http://fasb.org/us-gaap/role/ref/legacyRef
-Name Accounting Standards Codification
-Section 50
-Paragraph 3
-Subparagraph (b),(d)
-SubTopic 30
-Topic 350
-Publisher FASB
-URI https://asc.fasb.org//1943274/2147482665/350-30-50-3
| Name: |
us-gaap_ScheduleOfIndefiniteLivedIntangibleAssetsTableTextBlock |
| Namespace Prefix: |
us-gaap_ |
| Data Type: |
dtr-types:textBlockItemType |
| Balance Type: |
na |
| Period Type: |
duration |
|
v3.23.3
Leases (Tables)
|
9 Months Ended |
Sep. 30, 2023 |
|---|
| Leases [Abstract] |
|
| Schedule of Operating Lease Expense |
Total operating lease costs are as follows:
| | | | | | | | | | | | | | | | | | | | | | | | | Three Months Ended | | Nine Months Ended | | (in millions) | September 30, 2023 | | October 1, 2022 | | September 30, 2023 | | October 1, 2022 | | Operating lease costs | | | | | | | | | Cost of goods sold | $ | 5 | | | $ | 3 | | | $ | 15 | | | $ | 13 | | | Selling, general and administrative expenses | 14 | | | 13 | | | 43 | | | 38 | | | Total operating lease costs | $ | 19 | | | $ | 16 | | | $ | 58 | | | $ | 51 | |
|
| Schedule of Carrying Amounts of Operating Leased Assets and Liabilities |
The following table summarizes the carrying amounts of our operating lease assets and liabilities:
| | | | | | | | | | | | | | | | | | | (in millions) | Financial Statement Line Item | | September 30, 2023 | | December 31, 2022 | | Operating lease assets | Other assets | | $ | 197 | | | $ | 191 | | | Operating lease liabilities - current | Accrued liabilities | | $ | 36 | | | $ | 37 | | | Operating lease liabilities - non-current | Other liabilities | | $ | 174 | | | $ | 166 | | | | | | | | | | | | | |
|
| Schedule of Supplemental Cash Flow Information Related to Operating Leases |
Supplemental cash flow information related to operating leases was as follows:
| | | | | | | | | | | | | | | Nine Months Ended | | (in millions) | September 30, 2023 | | October 1, 2022 | | | | Cash paid for operating lease liabilities | $ | 27 | | | $ | 25 | | | | | Non-cash activities: operating lease assets obtained in exchange for new operating lease liabilities | $ | 37 | | | $ | 84 | | | |
|
| X |
- DefinitionLessee, operating lease, liability, cash flow, supplemental disclosures.
| Name: |
rezi_LesseeOperatingLeaseLiabilityCashFlowSupplementalDisclosuresTableTableTextBlock |
| Namespace Prefix: |
rezi_ |
| Data Type: |
dtr-types1:textBlockItemType |
| Balance Type: |
na |
| Period Type: |
duration |
|
| X |
- DefinitionSummary of lease assets and liabilities recognized related to operating leases.
| Name: |
rezi_SummaryOfLeaseAssetsAndLiabilitiesRecognizedRelatedToOperatingLeasesTableTableTextBlock |
| Namespace Prefix: |
rezi_ |
| Data Type: |
dtr-types1:textBlockItemType |
| Balance Type: |
na |
| Period Type: |
duration |
|
| X |
- DefinitionTabular disclosure of lessee's lease cost. Includes, but is not limited to, interest expense for finance lease, amortization of right-of-use asset for finance lease, operating lease cost, short-term lease cost, variable lease cost and sublease income. Reference 1: http://www.xbrl.org/2009/role/commonPracticeRef
-Topic 842
-SubTopic 20
-Name Accounting Standards Codification
-Section 50
-Paragraph 4
-Publisher FASB
-URI https://asc.fasb.org//1943274/2147478964/842-20-50-4
| Name: |
us-gaap_LeaseCostTableTextBlock |
| Namespace Prefix: |
us-gaap_ |
| Data Type: |
dtr-types:textBlockItemType |
| Balance Type: |
na |
| Period Type: |
duration |
|
| X |
- References
+ Details
| Name: |
us-gaap_LeasesAbstract |
| Namespace Prefix: |
us-gaap_ |
| Data Type: |
xbrli:stringItemType |
| Balance Type: |
na |
| Period Type: |
duration |
|
v3.23.3
Long-Term Debt (Tables)
|
9 Months Ended |
Sep. 30, 2023 |
|---|
| Debt Disclosure [Abstract] |
|
| Schedule of Long-Term Debt |
Long-term debt is comprised of the following:
| | | | | | | | | | | | | | | (in millions) | September 30, 2023 | | December 31, 2022 | | | | | 4.000% Senior Notes due 2029 | $ | 300 | | | $ | 300 | | | | | | | | | | | Variable rate A&R Term B Facility | 1,123 | | | 1,131 | | | | | | | Gross debt | 1,423 | | | 1,431 | | | Less: current portion of long-term debt | (12) | | | (12) | | | Less: unamortized deferred financing costs | (14) | | | (15) | | | Total long-term debt | $ | 1,397 | | | $ | 1,404 | |
|
| X |
- References
+ Details
| Name: |
us-gaap_DebtDisclosureAbstract |
| Namespace Prefix: |
us-gaap_ |
| Data Type: |
xbrli:stringItemType |
| Balance Type: |
na |
| Period Type: |
duration |
|
| X |
- DefinitionTabular disclosure of information pertaining to short-term and long-debt instruments or arrangements, including but not limited to identification of terms, features, collateral requirements and other information necessary to a fair presentation.
| Name: |
us-gaap_ScheduleOfDebtTableTextBlock |
| Namespace Prefix: |
us-gaap_ |
| Data Type: |
dtr-types:textBlockItemType |
| Balance Type: |
na |
| Period Type: |
duration |
|
v3.23.3
Derivative Financial Instruments (Tables)
|
9 Months Ended |
Sep. 30, 2023 |
|---|
| Derivative Instruments and Hedging Activities Disclosure [Abstract] |
|
| Schedule of Derivative Instruments in Consolidated Balance Sheets and Pre-Tax Gain (Loss) in Accumulated Other Comprehensive Loss |
The following table summarizes the fair value and presentation of derivative instruments in the Unaudited Consolidated Balance Sheets as well as the changes in fair value recorded in accumulated other comprehensive loss:
| | | | | | | | | | | | | | | | | | | Fair Value of Derivative Assets | | (in millions) | Financial Statement Line Item | | September 30, 2023 | | December 31, 2022 | | | | | | | | | | | | | | | | | | | | | | | | | | | | | | Derivatives designated as hedging instruments | | | | | | Interest rate swaps | Other current assets | | $ | 23 | | | $ | 23 | | | Interest rate swaps | Other assets | | 18 | | | 22 | | | Total derivative assets designated as hedging instruments | | $ | 41 | | | $ | 45 | | | | | | | | | | | | | | | | | | | | | | | | | | | | | | | | | | | | | | | | | | | | Unrealized gain | Accumulated other comprehensive loss | | $ | 38 | | | $ | 42 | |
|
| Schedule of Effect of Derivative Instruments Designated as Cash Flow Hedges |
The following table summarizes the effect of derivative instruments designated as cash flow hedges in other comprehensive income and the Unaudited Consolidated Statements of Operations:
| | | | | | | | | | | | | | | | | | | | | | | | | Three Months Ended | | Nine Months Ended | | (in millions) | September 30, 2023 | | October 1, 2022 | | September 30, 2023 | | October 1, 2022 | | Gains recorded in accumulated other comprehensive loss, beginning of period | $ | 40 | | | $ | 30 | | | $ | 42 | | | $ | 6 | | | Current period (loss) gain recognized in/reclassified from other comprehensive income | (2) | | | 14 | | | (4) | | | 38 | | | Gains recorded in accumulated other comprehensive loss, end of period | $ | 38 | | | $ | 44 | | | $ | 38 | | | $ | 44 | |
|
| X |
- References
+ Details
| Name: |
us-gaap_DerivativeInstrumentsAndHedgingActivitiesDisclosureAbstract |
| Namespace Prefix: |
us-gaap_ |
| Data Type: |
xbrli:stringItemType |
| Balance Type: |
na |
| Period Type: |
duration |
|
| X |
- DefinitionTabular disclosure of gain (loss) on derivative and nonderivative instruments designated and qualifying as cash flow hedge recorded in accumulated other comprehensive income (AOCI) and reclassified into earnings. Reference 1: http://fasb.org/us-gaap/role/ref/legacyRef
-Name Accounting Standards Codification
-Topic 815
-SubTopic 10
-Section 50
-Paragraph 4C
-Subparagraph (c)
-Publisher FASB
-URI https://asc.fasb.org//1943274/2147480434/815-10-50-4C
| Name: |
us-gaap_ScheduleOfCashFlowHedgesIncludedInAccumulatedOtherComprehensiveIncomeLossTableTextBlock |
| Namespace Prefix: |
us-gaap_ |
| Data Type: |
dtr-types:textBlockItemType |
| Balance Type: |
na |
| Period Type: |
duration |
|
| X |
- DefinitionTabular disclosure of the location and fair value amounts of derivative instruments (and nonderivative instruments that are designated and qualify as hedging instruments) reported in the statement of financial position. Reference 1: http://fasb.org/us-gaap/role/ref/legacyRef
-Name Accounting Standards Codification
-Topic 815
-SubTopic 10
-Section 50
-Paragraph 4B
-Publisher FASB
-URI https://asc.fasb.org//1943274/2147480434/815-10-50-4B
| Name: |
us-gaap_ScheduleOfDerivativeInstrumentsInStatementOfFinancialPositionFairValueTextBlock |
| Namespace Prefix: |
us-gaap_ |
| Data Type: |
dtr-types:textBlockItemType |
| Balance Type: |
na |
| Period Type: |
duration |
|
v3.23.3
Fair Value (Tables)
|
9 Months Ended |
Sep. 30, 2023 |
|---|
| Fair Value Disclosures [Abstract] |
|
| Schedule of Carrying Values and Estimated Fair Values of Debt Instruments |
The following table provides a summary of the carrying amount and fair value of outstanding debt:
| | | | | | | | | | | | | | | | | | | | | | | | | September 30, 2023 | | December 31, 2022 | | (in millions) | Carrying Value | | Fair Value | | Carrying Value | | Fair Value | | Debt | | | | | | | | 4.000% Senior Notes due 2029 | $ | 300 | | | $ | 246 | | | $ | 300 | | | $ | 242 | | | Variable rate A&R Term B Facility | 1,123 | | | 1,127 | | | 1,131 | | | 1,125 | | | Total debt | $ | 1,423 | | | $ | 1,373 | | | $ | 1,431 | | | $ | 1,367 | |
|
| Schedule of Fair Value, Assets and Liabilities Measured on Recurring Basis |
The following table provides a summary of the carrying amount and fair value of our interest rate swaps:
| | | | | | | | | | | | | | | | | | | | | | | | | | | | | September 30, 2023 | | December 31, 2022 | | (in millions) | Carrying Value | | | | Fair Value | | Carrying Value | | | | Fair Value | | Assets: | | | | | | | | | | | | | Interest rate swaps | $ | 41 | | | | | $ | 41 | | | $ | 45 | | | | | $ | 45 | | | | | | | | | | | | | | | | | | | | | | | | | | | | | | | | | | | | | |
|
| X |
- References
+ Details
| Name: |
us-gaap_FairValueDisclosuresAbstract |
| Namespace Prefix: |
us-gaap_ |
| Data Type: |
xbrli:stringItemType |
| Balance Type: |
na |
| Period Type: |
duration |
|
| X |
- DefinitionTabular disclosure of information pertaining to carrying amount and estimated fair value of short-term and long-term debt instruments or arrangements, including but not limited to, identification of terms, features, and collateral requirements.
| Name: |
us-gaap_ScheduleOfCarryingValuesAndEstimatedFairValuesOfDebtInstrumentsTableTextBlock |
| Namespace Prefix: |
us-gaap_ |
| Data Type: |
dtr-types:textBlockItemType |
| Balance Type: |
na |
| Period Type: |
duration |
|
| X |
- DefinitionTabular disclosure of assets and liabilities, including [financial] instruments measured at fair value that are classified in stockholders' equity, if any, that are measured at fair value on a recurring basis. The disclosures contemplated herein include the fair value measurements at the reporting date by the level within the fair value hierarchy in which the fair value measurements in their entirety fall, segregating fair value measurements using quoted prices in active markets for identical assets (Level 1), significant other observable inputs (Level 2), and significant unobservable inputs (Level 3). Reference 1: http://www.xbrl.org/2003/role/disclosureRef
-Topic 820
-SubTopic 10
-Name Accounting Standards Codification
-Section 50
-Paragraph 2
-Subparagraph (a)
-Publisher FASB
-URI https://asc.fasb.org//1943274/2147482106/820-10-50-2
Reference 2: http://www.xbrl.org/2003/role/disclosureRef
-Topic 820
-SubTopic 10
-Name Accounting Standards Codification
-Section 50
-Paragraph 2
-Subparagraph (b)
-Publisher FASB
-URI https://asc.fasb.org//1943274/2147482106/820-10-50-2
| Name: |
us-gaap_ScheduleOfFairValueAssetsAndLiabilitiesMeasuredOnRecurringBasisTableTextBlock |
| Namespace Prefix: |
us-gaap_ |
| Data Type: |
dtr-types:textBlockItemType |
| Balance Type: |
na |
| Period Type: |
duration |
|
v3.23.3
Accrued Liabilities (Tables)
|
9 Months Ended |
Sep. 30, 2023 |
|---|
| Payables and Accruals [Abstract] |
|
| Schedule of Accrued Liabilities |
Accrued liabilities consist of the following:
| | | | | | | | | | | | | | | (in millions) | September 30, 2023 | | December 31, 2022 | | Obligations payable under Indemnification Agreements | $ | 140 | | | $ | 140 | | | Compensation, benefit and other employee-related | 100 | | | 108 | | | Customer rebate reserve | 92 | | | 98 | | Restructuring | 41 | | | 27 | | | Current operating lease liability | 36 | | | 37 | | Held for sale (1) | 31 | | | — | | | Product warranties | 24 | | | 40 | | | Taxes payable | 17 | | | 38 | | Other (2) | 111 | | | 152 | | | Total accrued liabilities | $ | 592 | | | $ | 640 | |
(1) Relates to the divestiture of our Genesis business as discussed in Note 1. Nature of Operations and Basis of Presentation. (2) Other includes accruals for advertising, legal and professional reserves, freight, royalties, interest, and other miscellaneous items.
|
| X |
- References
+ Details
| Name: |
us-gaap_PayablesAndAccrualsAbstract |
| Namespace Prefix: |
us-gaap_ |
| Data Type: |
xbrli:stringItemType |
| Balance Type: |
na |
| Period Type: |
duration |
|
| X |
- DefinitionTabular disclosure of the components of accrued liabilities.
| Name: |
us-gaap_ScheduleOfAccruedLiabilitiesTableTextBlock |
| Namespace Prefix: |
us-gaap_ |
| Data Type: |
dtr-types:textBlockItemType |
| Balance Type: |
na |
| Period Type: |
duration |
|
v3.23.3
Commitments and Contingencies (Tables)
|
9 Months Ended |
Sep. 30, 2023 |
|---|
| Commitments and Contingencies Disclosure [Abstract] |
|
| Schedule of Reimbursement Agreement Liabilities |
The following table summarizes information concerning the Reimbursement and Tax Matter Agreements’ liabilities:
| | | | | | | | | | | | | | | | | | | (in millions) | Reimbursement Agreement | | Tax Matters Agreement | | Total | | Balance as of December 31, 2022 | $ | 614 | | | $ | 106 | | | $ | 720 | | Accruals for liabilities deemed probable and reasonably estimable (1) | 128 | | | (4) | | | 124 | | | Payments to Honeywell | (105) | | | — | | | (105) | | | Balance as of September 30, 2023 | $ | 637 | | | $ | 102 | | | $ | 739 | |
(1) Reimbursement Agreement liabilities deemed probable and reasonably estimable; however, it is possible we could pay $140 million per year (exclusive of any late payment fees up to 5% per annum) until the earlier of (1) December 31, 2043; or (2) December 31 of the third consecutive year during which the annual reimbursement obligation (including in respect of deferred payment amounts) has been less than $25 million.
|
| Schedule of Reimbursement Agreement Liabilities Included in Balance Sheet Accounts |
The liabilities related to the Reimbursement and Tax Matters Agreements are included in the following balance sheet accounts:
| | | | | | | | | | | | | (in millions) | September 30, 2023 | | December 31, 2022 | | Accrued liabilities | $ | 140 | | | $ | 140 | | | Obligations payable under Indemnification Agreements | 599 | | | 580 | | | Total indemnification liabilities | $ | 739 | | | $ | 720 | |
|
| Schedule of Recorded Obligations for Product Warranties and Product Performance Guarantee |
The following table summarizes information concerning recorded obligations for product warranties and product performance guarantees: | | | | | | | | | | | | | (in millions) | September 30, 2023 | | December 31, 2022 | | Beginning balance | $ | 48 | | | $ | 23 | | | Accruals for warranties/guarantees issued during the year | 19 | | | 30 | | | Adjustment of pre-existing warranties/guarantees | (2) | | | (2) | | | Settlement of warranty/guarantee claims | (32) | | | (17) | | | Reserve of acquired company at date of acquisition | — | | | 14 | | | Ending balance | $ | 33 | | | $ | 48 | |
|
| X |
- DefinitionSchedule of accrual for indemnification balance sheet classification.
| Name: |
rezi_ScheduleOfAccrualForIndemnificationBalanceSheetClassificationTableTextBlock |
| Namespace Prefix: |
rezi_ |
| Data Type: |
dtr-types1:textBlockItemType |
| Balance Type: |
na |
| Period Type: |
duration |
|
| X |
- DefinitionSchedule of accrual for indemnification.
| Name: |
rezi_ScheduleOfAccrualForIndemnificationTableTextBlock |
| Namespace Prefix: |
rezi_ |
| Data Type: |
dtr-types1:textBlockItemType |
| Balance Type: |
na |
| Period Type: |
duration |
|
| X |
- References
+ Details
| Name: |
us-gaap_CommitmentsAndContingenciesDisclosureAbstract |
| Namespace Prefix: |
us-gaap_ |
| Data Type: |
xbrli:stringItemType |
| Balance Type: |
na |
| Period Type: |
duration |
|
| X |
- DefinitionTabular disclosure of the changes in the guarantor's aggregate product warranty liability, including the beginning balance of the aggregate product warranty liability, the aggregate reductions in that liability for payments made (in cash or in kind) under the warranty, the aggregate changes in the liability for accruals related to product warranties issued during the reporting period, the aggregate changes in the liability for accruals related to preexisting warranties (including adjustments related to changes in estimates), and the ending balance of the aggregate product warranty liability. Reference 1: http://www.xbrl.org/2003/role/disclosureRef
-Topic 460
-SubTopic 10
-Name Accounting Standards Codification
-Section 50
-Paragraph 8
-Subparagraph (c)
-Publisher FASB
-URI https://asc.fasb.org//1943274/2147482425/460-10-50-8
| Name: |
us-gaap_ScheduleOfProductWarrantyLiabilityTableTextBlock |
| Namespace Prefix: |
us-gaap_ |
| Data Type: |
dtr-types:textBlockItemType |
| Balance Type: |
na |
| Period Type: |
duration |
|
v3.23.3
Earnings Per Share (Tables)
|
9 Months Ended |
Sep. 30, 2023 |
|---|
| Earnings Per Share [Abstract] |
|
| Schedule of Computation of Basic and Diluted Earnings Per Share |
The reconciliation of the numerator and denominator used for the computation of basic and diluted earnings per share follows: | | | | | | | | | | | | | | | | | | | | | | | | | Three Months Ended | | Nine Months Ended | | (in millions, except per share data) | September 30, 2023 | | October 1, 2022 | | September 30, 2023 | | October 1, 2022 | | Numerator for basic and diluted earnings per share: | | | | | | | | | | | | | | | | | | | | | | | | | Net income | $ | 21 | | | $ | 63 | | | $ | 128 | | | $ | 244 | | | | | | | | | | | Denominator for basic and diluted earnings per share: | | | | | | | | | Weighted average basic number of common shares outstanding | 147 | | | 146 | | | 147 | | | 145 | | | Plus: dilutive effect of common stock equivalents | 1 | | | 3 | | | 2 | | | 4 | | | Weighted average diluted number of common shares outstanding | 148 | | | 149 | | | 149 | | | 149 | | | | | | | | | | | Earnings per share: | | | | | | | | | | | | | | | | | | | | | | | | | | | | | | | | | Basic | $ | 0.14 | | | $ | 0.43 | | | $ | 0.87 | | | $ | 1.68 | | | | | | | | | | | | | | | | | | | | | | | | | | | | | | | | | | | Diluted | $ | 0.14 | | | $ | 0.42 | | | $ | 0.86 | | | $ | 1.64 | |
|
| X |
- References
+ Details
| Name: |
us-gaap_EarningsPerShareAbstract |
| Namespace Prefix: |
us-gaap_ |
| Data Type: |
xbrli:stringItemType |
| Balance Type: |
na |
| Period Type: |
duration |
|
| X |
- DefinitionTabular disclosure of an entity's basic and diluted earnings per share calculations, including a reconciliation of numerators and denominators of the basic and diluted per-share computations for income from continuing operations. Reference 1: http://www.xbrl.org/2009/role/commonPracticeRef
-Topic 260
-SubTopic 10
-Name Accounting Standards Codification
-Section 50
-Paragraph 1
-Subparagraph (a)
-Publisher FASB
-URI https://asc.fasb.org//1943274/2147482662/260-10-50-1
| Name: |
us-gaap_ScheduleOfEarningsPerShareBasicAndDilutedTableTextBlock |
| Namespace Prefix: |
us-gaap_ |
| Data Type: |
dtr-types:textBlockItemType |
| Balance Type: |
na |
| Period Type: |
duration |
|
v3.23.3
| X |
- DefinitionAmount of consideration received or receivable for the disposal of assets and liabilities, including discontinued operation.
| Name: |
us-gaap_DisposalGroupIncludingDiscontinuedOperationConsideration |
| Namespace Prefix: |
us-gaap_ |
| Data Type: |
xbrli:monetaryItemType |
| Balance Type: |
debit |
| Period Type: |
instant |
|
| X |
- DefinitionLine items represent financial concepts included in a table. These concepts are used to disclose reportable information associated with domain members defined in one or many axes to the table.
| Name: |
us-gaap_IncomeStatementBalanceSheetAndAdditionalDisclosuresByDisposalGroupsIncludingDiscontinuedOperationsLineItems |
| Namespace Prefix: |
us-gaap_ |
| Data Type: |
xbrli:stringItemType |
| Balance Type: |
na |
| Period Type: |
duration |
|
| X |
- Details
| Name: |
us-gaap_IncomeStatementBalanceSheetAndAdditionalDisclosuresByDisposalGroupsIncludingDiscontinuedOperationsAxis=rezi_GenesisCableMember |
| Namespace Prefix: |
|
| Data Type: |
na |
| Balance Type: |
|
| Period Type: |
|
|
| X |
- Details
| Name: |
us-gaap_DisposalGroupClassificationAxis=us-gaap_DisposalGroupHeldforsaleNotDiscontinuedOperationsMember |
| Namespace Prefix: |
|
| Data Type: |
na |
| Balance Type: |
|
| Period Type: |
|
|
v3.23.3
| X |
- DefinitionAmount classified as assets attributable to disposal group held for sale or disposed of. Reference 1: http://fasb.org/us-gaap/role/ref/legacyRef
-Name Accounting Standards Codification
-Section 45
-Paragraph 10
-SubTopic 20
-Topic 205
-Publisher FASB
-URI https://asc.fasb.org//1943274/2147483475/205-20-45-10
Reference 2: http://www.xbrl.org/2003/role/disclosureRef
-Topic 205
-SubTopic 20
-Name Accounting Standards Codification
-Section 50
-Paragraph 7
-Publisher FASB
-URI https://asc.fasb.org//1943274/2147483499/205-20-50-7
Reference 3: http://www.xbrl.org/2003/role/disclosureRef
-Topic 205
-SubTopic 20
-Name Accounting Standards Codification
-Section 50
-Paragraph 5C
-Subparagraph (a)(2)
-Publisher FASB
-URI https://asc.fasb.org//1943274/2147483499/205-20-50-5C
Reference 4: http://fasb.org/us-gaap/role/ref/legacyRef
-Topic 205
-SubTopic 20
-Name Accounting Standards Codification
-Section 50
-Paragraph 5B
-Subparagraph (e)
-Publisher FASB
-URI https://asc.fasb.org//1943274/2147483499/205-20-50-5B
Reference 5: http://fasb.org/us-gaap/role/ref/legacyRef
-Topic 360
-SubTopic 10
-Name Accounting Standards Codification
-Section 50
-Paragraph 3
-Subparagraph (e)
-Publisher FASB
-URI https://asc.fasb.org//1943274/2147482099/360-10-50-3
Reference 6: http://fasb.org/us-gaap/role/ref/legacyRef
-Topic 205
-SubTopic 20
-Name Accounting Standards Codification
-Section 45
-Paragraph 11
-Publisher FASB
-URI https://asc.fasb.org//1943274/2147483475/205-20-45-11
| Name: |
us-gaap_AssetsOfDisposalGroupIncludingDiscontinuedOperation |
| Namespace Prefix: |
us-gaap_ |
| Data Type: |
xbrli:monetaryItemType |
| Balance Type: |
debit |
| Period Type: |
instant |
|
| X |
- DefinitionAmount classified as accounts, notes and loans receivable attributable to disposal group held for sale or disposed of. Reference 1: http://fasb.org/us-gaap/role/ref/legacyRef
-Name Accounting Standards Codification
-Section 45
-Paragraph 10
-SubTopic 20
-Topic 205
-Publisher FASB
-URI https://asc.fasb.org//1943274/2147483475/205-20-45-10
Reference 2: http://fasb.org/us-gaap/role/ref/legacyRef
-Topic 205
-SubTopic 20
-Name Accounting Standards Codification
-Section 50
-Paragraph 5B
-Subparagraph (e)
-Publisher FASB
-URI https://asc.fasb.org//1943274/2147483499/205-20-50-5B
Reference 3: http://fasb.org/us-gaap/role/ref/legacyRef
-Topic 360
-SubTopic 10
-Name Accounting Standards Codification
-Section 50
-Paragraph 3
-Subparagraph (e)
-Publisher FASB
-URI https://asc.fasb.org//1943274/2147482099/360-10-50-3
Reference 4: http://fasb.org/us-gaap/role/ref/legacyRef
-Topic 205
-SubTopic 20
-Name Accounting Standards Codification
-Section 45
-Paragraph 11
-Publisher FASB
-URI https://asc.fasb.org//1943274/2147483475/205-20-45-11
| Name: |
us-gaap_DisposalGroupIncludingDiscontinuedOperationAccountsNotesAndLoansReceivableNet |
| Namespace Prefix: |
us-gaap_ |
| Data Type: |
xbrli:monetaryItemType |
| Balance Type: |
debit |
| Period Type: |
instant |
|
| X |
- DefinitionAmount classified as accounts payable attributable to disposal group held for sale or disposed of. Reference 1: http://fasb.org/us-gaap/role/ref/legacyRef
-Name Accounting Standards Codification
-Section 45
-Paragraph 10
-SubTopic 20
-Topic 205
-Publisher FASB
-URI https://asc.fasb.org//1943274/2147483475/205-20-45-10
Reference 2: http://fasb.org/us-gaap/role/ref/legacyRef
-Topic 205
-SubTopic 20
-Name Accounting Standards Codification
-Section 50
-Paragraph 5B
-Subparagraph (e)
-Publisher FASB
-URI https://asc.fasb.org//1943274/2147483499/205-20-50-5B
Reference 3: http://fasb.org/us-gaap/role/ref/legacyRef
-Topic 360
-SubTopic 10
-Name Accounting Standards Codification
-Section 50
-Paragraph 3
-Subparagraph (e)
-Publisher FASB
-URI https://asc.fasb.org//1943274/2147482099/360-10-50-3
Reference 4: http://fasb.org/us-gaap/role/ref/legacyRef
-Topic 205
-SubTopic 20
-Name Accounting Standards Codification
-Section 45
-Paragraph 11
-Publisher FASB
-URI https://asc.fasb.org//1943274/2147483475/205-20-45-11
| Name: |
us-gaap_DisposalGroupIncludingDiscontinuedOperationAccountsPayable |
| Namespace Prefix: |
us-gaap_ |
| Data Type: |
xbrli:monetaryItemType |
| Balance Type: |
credit |
| Period Type: |
instant |
|
| X |
- DefinitionAmount classified as accrued liabilities attributable to disposal group held for sale or disposed of, expected to be disposed of within one year or the normal operating cycle, if longer. Reference 1: http://fasb.org/us-gaap/role/ref/legacyRef
-Name Accounting Standards Codification
-Section 45
-Paragraph 10
-SubTopic 20
-Topic 205
-Publisher FASB
-URI https://asc.fasb.org//1943274/2147483475/205-20-45-10
Reference 2: http://fasb.org/us-gaap/role/ref/legacyRef
-Topic 360
-SubTopic 10
-Name Accounting Standards Codification
-Section 45
-Paragraph 9
-Publisher FASB
-URI https://asc.fasb.org//1943274/2147482130/360-10-45-9
Reference 3: http://fasb.org/us-gaap/role/ref/legacyRef
-Topic 205
-SubTopic 20
-Name Accounting Standards Codification
-Section 50
-Paragraph 5B
-Subparagraph (e)
-Publisher FASB
-URI https://asc.fasb.org//1943274/2147483499/205-20-50-5B
Reference 4: http://fasb.org/us-gaap/role/ref/legacyRef
-Topic 360
-SubTopic 10
-Name Accounting Standards Codification
-Section 50
-Paragraph 3
-Subparagraph (e)
-Publisher FASB
-URI https://asc.fasb.org//1943274/2147482099/360-10-50-3
Reference 5: http://fasb.org/us-gaap/role/ref/legacyRef
-Topic 205
-SubTopic 20
-Name Accounting Standards Codification
-Section 45
-Paragraph 11
-Publisher FASB
-URI https://asc.fasb.org//1943274/2147483475/205-20-45-11
| Name: |
us-gaap_DisposalGroupIncludingDiscontinuedOperationAccruedLiabilitiesCurrent |
| Namespace Prefix: |
us-gaap_ |
| Data Type: |
xbrli:monetaryItemType |
| Balance Type: |
credit |
| Period Type: |
instant |
|
| X |
- DefinitionAmount classified as goodwill attributable to disposal group held for sale or disposed of. Reference 1: http://fasb.org/us-gaap/role/ref/legacyRef
-Name Accounting Standards Codification
-Section 45
-Paragraph 10
-SubTopic 20
-Topic 205
-Publisher FASB
-URI https://asc.fasb.org//1943274/2147483475/205-20-45-10
Reference 2: http://fasb.org/us-gaap/role/ref/legacyRef
-Topic 205
-SubTopic 20
-Name Accounting Standards Codification
-Section 50
-Paragraph 5B
-Subparagraph (e)
-Publisher FASB
-URI https://asc.fasb.org//1943274/2147483499/205-20-50-5B
Reference 3: http://fasb.org/us-gaap/role/ref/legacyRef
-Topic 360
-SubTopic 10
-Name Accounting Standards Codification
-Section 50
-Paragraph 3
-Subparagraph (e)
-Publisher FASB
-URI https://asc.fasb.org//1943274/2147482099/360-10-50-3
Reference 4: http://fasb.org/us-gaap/role/ref/legacyRef
-Topic 205
-SubTopic 20
-Name Accounting Standards Codification
-Section 45
-Paragraph 11
-Publisher FASB
-URI https://asc.fasb.org//1943274/2147483475/205-20-45-11
| Name: |
us-gaap_DisposalGroupIncludingDiscontinuedOperationGoodwill1 |
| Namespace Prefix: |
us-gaap_ |
| Data Type: |
xbrli:monetaryItemType |
| Balance Type: |
debit |
| Period Type: |
instant |
|
| X |
- DefinitionAmount classified as inventory attributable to disposal group held for sale or disposed of. Reference 1: http://fasb.org/us-gaap/role/ref/legacyRef
-Name Accounting Standards Codification
-Section 45
-Paragraph 10
-SubTopic 20
-Topic 205
-Publisher FASB
-URI https://asc.fasb.org//1943274/2147483475/205-20-45-10
Reference 2: http://fasb.org/us-gaap/role/ref/legacyRef
-Topic 205
-SubTopic 20
-Name Accounting Standards Codification
-Section 50
-Paragraph 5B
-Subparagraph (e)
-Publisher FASB
-URI https://asc.fasb.org//1943274/2147483499/205-20-50-5B
Reference 3: http://fasb.org/us-gaap/role/ref/legacyRef
-Topic 360
-SubTopic 10
-Name Accounting Standards Codification
-Section 50
-Paragraph 3
-Subparagraph (e)
-Publisher FASB
-URI https://asc.fasb.org//1943274/2147482099/360-10-50-3
Reference 4: http://fasb.org/us-gaap/role/ref/legacyRef
-Topic 205
-SubTopic 20
-Name Accounting Standards Codification
-Section 45
-Paragraph 11
-Publisher FASB
-URI https://asc.fasb.org//1943274/2147483475/205-20-45-11
| Name: |
us-gaap_DisposalGroupIncludingDiscontinuedOperationInventory1 |
| Namespace Prefix: |
us-gaap_ |
| Data Type: |
xbrli:monetaryItemType |
| Balance Type: |
debit |
| Period Type: |
instant |
|
| X |
- DefinitionAmount classified as other assets attributable to disposal group held for sale or disposed of. Reference 1: http://fasb.org/us-gaap/role/ref/legacyRef
-Name Accounting Standards Codification
-Section 45
-Paragraph 10
-SubTopic 20
-Topic 205
-Publisher FASB
-URI https://asc.fasb.org//1943274/2147483475/205-20-45-10
Reference 2: http://fasb.org/us-gaap/role/ref/legacyRef
-Topic 205
-SubTopic 20
-Name Accounting Standards Codification
-Section 50
-Paragraph 5B
-Subparagraph (e)
-Publisher FASB
-URI https://asc.fasb.org//1943274/2147483499/205-20-50-5B
Reference 3: http://fasb.org/us-gaap/role/ref/legacyRef
-Topic 360
-SubTopic 10
-Name Accounting Standards Codification
-Section 50
-Paragraph 3
-Subparagraph (e)
-Publisher FASB
-URI https://asc.fasb.org//1943274/2147482099/360-10-50-3
Reference 4: http://fasb.org/us-gaap/role/ref/legacyRef
-Topic 205
-SubTopic 20
-Name Accounting Standards Codification
-Section 45
-Paragraph 11
-Publisher FASB
-URI https://asc.fasb.org//1943274/2147483475/205-20-45-11
| Name: |
us-gaap_DisposalGroupIncludingDiscontinuedOperationOtherAssets |
| Namespace Prefix: |
us-gaap_ |
| Data Type: |
xbrli:monetaryItemType |
| Balance Type: |
debit |
| Period Type: |
instant |
|
| X |
- DefinitionAmount classified as other liabilities attributable to disposal group held for sale or disposed of. Reference 1: http://fasb.org/us-gaap/role/ref/legacyRef
-Name Accounting Standards Codification
-Section 45
-Paragraph 10
-SubTopic 20
-Topic 205
-Publisher FASB
-URI https://asc.fasb.org//1943274/2147483475/205-20-45-10
Reference 2: http://fasb.org/us-gaap/role/ref/legacyRef
-Topic 205
-SubTopic 20
-Name Accounting Standards Codification
-Section 50
-Paragraph 5B
-Subparagraph (e)
-Publisher FASB
-URI https://asc.fasb.org//1943274/2147483499/205-20-50-5B
Reference 3: http://fasb.org/us-gaap/role/ref/legacyRef
-Topic 360
-SubTopic 10
-Name Accounting Standards Codification
-Section 50
-Paragraph 3
-Subparagraph (e)
-Publisher FASB
-URI https://asc.fasb.org//1943274/2147482099/360-10-50-3
Reference 4: http://fasb.org/us-gaap/role/ref/legacyRef
-Topic 205
-SubTopic 20
-Name Accounting Standards Codification
-Section 45
-Paragraph 11
-Publisher FASB
-URI https://asc.fasb.org//1943274/2147483475/205-20-45-11
| Name: |
us-gaap_DisposalGroupIncludingDiscontinuedOperationOtherLiabilities |
| Namespace Prefix: |
us-gaap_ |
| Data Type: |
xbrli:monetaryItemType |
| Balance Type: |
credit |
| Period Type: |
instant |
|
| X |
- DefinitionAmount classified as property, plant and equipment attributable to disposal group held for sale or disposed of, expected to be disposed of within one year or the normal operating cycle, if longer. Reference 1: http://fasb.org/us-gaap/role/ref/legacyRef
-Name Accounting Standards Codification
-Section 45
-Paragraph 10
-SubTopic 20
-Topic 205
-Publisher FASB
-URI https://asc.fasb.org//1943274/2147483475/205-20-45-10
Reference 2: http://fasb.org/us-gaap/role/ref/legacyRef
-Topic 360
-SubTopic 10
-Name Accounting Standards Codification
-Section 45
-Paragraph 9
-Publisher FASB
-URI https://asc.fasb.org//1943274/2147482130/360-10-45-9
Reference 3: http://fasb.org/us-gaap/role/ref/legacyRef
-Topic 205
-SubTopic 20
-Name Accounting Standards Codification
-Section 50
-Paragraph 5B
-Subparagraph (e)
-Publisher FASB
-URI https://asc.fasb.org//1943274/2147483499/205-20-50-5B
Reference 4: http://fasb.org/us-gaap/role/ref/legacyRef
-Topic 360
-SubTopic 10
-Name Accounting Standards Codification
-Section 50
-Paragraph 3
-Subparagraph (e)
-Publisher FASB
-URI https://asc.fasb.org//1943274/2147482099/360-10-50-3
Reference 5: http://fasb.org/us-gaap/role/ref/legacyRef
-Topic 205
-SubTopic 20
-Name Accounting Standards Codification
-Section 45
-Paragraph 11
-Publisher FASB
-URI https://asc.fasb.org//1943274/2147483475/205-20-45-11
| Name: |
us-gaap_DisposalGroupIncludingDiscontinuedOperationPropertyPlantAndEquipmentCurrent |
| Namespace Prefix: |
us-gaap_ |
| Data Type: |
xbrli:monetaryItemType |
| Balance Type: |
debit |
| Period Type: |
instant |
|
| X |
- DefinitionLine items represent financial concepts included in a table. These concepts are used to disclose reportable information associated with domain members defined in one or many axes to the table.
| Name: |
us-gaap_IncomeStatementBalanceSheetAndAdditionalDisclosuresByDisposalGroupsIncludingDiscontinuedOperationsLineItems |
| Namespace Prefix: |
us-gaap_ |
| Data Type: |
xbrli:stringItemType |
| Balance Type: |
na |
| Period Type: |
duration |
|
| X |
- DefinitionAmount classified as liabilities attributable to disposal group held for sale or disposed of. Reference 1: http://fasb.org/us-gaap/role/ref/legacyRef
-Name Accounting Standards Codification
-Section 45
-Paragraph 10
-SubTopic 20
-Topic 205
-Publisher FASB
-URI https://asc.fasb.org//1943274/2147483475/205-20-45-10
Reference 2: http://www.xbrl.org/2003/role/disclosureRef
-Topic 205
-SubTopic 20
-Name Accounting Standards Codification
-Section 50
-Paragraph 7
-Publisher FASB
-URI https://asc.fasb.org//1943274/2147483499/205-20-50-7
Reference 3: http://www.xbrl.org/2003/role/disclosureRef
-Topic 205
-SubTopic 20
-Name Accounting Standards Codification
-Section 50
-Paragraph 5C
-Subparagraph (a)(2)
-Publisher FASB
-URI https://asc.fasb.org//1943274/2147483499/205-20-50-5C
Reference 4: http://fasb.org/us-gaap/role/ref/legacyRef
-Topic 205
-SubTopic 20
-Name Accounting Standards Codification
-Section 50
-Paragraph 5B
-Subparagraph (e)
-Publisher FASB
-URI https://asc.fasb.org//1943274/2147483499/205-20-50-5B
Reference 5: http://fasb.org/us-gaap/role/ref/legacyRef
-Topic 360
-SubTopic 10
-Name Accounting Standards Codification
-Section 50
-Paragraph 3
-Subparagraph (e)
-Publisher FASB
-URI https://asc.fasb.org//1943274/2147482099/360-10-50-3
Reference 6: http://fasb.org/us-gaap/role/ref/legacyRef
-Topic 205
-SubTopic 20
-Name Accounting Standards Codification
-Section 45
-Paragraph 11
-Publisher FASB
-URI https://asc.fasb.org//1943274/2147483475/205-20-45-11
| Name: |
us-gaap_LiabilitiesOfDisposalGroupIncludingDiscontinuedOperation |
| Namespace Prefix: |
us-gaap_ |
| Data Type: |
xbrli:monetaryItemType |
| Balance Type: |
credit |
| Period Type: |
instant |
|
| X |
- Details
| Name: |
us-gaap_DisposalGroupClassificationAxis=us-gaap_DisposalGroupHeldforsaleNotDiscontinuedOperationsMember |
| Namespace Prefix: |
|
| Data Type: |
na |
| Balance Type: |
|
| Period Type: |
|
|
| X |
- Details
| Name: |
us-gaap_IncomeStatementBalanceSheetAndAdditionalDisclosuresByDisposalGroupsIncludingDiscontinuedOperationsAxis=rezi_GenesisCableMember |
| Namespace Prefix: |
|
| Data Type: |
na |
| Balance Type: |
|
| Period Type: |
|
|
v3.23.3
| X |
- DefinitionLine items represent financial concepts included in a table. These concepts are used to disclose reportable information associated with domain members defined in one or many axes to the table. Reference 1: http://www.xbrl.org/2003/role/disclosureRef
-Topic 805
-SubTopic 20
-Name Accounting Standards Codification
-Section 50
-Paragraph 5
-Subparagraph (a)
-Publisher FASB
-URI https://asc.fasb.org//1943274/2147479907/805-20-50-5
| Name: |
us-gaap_BusinessAcquisitionLineItems |
| Namespace Prefix: |
us-gaap_ |
| Data Type: |
xbrli:stringItemType |
| Balance Type: |
na |
| Period Type: |
duration |
|
| X |
- DefinitionPercentage of voting equity interests acquired at the acquisition date in the business combination. Reference 1: http://fasb.org/us-gaap/role/ref/legacyRef
-Name Accounting Standards Codification
-Topic 805
-SubTopic 10
-Section 50
-Paragraph 2
-Subparagraph (c)
-Publisher FASB
-URI https://asc.fasb.org//1943274/2147479328/805-10-50-2
| Name: |
us-gaap_BusinessAcquisitionPercentageOfVotingInterestsAcquired |
| Namespace Prefix: |
us-gaap_ |
| Data Type: |
dtr-types:percentItemType |
| Balance Type: |
na |
| Period Type: |
instant |
|
| X |
- Details
| Name: |
us-gaap_BusinessAcquisitionAxis=rezi_SftySAMember |
| Namespace Prefix: |
|
| Data Type: |
na |
| Balance Type: |
|
| Period Type: |
|
|
| X |
- Details
| Name: |
us-gaap_BusinessAcquisitionAxis=rezi_BTXTechnologiesIncMember |
| Namespace Prefix: |
|
| Data Type: |
na |
| Balance Type: |
|
| Period Type: |
|
|
| X |
- Details
| Name: |
us-gaap_BusinessAcquisitionAxis=rezi_TekniqueLimitedMember |
| Namespace Prefix: |
|
| Data Type: |
na |
| Balance Type: |
|
| Period Type: |
|
|
| X |
- Details
| Name: |
us-gaap_BusinessAcquisitionAxis=rezi_ElectronicCustomerDistributorsIncMember |
| Namespace Prefix: |
|
| Data Type: |
na |
| Balance Type: |
|
| Period Type: |
|
|
| X |
- Details
| Name: |
us-gaap_BusinessAcquisitionAxis=rezi_FirstAlertMember |
| Namespace Prefix: |
|
| Data Type: |
na |
| Balance Type: |
|
| Period Type: |
|
|
v3.23.3
| X |
- DefinitionNumber of operating segments. An operating segment is a component of an enterprise: (a) that engages in business activities from which it may earn revenues and incur expenses (including revenues and expenses relating to transactions with other components of the same enterprise), (b) whose operating results are regularly reviewed by the enterprise's chief operating decision maker to make decisions about resources to be allocated to the segment and assess its performance, and (c) for which discrete financial information is available. An operating segment may engage in business activities for which it has yet to earn revenues, for example, start-up operations may be operating segments before earning revenues. Reference 1: http://www.xbrl.org/2009/role/commonPracticeRef
-Topic 280
-SubTopic 10
-Name Accounting Standards Codification
-Section 50
-Paragraph 18
-Publisher FASB
-URI https://asc.fasb.org//1943274/2147482810/280-10-50-18
| Name: |
us-gaap_NumberOfOperatingSegments |
| Namespace Prefix: |
us-gaap_ |
| Data Type: |
xbrli:integerItemType |
| Balance Type: |
na |
| Period Type: |
duration |
|
| X |
- References
+ Details
| Name: |
us-gaap_SegmentReportingAbstract |
| Namespace Prefix: |
us-gaap_ |
| Data Type: |
xbrli:stringItemType |
| Balance Type: |
na |
| Period Type: |
duration |
|
v3.23.3
Segment Financial Data - Schedule of Segment Information (Details) - USD ($)
$ in Millions |
3 Months Ended |
9 Months Ended |
Sep. 30, 2023 |
Oct. 01, 2022 |
Sep. 30, 2023 |
Oct. 01, 2022 |
| Revenues [Abstract] |
|
|
|
|
| Total net revenue |
$ 1,554
|
$ 1,618
|
$ 4,705
|
$ 4,810
|
| Income from operations |
|
|
|
|
| Total income from operations |
109
|
155
|
400
|
513
|
| Corporate, Non-Segment |
|
|
|
|
| Income from operations |
|
|
|
|
| Total income from operations |
(58)
|
(47)
|
(163)
|
(162)
|
| Products and Solutions |
|
|
|
|
| Revenues [Abstract] |
|
|
|
|
| Total net revenue |
654
|
707
|
1,989
|
2,090
|
| Products and Solutions | Operating Segments |
|
|
|
|
| Income from operations |
|
|
|
|
| Total income from operations |
107
|
124
|
352
|
431
|
| ADI Global Distribution |
|
|
|
|
| Revenues [Abstract] |
|
|
|
|
| Total net revenue |
900
|
911
|
2,716
|
2,720
|
| ADI Global Distribution | Operating Segments |
|
|
|
|
| Income from operations |
|
|
|
|
| Total income from operations |
$ 60
|
$ 78
|
$ 211
|
$ 244
|
| X |
- DefinitionThe net result for the period of deducting operating expenses from operating revenues. Reference 1: http://www.xbrl.org/2003/role/disclosureRef
-Topic 280
-SubTopic 10
-Name Accounting Standards Codification
-Section 50
-Paragraph 22
-Publisher FASB
-URI https://asc.fasb.org//1943274/2147482810/280-10-50-22
Reference 2: http://www.xbrl.org/2003/role/disclosureRef
-Topic 280
-SubTopic 10
-Name Accounting Standards Codification
-Section 50
-Paragraph 30
-Subparagraph (b)
-Publisher FASB
-URI https://asc.fasb.org//1943274/2147482810/280-10-50-30
Reference 3: http://www.xbrl.org/2003/role/disclosureRef
-Topic 280
-SubTopic 10
-Name Accounting Standards Codification
-Section 50
-Paragraph 32
-Subparagraph (f)
-Publisher FASB
-URI https://asc.fasb.org//1943274/2147482810/280-10-50-32
Reference 4: http://www.xbrl.org/2003/role/exampleRef
-Topic 280
-SubTopic 10
-Name Accounting Standards Codification
-Section 50
-Paragraph 31
-Publisher FASB
-URI https://asc.fasb.org//1943274/2147482810/280-10-50-31
Reference 5: http://www.xbrl.org/2003/role/disclosureRef
-Topic 280
-SubTopic 10
-Name Accounting Standards Codification
-Section 50
-Paragraph 32
-Subparagraph (c)
-Publisher FASB
-URI https://asc.fasb.org//1943274/2147482810/280-10-50-32
| Name: |
us-gaap_OperatingIncomeLoss |
| Namespace Prefix: |
us-gaap_ |
| Data Type: |
xbrli:monetaryItemType |
| Balance Type: |
credit |
| Period Type: |
duration |
|
| X |
- DefinitionAmount, excluding tax collected from customer, of revenue from satisfaction of performance obligation by transferring promised good or service to customer. Tax collected from customer is tax assessed by governmental authority that is both imposed on and concurrent with specific revenue-producing transaction, including, but not limited to, sales, use, value added and excise. Reference 1: http://www.xbrl.org/2003/role/disclosureRef
-Topic 924
-SubTopic 10
-Name Accounting Standards Codification
-Section S99
-Paragraph 1
-Subparagraph (SAB Topic 11.L)
-Publisher FASB
-URI https://asc.fasb.org//1943274/2147479941/924-10-S99-1
Reference 2: http://www.xbrl.org/2003/role/disclosureRef
-Topic 606
-SubTopic 10
-Name Accounting Standards Codification
-Section 50
-Paragraph 5
-Publisher FASB
-URI https://asc.fasb.org//1943274/2147479806/606-10-50-5
Reference 3: http://www.xbrl.org/2003/role/disclosureRef
-Topic 280
-SubTopic 10
-Name Accounting Standards Codification
-Section 50
-Paragraph 30
-Subparagraph (a)
-Publisher FASB
-URI https://asc.fasb.org//1943274/2147482810/280-10-50-30
Reference 4: http://www.xbrl.org/2003/role/disclosureRef
-Topic 280
-SubTopic 10
-Name Accounting Standards Codification
-Section 50
-Paragraph 42
-Publisher FASB
-URI https://asc.fasb.org//1943274/2147482810/280-10-50-42
Reference 5: http://www.xbrl.org/2003/role/disclosureRef
-Topic 280
-SubTopic 10
-Name Accounting Standards Codification
-Section 50
-Paragraph 22
-Subparagraph (b)
-Publisher FASB
-URI https://asc.fasb.org//1943274/2147482810/280-10-50-22
Reference 6: http://www.xbrl.org/2003/role/disclosureRef
-Topic 280
-SubTopic 10
-Name Accounting Standards Codification
-Section 50
-Paragraph 32
-Subparagraph (b)
-Publisher FASB
-URI https://asc.fasb.org//1943274/2147482810/280-10-50-32
Reference 7: http://www.xbrl.org/2003/role/disclosureRef
-Topic 280
-SubTopic 10
-Name Accounting Standards Codification
-Section 50
-Paragraph 40
-Publisher FASB
-URI https://asc.fasb.org//1943274/2147482810/280-10-50-40
Reference 8: http://www.xbrl.org/2003/role/disclosureRef
-Topic 280
-SubTopic 10
-Name Accounting Standards Codification
-Section 50
-Paragraph 22
-Subparagraph (a)
-Publisher FASB
-URI https://asc.fasb.org//1943274/2147482810/280-10-50-22
Reference 9: http://www.xbrl.org/2003/role/disclosureRef
-Topic 280
-SubTopic 10
-Name Accounting Standards Codification
-Section 50
-Paragraph 32
-Subparagraph (a)
-Publisher FASB
-URI https://asc.fasb.org//1943274/2147482810/280-10-50-32
Reference 10: http://www.xbrl.org/2003/role/disclosureRef
-Topic 280
-SubTopic 10
-Name Accounting Standards Codification
-Section 50
-Paragraph 41
-Subparagraph (a)
-Publisher FASB
-URI https://asc.fasb.org//1943274/2147482810/280-10-50-41
Reference 11: http://www.xbrl.org/2003/role/disclosureRef
-Topic 606
-SubTopic 10
-Name Accounting Standards Codification
-Section 50
-Paragraph 4
-Subparagraph (a)
-Publisher FASB
-URI https://asc.fasb.org//1943274/2147479806/606-10-50-4
| Name: |
us-gaap_RevenueFromContractWithCustomerExcludingAssessedTax |
| Namespace Prefix: |
us-gaap_ |
| Data Type: |
xbrli:monetaryItemType |
| Balance Type: |
credit |
| Period Type: |
duration |
|
| X |
- References
+ Details
| Name: |
us-gaap_RevenuesAbstract |
| Namespace Prefix: |
us-gaap_ |
| Data Type: |
xbrli:stringItemType |
| Balance Type: |
na |
| Period Type: |
duration |
|
| X |
- Details
| Name: |
srt_ConsolidationItemsAxis=us-gaap_CorporateNonSegmentMember |
| Namespace Prefix: |
|
| Data Type: |
na |
| Balance Type: |
|
| Period Type: |
|
|
| X |
- Details
| Name: |
us-gaap_StatementBusinessSegmentsAxis=rezi_ProductsAndSolutionsSegmentMember |
| Namespace Prefix: |
|
| Data Type: |
na |
| Balance Type: |
|
| Period Type: |
|
|
| X |
- Details
| Name: |
srt_ConsolidationItemsAxis=us-gaap_OperatingSegmentsMember |
| Namespace Prefix: |
|
| Data Type: |
na |
| Balance Type: |
|
| Period Type: |
|
|
| X |
- Details
| Name: |
us-gaap_StatementBusinessSegmentsAxis=rezi_ADIGlobalDistributionSegmentMember |
| Namespace Prefix: |
|
| Data Type: |
na |
| Balance Type: |
|
| Period Type: |
|
|
v3.23.3
| X |
- DefinitionNumber of operating segments. An operating segment is a component of an enterprise: (a) that engages in business activities from which it may earn revenues and incur expenses (including revenues and expenses relating to transactions with other components of the same enterprise), (b) whose operating results are regularly reviewed by the enterprise's chief operating decision maker to make decisions about resources to be allocated to the segment and assess its performance, and (c) for which discrete financial information is available. An operating segment may engage in business activities for which it has yet to earn revenues, for example, start-up operations may be operating segments before earning revenues. Reference 1: http://www.xbrl.org/2009/role/commonPracticeRef
-Topic 280
-SubTopic 10
-Name Accounting Standards Codification
-Section 50
-Paragraph 18
-Publisher FASB
-URI https://asc.fasb.org//1943274/2147482810/280-10-50-18
| Name: |
us-gaap_NumberOfOperatingSegments |
| Namespace Prefix: |
us-gaap_ |
| Data Type: |
xbrli:integerItemType |
| Balance Type: |
na |
| Period Type: |
duration |
|
| X |
- References
+ Details
| Name: |
us-gaap_RevenueFromContractWithCustomerAbstract |
| Namespace Prefix: |
us-gaap_ |
| Data Type: |
xbrli:stringItemType |
| Balance Type: |
na |
| Period Type: |
duration |
|
v3.23.3
Revenue Recognition - Revenue By Business Line and Geographic Location (Details) - USD ($)
$ in Millions |
3 Months Ended |
9 Months Ended |
Sep. 30, 2023 |
Oct. 01, 2022 |
Sep. 30, 2023 |
Oct. 01, 2022 |
| Disaggregation Of Revenue |
|
|
|
|
| Net revenue |
$ 1,554
|
$ 1,618
|
$ 4,705
|
$ 4,810
|
| Products and Solutions |
|
|
|
|
| Disaggregation Of Revenue |
|
|
|
|
| Net revenue |
654
|
707
|
1,989
|
2,090
|
| Products and Solutions | Air |
|
|
|
|
| Disaggregation Of Revenue |
|
|
|
|
| Net revenue |
211
|
245
|
640
|
721
|
| Products and Solutions | Safety and Security |
|
|
|
|
| Disaggregation Of Revenue |
|
|
|
|
| Net revenue |
245
|
248
|
721
|
670
|
| Products and Solutions | Energy |
|
|
|
|
| Disaggregation Of Revenue |
|
|
|
|
| Net revenue |
123
|
142
|
391
|
455
|
| Products and Solutions | Water |
|
|
|
|
| Disaggregation Of Revenue |
|
|
|
|
| Net revenue |
75
|
72
|
237
|
244
|
| ADI Global Distribution |
|
|
|
|
| Disaggregation Of Revenue |
|
|
|
|
| Net revenue |
900
|
911
|
2,716
|
2,720
|
| ADI Global Distribution | U.S. and Canada |
|
|
|
|
| Disaggregation Of Revenue |
|
|
|
|
| Net revenue |
780
|
792
|
2,354
|
2,335
|
| ADI Global Distribution | EMEA |
|
|
|
|
| Disaggregation Of Revenue |
|
|
|
|
| Net revenue |
120
|
111
|
362
|
360
|
| ADI Global Distribution | APAC |
|
|
|
|
| Disaggregation Of Revenue |
|
|
|
|
| Net revenue |
$ 0
|
$ 8
|
$ 0
|
$ 25
|
| X |
- DefinitionLine items represent financial concepts included in a table. These concepts are used to disclose reportable information associated with domain members defined in one or many axes to the table. Reference 1: http://www.xbrl.org/2003/role/disclosureRef
-Topic 606
-SubTopic 10
-Name Accounting Standards Codification
-Section 50
-Paragraph 5
-Publisher FASB
-URI https://asc.fasb.org//1943274/2147479806/606-10-50-5
Reference 2: http://www.xbrl.org/2003/role/exampleRef
-Topic 606
-SubTopic 10
-Name Accounting Standards Codification
-Section 55
-Paragraph 91
-Subparagraph (a)
-Publisher FASB
-URI https://asc.fasb.org//1943274/2147479777/606-10-55-91
Reference 3: http://www.xbrl.org/2003/role/exampleRef
-Topic 606
-SubTopic 10
-Name Accounting Standards Codification
-Section 55
-Paragraph 91
-Subparagraph (b)
-Publisher FASB
-URI https://asc.fasb.org//1943274/2147479777/606-10-55-91
Reference 4: http://www.xbrl.org/2003/role/exampleRef
-Topic 606
-SubTopic 10
-Name Accounting Standards Codification
-Section 55
-Paragraph 91
-Subparagraph (c)
-Publisher FASB
-URI https://asc.fasb.org//1943274/2147479777/606-10-55-91
Reference 5: http://www.xbrl.org/2003/role/exampleRef
-Topic 606
-SubTopic 10
-Name Accounting Standards Codification
-Section 55
-Paragraph 91
-Subparagraph (d)
-Publisher FASB
-URI https://asc.fasb.org//1943274/2147479777/606-10-55-91
Reference 6: http://www.xbrl.org/2003/role/exampleRef
-Topic 606
-SubTopic 10
-Name Accounting Standards Codification
-Section 55
-Paragraph 91
-Subparagraph (e)
-Publisher FASB
-URI https://asc.fasb.org//1943274/2147479777/606-10-55-91
Reference 7: http://www.xbrl.org/2003/role/exampleRef
-Topic 606
-SubTopic 10
-Name Accounting Standards Codification
-Section 55
-Paragraph 91
-Subparagraph (f)
-Publisher FASB
-URI https://asc.fasb.org//1943274/2147479777/606-10-55-91
Reference 8: http://www.xbrl.org/2003/role/exampleRef
-Topic 606
-SubTopic 10
-Name Accounting Standards Codification
-Section 55
-Paragraph 91
-Subparagraph (g)
-Publisher FASB
-URI https://asc.fasb.org//1943274/2147479777/606-10-55-91
| Name: |
us-gaap_DisaggregationOfRevenueLineItems |
| Namespace Prefix: |
us-gaap_ |
| Data Type: |
xbrli:stringItemType |
| Balance Type: |
na |
| Period Type: |
duration |
|
| X |
- DefinitionAmount, excluding tax collected from customer, of revenue from satisfaction of performance obligation by transferring promised good or service to customer. Tax collected from customer is tax assessed by governmental authority that is both imposed on and concurrent with specific revenue-producing transaction, including, but not limited to, sales, use, value added and excise. Reference 1: http://www.xbrl.org/2003/role/disclosureRef
-Topic 924
-SubTopic 10
-Name Accounting Standards Codification
-Section S99
-Paragraph 1
-Subparagraph (SAB Topic 11.L)
-Publisher FASB
-URI https://asc.fasb.org//1943274/2147479941/924-10-S99-1
Reference 2: http://www.xbrl.org/2003/role/disclosureRef
-Topic 606
-SubTopic 10
-Name Accounting Standards Codification
-Section 50
-Paragraph 5
-Publisher FASB
-URI https://asc.fasb.org//1943274/2147479806/606-10-50-5
Reference 3: http://www.xbrl.org/2003/role/disclosureRef
-Topic 280
-SubTopic 10
-Name Accounting Standards Codification
-Section 50
-Paragraph 30
-Subparagraph (a)
-Publisher FASB
-URI https://asc.fasb.org//1943274/2147482810/280-10-50-30
Reference 4: http://www.xbrl.org/2003/role/disclosureRef
-Topic 280
-SubTopic 10
-Name Accounting Standards Codification
-Section 50
-Paragraph 42
-Publisher FASB
-URI https://asc.fasb.org//1943274/2147482810/280-10-50-42
Reference 5: http://www.xbrl.org/2003/role/disclosureRef
-Topic 280
-SubTopic 10
-Name Accounting Standards Codification
-Section 50
-Paragraph 22
-Subparagraph (b)
-Publisher FASB
-URI https://asc.fasb.org//1943274/2147482810/280-10-50-22
Reference 6: http://www.xbrl.org/2003/role/disclosureRef
-Topic 280
-SubTopic 10
-Name Accounting Standards Codification
-Section 50
-Paragraph 32
-Subparagraph (b)
-Publisher FASB
-URI https://asc.fasb.org//1943274/2147482810/280-10-50-32
Reference 7: http://www.xbrl.org/2003/role/disclosureRef
-Topic 280
-SubTopic 10
-Name Accounting Standards Codification
-Section 50
-Paragraph 40
-Publisher FASB
-URI https://asc.fasb.org//1943274/2147482810/280-10-50-40
Reference 8: http://www.xbrl.org/2003/role/disclosureRef
-Topic 280
-SubTopic 10
-Name Accounting Standards Codification
-Section 50
-Paragraph 22
-Subparagraph (a)
-Publisher FASB
-URI https://asc.fasb.org//1943274/2147482810/280-10-50-22
Reference 9: http://www.xbrl.org/2003/role/disclosureRef
-Topic 280
-SubTopic 10
-Name Accounting Standards Codification
-Section 50
-Paragraph 32
-Subparagraph (a)
-Publisher FASB
-URI https://asc.fasb.org//1943274/2147482810/280-10-50-32
Reference 10: http://www.xbrl.org/2003/role/disclosureRef
-Topic 280
-SubTopic 10
-Name Accounting Standards Codification
-Section 50
-Paragraph 41
-Subparagraph (a)
-Publisher FASB
-URI https://asc.fasb.org//1943274/2147482810/280-10-50-41
Reference 11: http://www.xbrl.org/2003/role/disclosureRef
-Topic 606
-SubTopic 10
-Name Accounting Standards Codification
-Section 50
-Paragraph 4
-Subparagraph (a)
-Publisher FASB
-URI https://asc.fasb.org//1943274/2147479806/606-10-50-4
| Name: |
us-gaap_RevenueFromContractWithCustomerExcludingAssessedTax |
| Namespace Prefix: |
us-gaap_ |
| Data Type: |
xbrli:monetaryItemType |
| Balance Type: |
credit |
| Period Type: |
duration |
|
| X |
- Details
| Name: |
us-gaap_StatementBusinessSegmentsAxis=rezi_ProductsAndSolutionsSegmentMember |
| Namespace Prefix: |
|
| Data Type: |
na |
| Balance Type: |
|
| Period Type: |
|
|
| X |
- Details
| Name: |
srt_ProductOrServiceAxis=rezi_AirMember |
| Namespace Prefix: |
|
| Data Type: |
na |
| Balance Type: |
|
| Period Type: |
|
|
| X |
- Details
| Name: |
srt_ProductOrServiceAxis=rezi_SafetyAndSecurityMember |
| Namespace Prefix: |
|
| Data Type: |
na |
| Balance Type: |
|
| Period Type: |
|
|
| X |
- Details
| Name: |
srt_ProductOrServiceAxis=us-gaap_EnergyServiceMember |
| Namespace Prefix: |
|
| Data Type: |
na |
| Balance Type: |
|
| Period Type: |
|
|
| X |
- Details
| Name: |
srt_ProductOrServiceAxis=us-gaap_PublicUtilitiesInventoryWaterMember |
| Namespace Prefix: |
|
| Data Type: |
na |
| Balance Type: |
|
| Period Type: |
|
|
| X |
- Details
| Name: |
us-gaap_StatementBusinessSegmentsAxis=rezi_ADIGlobalDistributionSegmentMember |
| Namespace Prefix: |
|
| Data Type: |
na |
| Balance Type: |
|
| Period Type: |
|
|
| X |
- Details
| Name: |
srt_StatementGeographicalAxis=rezi_USAndCanadaMember |
| Namespace Prefix: |
|
| Data Type: |
na |
| Balance Type: |
|
| Period Type: |
|
|
| X |
- Details
| Name: |
srt_StatementGeographicalAxis=us-gaap_EMEAMember |
| Namespace Prefix: |
|
| Data Type: |
na |
| Balance Type: |
|
| Period Type: |
|
|
| X |
- Details
| Name: |
srt_StatementGeographicalAxis=srt_AsiaPacificMember |
| Namespace Prefix: |
|
| Data Type: |
na |
| Balance Type: |
|
| Period Type: |
|
|
v3.23.3
| X |
- DefinitionRestructuring Initiatives Execution
| Name: |
rezi_RestructuringInitiativesExecution |
| Namespace Prefix: |
rezi_ |
| Data Type: |
xbrli:durationItemType |
| Balance Type: |
na |
| Period Type: |
duration |
|
| X |
- DefinitionAmount of expenses associated with exit or disposal activities pursuant to an authorized plan. Excludes expenses related to a discontinued operation or an asset retirement obligation. Reference 1: http://fasb.org/us-gaap/role/ref/legacyRef
-Name Accounting Standards Codification
-Section 45
-Paragraph 28
-Subparagraph (b)
-SubTopic 10
-Topic 230
-Publisher FASB
-URI https://asc.fasb.org//1943274/2147482740/230-10-45-28
Reference 2: http://www.xbrl.org/2003/role/disclosureRef
-Topic 420
-SubTopic 10
-Name Accounting Standards Codification
-Section S99
-Paragraph 2
-Subparagraph (SAB Topic 5.P.4(b)(1))
-Publisher FASB
-URI https://asc.fasb.org//1943274/2147479823/420-10-S99-2
Reference 3: http://www.xbrl.org/2009/role/commonPracticeRef
-Topic 420
-SubTopic 10
-Name Accounting Standards Codification
-Section 45
-Paragraph 3
-Publisher FASB
-URI https://asc.fasb.org//1943274/2147482047/420-10-45-3
Reference 4: http://www.xbrl.org/2003/role/disclosureRef
-Topic 420
-SubTopic 10
-Name Accounting Standards Codification
-Section S99
-Paragraph 1
-Subparagraph (SAB Topic 5.P.3)
-Publisher FASB
-URI https://asc.fasb.org//1943274/2147479823/420-10-S99-1
| Name: |
us-gaap_RestructuringCharges |
| Namespace Prefix: |
us-gaap_ |
| Data Type: |
xbrli:monetaryItemType |
| Balance Type: |
debit |
| Period Type: |
duration |
|
| X |
- DefinitionLine items represent financial concepts included in a table. These concepts are used to disclose reportable information associated with domain members defined in one or many axes to the table. Reference 1: http://www.xbrl.org/2003/role/disclosureRef
-Topic 420
-SubTopic 10
-Name Accounting Standards Codification
-Section 50
-Paragraph 1
-Subparagraph (c)
-Publisher FASB
-URI https://asc.fasb.org//1943274/2147482017/420-10-50-1
Reference 2: http://www.xbrl.org/2003/role/disclosureRef
-Topic 420
-SubTopic 10
-Name Accounting Standards Codification
-Section 50
-Paragraph 1
-Subparagraph (b)(2)
-Publisher FASB
-URI https://asc.fasb.org//1943274/2147482017/420-10-50-1
Reference 3: http://www.xbrl.org/2003/role/disclosureRef
-Topic 420
-SubTopic 10
-Name Accounting Standards Codification
-Section 50
-Paragraph 1
-Subparagraph (b)(1)
-Publisher FASB
-URI https://asc.fasb.org//1943274/2147482017/420-10-50-1
Reference 4: http://www.xbrl.org/2003/role/disclosureRef
-Topic 420
-SubTopic 10
-Name Accounting Standards Codification
-Section S99
-Paragraph 2
-Subparagraph (SAB Topic 5.P.4(b)(2))
-Publisher FASB
-URI https://asc.fasb.org//1943274/2147479823/420-10-S99-2
Reference 5: http://www.xbrl.org/2003/role/disclosureRef
-Topic 420
-SubTopic 10
-Name Accounting Standards Codification
-Section S99
-Paragraph 2
-Subparagraph (SAB Topic 5.P.4(b)(1))
-Publisher FASB
-URI https://asc.fasb.org//1943274/2147479823/420-10-S99-2
Reference 6: http://www.xbrl.org/2003/role/disclosureRef
-Topic 420
-SubTopic 10
-Name Accounting Standards Codification
-Section S99
-Paragraph 2
-Subparagraph (SAB Topic 5.P.4(d))
-Publisher FASB
-URI https://asc.fasb.org//1943274/2147479823/420-10-S99-2
Reference 7: http://www.xbrl.org/2003/role/disclosureRef
-Topic 420
-SubTopic 10
-Name Accounting Standards Codification
-Section 50
-Paragraph 1
-Subparagraph (d)
-Publisher FASB
-URI https://asc.fasb.org//1943274/2147482017/420-10-50-1
| Name: |
us-gaap_RestructuringCostAndReserveLineItems |
| Namespace Prefix: |
us-gaap_ |
| Data Type: |
xbrli:stringItemType |
| Balance Type: |
na |
| Period Type: |
duration |
|
| X |
- DefinitionAmount, after cash payment, of expenses associated with exit or disposal activities pursuant to an authorized plan and expenses resulting from the write-down of assets. Excludes expenses related to a business combination, a discontinued operation or an asset retirement obligation. Reference 1: http://fasb.org/us-gaap/role/ref/legacyRef
-Name Accounting Standards Codification
-Section 45
-Paragraph 28
-Subparagraph (b)
-SubTopic 10
-Topic 230
-Publisher FASB
-URI https://asc.fasb.org//1943274/2147482740/230-10-45-28
| Name: |
us-gaap_RestructuringCostsAndAssetImpairmentCharges |
| Namespace Prefix: |
us-gaap_ |
| Data Type: |
xbrli:monetaryItemType |
| Balance Type: |
debit |
| Period Type: |
duration |
|
| X |
- Details
| Name: |
srt_ConsolidationItemsAxis=us-gaap_CorporateNonSegmentMember |
| Namespace Prefix: |
|
| Data Type: |
na |
| Balance Type: |
|
| Period Type: |
|
|
| X |
- Details
| Name: |
us-gaap_StatementBusinessSegmentsAxis=rezi_ProductsAndSolutionsSegmentMember |
| Namespace Prefix: |
|
| Data Type: |
na |
| Balance Type: |
|
| Period Type: |
|
|
| X |
- Details
| Name: |
us-gaap_StatementBusinessSegmentsAxis=rezi_ADIGlobalDistributionSegmentMember |
| Namespace Prefix: |
|
| Data Type: |
na |
| Balance Type: |
|
| Period Type: |
|
|
| X |
- Details
| Name: |
srt_RangeAxis=srt_MinimumMember |
| Namespace Prefix: |
|
| Data Type: |
na |
| Balance Type: |
|
| Period Type: |
|
|
| X |
- Details
| Name: |
srt_RangeAxis=srt_MaximumMember |
| Namespace Prefix: |
|
| Data Type: |
na |
| Balance Type: |
|
| Period Type: |
|
|
v3.23.3
| X |
- DefinitionAmount of other expenses associated with exit or disposal activities pursuant to an authorized plan. Excludes expenses associated with a discontinued operation or an asset retirement obligation. Reference 1: http://fasb.org/us-gaap/role/ref/legacyRef
-Name Accounting Standards Codification
-Section 45
-Paragraph 28
-Subparagraph (b)
-SubTopic 10
-Topic 230
-Publisher FASB
-URI https://asc.fasb.org//1943274/2147482740/230-10-45-28
| Name: |
us-gaap_OtherRestructuringCosts |
| Namespace Prefix: |
us-gaap_ |
| Data Type: |
xbrli:monetaryItemType |
| Balance Type: |
debit |
| Period Type: |
duration |
|
| X |
- DefinitionAmount of cash payments made as the result of exit or disposal activities. Excludes payments associated with a discontinued operation or an asset retirement obligation. Reference 1: http://www.xbrl.org/2003/role/disclosureRef
-Topic 420
-SubTopic 10
-Name Accounting Standards Codification
-Section 50
-Paragraph 1
-Subparagraph (b)(2)
-Publisher FASB
-URI https://asc.fasb.org//1943274/2147482017/420-10-50-1
Reference 2: http://www.xbrl.org/2009/role/commonPracticeRef
-Topic 230
-SubTopic 10
-Name Accounting Standards Codification
-Section 45
-Paragraph 17
-Subparagraph (f)
-Publisher FASB
-URI https://asc.fasb.org//1943274/2147482740/230-10-45-17
| Name: |
us-gaap_PaymentsForRestructuring |
| Namespace Prefix: |
us-gaap_ |
| Data Type: |
xbrli:monetaryItemType |
| Balance Type: |
credit |
| Period Type: |
duration |
|
| X |
- DefinitionAmount of expenses associated with exit or disposal activities pursuant to an authorized plan. Excludes expenses related to a discontinued operation or an asset retirement obligation. Reference 1: http://fasb.org/us-gaap/role/ref/legacyRef
-Name Accounting Standards Codification
-Section 45
-Paragraph 28
-Subparagraph (b)
-SubTopic 10
-Topic 230
-Publisher FASB
-URI https://asc.fasb.org//1943274/2147482740/230-10-45-28
Reference 2: http://www.xbrl.org/2003/role/disclosureRef
-Topic 420
-SubTopic 10
-Name Accounting Standards Codification
-Section S99
-Paragraph 2
-Subparagraph (SAB Topic 5.P.4(b)(1))
-Publisher FASB
-URI https://asc.fasb.org//1943274/2147479823/420-10-S99-2
Reference 3: http://www.xbrl.org/2009/role/commonPracticeRef
-Topic 420
-SubTopic 10
-Name Accounting Standards Codification
-Section 45
-Paragraph 3
-Publisher FASB
-URI https://asc.fasb.org//1943274/2147482047/420-10-45-3
Reference 4: http://www.xbrl.org/2003/role/disclosureRef
-Topic 420
-SubTopic 10
-Name Accounting Standards Codification
-Section S99
-Paragraph 1
-Subparagraph (SAB Topic 5.P.3)
-Publisher FASB
-URI https://asc.fasb.org//1943274/2147479823/420-10-S99-1
| Name: |
us-gaap_RestructuringCharges |
| Namespace Prefix: |
us-gaap_ |
| Data Type: |
xbrli:monetaryItemType |
| Balance Type: |
debit |
| Period Type: |
duration |
|
| X |
- DefinitionCarrying amount (including both current and noncurrent portions of the accrual) as of the balance sheet date pertaining to a specified type of cost associated with exit from or disposal of business activities or restructuring pursuant to a duly authorized plan. Reference 1: http://www.xbrl.org/2003/role/disclosureRef
-Topic 420
-SubTopic 10
-Name Accounting Standards Codification
-Section 50
-Paragraph 1
-Subparagraph (b)(2)
-Publisher FASB
-URI https://asc.fasb.org//1943274/2147482017/420-10-50-1
Reference 2: http://www.xbrl.org/2003/role/disclosureRef
-Topic 420
-SubTopic 10
-Name Accounting Standards Codification
-Section S99
-Paragraph 2
-Subparagraph (SAB TOPIC 5.P.4(b)(2))
-Publisher FASB
-URI https://asc.fasb.org//1943274/2147479823/420-10-S99-2
| Name: |
us-gaap_RestructuringReserve |
| Namespace Prefix: |
us-gaap_ |
| Data Type: |
xbrli:monetaryItemType |
| Balance Type: |
credit |
| Period Type: |
instant |
|
| X |
- DefinitionA roll forward is a reconciliation of a concept from the beginning of a period to the end of a period.
| Name: |
us-gaap_RestructuringReserveRollForward |
| Namespace Prefix: |
us-gaap_ |
| Data Type: |
xbrli:stringItemType |
| Balance Type: |
na |
| Period Type: |
duration |
|
v3.23.3
| X |
- DefinitionAmount of increase (decrease) in benefit obligation of defined benefit plan.
| Name: |
us-gaap_DefinedBenefitPlanBenefitObligationPeriodIncreaseDecrease |
| Namespace Prefix: |
us-gaap_ |
| Data Type: |
xbrli:monetaryItemType |
| Balance Type: |
na |
| Period Type: |
duration |
|
| X |
- DefinitionLine items represent financial concepts included in a table. These concepts are used to disclose reportable information associated with domain members defined in one or many axes to the table.
| Name: |
us-gaap_DefinedBenefitPlanDisclosureLineItems |
| Namespace Prefix: |
us-gaap_ |
| Data Type: |
xbrli:stringItemType |
| Balance Type: |
na |
| Period Type: |
duration |
|
| X |
- DefinitionAmount of increase (decrease) in plan assets of defined benefit plan.
| Name: |
us-gaap_DefinedBenefitPlanFairValueOfPlanAssetsPeriodIncreaseDecrease |
| Namespace Prefix: |
us-gaap_ |
| Data Type: |
xbrli:monetaryItemType |
| Balance Type: |
na |
| Period Type: |
duration |
|
| X |
- DefinitionAmount of gain (loss) recognized in net periodic benefit (cost) credit from irrevocable action relieving primary responsibility for benefit obligation and eliminating risk related to obligation and assets used to effect settlement. Reference 1: http://www.xbrl.org/2003/role/disclosureRef
-Topic 715
-SubTopic 20
-Name Accounting Standards Codification
-Section 45
-Paragraph 3A
-Publisher FASB
-URI https://asc.fasb.org//1943274/2147480535/715-20-45-3A
Reference 2: http://www.xbrl.org/2003/role/disclosureRef
-Topic 715
-SubTopic 20
-Name Accounting Standards Codification
-Section 50
-Paragraph 1
-Subparagraph (h)(7)
-Publisher FASB
-URI https://asc.fasb.org//1943274/2147480506/715-20-50-1
Reference 3: http://www.xbrl.org/2003/role/disclosureRef
-Topic 715
-SubTopic 20
-Name Accounting Standards Codification
-Section 50
-Paragraph 6
-Subparagraph (a)(7)
-Publisher FASB
-URI https://asc.fasb.org//1943274/2147480506/715-20-50-6
| Name: |
us-gaap_DefinedBenefitPlanRecognizedNetGainLossDueToSettlements1 |
| Namespace Prefix: |
us-gaap_ |
| Data Type: |
xbrli:monetaryItemType |
| Balance Type: |
credit |
| Period Type: |
duration |
|
| X |
- Details
| Name: |
us-gaap_RetirementPlanTypeAxis=us-gaap_PensionPlansDefinedBenefitMember |
| Namespace Prefix: |
|
| Data Type: |
na |
| Balance Type: |
|
| Period Type: |
|
|
v3.23.3
Stock-Based Compensation Plans - Additional Information (Details) - USD ($)
$ in Millions |
3 Months Ended |
9 Months Ended |
Sep. 30, 2023 |
Jul. 01, 2023 |
Oct. 01, 2022 |
Sep. 30, 2023 |
Oct. 01, 2022 |
| Share-based Compensation Arrangement by Share-based Payment Award |
|
|
|
|
|
| Increase in number of shares available for issuance (in shares) |
|
3,500,000
|
|
|
|
| Shares available for issuance (in shares) |
|
19,500,000
|
|
|
|
| Stock-based compensation expense, net of tax |
$ 11
|
|
$ 13
|
$ 36
|
$ 36
|
| Stock Options |
|
|
|
|
|
| Share-based Compensation Arrangement by Share-based Payment Award |
|
|
|
|
|
| Number of shares available for grant (in shares) |
|
7,500,000
|
|
|
|
| Key Employees |
|
|
|
|
|
| Share-based Compensation Arrangement by Share-based Payment Award |
|
|
|
|
|
| Vesting period (in years) |
|
|
|
3 years
|
|
| Non-Employee Directors |
|
|
|
|
|
| Share-based Compensation Arrangement by Share-based Payment Award |
|
|
|
|
|
| Vesting period (in years) |
|
|
|
1 year
|
|
| X |
- DefinitionAmount, after tax, of expense for award under share-based payment arrangement.
| Name: |
us-gaap_AllocatedShareBasedCompensationExpenseNetOfTax |
| Namespace Prefix: |
us-gaap_ |
| Data Type: |
xbrli:monetaryItemType |
| Balance Type: |
debit |
| Period Type: |
duration |
|
| X |
- DefinitionPeriod over which grantee's right to exercise award under share-based payment arrangement is no longer contingent on satisfaction of service or performance condition, in 'PnYnMnDTnHnMnS' format, for example, 'P1Y5M13D' represents reported fact of one year, five months, and thirteen days. Includes, but is not limited to, combination of market, performance or service condition. Reference 1: http://www.xbrl.org/2003/role/exampleRef
-Topic 718
-SubTopic 10
-Name Accounting Standards Codification
-Section 50
-Paragraph 2
-Subparagraph (a)(1)
-Publisher FASB
-URI https://asc.fasb.org//1943274/2147480429/718-10-50-2
| Name: |
us-gaap_ShareBasedCompensationArrangementByShareBasedPaymentAwardAwardVestingPeriod1 |
| Namespace Prefix: |
us-gaap_ |
| Data Type: |
xbrli:durationItemType |
| Balance Type: |
na |
| Period Type: |
duration |
|
| X |
- DefinitionLine items represent financial concepts included in a table. These concepts are used to disclose reportable information associated with domain members defined in one or many axes to the table. Reference 1: http://www.xbrl.org/2003/role/disclosureRef
-Topic 718
-SubTopic 10
-Name Accounting Standards Codification
-Section 35
-Paragraph 1D
-Publisher FASB
-URI https://asc.fasb.org//1943274/2147480483/718-10-35-1D
Reference 2: http://www.xbrl.org/2003/role/disclosureRef
-Topic 718
-SubTopic 10
-Name Accounting Standards Codification
-Section 35
-Paragraph 3
-Publisher FASB
-URI https://asc.fasb.org//1943274/2147480483/718-10-35-3
Reference 3: http://www.xbrl.org/2003/role/disclosureRef
-Topic 718
-SubTopic 10
-Name Accounting Standards Codification
-Section 50
-Paragraph 2
-Subparagraph (a)(1)
-Publisher FASB
-URI https://asc.fasb.org//1943274/2147480429/718-10-50-2
Reference 4: http://www.xbrl.org/2003/role/disclosureRef
-Topic 718
-SubTopic 10
-Name Accounting Standards Codification
-Section 50
-Paragraph 2
-Subparagraph (a)(2)
-Publisher FASB
-URI https://asc.fasb.org//1943274/2147480429/718-10-50-2
Reference 5: http://www.xbrl.org/2003/role/disclosureRef
-Topic 718
-SubTopic 10
-Name Accounting Standards Codification
-Section 50
-Paragraph 2
-Subparagraph (a)(3)
-Publisher FASB
-URI https://asc.fasb.org//1943274/2147480429/718-10-50-2
Reference 6: http://www.xbrl.org/2003/role/disclosureRef
-Topic 718
-SubTopic 10
-Name Accounting Standards Codification
-Section 50
-Paragraph 2
-Subparagraph (c)(1)(i)
-Publisher FASB
-URI https://asc.fasb.org//1943274/2147480429/718-10-50-2
Reference 7: http://www.xbrl.org/2003/role/disclosureRef
-Topic 718
-SubTopic 10
-Name Accounting Standards Codification
-Section 50
-Paragraph 2
-Subparagraph (c)(1)(ii)
-Publisher FASB
-URI https://asc.fasb.org//1943274/2147480429/718-10-50-2
Reference 8: http://www.xbrl.org/2003/role/disclosureRef
-Topic 718
-SubTopic 10
-Name Accounting Standards Codification
-Section 50
-Paragraph 2
-Subparagraph (c)(1)(iii)
-Publisher FASB
-URI https://asc.fasb.org//1943274/2147480429/718-10-50-2
Reference 9: http://www.xbrl.org/2003/role/disclosureRef
-Topic 718
-SubTopic 10
-Name Accounting Standards Codification
-Section 50
-Paragraph 2
-Subparagraph (c)(1)(iv)
-Publisher FASB
-URI https://asc.fasb.org//1943274/2147480429/718-10-50-2
Reference 10: http://www.xbrl.org/2003/role/disclosureRef
-Topic 718
-SubTopic 10
-Name Accounting Standards Codification
-Section 50
-Paragraph 2
-Subparagraph (c)(1)(iv)(01)
-Publisher FASB
-URI https://asc.fasb.org//1943274/2147480429/718-10-50-2
Reference 11: http://www.xbrl.org/2003/role/disclosureRef
-Topic 718
-SubTopic 10
-Name Accounting Standards Codification
-Section 50
-Paragraph 2
-Subparagraph (c)(1)(iv)(02)
-Publisher FASB
-URI https://asc.fasb.org//1943274/2147480429/718-10-50-2
Reference 12: http://www.xbrl.org/2003/role/disclosureRef
-Topic 718
-SubTopic 10
-Name Accounting Standards Codification
-Section 50
-Paragraph 2
-Subparagraph (c)(1)(iv)(03)
-Publisher FASB
-URI https://asc.fasb.org//1943274/2147480429/718-10-50-2
Reference 13: http://www.xbrl.org/2003/role/disclosureRef
-Topic 718
-SubTopic 10
-Name Accounting Standards Codification
-Section 50
-Paragraph 2
-Subparagraph (c)(1)(iv)(04)
-Publisher FASB
-URI https://asc.fasb.org//1943274/2147480429/718-10-50-2
Reference 14: http://www.xbrl.org/2003/role/disclosureRef
-Topic 718
-SubTopic 10
-Name Accounting Standards Codification
-Section 50
-Paragraph 2
-Subparagraph (c)(2)(i)
-Publisher FASB
-URI https://asc.fasb.org//1943274/2147480429/718-10-50-2
Reference 15: http://www.xbrl.org/2003/role/disclosureRef
-Topic 718
-SubTopic 10
-Name Accounting Standards Codification
-Section 50
-Paragraph 2
-Subparagraph (c)(2)(ii)
-Publisher FASB
-URI https://asc.fasb.org//1943274/2147480429/718-10-50-2
Reference 16: http://www.xbrl.org/2003/role/disclosureRef
-Topic 718
-SubTopic 10
-Name Accounting Standards Codification
-Section 50
-Paragraph 2
-Subparagraph (c)(2)(iii)
-Publisher FASB
-URI https://asc.fasb.org//1943274/2147480429/718-10-50-2
Reference 17: http://www.xbrl.org/2003/role/disclosureRef
-Topic 718
-SubTopic 10
-Name Accounting Standards Codification
-Section 50
-Paragraph 2
-Subparagraph (c)(2)(iii)(01)
-Publisher FASB
-URI https://asc.fasb.org//1943274/2147480429/718-10-50-2
Reference 18: http://www.xbrl.org/2003/role/disclosureRef
-Topic 718
-SubTopic 10
-Name Accounting Standards Codification
-Section 50
-Paragraph 2
-Subparagraph (c)(2)(iii)(02)
-Publisher FASB
-URI https://asc.fasb.org//1943274/2147480429/718-10-50-2
Reference 19: http://www.xbrl.org/2003/role/disclosureRef
-Topic 718
-SubTopic 10
-Name Accounting Standards Codification
-Section 50
-Paragraph 2
-Subparagraph (c)(2)(iii)(03)
-Publisher FASB
-URI https://asc.fasb.org//1943274/2147480429/718-10-50-2
Reference 20: http://www.xbrl.org/2003/role/disclosureRef
-Topic 718
-SubTopic 10
-Name Accounting Standards Codification
-Section 50
-Paragraph 2
-Subparagraph (d)(1)
-Publisher FASB
-URI https://asc.fasb.org//1943274/2147480429/718-10-50-2
Reference 21: http://www.xbrl.org/2003/role/disclosureRef
-Topic 718
-SubTopic 10
-Name Accounting Standards Codification
-Section 50
-Paragraph 2
-Subparagraph (d)(2)
-Publisher FASB
-URI https://asc.fasb.org//1943274/2147480429/718-10-50-2
Reference 22: http://www.xbrl.org/2003/role/disclosureRef
-Topic 718
-SubTopic 10
-Name Accounting Standards Codification
-Section 50
-Paragraph 2
-Subparagraph (e)(1)
-Publisher FASB
-URI https://asc.fasb.org//1943274/2147480429/718-10-50-2
Reference 23: http://www.xbrl.org/2003/role/disclosureRef
-Topic 718
-SubTopic 10
-Name Accounting Standards Codification
-Section 50
-Paragraph 2
-Subparagraph (e)(2)
-Publisher FASB
-URI https://asc.fasb.org//1943274/2147480429/718-10-50-2
Reference 24: http://www.xbrl.org/2003/role/disclosureRef
-Topic 718
-SubTopic 10
-Name Accounting Standards Codification
-Section 50
-Paragraph 2
-Subparagraph (f)(2)(i)
-Publisher FASB
-URI https://asc.fasb.org//1943274/2147480429/718-10-50-2
Reference 25: http://www.xbrl.org/2003/role/disclosureRef
-Topic 718
-SubTopic 10
-Name Accounting Standards Codification
-Section 50
-Paragraph 2
-Subparagraph (f)(2)(ii)
-Publisher FASB
-URI https://asc.fasb.org//1943274/2147480429/718-10-50-2
Reference 26: http://www.xbrl.org/2003/role/disclosureRef
-Topic 718
-SubTopic 10
-Name Accounting Standards Codification
-Section 50
-Paragraph 2
-Subparagraph (f)(2)(iii)
-Publisher FASB
-URI https://asc.fasb.org//1943274/2147480429/718-10-50-2
Reference 27: http://www.xbrl.org/2003/role/disclosureRef
-Topic 718
-SubTopic 10
-Name Accounting Standards Codification
-Section 50
-Paragraph 2
-Subparagraph (f)(2)(iv)
-Publisher FASB
-URI https://asc.fasb.org//1943274/2147480429/718-10-50-2
Reference 28: http://www.xbrl.org/2003/role/disclosureRef
-Topic 718
-SubTopic 10
-Name Accounting Standards Codification
-Section 50
-Paragraph 2
-Subparagraph (f)(2)(v)
-Publisher FASB
-URI https://asc.fasb.org//1943274/2147480429/718-10-50-2
| Name: |
us-gaap_ShareBasedCompensationArrangementByShareBasedPaymentAwardLineItems |
| Namespace Prefix: |
us-gaap_ |
| Data Type: |
xbrli:stringItemType |
| Balance Type: |
na |
| Period Type: |
duration |
|
| X |
- DefinitionNumber of additional shares authorized for issuance under share-based payment arrangement.
| Name: |
us-gaap_ShareBasedCompensationArrangementByShareBasedPaymentAwardNumberOfAdditionalSharesAuthorized |
| Namespace Prefix: |
us-gaap_ |
| Data Type: |
xbrli:sharesItemType |
| Balance Type: |
na |
| Period Type: |
duration |
|
| X |
- DefinitionNumber of shares authorized for issuance under share-based payment arrangement. Reference 1: http://www.xbrl.org/2003/role/exampleRef
-Topic 718
-SubTopic 10
-Name Accounting Standards Codification
-Section 50
-Paragraph 2
-Subparagraph (a)(3)
-Publisher FASB
-URI https://asc.fasb.org//1943274/2147480429/718-10-50-2
| Name: |
us-gaap_ShareBasedCompensationArrangementByShareBasedPaymentAwardNumberOfSharesAuthorized |
| Namespace Prefix: |
us-gaap_ |
| Data Type: |
xbrli:sharesItemType |
| Balance Type: |
na |
| Period Type: |
instant |
|
| X |
- DefinitionThe difference between the maximum number of shares (or other type of equity) authorized for issuance under the plan (including the effects of amendments and adjustments), and the sum of: 1) the number of shares (or other type of equity) already issued upon exercise of options or other equity-based awards under the plan; and 2) shares (or other type of equity) reserved for issuance on granting of outstanding awards, net of cancellations and forfeitures, if applicable. Reference 1: http://fasb.org/us-gaap/role/ref/legacyRef
-Name Accounting Standards Codification
-Topic 718
-SubTopic 10
-Section 50
-Paragraph 2
-Publisher FASB
-URI https://asc.fasb.org//1943274/2147480429/718-10-50-2
| Name: |
us-gaap_ShareBasedCompensationArrangementByShareBasedPaymentAwardNumberOfSharesAvailableForGrant |
| Namespace Prefix: |
us-gaap_ |
| Data Type: |
xbrli:sharesItemType |
| Balance Type: |
na |
| Period Type: |
instant |
|
| X |
- Details
| Name: |
us-gaap_AwardTypeAxis=us-gaap_EmployeeStockOptionMember |
| Namespace Prefix: |
|
| Data Type: |
na |
| Balance Type: |
|
| Period Type: |
|
|
| X |
- Details
| Name: |
srt_TitleOfIndividualAxis=rezi_KeyEmployeesMember |
| Namespace Prefix: |
|
| Data Type: |
na |
| Balance Type: |
|
| Period Type: |
|
|
| X |
- Details
| Name: |
srt_TitleOfIndividualAxis=rezi_NonEmployeeDirectorsMember |
| Namespace Prefix: |
|
| Data Type: |
na |
| Balance Type: |
|
| Period Type: |
|
|
v3.23.3
| X |
- References
+ Details
| Name: |
us-gaap_ShareBasedCompensationArrangementByShareBasedPaymentAwardAdditionalGeneralDisclosuresAbstract |
| Namespace Prefix: |
us-gaap_ |
| Data Type: |
xbrli:stringItemType |
| Balance Type: |
na |
| Period Type: |
duration |
|
| X |
- DefinitionThe number of grants made during the period on other than stock (or unit) option plans (for example, phantom stock or unit plan, stock or unit appreciation rights plan, performance target plan). Reference 1: http://www.xbrl.org/2003/role/disclosureRef
-Topic 718
-SubTopic 10
-Name Accounting Standards Codification
-Section 50
-Paragraph 2
-Subparagraph (c)(2)(iii)(01)
-Publisher FASB
-URI https://asc.fasb.org//1943274/2147480429/718-10-50-2
| Name: |
us-gaap_ShareBasedCompensationArrangementByShareBasedPaymentAwardEquityInstrumentsOtherThanOptionsGrantsInPeriod |
| Namespace Prefix: |
us-gaap_ |
| Data Type: |
xbrli:sharesItemType |
| Balance Type: |
na |
| Period Type: |
duration |
|
| X |
- DefinitionThe weighted average fair value at grant date for nonvested equity-based awards issued during the period on other than stock (or unit) option plans (for example, phantom stock or unit plan, stock or unit appreciation rights plan, performance target plan). Reference 1: http://www.xbrl.org/2003/role/disclosureRef
-Topic 718
-SubTopic 10
-Name Accounting Standards Codification
-Section 50
-Paragraph 2
-Subparagraph (c)(2)(iii)(01)
-Publisher FASB
-URI https://asc.fasb.org//1943274/2147480429/718-10-50-2
| Name: |
us-gaap_ShareBasedCompensationArrangementByShareBasedPaymentAwardEquityInstrumentsOtherThanOptionsGrantsInPeriodWeightedAverageGrantDateFairValue |
| Namespace Prefix: |
us-gaap_ |
| Data Type: |
dtr-types:perShareItemType |
| Balance Type: |
na |
| Period Type: |
duration |
|
| X |
- References
+ Details
| Name: |
us-gaap_ShareBasedCompensationArrangementByShareBasedPaymentAwardOptionsOutstandingWeightedAverageExercisePriceRollforward |
| Namespace Prefix: |
us-gaap_ |
| Data Type: |
xbrli:stringItemType |
| Balance Type: |
na |
| Period Type: |
duration |
|
| X |
- Details
| Name: |
us-gaap_AwardTypeAxis=us-gaap_RestrictedStockUnitsRSUMember |
| Namespace Prefix: |
|
| Data Type: |
na |
| Balance Type: |
|
| Period Type: |
|
|
v3.23.3
| X |
- References
+ Details
| Name: |
us-gaap_InventoryDisclosureAbstract |
| Namespace Prefix: |
us-gaap_ |
| Data Type: |
xbrli:stringItemType |
| Balance Type: |
na |
| Period Type: |
duration |
|
| X |
- DefinitionCarrying amount, net of valuation reserves and adjustments, as of the balance sheet date of merchandise or goods held by the company that are readily available for sale. Reference 1: http://www.xbrl.org/2003/role/exampleRef
-Topic 210
-SubTopic 10
-Name Accounting Standards Codification
-Section S99
-Paragraph 1
-Subparagraph (SX 210.5-02(6)(a)(1))
-Publisher FASB
-URI https://asc.fasb.org//1943274/2147480566/210-10-S99-1
Reference 2: http://fasb.org/us-gaap/role/ref/legacyRef
-Topic 330
-SubTopic 10
-Name Accounting Standards Codification
-Section S99
-Paragraph 2
-Subparagraph (SAB Topic 5.BB)
-Publisher FASB
-URI https://asc.fasb.org//1943274/2147480581/330-10-S99-2
| Name: |
us-gaap_InventoryFinishedGoodsNetOfReserves |
| Namespace Prefix: |
us-gaap_ |
| Data Type: |
xbrli:monetaryItemType |
| Balance Type: |
debit |
| Period Type: |
instant |
|
| X |
- DefinitionAmount after valuation and LIFO reserves of inventory expected to be sold, or consumed within one year or operating cycle, if longer. Reference 1: http://www.xbrl.org/2003/role/exampleRef
-Topic 852
-SubTopic 10
-Name Accounting Standards Codification
-Section 55
-Paragraph 10
-Publisher FASB
-URI https://asc.fasb.org//1943274/2147481372/852-10-55-10
Reference 2: http://www.xbrl.org/2003/role/exampleRef
-Topic 210
-SubTopic 10
-Name Accounting Standards Codification
-Section 45
-Paragraph 1
-Subparagraph (b)
-Publisher FASB
-URI https://asc.fasb.org//1943274/2147483467/210-10-45-1
Reference 3: http://www.xbrl.org/2003/role/disclosureRef
-Topic 210
-SubTopic 10
-Name Accounting Standards Codification
-Section S99
-Paragraph 1
-Subparagraph (SX 210.5-02(6))
-Publisher FASB
-URI https://asc.fasb.org//1943274/2147480566/210-10-S99-1
| Name: |
us-gaap_InventoryNet |
| Namespace Prefix: |
us-gaap_ |
| Data Type: |
xbrli:monetaryItemType |
| Balance Type: |
debit |
| Period Type: |
instant |
|
| X |
- DefinitionCarrying amount, net of valuation reserves and adjustments, as of the balance sheet date of unprocessed items to be consumed in the manufacturing or production process. Reference 1: http://www.xbrl.org/2003/role/exampleRef
-Topic 210
-SubTopic 10
-Name Accounting Standards Codification
-Section S99
-Paragraph 1
-Subparagraph (SX 210.5-02(6)(a)(4))
-Publisher FASB
-URI https://asc.fasb.org//1943274/2147480566/210-10-S99-1
Reference 2: http://fasb.org/us-gaap/role/ref/legacyRef
-Topic 330
-SubTopic 10
-Name Accounting Standards Codification
-Section S99
-Paragraph 2
-Subparagraph (SAB Topic 5.BB)
-Publisher FASB
-URI https://asc.fasb.org//1943274/2147480581/330-10-S99-2
| Name: |
us-gaap_InventoryRawMaterialsNetOfReserves |
| Namespace Prefix: |
us-gaap_ |
| Data Type: |
xbrli:monetaryItemType |
| Balance Type: |
debit |
| Period Type: |
instant |
|
| X |
- DefinitionCarrying amount, net of reserves and adjustments, as of the balance sheet date of merchandise or goods which are partially completed. This inventory is generally comprised of raw materials, labor and factory overhead costs, which require further materials, labor and overhead to be converted into finished goods, and which generally require the use of estimates to determine percentage complete and pricing. Reference 1: http://www.xbrl.org/2003/role/exampleRef
-Topic 210
-SubTopic 10
-Name Accounting Standards Codification
-Section S99
-Paragraph 1
-Subparagraph (SX 210.5-02(6)(a)(3))
-Publisher FASB
-URI https://asc.fasb.org//1943274/2147480566/210-10-S99-1
Reference 2: http://fasb.org/us-gaap/role/ref/legacyRef
-Topic 330
-SubTopic 10
-Name Accounting Standards Codification
-Section S99
-Paragraph 2
-Subparagraph (SAB Topic 5.BB)
-Publisher FASB
-URI https://asc.fasb.org//1943274/2147480581/330-10-S99-2
| Name: |
us-gaap_InventoryWorkInProcessNetOfReserves |
| Namespace Prefix: |
us-gaap_ |
| Data Type: |
xbrli:monetaryItemType |
| Balance Type: |
debit |
| Period Type: |
instant |
|
v3.23.3
Goodwill and Intangible Assets, net - Schedule of Goodwill (Details)
$ in Millions |
9 Months Ended |
|
Sep. 30, 2023
USD ($)
|
|---|
| Goodwill |
|
| Goodwill, beginning balance |
$ 2,724
|
| Acquisitions |
13
|
| Adjustments |
(42)
|
| Impact of foreign currency translation |
(8)
|
| Goodwill, ending balance |
2,687
|
| Products and Solutions |
|
| Goodwill |
|
| Goodwill, beginning balance |
2,072
|
| Acquisitions |
10
|
| Adjustments |
(42)
|
| Impact of foreign currency translation |
(6)
|
| Goodwill, ending balance |
2,034
|
| ADI Global Distribution |
|
| Goodwill |
|
| Goodwill, beginning balance |
652
|
| Acquisitions |
3
|
| Adjustments |
0
|
| Impact of foreign currency translation |
(2)
|
| Goodwill, ending balance |
$ 653
|
| X |
- DefinitionAmount after accumulated impairment loss of an asset representing future economic benefits arising from other assets acquired in a business combination that are not individually identified and separately recognized. Reference 1: http://www.xbrl.org/2003/role/exampleRef
-Topic 852
-SubTopic 10
-Name Accounting Standards Codification
-Section 55
-Paragraph 10
-Publisher FASB
-URI https://asc.fasb.org//1943274/2147481372/852-10-55-10
Reference 2: http://www.xbrl.org/2003/role/exampleRef
-Topic 350
-SubTopic 20
-Name Accounting Standards Codification
-Section 55
-Paragraph 24
-Publisher FASB
-URI https://asc.fasb.org//1943274/2147482548/350-20-55-24
Reference 3: http://www.xbrl.org/2003/role/disclosureRef
-Topic 210
-SubTopic 10
-Name Accounting Standards Codification
-Section S99
-Paragraph 1
-Subparagraph (SX 210.5-02(15))
-Publisher FASB
-URI https://asc.fasb.org//1943274/2147480566/210-10-S99-1
Reference 4: http://www.xbrl.org/2003/role/disclosureRef
-Topic 350
-SubTopic 20
-Name Accounting Standards Codification
-Section 45
-Paragraph 1
-Publisher FASB
-URI https://asc.fasb.org//1943274/2147482598/350-20-45-1
Reference 5: http://www.xbrl.org/2009/role/commonPracticeRef
-Topic 350
-SubTopic 20
-Name Accounting Standards Codification
-Section 50
-Paragraph 1
-Subparagraph (a)
-Publisher FASB
-URI https://asc.fasb.org//1943274/2147482573/350-20-50-1
Reference 6: http://www.xbrl.org/2009/role/commonPracticeRef
-Topic 350
-SubTopic 20
-Name Accounting Standards Codification
-Section 50
-Paragraph 1
-Subparagraph (h)
-Publisher FASB
-URI https://asc.fasb.org//1943274/2147482573/350-20-50-1
Reference 7: http://www.xbrl.org/2003/role/disclosureRef
-Topic 942
-SubTopic 210
-Name Accounting Standards Codification
-Section S99
-Paragraph 1
-Subparagraph (SX 210.9-03(10)(1))
-Publisher FASB
-URI https://asc.fasb.org//1943274/2147479853/942-210-S99-1
| Name: |
us-gaap_Goodwill |
| Namespace Prefix: |
us-gaap_ |
| Data Type: |
xbrli:monetaryItemType |
| Balance Type: |
debit |
| Period Type: |
instant |
|
| X |
- DefinitionAmount of increase in asset representing future economic benefits arising from other assets acquired in a business combination that are not individually identified and separately recognized resulting from a business combination. Reference 1: http://www.xbrl.org/2003/role/exampleRef
-Topic 350
-SubTopic 20
-Name Accounting Standards Codification
-Section 55
-Paragraph 24
-Publisher FASB
-URI https://asc.fasb.org//1943274/2147482548/350-20-55-24
Reference 2: http://www.xbrl.org/2003/role/disclosureRef
-Topic 350
-SubTopic 20
-Name Accounting Standards Codification
-Section 50
-Paragraph 1
-Subparagraph (b)
-Publisher FASB
-URI https://asc.fasb.org//1943274/2147482573/350-20-50-1
| Name: |
us-gaap_GoodwillAcquiredDuringPeriod |
| Namespace Prefix: |
us-gaap_ |
| Data Type: |
xbrli:monetaryItemType |
| Balance Type: |
debit |
| Period Type: |
duration |
|
| X |
- DefinitionAmount of foreign currency translation gain (loss) which increases (decreases) an asset representing future economic benefits from other assets acquired in a business combination that are not individually identified and separately recognized. Reference 1: http://www.xbrl.org/2003/role/disclosureRef
-Topic 350
-SubTopic 20
-Name Accounting Standards Codification
-Section 50
-Paragraph 1
-Subparagraph (f)
-Publisher FASB
-URI https://asc.fasb.org//1943274/2147482573/350-20-50-1
| Name: |
us-gaap_GoodwillForeignCurrencyTranslationGainLoss |
| Namespace Prefix: |
us-gaap_ |
| Data Type: |
xbrli:monetaryItemType |
| Balance Type: |
credit |
| Period Type: |
duration |
|
| X |
- DefinitionAmount of increase (decrease) from adjustments after acquisition date under purchase accounting of an asset representing the future economic benefits arising from other assets acquired in a business combination that are not individually identified and separately recognized. Reference 1: http://www.xbrl.org/2009/role/commonPracticeRef
-Topic 350
-SubTopic 20
-Name Accounting Standards Codification
-Section 50
-Paragraph 1
-Subparagraph (g)
-Publisher FASB
-URI https://asc.fasb.org//1943274/2147482573/350-20-50-1
Reference 2: http://fasb.org/us-gaap/role/ref/legacyRef
-Name Accounting Standards Codification
-Section 25
-Paragraph 16
-SubTopic 10
-Topic 805
-Publisher FASB
-URI https://asc.fasb.org//1943274/2147479405/805-10-25-16
| Name: |
us-gaap_GoodwillPurchaseAccountingAdjustments |
| Namespace Prefix: |
us-gaap_ |
| Data Type: |
xbrli:monetaryItemType |
| Balance Type: |
debit |
| Period Type: |
duration |
|
| X |
- DefinitionA roll forward is a reconciliation of a concept from the beginning of a period to the end of a period.
| Name: |
us-gaap_GoodwillRollForward |
| Namespace Prefix: |
us-gaap_ |
| Data Type: |
xbrli:stringItemType |
| Balance Type: |
na |
| Period Type: |
duration |
|
| X |
- Details
| Name: |
us-gaap_StatementBusinessSegmentsAxis=rezi_ProductsAndSolutionsSegmentMember |
| Namespace Prefix: |
|
| Data Type: |
na |
| Balance Type: |
|
| Period Type: |
|
|
| X |
- Details
| Name: |
us-gaap_StatementBusinessSegmentsAxis=rezi_ADIGlobalDistributionSegmentMember |
| Namespace Prefix: |
|
| Data Type: |
na |
| Balance Type: |
|
| Period Type: |
|
|
v3.23.3
| X |
- DefinitionAmount after amortization of assets, excluding financial assets and goodwill, lacking physical substance with a finite life. Reference 1: http://www.xbrl.org/2003/role/disclosureRef
-Topic 926
-SubTopic 20
-Name Accounting Standards Codification
-Section 50
-Paragraph 5
-Publisher FASB
-URI https://asc.fasb.org//1943274/2147483154/926-20-50-5
Reference 2: http://fasb.org/us-gaap/role/ref/legacyRef
-Topic 350
-SubTopic 30
-Name Accounting Standards Codification
-Section 50
-Paragraph 2
-Subparagraph (a)(1)
-Publisher FASB
-URI https://asc.fasb.org//1943274/2147482665/350-30-50-2
| Name: |
us-gaap_FiniteLivedIntangibleAssetsNet |
| Namespace Prefix: |
us-gaap_ |
| Data Type: |
xbrli:monetaryItemType |
| Balance Type: |
debit |
| Period Type: |
instant |
|
| X |
- References
+ Details
| Name: |
us-gaap_GoodwillAndIntangibleAssetsDisclosureAbstract |
| Namespace Prefix: |
us-gaap_ |
| Data Type: |
xbrli:stringItemType |
| Balance Type: |
na |
| Period Type: |
duration |
|
| X |
- DefinitionAmount of assets, excluding financial assets and goodwill, lacking physical substance and having a projected indefinite period of benefit. Reference 1: http://fasb.org/us-gaap/role/ref/legacyRef
-Topic 350
-SubTopic 30
-Name Accounting Standards Codification
-Section 50
-Paragraph 2
-Subparagraph (b)
-Publisher FASB
-URI https://asc.fasb.org//1943274/2147482665/350-30-50-2
| Name: |
us-gaap_IndefiniteLivedIntangibleAssetsExcludingGoodwill |
| Namespace Prefix: |
us-gaap_ |
| Data Type: |
xbrli:monetaryItemType |
| Balance Type: |
debit |
| Period Type: |
instant |
|
| X |
- DefinitionSum of the carrying amounts of all intangible assets, excluding goodwill, as of the balance sheet date, net of accumulated amortization and impairment charges. Reference 1: http://fasb.org/us-gaap/role/ref/legacyRef
-Name Accounting Standards Codification
-Topic 350
-SubTopic 30
-Section 50
-Paragraph 2
-Subparagraph ((a)(1),(b))
-Publisher FASB
-URI https://asc.fasb.org//1943274/2147482665/350-30-50-2
Reference 2: http://fasb.org/us-gaap/role/ref/legacyRef
-Name Accounting Standards Codification
-Topic 350
-SubTopic 30
-Section 45
-Paragraph 1
-Publisher FASB
-URI https://asc.fasb.org//1943274/2147482686/350-30-45-1
| Name: |
us-gaap_IntangibleAssetsNetExcludingGoodwill |
| Namespace Prefix: |
us-gaap_ |
| Data Type: |
xbrli:monetaryItemType |
| Balance Type: |
debit |
| Period Type: |
instant |
|
v3.23.3
| X |
- DefinitionAccumulated amount of amortization of assets, excluding financial assets and goodwill, lacking physical substance with a finite life. Reference 1: http://www.xbrl.org/2003/role/disclosureRef
-Topic 210
-SubTopic 10
-Name Accounting Standards Codification
-Section S99
-Paragraph 1
-Subparagraph (SX 210.5-02(16))
-Publisher FASB
-URI https://asc.fasb.org//1943274/2147480566/210-10-S99-1
Reference 2: http://www.xbrl.org/2003/role/disclosureRef
-Topic 350
-SubTopic 30
-Name Accounting Standards Codification
-Section 50
-Paragraph 2
-Subparagraph (a)(1)
-Publisher FASB
-URI https://asc.fasb.org//1943274/2147482665/350-30-50-2
| Name: |
us-gaap_FiniteLivedIntangibleAssetsAccumulatedAmortization |
| Namespace Prefix: |
us-gaap_ |
| Data Type: |
xbrli:monetaryItemType |
| Balance Type: |
credit |
| Period Type: |
instant |
|
| X |
- DefinitionAmount before amortization of assets, excluding financial assets and goodwill, lacking physical substance with a finite life. Reference 1: http://www.xbrl.org/2003/role/disclosureRef
-Topic 928
-SubTopic 340
-Name Accounting Standards Codification
-Section 50
-Paragraph 1
-Publisher FASB
-URI https://asc.fasb.org//1943274/2147483147/928-340-50-1
Reference 2: http://fasb.org/us-gaap/role/ref/legacyRef
-Topic 350
-SubTopic 30
-Name Accounting Standards Codification
-Section 50
-Paragraph 2
-Subparagraph (a)(1)
-Publisher FASB
-URI https://asc.fasb.org//1943274/2147482665/350-30-50-2
| Name: |
us-gaap_FiniteLivedIntangibleAssetsGross |
| Namespace Prefix: |
us-gaap_ |
| Data Type: |
xbrli:monetaryItemType |
| Balance Type: |
debit |
| Period Type: |
instant |
|
| X |
- DefinitionLine items represent financial concepts included in a table. These concepts are used to disclose reportable information associated with domain members defined in one or many axes to the table. Reference 1: http://www.xbrl.org/2003/role/disclosureRef
-Topic 926
-SubTopic 20
-Name Accounting Standards Codification
-Section 50
-Paragraph 5
-Publisher FASB
-URI https://asc.fasb.org//1943274/2147483154/926-20-50-5
| Name: |
us-gaap_FiniteLivedIntangibleAssetsLineItems |
| Namespace Prefix: |
us-gaap_ |
| Data Type: |
xbrli:stringItemType |
| Balance Type: |
na |
| Period Type: |
duration |
|
| X |
- DefinitionAmount after amortization of assets, excluding financial assets and goodwill, lacking physical substance with a finite life. Reference 1: http://www.xbrl.org/2003/role/disclosureRef
-Topic 926
-SubTopic 20
-Name Accounting Standards Codification
-Section 50
-Paragraph 5
-Publisher FASB
-URI https://asc.fasb.org//1943274/2147483154/926-20-50-5
Reference 2: http://fasb.org/us-gaap/role/ref/legacyRef
-Topic 350
-SubTopic 30
-Name Accounting Standards Codification
-Section 50
-Paragraph 2
-Subparagraph (a)(1)
-Publisher FASB
-URI https://asc.fasb.org//1943274/2147482665/350-30-50-2
| Name: |
us-gaap_FiniteLivedIntangibleAssetsNet |
| Namespace Prefix: |
us-gaap_ |
| Data Type: |
xbrli:monetaryItemType |
| Balance Type: |
debit |
| Period Type: |
instant |
|
| X |
- Details
| Name: |
us-gaap_FiniteLivedIntangibleAssetsByMajorClassAxis=us-gaap_PatentedTechnologyMember |
| Namespace Prefix: |
|
| Data Type: |
na |
| Balance Type: |
|
| Period Type: |
|
|
| X |
- Details
| Name: |
us-gaap_FiniteLivedIntangibleAssetsByMajorClassAxis=us-gaap_CustomerRelationshipsMember |
| Namespace Prefix: |
|
| Data Type: |
na |
| Balance Type: |
|
| Period Type: |
|
|
| X |
- Details
| Name: |
us-gaap_FiniteLivedIntangibleAssetsByMajorClassAxis=us-gaap_TrademarksMember |
| Namespace Prefix: |
|
| Data Type: |
na |
| Balance Type: |
|
| Period Type: |
|
|
| X |
- Details
| Name: |
us-gaap_FiniteLivedIntangibleAssetsByMajorClassAxis=us-gaap_ComputerSoftwareIntangibleAssetMember |
| Namespace Prefix: |
|
| Data Type: |
na |
| Balance Type: |
|
| Period Type: |
|
|
v3.23.3
| X |
- DefinitionThe aggregate expense charged against earnings to allocate the cost of intangible assets (nonphysical assets not used in production) in a systematic and rational manner to the periods expected to benefit from such assets. As a noncash expense, this element is added back to net income when calculating cash provided by or used in operations using the indirect method. Reference 1: http://fasb.org/us-gaap/role/ref/legacyRef
-Name Accounting Standards Codification
-Section 45
-Paragraph 28
-Subparagraph (b)
-SubTopic 10
-Topic 230
-Publisher FASB
-URI https://asc.fasb.org//1943274/2147482740/230-10-45-28
Reference 2: http://fasb.org/us-gaap/role/ref/legacyRef
-Name Accounting Standards Codification
-Topic 350
-SubTopic 30
-Section 45
-Paragraph 2
-Publisher FASB
-URI https://asc.fasb.org//1943274/2147482686/350-30-45-2
Reference 3: http://fasb.org/us-gaap/role/ref/legacyRef
-Name Accounting Standards Codification
-Topic 350
-SubTopic 30
-Section 50
-Paragraph 2
-Subparagraph (a)(2)
-Publisher FASB
-URI https://asc.fasb.org//1943274/2147482665/350-30-50-2
| Name: |
us-gaap_AmortizationOfIntangibleAssets |
| Namespace Prefix: |
us-gaap_ |
| Data Type: |
xbrli:monetaryItemType |
| Balance Type: |
debit |
| Period Type: |
duration |
|
| X |
- References
+ Details
| Name: |
us-gaap_GoodwillAndIntangibleAssetsDisclosureAbstract |
| Namespace Prefix: |
us-gaap_ |
| Data Type: |
xbrli:stringItemType |
| Balance Type: |
na |
| Period Type: |
duration |
|
v3.23.3
| X |
- DefinitionLine items represent financial concepts included in a table. These concepts are used to disclose reportable information associated with domain members defined in one or many axes to the table. Reference 1: http://www.xbrl.org/2003/role/disclosureRef
-Topic 842
-SubTopic 20
-Name Accounting Standards Codification
-Section 50
-Paragraph 3
-Publisher FASB
-URI https://asc.fasb.org//1943274/2147478964/842-20-50-3
| Name: |
us-gaap_LesseeLeaseDescriptionLineItems |
| Namespace Prefix: |
us-gaap_ |
| Data Type: |
xbrli:stringItemType |
| Balance Type: |
na |
| Period Type: |
duration |
|
| X |
- DefinitionAmount of single lease cost, calculated by allocation of remaining cost of lease over remaining lease term. Includes, but is not limited to, single lease cost, after impairment of right-of-use asset, calculated by amortization of remaining right-of-use asset and accretion of lease liability. Reference 1: http://www.xbrl.org/2003/role/exampleRef
-Topic 842
-SubTopic 20
-Name Accounting Standards Codification
-Section 55
-Paragraph 53
-Publisher FASB
-URI https://asc.fasb.org//1943274/2147479589/842-20-55-53
Reference 2: http://www.xbrl.org/2003/role/disclosureRef
-Topic 842
-SubTopic 20
-Name Accounting Standards Codification
-Section 50
-Paragraph 4
-Subparagraph (b)
-Publisher FASB
-URI https://asc.fasb.org//1943274/2147478964/842-20-50-4
| Name: |
us-gaap_OperatingLeaseCost |
| Namespace Prefix: |
us-gaap_ |
| Data Type: |
xbrli:monetaryItemType |
| Balance Type: |
debit |
| Period Type: |
duration |
|
| X |
- Details
| Name: |
us-gaap_IncomeStatementLocationAxis=rezi_CostOfGoodsSoldMember |
| Namespace Prefix: |
|
| Data Type: |
na |
| Balance Type: |
|
| Period Type: |
|
|
| X |
- Details
| Name: |
us-gaap_IncomeStatementLocationAxis=us-gaap_SellingGeneralAndAdministrativeExpensesMember |
| Namespace Prefix: |
|
| Data Type: |
na |
| Balance Type: |
|
| Period Type: |
|
|
v3.23.3
Leases - Additional Information (Details) - USD ($)
$ in Millions |
3 Months Ended |
9 Months Ended |
Sep. 30, 2023 |
Oct. 01, 2022 |
Sep. 30, 2023 |
Oct. 01, 2022 |
| Leases [Abstract] |
|
|
|
|
| Variable lease costs |
$ 6
|
$ 6
|
$ 18
|
$ 15
|
| X |
- References
+ Details
| Name: |
us-gaap_LeasesAbstract |
| Namespace Prefix: |
us-gaap_ |
| Data Type: |
xbrli:stringItemType |
| Balance Type: |
na |
| Period Type: |
duration |
|
| X |
- DefinitionAmount of variable lease cost, excluded from lease liability, recognized when obligation for payment is incurred for finance and operating leases. Reference 1: http://www.xbrl.org/2003/role/exampleRef
-Topic 842
-SubTopic 20
-Name Accounting Standards Codification
-Section 55
-Paragraph 53
-Publisher FASB
-URI https://asc.fasb.org//1943274/2147479589/842-20-55-53
Reference 2: http://www.xbrl.org/2003/role/disclosureRef
-Topic 842
-SubTopic 20
-Name Accounting Standards Codification
-Section 50
-Paragraph 4
-Subparagraph (d)
-Publisher FASB
-URI https://asc.fasb.org//1943274/2147478964/842-20-50-4
| Name: |
us-gaap_VariableLeaseCost |
| Namespace Prefix: |
us-gaap_ |
| Data Type: |
xbrli:monetaryItemType |
| Balance Type: |
debit |
| Period Type: |
duration |
|
v3.23.3
Leases - Summary of Lease Recognized Related to Operating Leases (Details) - USD ($)
$ in Millions |
Sep. 30, 2023 |
Dec. 31, 2022 |
| Leases [Abstract] |
|
|
| Operating lease assets |
$ 197
|
$ 191
|
| Operating lease liabilities - current |
36
|
37
|
| Operating lease liabilities - non-current |
$ 174
|
$ 166
|
| Operating Lease, Right-of-Use Asset, Statement of Financial Position [Extensible List] |
Other assets
|
Other assets
|
| Operating Lease, Liability, Current, Statement of Financial Position [Extensible List] |
Accrued liabilities
|
Accrued liabilities
|
| Operating Lease, Liability, Noncurrent, Statement of Financial Position [Extensible List] |
Other liabilities
|
Other liabilities
|
| X |
- References
+ Details
| Name: |
us-gaap_LeasesAbstract |
| Namespace Prefix: |
us-gaap_ |
| Data Type: |
xbrli:stringItemType |
| Balance Type: |
na |
| Period Type: |
duration |
|
| X |
- DefinitionPresent value of lessee's discounted obligation for lease payments from operating lease, classified as current. Reference 1: http://www.xbrl.org/2003/role/disclosureRef
-Topic 842
-SubTopic 20
-Name Accounting Standards Codification
-Section 45
-Paragraph 1
-Subparagraph (b)
-Publisher FASB
-URI https://asc.fasb.org//1943274/2147479041/842-20-45-1
| Name: |
us-gaap_OperatingLeaseLiabilityCurrent |
| Namespace Prefix: |
us-gaap_ |
| Data Type: |
xbrli:monetaryItemType |
| Balance Type: |
credit |
| Period Type: |
instant |
|
| X |
- DefinitionIndicates line item in statement of financial position that includes current operating lease liability. Reference 1: http://www.xbrl.org/2003/role/disclosureRef
-Topic 842
-SubTopic 20
-Name Accounting Standards Codification
-Section 45
-Paragraph 2
-Publisher FASB
-URI https://asc.fasb.org//1943274/2147479041/842-20-45-2
| Name: |
us-gaap_OperatingLeaseLiabilityCurrentStatementOfFinancialPositionExtensibleList |
| Namespace Prefix: |
us-gaap_ |
| Data Type: |
enum2:enumerationSetItemType |
| Balance Type: |
na |
| Period Type: |
instant |
|
| X |
- DefinitionPresent value of lessee's discounted obligation for lease payments from operating lease, classified as noncurrent. Reference 1: http://www.xbrl.org/2003/role/disclosureRef
-Topic 842
-SubTopic 20
-Name Accounting Standards Codification
-Section 45
-Paragraph 1
-Subparagraph (b)
-Publisher FASB
-URI https://asc.fasb.org//1943274/2147479041/842-20-45-1
| Name: |
us-gaap_OperatingLeaseLiabilityNoncurrent |
| Namespace Prefix: |
us-gaap_ |
| Data Type: |
xbrli:monetaryItemType |
| Balance Type: |
credit |
| Period Type: |
instant |
|
| X |
- DefinitionIndicates line item in statement of financial position that includes noncurrent operating lease liability. Reference 1: http://www.xbrl.org/2003/role/disclosureRef
-Topic 842
-SubTopic 20
-Name Accounting Standards Codification
-Section 45
-Paragraph 2
-Publisher FASB
-URI https://asc.fasb.org//1943274/2147479041/842-20-45-2
| Name: |
us-gaap_OperatingLeaseLiabilityNoncurrentStatementOfFinancialPositionExtensibleList |
| Namespace Prefix: |
us-gaap_ |
| Data Type: |
enum2:enumerationSetItemType |
| Balance Type: |
na |
| Period Type: |
instant |
|
| X |
- DefinitionAmount of lessee's right to use underlying asset under operating lease. Reference 1: http://www.xbrl.org/2003/role/disclosureRef
-Topic 842
-SubTopic 20
-Name Accounting Standards Codification
-Section 45
-Paragraph 1
-Subparagraph (a)
-Publisher FASB
-URI https://asc.fasb.org//1943274/2147479041/842-20-45-1
| Name: |
us-gaap_OperatingLeaseRightOfUseAsset |
| Namespace Prefix: |
us-gaap_ |
| Data Type: |
xbrli:monetaryItemType |
| Balance Type: |
debit |
| Period Type: |
instant |
|
| X |
- DefinitionIndicates line item in statement of financial position that includes operating lease right-of-use asset. Reference 1: http://www.xbrl.org/2003/role/disclosureRef
-Topic 842
-SubTopic 20
-Name Accounting Standards Codification
-Section 45
-Paragraph 2
-Publisher FASB
-URI https://asc.fasb.org//1943274/2147479041/842-20-45-2
| Name: |
us-gaap_OperatingLeaseRightOfUseAssetStatementOfFinancialPositionExtensibleList |
| Namespace Prefix: |
us-gaap_ |
| Data Type: |
enum2:enumerationSetItemType |
| Balance Type: |
na |
| Period Type: |
instant |
|
v3.23.3
| X |
- References
+ Details
| Name: |
us-gaap_LeasesAbstract |
| Namespace Prefix: |
us-gaap_ |
| Data Type: |
xbrli:stringItemType |
| Balance Type: |
na |
| Period Type: |
duration |
|
| X |
- DefinitionAmount of cash outflow from operating lease, excluding payments to bring another asset to condition and location necessary for its intended use. Reference 1: http://www.xbrl.org/2003/role/disclosureRef
-Topic 842
-SubTopic 20
-Name Accounting Standards Codification
-Section 45
-Paragraph 5
-Subparagraph (c)
-Publisher FASB
-URI https://asc.fasb.org//1943274/2147479041/842-20-45-5
Reference 2: http://www.xbrl.org/2003/role/disclosureRef
-Topic 842
-SubTopic 20
-Name Accounting Standards Codification
-Section 50
-Paragraph 4
-Subparagraph (g)(1)
-Publisher FASB
-URI https://asc.fasb.org//1943274/2147478964/842-20-50-4
| Name: |
us-gaap_OperatingLeasePayments |
| Namespace Prefix: |
us-gaap_ |
| Data Type: |
xbrli:monetaryItemType |
| Balance Type: |
credit |
| Period Type: |
duration |
|
| X |
- DefinitionAmount of increase in right-of-use asset obtained in exchange for operating lease liability. Reference 1: http://www.xbrl.org/2003/role/exampleRef
-Topic 842
-SubTopic 20
-Name Accounting Standards Codification
-Section 55
-Paragraph 53
-Publisher FASB
-URI https://asc.fasb.org//1943274/2147479589/842-20-55-53
Reference 2: http://www.xbrl.org/2003/role/disclosureRef
-Topic 842
-SubTopic 20
-Name Accounting Standards Codification
-Section 50
-Paragraph 4
-Subparagraph (g)(2)
-Publisher FASB
-URI https://asc.fasb.org//1943274/2147478964/842-20-50-4
| Name: |
us-gaap_RightOfUseAssetObtainedInExchangeForOperatingLeaseLiability |
| Namespace Prefix: |
us-gaap_ |
| Data Type: |
xbrli:monetaryItemType |
| Balance Type: |
debit |
| Period Type: |
duration |
|
v3.23.3
| X |
- DefinitionAmount, before unamortized (discount) premium and debt issuance costs, of long-term debt. Includes, but is not limited to, notes payable, bonds payable, commercial loans, mortgage loans, convertible debt, subordinated debt and other types of debt. Reference 1: http://fasb.org/us-gaap/role/ref/legacyRef
-Name Accounting Standards Codification
-Section S99
-Paragraph 1
-Subparagraph (SX 210.5-02(22))
-SubTopic 10
-Topic 210
-Publisher FASB
-URI https://asc.fasb.org//1943274/2147480566/210-10-S99-1
Reference 2: http://fasb.org/us-gaap/role/ref/legacyRef
-Topic 942
-SubTopic 210
-Name Accounting Standards Codification
-Section S99
-Paragraph 1
-Subparagraph (SX 210.9-03(16))
-Publisher FASB
-URI https://asc.fasb.org//1943274/2147479853/942-210-S99-1
Reference 3: http://www.xbrl.org/2003/role/disclosureRef
-Topic 470
-SubTopic 20
-Name Accounting Standards Codification
-Section 50
-Paragraph 4
-Subparagraph (b)(1)
-Publisher FASB
-URI https://asc.fasb.org//1943274/2147481139/470-20-50-4
| Name: |
us-gaap_DebtInstrumentCarryingAmount |
| Namespace Prefix: |
us-gaap_ |
| Data Type: |
xbrli:monetaryItemType |
| Balance Type: |
credit |
| Period Type: |
instant |
|
| X |
- DefinitionContractual interest rate for funds borrowed, under the debt agreement. Reference 1: http://www.xbrl.org/2003/role/disclosureRef
-Topic 470
-SubTopic 20
-Name Accounting Standards Codification
-Section 50
-Paragraph 1B
-Subparagraph (b)
-Publisher FASB
-URI https://asc.fasb.org//1943274/2147481139/470-20-50-1B
Reference 2: http://fasb.org/us-gaap/role/ref/legacyRef
-Name Accounting Standards Codification
-Topic 210
-SubTopic 10
-Section S99
-Paragraph 1
-Subparagraph (SX 210.5-02.22(a)(1))
-Publisher FASB
-URI https://asc.fasb.org//1943274/2147480566/210-10-S99-1
| Name: |
us-gaap_DebtInstrumentInterestRateStatedPercentage |
| Namespace Prefix: |
us-gaap_ |
| Data Type: |
dtr-types:percentItemType |
| Balance Type: |
na |
| Period Type: |
instant |
|
| X |
- DefinitionLine items represent financial concepts included in a table. These concepts are used to disclose reportable information associated with domain members defined in one or many axes to the table. Reference 1: http://www.xbrl.org/2003/role/disclosureRef
-Topic 835
-SubTopic 30
-Name Accounting Standards Codification
-Section 50
-Paragraph 1
-Publisher FASB
-URI https://asc.fasb.org//1943274/2147482900/835-30-50-1
Reference 2: http://www.xbrl.org/2009/role/commonPracticeRef
-Topic 235
-SubTopic 10
-Name Accounting Standards Codification
-Section S99
-Paragraph 1
-Subparagraph (SX 210.4-08(f))
-Publisher FASB
-URI https://asc.fasb.org//1943274/2147480678/235-10-S99-1
Reference 3: http://www.xbrl.org/2003/role/disclosureRef
-Topic 235
-SubTopic 10
-Name Accounting Standards Codification
-Section S99
-Paragraph 3
-Subparagraph (SX 210.12-04(a))
-Publisher FASB
-URI https://asc.fasb.org//1943274/2147480678/235-10-S99-3
Reference 4: http://www.xbrl.org/2003/role/disclosureRef
-Topic 470
-SubTopic 20
-Name Accounting Standards Codification
-Section 50
-Paragraph 1B
-Subparagraph (a)
-Publisher FASB
-URI https://asc.fasb.org//1943274/2147481139/470-20-50-1B
Reference 5: http://www.xbrl.org/2003/role/exampleRef
-Topic 470
-SubTopic 20
-Name Accounting Standards Codification
-Section 55
-Paragraph 69B
-Publisher FASB
-URI https://asc.fasb.org//1943274/2147481568/470-20-55-69B
Reference 6: http://www.xbrl.org/2003/role/exampleRef
-Topic 470
-SubTopic 20
-Name Accounting Standards Codification
-Section 55
-Paragraph 69C
-Publisher FASB
-URI https://asc.fasb.org//1943274/2147481568/470-20-55-69C
Reference 7: http://www.xbrl.org/2003/role/exampleRef
-Topic 470
-SubTopic 20
-Name Accounting Standards Codification
-Section 55
-Paragraph 69E
-Publisher FASB
-URI https://asc.fasb.org//1943274/2147481568/470-20-55-69E
Reference 8: http://www.xbrl.org/2003/role/exampleRef
-Topic 470
-SubTopic 20
-Name Accounting Standards Codification
-Section 55
-Paragraph 69F
-Publisher FASB
-URI https://asc.fasb.org//1943274/2147481568/470-20-55-69F
Reference 9: http://www.xbrl.org/2003/role/disclosureRef
-Topic 470
-SubTopic 20
-Name Accounting Standards Codification
-Section 50
-Paragraph 1B
-Subparagraph (b)
-Publisher FASB
-URI https://asc.fasb.org//1943274/2147481139/470-20-50-1B
Reference 10: http://www.xbrl.org/2003/role/disclosureRef
-Topic 470
-SubTopic 20
-Name Accounting Standards Codification
-Section 50
-Paragraph 1B
-Subparagraph (c)
-Publisher FASB
-URI https://asc.fasb.org//1943274/2147481139/470-20-50-1B
Reference 11: http://www.xbrl.org/2003/role/exampleRef
-Topic 470
-SubTopic 20
-Name Accounting Standards Codification
-Section 50
-Paragraph 1B
-Subparagraph (d)
-Publisher FASB
-URI https://asc.fasb.org//1943274/2147481139/470-20-50-1B
Reference 12: http://www.xbrl.org/2003/role/disclosureRef
-Topic 470
-SubTopic 20
-Name Accounting Standards Codification
-Section 50
-Paragraph 1B
-Subparagraph (e)
-Publisher FASB
-URI https://asc.fasb.org//1943274/2147481139/470-20-50-1B
Reference 13: http://www.xbrl.org/2003/role/disclosureRef
-Topic 470
-SubTopic 20
-Name Accounting Standards Codification
-Section 50
-Paragraph 1B
-Subparagraph (f)
-Publisher FASB
-URI https://asc.fasb.org//1943274/2147481139/470-20-50-1B
Reference 14: http://www.xbrl.org/2003/role/disclosureRef
-Topic 470
-SubTopic 20
-Name Accounting Standards Codification
-Section 50
-Paragraph 1B
-Subparagraph (h)
-Publisher FASB
-URI https://asc.fasb.org//1943274/2147481139/470-20-50-1B
Reference 15: http://www.xbrl.org/2003/role/disclosureRef
-Topic 470
-SubTopic 20
-Name Accounting Standards Codification
-Section 50
-Paragraph 1D
-Subparagraph (a)
-Publisher FASB
-URI https://asc.fasb.org//1943274/2147481139/470-20-50-1D
Reference 16: http://www.xbrl.org/2003/role/disclosureRef
-Topic 470
-SubTopic 20
-Name Accounting Standards Codification
-Section 50
-Paragraph 1D
-Subparagraph (b)
-Publisher FASB
-URI https://asc.fasb.org//1943274/2147481139/470-20-50-1D
Reference 17: http://www.xbrl.org/2003/role/disclosureRef
-Topic 470
-SubTopic 20
-Name Accounting Standards Codification
-Section 50
-Paragraph 1D
-Subparagraph (c)
-Publisher FASB
-URI https://asc.fasb.org//1943274/2147481139/470-20-50-1D
Reference 18: http://www.xbrl.org/2003/role/disclosureRef
-Topic 470
-SubTopic 20
-Name Accounting Standards Codification
-Section 50
-Paragraph 1E
-Subparagraph (a)
-Publisher FASB
-URI https://asc.fasb.org//1943274/2147481139/470-20-50-1E
Reference 19: http://www.xbrl.org/2003/role/disclosureRef
-Topic 470
-SubTopic 20
-Name Accounting Standards Codification
-Section 50
-Paragraph 1E
-Subparagraph (c)
-Publisher FASB
-URI https://asc.fasb.org//1943274/2147481139/470-20-50-1E
Reference 20: http://www.xbrl.org/2003/role/disclosureRef
-Topic 470
-SubTopic 20
-Name Accounting Standards Codification
-Section 50
-Paragraph 1E
-Subparagraph (d)
-Publisher FASB
-URI https://asc.fasb.org//1943274/2147481139/470-20-50-1E
Reference 21: http://www.xbrl.org/2003/role/disclosureRef
-Topic 470
-SubTopic 20
-Name Accounting Standards Codification
-Section 50
-Paragraph 1F
-Subparagraph (a)
-Publisher FASB
-URI https://asc.fasb.org//1943274/2147481139/470-20-50-1F
Reference 22: http://www.xbrl.org/2003/role/disclosureRef
-Topic 470
-SubTopic 20
-Name Accounting Standards Codification
-Section 50
-Paragraph 1F
-Subparagraph (b)
-Publisher FASB
-URI https://asc.fasb.org//1943274/2147481139/470-20-50-1F
Reference 23: http://www.xbrl.org/2003/role/disclosureRef
-Topic 470
-SubTopic 20
-Name Accounting Standards Codification
-Section 50
-Paragraph 1F
-Subparagraph (b)(1)
-Publisher FASB
-URI https://asc.fasb.org//1943274/2147481139/470-20-50-1F
Reference 24: http://www.xbrl.org/2003/role/disclosureRef
-Topic 470
-SubTopic 20
-Name Accounting Standards Codification
-Section 50
-Paragraph 1F
-Subparagraph (b)(2)
-Publisher FASB
-URI https://asc.fasb.org//1943274/2147481139/470-20-50-1F
Reference 25: http://www.xbrl.org/2003/role/disclosureRef
-Topic 470
-SubTopic 20
-Name Accounting Standards Codification
-Section 50
-Paragraph 1I
-Subparagraph (c)
-Publisher FASB
-URI https://asc.fasb.org//1943274/2147481139/470-20-50-1I
| Name: |
us-gaap_DebtInstrumentLineItems |
| Namespace Prefix: |
us-gaap_ |
| Data Type: |
xbrli:stringItemType |
| Balance Type: |
na |
| Period Type: |
duration |
|
| X |
- DefinitionAmount, after deduction of unamortized premium (discount) and debt issuance cost, of long-term debt classified as current. Excludes lease obligation. Reference 1: http://www.xbrl.org/2003/role/disclosureRef
-Topic 210
-SubTopic 10
-Name Accounting Standards Codification
-Section S99
-Paragraph 1
-Subparagraph (SX 210.5-02(20))
-Publisher FASB
-URI https://asc.fasb.org//1943274/2147480566/210-10-S99-1
| Name: |
us-gaap_LongTermDebtCurrent |
| Namespace Prefix: |
us-gaap_ |
| Data Type: |
xbrli:monetaryItemType |
| Balance Type: |
credit |
| Period Type: |
instant |
|
| X |
- DefinitionAmount, after deduction of unamortized premium (discount) and debt issuance cost, of long-term debt classified as noncurrent. Excludes lease obligation. Reference 1: http://www.xbrl.org/2003/role/disclosureRef
-Topic 210
-SubTopic 10
-Name Accounting Standards Codification
-Section S99
-Paragraph 1
-Subparagraph (SX 210.5-02(22))
-Publisher FASB
-URI https://asc.fasb.org//1943274/2147480566/210-10-S99-1
| Name: |
us-gaap_LongTermDebtNoncurrent |
| Namespace Prefix: |
us-gaap_ |
| Data Type: |
xbrli:monetaryItemType |
| Balance Type: |
credit |
| Period Type: |
instant |
|
| X |
- DefinitionThe remaining balance of debt issuance expenses that were capitalized and are being amortized against income over the lives of the respective bond issues. This does not include the amounts capitalized as part of the cost of the utility plant or asset.
| Name: |
us-gaap_UnamortizedDebtIssuanceExpense |
| Namespace Prefix: |
us-gaap_ |
| Data Type: |
xbrli:monetaryItemType |
| Balance Type: |
debit |
| Period Type: |
instant |
|
| X |
- Details
| Name: |
us-gaap_DebtInstrumentAxis=rezi_A4OfSeniorUnsecuredNotesDue2029Member |
| Namespace Prefix: |
|
| Data Type: |
na |
| Balance Type: |
|
| Period Type: |
|
|
| X |
- Details
| Name: |
us-gaap_DebtInstrumentAxis=rezi_SevenYearVariableRateTermLoanBDueInTwoThousandTwentyEightMember |
| Namespace Prefix: |
|
| Data Type: |
na |
| Balance Type: |
|
| Period Type: |
|
|
v3.23.3
Long-Term Debt - Additional Information (Details) - USD ($)
|
Jun. 30, 2023 |
Feb. 12, 2021 |
Sep. 30, 2023 |
Dec. 31, 2022 |
| A&R Term B Facility |
|
|
|
|
| Debt Instrument |
|
|
|
|
| Interest rate (as a percent) |
|
|
7.69%
|
6.78%
|
| A&R Credit Agreement | A&R Term B Facility |
|
|
|
|
| Debt Instrument |
|
|
|
|
| Credit facilities term (in years) |
|
7 years
|
|
|
| Principal amount issued |
|
$ 950,000,000
|
$ 200,000,000
|
|
| A&R Credit Agreement | A&R Revolving Credit Facility |
|
|
|
|
| Debt Instrument |
|
|
|
|
| Credit facilities term (in years) |
|
5 years
|
|
|
| Principal amount issued |
|
$ 500,000,000
|
|
|
| A&R Credit Agreement | A&R Revolving Credit Facility | SOFR |
|
|
|
|
| Debt Instrument |
|
|
|
|
| Debt instrument, basis spread on variable rate |
0.10%
|
|
|
|
| Senior Credit Facilities | A&R Revolving Credit Facility |
|
|
|
|
| Debt Instrument |
|
|
|
|
| Borrowings from credit facility |
|
|
0
|
$ 0
|
| Senior Credit Facilities | Letter of Credit |
|
|
|
|
| Debt Instrument |
|
|
|
|
| Borrowings from credit facility |
|
|
$ 0
|
$ 0
|
| X |
- DefinitionPercentage points added to the reference rate to compute the variable rate on the debt instrument.
| Name: |
us-gaap_DebtInstrumentBasisSpreadOnVariableRate1 |
| Namespace Prefix: |
us-gaap_ |
| Data Type: |
dtr-types:percentItemType |
| Balance Type: |
na |
| Period Type: |
duration |
|
| X |
- DefinitionFace (par) amount of debt instrument at time of issuance. Reference 1: http://www.xbrl.org/2003/role/disclosureRef
-Topic 835
-SubTopic 30
-Name Accounting Standards Codification
-Section 50
-Paragraph 1
-Publisher FASB
-URI https://asc.fasb.org//1943274/2147482900/835-30-50-1
Reference 2: http://www.xbrl.org/2003/role/disclosureRef
-Topic 470
-SubTopic 20
-Name Accounting Standards Codification
-Section 50
-Paragraph 1B
-Subparagraph (a)
-Publisher FASB
-URI https://asc.fasb.org//1943274/2147481139/470-20-50-1B
Reference 3: http://www.xbrl.org/2003/role/exampleRef
-Topic 470
-SubTopic 20
-Name Accounting Standards Codification
-Section 55
-Paragraph 69B
-Publisher FASB
-URI https://asc.fasb.org//1943274/2147481568/470-20-55-69B
Reference 4: http://www.xbrl.org/2003/role/exampleRef
-Topic 470
-SubTopic 20
-Name Accounting Standards Codification
-Section 55
-Paragraph 69C
-Publisher FASB
-URI https://asc.fasb.org//1943274/2147481568/470-20-55-69C
Reference 5: http://fasb.org/us-gaap/role/ref/legacyRef
-Name Accounting Standards Codification
-Topic 835
-SubTopic 30
-Section 45
-Paragraph 2
-Publisher FASB
-URI https://asc.fasb.org//1943274/2147482925/835-30-45-2
Reference 6: http://fasb.org/us-gaap/role/ref/legacyRef
-Name Accounting Standards Codification
-Topic 835
-SubTopic 30
-Section 55
-Paragraph 8
-Publisher FASB
-URI https://asc.fasb.org//1943274/2147482949/835-30-55-8
| Name: |
us-gaap_DebtInstrumentFaceAmount |
| Namespace Prefix: |
us-gaap_ |
| Data Type: |
xbrli:monetaryItemType |
| Balance Type: |
credit |
| Period Type: |
instant |
|
| X |
- DefinitionContractual interest rate for funds borrowed, under the debt agreement. Reference 1: http://www.xbrl.org/2003/role/disclosureRef
-Topic 470
-SubTopic 20
-Name Accounting Standards Codification
-Section 50
-Paragraph 1B
-Subparagraph (b)
-Publisher FASB
-URI https://asc.fasb.org//1943274/2147481139/470-20-50-1B
Reference 2: http://fasb.org/us-gaap/role/ref/legacyRef
-Name Accounting Standards Codification
-Topic 210
-SubTopic 10
-Section S99
-Paragraph 1
-Subparagraph (SX 210.5-02.22(a)(1))
-Publisher FASB
-URI https://asc.fasb.org//1943274/2147480566/210-10-S99-1
| Name: |
us-gaap_DebtInstrumentInterestRateStatedPercentage |
| Namespace Prefix: |
us-gaap_ |
| Data Type: |
dtr-types:percentItemType |
| Balance Type: |
na |
| Period Type: |
instant |
|
| X |
- DefinitionLine items represent financial concepts included in a table. These concepts are used to disclose reportable information associated with domain members defined in one or many axes to the table. Reference 1: http://www.xbrl.org/2003/role/disclosureRef
-Topic 835
-SubTopic 30
-Name Accounting Standards Codification
-Section 50
-Paragraph 1
-Publisher FASB
-URI https://asc.fasb.org//1943274/2147482900/835-30-50-1
Reference 2: http://www.xbrl.org/2009/role/commonPracticeRef
-Topic 235
-SubTopic 10
-Name Accounting Standards Codification
-Section S99
-Paragraph 1
-Subparagraph (SX 210.4-08(f))
-Publisher FASB
-URI https://asc.fasb.org//1943274/2147480678/235-10-S99-1
Reference 3: http://www.xbrl.org/2003/role/disclosureRef
-Topic 235
-SubTopic 10
-Name Accounting Standards Codification
-Section S99
-Paragraph 3
-Subparagraph (SX 210.12-04(a))
-Publisher FASB
-URI https://asc.fasb.org//1943274/2147480678/235-10-S99-3
Reference 4: http://www.xbrl.org/2003/role/disclosureRef
-Topic 470
-SubTopic 20
-Name Accounting Standards Codification
-Section 50
-Paragraph 1B
-Subparagraph (a)
-Publisher FASB
-URI https://asc.fasb.org//1943274/2147481139/470-20-50-1B
Reference 5: http://www.xbrl.org/2003/role/exampleRef
-Topic 470
-SubTopic 20
-Name Accounting Standards Codification
-Section 55
-Paragraph 69B
-Publisher FASB
-URI https://asc.fasb.org//1943274/2147481568/470-20-55-69B
Reference 6: http://www.xbrl.org/2003/role/exampleRef
-Topic 470
-SubTopic 20
-Name Accounting Standards Codification
-Section 55
-Paragraph 69C
-Publisher FASB
-URI https://asc.fasb.org//1943274/2147481568/470-20-55-69C
Reference 7: http://www.xbrl.org/2003/role/exampleRef
-Topic 470
-SubTopic 20
-Name Accounting Standards Codification
-Section 55
-Paragraph 69E
-Publisher FASB
-URI https://asc.fasb.org//1943274/2147481568/470-20-55-69E
Reference 8: http://www.xbrl.org/2003/role/exampleRef
-Topic 470
-SubTopic 20
-Name Accounting Standards Codification
-Section 55
-Paragraph 69F
-Publisher FASB
-URI https://asc.fasb.org//1943274/2147481568/470-20-55-69F
Reference 9: http://www.xbrl.org/2003/role/disclosureRef
-Topic 470
-SubTopic 20
-Name Accounting Standards Codification
-Section 50
-Paragraph 1B
-Subparagraph (b)
-Publisher FASB
-URI https://asc.fasb.org//1943274/2147481139/470-20-50-1B
Reference 10: http://www.xbrl.org/2003/role/disclosureRef
-Topic 470
-SubTopic 20
-Name Accounting Standards Codification
-Section 50
-Paragraph 1B
-Subparagraph (c)
-Publisher FASB
-URI https://asc.fasb.org//1943274/2147481139/470-20-50-1B
Reference 11: http://www.xbrl.org/2003/role/exampleRef
-Topic 470
-SubTopic 20
-Name Accounting Standards Codification
-Section 50
-Paragraph 1B
-Subparagraph (d)
-Publisher FASB
-URI https://asc.fasb.org//1943274/2147481139/470-20-50-1B
Reference 12: http://www.xbrl.org/2003/role/disclosureRef
-Topic 470
-SubTopic 20
-Name Accounting Standards Codification
-Section 50
-Paragraph 1B
-Subparagraph (e)
-Publisher FASB
-URI https://asc.fasb.org//1943274/2147481139/470-20-50-1B
Reference 13: http://www.xbrl.org/2003/role/disclosureRef
-Topic 470
-SubTopic 20
-Name Accounting Standards Codification
-Section 50
-Paragraph 1B
-Subparagraph (f)
-Publisher FASB
-URI https://asc.fasb.org//1943274/2147481139/470-20-50-1B
Reference 14: http://www.xbrl.org/2003/role/disclosureRef
-Topic 470
-SubTopic 20
-Name Accounting Standards Codification
-Section 50
-Paragraph 1B
-Subparagraph (h)
-Publisher FASB
-URI https://asc.fasb.org//1943274/2147481139/470-20-50-1B
Reference 15: http://www.xbrl.org/2003/role/disclosureRef
-Topic 470
-SubTopic 20
-Name Accounting Standards Codification
-Section 50
-Paragraph 1D
-Subparagraph (a)
-Publisher FASB
-URI https://asc.fasb.org//1943274/2147481139/470-20-50-1D
Reference 16: http://www.xbrl.org/2003/role/disclosureRef
-Topic 470
-SubTopic 20
-Name Accounting Standards Codification
-Section 50
-Paragraph 1D
-Subparagraph (b)
-Publisher FASB
-URI https://asc.fasb.org//1943274/2147481139/470-20-50-1D
Reference 17: http://www.xbrl.org/2003/role/disclosureRef
-Topic 470
-SubTopic 20
-Name Accounting Standards Codification
-Section 50
-Paragraph 1D
-Subparagraph (c)
-Publisher FASB
-URI https://asc.fasb.org//1943274/2147481139/470-20-50-1D
Reference 18: http://www.xbrl.org/2003/role/disclosureRef
-Topic 470
-SubTopic 20
-Name Accounting Standards Codification
-Section 50
-Paragraph 1E
-Subparagraph (a)
-Publisher FASB
-URI https://asc.fasb.org//1943274/2147481139/470-20-50-1E
Reference 19: http://www.xbrl.org/2003/role/disclosureRef
-Topic 470
-SubTopic 20
-Name Accounting Standards Codification
-Section 50
-Paragraph 1E
-Subparagraph (c)
-Publisher FASB
-URI https://asc.fasb.org//1943274/2147481139/470-20-50-1E
Reference 20: http://www.xbrl.org/2003/role/disclosureRef
-Topic 470
-SubTopic 20
-Name Accounting Standards Codification
-Section 50
-Paragraph 1E
-Subparagraph (d)
-Publisher FASB
-URI https://asc.fasb.org//1943274/2147481139/470-20-50-1E
Reference 21: http://www.xbrl.org/2003/role/disclosureRef
-Topic 470
-SubTopic 20
-Name Accounting Standards Codification
-Section 50
-Paragraph 1F
-Subparagraph (a)
-Publisher FASB
-URI https://asc.fasb.org//1943274/2147481139/470-20-50-1F
Reference 22: http://www.xbrl.org/2003/role/disclosureRef
-Topic 470
-SubTopic 20
-Name Accounting Standards Codification
-Section 50
-Paragraph 1F
-Subparagraph (b)
-Publisher FASB
-URI https://asc.fasb.org//1943274/2147481139/470-20-50-1F
Reference 23: http://www.xbrl.org/2003/role/disclosureRef
-Topic 470
-SubTopic 20
-Name Accounting Standards Codification
-Section 50
-Paragraph 1F
-Subparagraph (b)(1)
-Publisher FASB
-URI https://asc.fasb.org//1943274/2147481139/470-20-50-1F
Reference 24: http://www.xbrl.org/2003/role/disclosureRef
-Topic 470
-SubTopic 20
-Name Accounting Standards Codification
-Section 50
-Paragraph 1F
-Subparagraph (b)(2)
-Publisher FASB
-URI https://asc.fasb.org//1943274/2147481139/470-20-50-1F
Reference 25: http://www.xbrl.org/2003/role/disclosureRef
-Topic 470
-SubTopic 20
-Name Accounting Standards Codification
-Section 50
-Paragraph 1I
-Subparagraph (c)
-Publisher FASB
-URI https://asc.fasb.org//1943274/2147481139/470-20-50-1I
| Name: |
us-gaap_DebtInstrumentLineItems |
| Namespace Prefix: |
us-gaap_ |
| Data Type: |
xbrli:stringItemType |
| Balance Type: |
na |
| Period Type: |
duration |
|
| X |
- DefinitionPeriod of time between issuance and maturity of debt instrument, in PnYnMnDTnHnMnS' format, for example, 'P1Y5M13D' represents the reported fact of one year, five months, and thirteen days.
| Name: |
us-gaap_DebtInstrumentTerm |
| Namespace Prefix: |
us-gaap_ |
| Data Type: |
xbrli:durationItemType |
| Balance Type: |
na |
| Period Type: |
duration |
|
| X |
- DefinitionThe carrying value as of the balance sheet date of the current and noncurrent portions of long-term obligations drawn from a line of credit, which is a bank's commitment to make loans up to a specific amount. Examples of items that might be included in the application of this element may consist of letters of credit, standby letters of credit, and revolving credit arrangements, under which borrowings can be made up to a maximum amount as of any point in time conditional on satisfaction of specified terms before, as of and after the date of drawdowns on the line. Includes short-term obligations that would normally be classified as current liabilities but for which (a) postbalance sheet date issuance of a long term obligation to refinance the short term obligation on a long term basis, or (b) the enterprise has entered into a financing agreement that clearly permits the enterprise to refinance the short-term obligation on a long term basis and the following conditions are met (1) the agreement does not expire within 1 year and is not cancelable by the lender except for violation of an objectively determinable provision, (2) no violation exists at the BS date, and (3) the lender has entered into the financing agreement is expected to be financially capable of honoring the agreement. Reference 1: http://fasb.org/us-gaap/role/ref/legacyRef
-Name Accounting Standards Codification
-Section S99
-Paragraph 1
-Subparagraph (SX 210.5-02(22))
-SubTopic 10
-Topic 210
-Publisher FASB
-URI https://asc.fasb.org//1943274/2147480566/210-10-S99-1
Reference 2: http://www.xbrl.org/2009/role/commonPracticeRef
-Topic 944
-SubTopic 210
-Name Accounting Standards Codification
-Section S99
-Paragraph 1
-Subparagraph (SX 210.7-03(a)(16)(a)(2))
-Publisher FASB
-URI https://asc.fasb.org//1943274/2147479440/944-210-S99-1
Reference 3: http://fasb.org/us-gaap/role/ref/legacyRef
-Topic 942
-SubTopic 210
-Name Accounting Standards Codification
-Section S99
-Paragraph 1
-Subparagraph (SX 210.9-03(16))
-Publisher FASB
-URI https://asc.fasb.org//1943274/2147479853/942-210-S99-1
| Name: |
us-gaap_LineOfCredit |
| Namespace Prefix: |
us-gaap_ |
| Data Type: |
xbrli:monetaryItemType |
| Balance Type: |
credit |
| Period Type: |
instant |
|
| X |
- Details
| Name: |
us-gaap_CreditFacilityAxis=rezi_AmendedAndRestatedTermBFacilityMember |
| Namespace Prefix: |
|
| Data Type: |
na |
| Balance Type: |
|
| Period Type: |
|
|
| X |
- Details
| Name: |
us-gaap_DebtInstrumentAxis=rezi_AmendedAndRestatedCreditAgreementMember |
| Namespace Prefix: |
|
| Data Type: |
na |
| Balance Type: |
|
| Period Type: |
|
|
| X |
- Details
| Name: |
us-gaap_CreditFacilityAxis=rezi_AmendedAndRestatedRevolvingCreditFacilityMember |
| Namespace Prefix: |
|
| Data Type: |
na |
| Balance Type: |
|
| Period Type: |
|
|
| X |
- Details
| Name: |
us-gaap_VariableRateAxis=rezi_SecuredOvernightFinancingRateSOFRMember |
| Namespace Prefix: |
|
| Data Type: |
na |
| Balance Type: |
|
| Period Type: |
|
|
| X |
- Details
| Name: |
us-gaap_DebtInstrumentAxis=rezi_SeniorCreditFacilitiesMember |
| Namespace Prefix: |
|
| Data Type: |
na |
| Balance Type: |
|
| Period Type: |
|
|
| X |
- Details
| Name: |
us-gaap_CreditFacilityAxis=us-gaap_LetterOfCreditMember |
| Namespace Prefix: |
|
| Data Type: |
na |
| Balance Type: |
|
| Period Type: |
|
|
v3.23.3
| X |
- DefinitionNumber Of Interest Rate Swaps Modified
| Name: |
rezi_NumberOfInterestRateSwapsModified |
| Namespace Prefix: |
rezi_ |
| Data Type: |
xbrli:integerItemType |
| Balance Type: |
na |
| Period Type: |
duration |
|
| X |
- DefinitionAmount, after tax, of accumulated gain (loss) on derivative instrument designated and qualifying as cash flow hedge included in assessment of hedge effectiveness. Reference 1: http://www.xbrl.org/2003/role/disclosureRef
-Topic 220
-SubTopic 10
-Name Accounting Standards Codification
-Section 45
-Paragraph 11
-Publisher FASB
-URI https://asc.fasb.org//1943274/2147482790/220-10-45-11
| Name: |
us-gaap_AociLossCashFlowHedgeCumulativeGainLossAfterTax |
| Namespace Prefix: |
us-gaap_ |
| Data Type: |
xbrli:monetaryItemType |
| Balance Type: |
credit |
| Period Type: |
instant |
|
| X |
- DefinitionThe estimated net amount of existing gains or losses on cash flow hedges at the reporting date expected to be reclassified to earnings within the next 12 months. Reference 1: http://fasb.org/us-gaap/role/ref/legacyRef
-Name Accounting Standards Codification
-Topic 815
-SubTopic 30
-Section 50
-Paragraph 1
-Subparagraph (c)
-Publisher FASB
-URI https://asc.fasb.org//1943274/2147480870/815-30-50-1
| Name: |
us-gaap_CashFlowHedgeGainLossToBeReclassifiedWithinTwelveMonths |
| Namespace Prefix: |
us-gaap_ |
| Data Type: |
xbrli:monetaryItemType |
| Balance Type: |
credit |
| Period Type: |
duration |
|
| X |
- DefinitionAverage fixed interest rate related to the group of interest rate derivatives.
| Name: |
us-gaap_DerivativeAverageFixedInterestRate |
| Namespace Prefix: |
us-gaap_ |
| Data Type: |
dtr-types:percentItemType |
| Balance Type: |
na |
| Period Type: |
instant |
|
| X |
- DefinitionLine items represent financial concepts included in a table. These concepts are used to disclose reportable information associated with domain members defined in one or many axes to the table. Reference 1: http://www.xbrl.org/2003/role/disclosureRef
-Topic 815
-SubTopic 40
-Name Accounting Standards Codification
-Section 50
-Paragraph 5
-Subparagraph (f)
-Publisher FASB
-URI https://asc.fasb.org//1943274/2147480237/815-40-50-5
| Name: |
us-gaap_DerivativeLineItems |
| Namespace Prefix: |
us-gaap_ |
| Data Type: |
xbrli:stringItemType |
| Balance Type: |
na |
| Period Type: |
duration |
|
| X |
- DefinitionNominal or face amount used to calculate payment on derivative. Reference 1: http://www.xbrl.org/2009/role/commonPracticeRef
-Topic 815
-SubTopic 10
-Name Accounting Standards Codification
-Section 50
-Paragraph 1B
-Publisher FASB
-URI https://asc.fasb.org//1943274/2147480434/815-10-50-1B
Reference 2: http://www.xbrl.org/2009/role/commonPracticeRef
-Topic 815
-SubTopic 10
-Name Accounting Standards Codification
-Section 50
-Paragraph 1A
-Subparagraph (d)
-Publisher FASB
-URI https://asc.fasb.org//1943274/2147480434/815-10-50-1A
| Name: |
us-gaap_DerivativeNotionalAmount |
| Namespace Prefix: |
us-gaap_ |
| Data Type: |
xbrli:monetaryItemType |
| Balance Type: |
na |
| Period Type: |
instant |
|
| X |
- DefinitionNumber of interest rate derivative instruments held by the entity at the reporting date. Reference 1: http://fasb.org/us-gaap/role/ref/legacyRef
-Name Accounting Standards Codification
-Topic 815
-SubTopic 10
-Section 50
-Paragraph 1B
-Publisher FASB
-URI https://asc.fasb.org//1943274/2147480434/815-10-50-1B
Reference 2: http://fasb.org/us-gaap/role/ref/legacyRef
-Name Accounting Standards Codification
-Topic 815
-SubTopic 10
-Section 50
-Paragraph 1A
-Subparagraph (d)
-Publisher FASB
-URI https://asc.fasb.org//1943274/2147480434/815-10-50-1A
| Name: |
us-gaap_NumberOfInterestRateDerivativesHeld |
| Namespace Prefix: |
us-gaap_ |
| Data Type: |
xbrli:integerItemType |
| Balance Type: |
na |
| Period Type: |
instant |
|
| X |
- Details
| Name: |
us-gaap_DerivativeInstrumentRiskAxis=rezi_SwapAgreementsMember |
| Namespace Prefix: |
|
| Data Type: |
na |
| Balance Type: |
|
| Period Type: |
|
|
| X |
- Details
| Name: |
srt_RangeAxis=srt_MaximumMember |
| Namespace Prefix: |
|
| Data Type: |
na |
| Balance Type: |
|
| Period Type: |
|
|
v3.23.3
| X |
- DefinitionIndicates line item in statement of financial position that includes derivative asset classified as current. Reference 1: http://www.xbrl.org/2003/role/disclosureRef
-Topic 815
-SubTopic 10
-Name Accounting Standards Codification
-Section 50
-Paragraph 4A
-Subparagraph (a)
-Publisher FASB
-URI https://asc.fasb.org//1943274/2147480434/815-10-50-4A
| Name: |
us-gaap_DerivativeAssetCurrentStatementOfFinancialPositionExtensibleEnumeration |
| Namespace Prefix: |
us-gaap_ |
| Data Type: |
enum2:enumerationSetItemType |
| Balance Type: |
na |
| Period Type: |
instant |
|
| X |
- DefinitionIndicates line item in statement of financial position that includes derivative asset. Reference 1: http://www.xbrl.org/2003/role/disclosureRef
-Topic 815
-SubTopic 10
-Name Accounting Standards Codification
-Section 50
-Paragraph 4A
-Subparagraph (a)
-Publisher FASB
-URI https://asc.fasb.org//1943274/2147480434/815-10-50-4A
| Name: |
us-gaap_DerivativeAssetStatementOfFinancialPositionExtensibleEnumeration |
| Namespace Prefix: |
us-gaap_ |
| Data Type: |
enum2:enumerationSetItemType |
| Balance Type: |
na |
| Period Type: |
instant |
|
| X |
- DefinitionFair value, before effects of master netting arrangements, of a financial asset or other contract with one or more underlyings, notional amount or payment provision or both, and the contract can be net settled by means outside the contract or delivery of an asset. Includes assets elected not to be offset. Excludes assets not subject to a master netting arrangement. Reference 1: http://www.xbrl.org/2003/role/exampleRef
-Topic 210
-SubTopic 20
-Name Accounting Standards Codification
-Section 55
-Paragraph 22
-Publisher FASB
-URI https://asc.fasb.org//1943274/2147483444/210-20-55-22
Reference 2: http://www.xbrl.org/2003/role/disclosureRef
-Topic 210
-SubTopic 20
-Name Accounting Standards Codification
-Section 50
-Paragraph 3
-Subparagraph (a)
-Publisher FASB
-URI https://asc.fasb.org//1943274/2147483466/210-20-50-3
Reference 3: http://fasb.org/us-gaap/role/ref/legacyRef
-Topic 210
-SubTopic 20
-Name Accounting Standards Codification
-Section 55
-Paragraph 7
-Publisher FASB
-URI https://asc.fasb.org//1943274/2147483444/210-20-55-7
Reference 4: http://fasb.org/us-gaap/role/ref/legacyRef
-Name Accounting Standards Codification
-Topic 815
-SubTopic 10
-Section 50
-Paragraph 4B
-Subparagraph (a),(c)
-Publisher FASB
-URI https://asc.fasb.org//1943274/2147480434/815-10-50-4B
Reference 5: http://fasb.org/us-gaap/role/ref/legacyRef
-Name Accounting Standards Codification
-Section 50
-Paragraph 4D
-Subparagraph (c)(2)
-SubTopic 20
-Topic 860
-Publisher FASB
-URI https://asc.fasb.org//1943274/2147481326/860-20-50-4D
| Name: |
us-gaap_DerivativeFairValueOfDerivativeAsset |
| Namespace Prefix: |
us-gaap_ |
| Data Type: |
xbrli:monetaryItemType |
| Balance Type: |
debit |
| Period Type: |
instant |
|
| X |
- DefinitionLine items represent financial concepts included in a table. These concepts are used to disclose reportable information associated with domain members defined in one or many axes to the table. Reference 1: http://www.xbrl.org/2003/role/disclosureRef
-Topic 815
-SubTopic 40
-Name Accounting Standards Codification
-Section 50
-Paragraph 5
-Subparagraph (f)
-Publisher FASB
-URI https://asc.fasb.org//1943274/2147480237/815-40-50-5
| Name: |
us-gaap_DerivativeLineItems |
| Namespace Prefix: |
us-gaap_ |
| Data Type: |
xbrli:stringItemType |
| Balance Type: |
na |
| Period Type: |
duration |
|
| X |
- DefinitionAmount before tax and reclassification adjustments of other comprehensive income (loss). Reference 1: http://fasb.org/us-gaap/role/ref/legacyRef
-Name Accounting Standards Codification
-Topic 220
-SubTopic 10
-Section 45
-Paragraph 14A
-Publisher FASB
-URI https://asc.fasb.org//1943274/2147482790/220-10-45-14A
Reference 2: http://www.xbrl.org/2003/role/disclosureRef
-Topic 220
-SubTopic 10
-Name Accounting Standards Codification
-Section 50
-Paragraph 5
-Publisher FASB
-URI https://asc.fasb.org//1943274/2147482765/220-10-50-5
Reference 3: http://www.xbrl.org/2003/role/disclosureRef
-Topic 830
-SubTopic 30
-Name Accounting Standards Codification
-Section 50
-Paragraph 1
-Publisher FASB
-URI https://asc.fasb.org//1943274/2147481674/830-30-50-1
Reference 4: http://www.xbrl.org/2003/role/disclosureRef
-Topic 830
-SubTopic 30
-Name Accounting Standards Codification
-Section 45
-Paragraph 17
-Publisher FASB
-URI https://asc.fasb.org//1943274/2147481694/830-30-45-17
Reference 5: http://www.xbrl.org/2003/role/disclosureRef
-Topic 830
-SubTopic 30
-Name Accounting Standards Codification
-Section 45
-Paragraph 20
-Subparagraph (b)
-Publisher FASB
-URI https://asc.fasb.org//1943274/2147481694/830-30-45-20
Reference 6: http://www.xbrl.org/2003/role/disclosureRef
-Topic 944
-SubTopic 220
-Name Accounting Standards Codification
-Section S99
-Paragraph 1
-Subparagraph (SX 210.7-04(19))
-Publisher FASB
-URI https://asc.fasb.org//1943274/2147483586/944-220-S99-1
Reference 7: http://www.xbrl.org/2009/role/commonPracticeRef
-Topic 220
-SubTopic 10
-Name Accounting Standards Codification
-Section 50
-Paragraph 4
-Publisher FASB
-URI https://asc.fasb.org//1943274/2147482765/220-10-50-4
| Name: |
us-gaap_OtherComprehensiveIncomeLossBeforeReclassificationsBeforeTax |
| Namespace Prefix: |
us-gaap_ |
| Data Type: |
xbrli:monetaryItemType |
| Balance Type: |
credit |
| Period Type: |
duration |
|
| X |
- Details
| Name: |
us-gaap_StatementEquityComponentsAxis=us-gaap_AccumulatedGainLossNetCashFlowHedgeParentMember |
| Namespace Prefix: |
|
| Data Type: |
na |
| Balance Type: |
|
| Period Type: |
|
|
| X |
- Details
| Name: |
us-gaap_DerivativeInstrumentRiskAxis=us-gaap_InterestRateSwapMember |
| Namespace Prefix: |
|
| Data Type: |
na |
| Balance Type: |
|
| Period Type: |
|
|
| X |
- Details
| Name: |
us-gaap_BalanceSheetLocationAxis=us-gaap_OtherCurrentAssetsMember |
| Namespace Prefix: |
|
| Data Type: |
na |
| Balance Type: |
|
| Period Type: |
|
|
| X |
- Details
| Name: |
us-gaap_HedgingDesignationAxis=us-gaap_DesignatedAsHedgingInstrumentMember |
| Namespace Prefix: |
|
| Data Type: |
na |
| Balance Type: |
|
| Period Type: |
|
|
| X |
- Details
| Name: |
us-gaap_BalanceSheetLocationAxis=us-gaap_OtherAssetsMember |
| Namespace Prefix: |
|
| Data Type: |
na |
| Balance Type: |
|
| Period Type: |
|
|
v3.23.3
Derivative Financial Instruments - Summary of Effect of Derivative Instruments Designated As Cash Flow Hedges (Details) - USD ($)
$ in Millions |
3 Months Ended |
9 Months Ended |
Sep. 30, 2023 |
Oct. 01, 2022 |
Sep. 30, 2023 |
Oct. 01, 2022 |
| Derivatives used in Net Investment Hedge, Net of Tax |
|
|
|
|
| Beginning of period |
$ 2,677
|
$ 2,394
|
$ 2,529
|
$ 2,252
|
| End of period |
2,645
|
2,400
|
2,645
|
2,400
|
| Accumulated other comprehensive loss |
|
|
|
|
| Derivatives used in Net Investment Hedge, Net of Tax |
|
|
|
|
| Beginning of period |
40
|
30
|
42
|
6
|
| Current period (loss) gain recognized in/reclassified from other comprehensive income |
(2)
|
14
|
(4)
|
38
|
| End of period |
$ 38
|
$ 44
|
$ 38
|
$ 44
|
| X |
- DefinitionAmount before tax, after reclassification adjustments of other comprehensive income (loss). Reference 1: http://www.xbrl.org/2003/role/disclosureRef
-Topic 830
-SubTopic 30
-Name Accounting Standards Codification
-Section 50
-Paragraph 1
-Publisher FASB
-URI https://asc.fasb.org//1943274/2147481674/830-30-50-1
Reference 2: http://www.xbrl.org/2003/role/disclosureRef
-Topic 830
-SubTopic 30
-Name Accounting Standards Codification
-Section 45
-Paragraph 17
-Publisher FASB
-URI https://asc.fasb.org//1943274/2147481694/830-30-45-17
Reference 3: http://www.xbrl.org/2003/role/disclosureRef
-Topic 944
-SubTopic 220
-Name Accounting Standards Codification
-Section S99
-Paragraph 1
-Subparagraph (SX 210.7-04(19))
-Publisher FASB
-URI https://asc.fasb.org//1943274/2147483586/944-220-S99-1
Reference 4: http://www.xbrl.org/2009/role/commonPracticeRef
-Topic 220
-SubTopic 10
-Name Accounting Standards Codification
-Section 50
-Paragraph 4
-Publisher FASB
-URI https://asc.fasb.org//1943274/2147482765/220-10-50-4
Reference 5: http://www.xbrl.org/2009/role/commonPracticeRef
-Topic 220
-SubTopic 10
-Name Accounting Standards Codification
-Section 50
-Paragraph 5
-Publisher FASB
-URI https://asc.fasb.org//1943274/2147482765/220-10-50-5
Reference 6: http://www.xbrl.org/2003/role/disclosureRef
-Topic 830
-SubTopic 30
-Name Accounting Standards Codification
-Section 45
-Paragraph 20
-Publisher FASB
-URI https://asc.fasb.org//1943274/2147481694/830-30-45-20
Reference 7: http://www.xbrl.org/2003/role/disclosureRef
-Topic 220
-SubTopic 10
-Name Accounting Standards Codification
-Section S99
-Paragraph 2
-Subparagraph (SX 210.5-03(21))
-Publisher FASB
-URI https://asc.fasb.org//1943274/2147483621/220-10-S99-2
Reference 8: http://www.xbrl.org/2003/role/disclosureRef
-Topic 942
-SubTopic 220
-Name Accounting Standards Codification
-Section S99
-Paragraph 1
-Subparagraph (SX 210.9-04(23))
-Publisher FASB
-URI https://asc.fasb.org//1943274/2147483589/942-220-S99-1
| Name: |
us-gaap_OtherComprehensiveIncomeLossBeforeTax |
| Namespace Prefix: |
us-gaap_ |
| Data Type: |
xbrli:monetaryItemType |
| Balance Type: |
credit |
| Period Type: |
duration |
|
| X |
- DefinitionAmount of equity (deficit) attributable to parent. Excludes temporary equity and equity attributable to noncontrolling interest. Reference 1: http://www.xbrl.org/2003/role/exampleRef
-Topic 852
-SubTopic 10
-Name Accounting Standards Codification
-Section 55
-Paragraph 10
-Publisher FASB
-URI https://asc.fasb.org//1943274/2147481372/852-10-55-10
Reference 2: http://www.xbrl.org/2003/role/exampleRef
-Topic 946
-SubTopic 830
-Name Accounting Standards Codification
-Section 55
-Paragraph 12
-Publisher FASB
-URI https://asc.fasb.org//1943274/2147480167/946-830-55-12
Reference 3: http://www.xbrl.org/2003/role/disclosureRef
-Topic 946
-SubTopic 210
-Name Accounting Standards Codification
-Section S99
-Paragraph 1
-Subparagraph (SX 210.6-04(19))
-Publisher FASB
-URI https://asc.fasb.org//1943274/2147479617/946-210-S99-1
Reference 4: http://www.xbrl.org/2003/role/disclosureRef
-Topic 946
-SubTopic 210
-Name Accounting Standards Codification
-Section S99
-Paragraph 2
-Subparagraph (SX 210.6-05(4))
-Publisher FASB
-URI https://asc.fasb.org//1943274/2147479617/946-210-S99-2
Reference 5: http://www.xbrl.org/2009/role/commonPracticeRef
-Topic 946
-SubTopic 220
-Name Accounting Standards Codification
-Section S99
-Paragraph 3
-Subparagraph (SX 210.6-09(4)(b))
-Publisher FASB
-URI https://asc.fasb.org//1943274/2147483575/946-220-S99-3
Reference 6: http://www.xbrl.org/2003/role/disclosureRef
-Topic 946
-SubTopic 220
-Name Accounting Standards Codification
-Section S99
-Paragraph 3
-Subparagraph (SX 210.6-09(6))
-Publisher FASB
-URI https://asc.fasb.org//1943274/2147483575/946-220-S99-3
Reference 7: http://www.xbrl.org/2003/role/disclosureRef
-Topic 946
-SubTopic 220
-Name Accounting Standards Codification
-Section S99
-Paragraph 3
-Subparagraph (SX 210.6-09(7))
-Publisher FASB
-URI https://asc.fasb.org//1943274/2147483575/946-220-S99-3
Reference 8: http://www.xbrl.org/2009/role/commonPracticeRef
-Topic 235
-SubTopic 10
-Name Accounting Standards Codification
-Section S99
-Paragraph 1
-Subparagraph (SX 210.4-08(g)(1)(ii))
-Publisher FASB
-URI https://asc.fasb.org//1943274/2147480678/235-10-S99-1
Reference 9: http://www.xbrl.org/2009/role/commonPracticeRef
-Topic 323
-SubTopic 10
-Name Accounting Standards Codification
-Section 50
-Paragraph 3
-Subparagraph (c)
-Publisher FASB
-URI https://asc.fasb.org//1943274/2147481687/323-10-50-3
Reference 10: http://www.xbrl.org/2009/role/commonPracticeRef
-Topic 825
-SubTopic 10
-Name Accounting Standards Codification
-Section 50
-Paragraph 28
-Subparagraph (f)
-Publisher FASB
-URI https://asc.fasb.org//1943274/2147482907/825-10-50-28
Reference 11: http://fasb.org/us-gaap/role/ref/legacyRef
-Topic 210
-SubTopic 10
-Name Accounting Standards Codification
-Section S99
-Paragraph 1
-Subparagraph (SX 210.5-02(29))
-Publisher FASB
-URI https://asc.fasb.org//1943274/2147480566/210-10-S99-1
Reference 12: http://fasb.org/us-gaap/role/ref/legacyRef
-Topic 210
-SubTopic 10
-Name Accounting Standards Codification
-Section S99
-Paragraph 1
-Subparagraph (SX 210.5-02(31))
-Publisher FASB
-URI https://asc.fasb.org//1943274/2147480566/210-10-S99-1
Reference 13: http://fasb.org/us-gaap/role/ref/legacyRef
-Topic 210
-SubTopic 10
-Name Accounting Standards Codification
-Section S99
-Paragraph 1
-Subparagraph (SX 210.5-02(30))
-Publisher FASB
-URI https://asc.fasb.org//1943274/2147480566/210-10-S99-1
Reference 14: http://fasb.org/us-gaap/role/ref/legacyRef
-Topic 310
-SubTopic 10
-Name Accounting Standards Codification
-Section S99
-Paragraph 2
-Subparagraph (SAB Topic 4.E)
-Publisher FASB
-URI https://asc.fasb.org//1943274/2147480418/310-10-S99-2
| Name: |
us-gaap_StockholdersEquity |
| Namespace Prefix: |
us-gaap_ |
| Data Type: |
xbrli:monetaryItemType |
| Balance Type: |
credit |
| Period Type: |
instant |
|
| X |
- DefinitionA roll forward is a reconciliation of a concept from the beginning of a period to the end of a period.
| Name: |
us-gaap_TranslationAdjustmentForNetInvestmentHedgeRollForward |
| Namespace Prefix: |
us-gaap_ |
| Data Type: |
xbrli:stringItemType |
| Balance Type: |
na |
| Period Type: |
duration |
|
| X |
- Details
| Name: |
us-gaap_StatementEquityComponentsAxis=us-gaap_AccumulatedGainLossNetCashFlowHedgeParentMember |
| Namespace Prefix: |
|
| Data Type: |
na |
| Balance Type: |
|
| Period Type: |
|
|
v3.23.3
Fair Value - Schedule of Carrying Values and Estimated Fair Value of Debt Instruments (Details) - USD ($)
$ in Millions |
Sep. 30, 2023 |
Dec. 31, 2022 |
| Debt Instrument |
|
|
| Debt, carrying value |
$ 1,423
|
$ 1,431
|
| Debt, fair value |
$ 1,373
|
1,367
|
| 4.000% senior notes due 2029 |
|
|
| Debt Instrument |
|
|
| Interest rate (as a percent) |
4.00%
|
|
| Debt, carrying value |
$ 300
|
300
|
| Debt, fair value |
246
|
242
|
| Variable rate A&R Term B Facility |
|
|
| Debt Instrument |
|
|
| Debt, carrying value |
1,123
|
1,131
|
| Debt, fair value |
$ 1,127
|
$ 1,125
|
| X |
- DefinitionContractual interest rate for funds borrowed, under the debt agreement. Reference 1: http://www.xbrl.org/2003/role/disclosureRef
-Topic 470
-SubTopic 20
-Name Accounting Standards Codification
-Section 50
-Paragraph 1B
-Subparagraph (b)
-Publisher FASB
-URI https://asc.fasb.org//1943274/2147481139/470-20-50-1B
Reference 2: http://fasb.org/us-gaap/role/ref/legacyRef
-Name Accounting Standards Codification
-Topic 210
-SubTopic 10
-Section S99
-Paragraph 1
-Subparagraph (SX 210.5-02.22(a)(1))
-Publisher FASB
-URI https://asc.fasb.org//1943274/2147480566/210-10-S99-1
| Name: |
us-gaap_DebtInstrumentInterestRateStatedPercentage |
| Namespace Prefix: |
us-gaap_ |
| Data Type: |
dtr-types:percentItemType |
| Balance Type: |
na |
| Period Type: |
instant |
|
| X |
- DefinitionLine items represent financial concepts included in a table. These concepts are used to disclose reportable information associated with domain members defined in one or many axes to the table. Reference 1: http://www.xbrl.org/2003/role/disclosureRef
-Topic 835
-SubTopic 30
-Name Accounting Standards Codification
-Section 50
-Paragraph 1
-Publisher FASB
-URI https://asc.fasb.org//1943274/2147482900/835-30-50-1
Reference 2: http://www.xbrl.org/2009/role/commonPracticeRef
-Topic 235
-SubTopic 10
-Name Accounting Standards Codification
-Section S99
-Paragraph 1
-Subparagraph (SX 210.4-08(f))
-Publisher FASB
-URI https://asc.fasb.org//1943274/2147480678/235-10-S99-1
Reference 3: http://www.xbrl.org/2003/role/disclosureRef
-Topic 235
-SubTopic 10
-Name Accounting Standards Codification
-Section S99
-Paragraph 3
-Subparagraph (SX 210.12-04(a))
-Publisher FASB
-URI https://asc.fasb.org//1943274/2147480678/235-10-S99-3
Reference 4: http://www.xbrl.org/2003/role/disclosureRef
-Topic 470
-SubTopic 20
-Name Accounting Standards Codification
-Section 50
-Paragraph 1B
-Subparagraph (a)
-Publisher FASB
-URI https://asc.fasb.org//1943274/2147481139/470-20-50-1B
Reference 5: http://www.xbrl.org/2003/role/exampleRef
-Topic 470
-SubTopic 20
-Name Accounting Standards Codification
-Section 55
-Paragraph 69B
-Publisher FASB
-URI https://asc.fasb.org//1943274/2147481568/470-20-55-69B
Reference 6: http://www.xbrl.org/2003/role/exampleRef
-Topic 470
-SubTopic 20
-Name Accounting Standards Codification
-Section 55
-Paragraph 69C
-Publisher FASB
-URI https://asc.fasb.org//1943274/2147481568/470-20-55-69C
Reference 7: http://www.xbrl.org/2003/role/exampleRef
-Topic 470
-SubTopic 20
-Name Accounting Standards Codification
-Section 55
-Paragraph 69E
-Publisher FASB
-URI https://asc.fasb.org//1943274/2147481568/470-20-55-69E
Reference 8: http://www.xbrl.org/2003/role/exampleRef
-Topic 470
-SubTopic 20
-Name Accounting Standards Codification
-Section 55
-Paragraph 69F
-Publisher FASB
-URI https://asc.fasb.org//1943274/2147481568/470-20-55-69F
Reference 9: http://www.xbrl.org/2003/role/disclosureRef
-Topic 470
-SubTopic 20
-Name Accounting Standards Codification
-Section 50
-Paragraph 1B
-Subparagraph (b)
-Publisher FASB
-URI https://asc.fasb.org//1943274/2147481139/470-20-50-1B
Reference 10: http://www.xbrl.org/2003/role/disclosureRef
-Topic 470
-SubTopic 20
-Name Accounting Standards Codification
-Section 50
-Paragraph 1B
-Subparagraph (c)
-Publisher FASB
-URI https://asc.fasb.org//1943274/2147481139/470-20-50-1B
Reference 11: http://www.xbrl.org/2003/role/exampleRef
-Topic 470
-SubTopic 20
-Name Accounting Standards Codification
-Section 50
-Paragraph 1B
-Subparagraph (d)
-Publisher FASB
-URI https://asc.fasb.org//1943274/2147481139/470-20-50-1B
Reference 12: http://www.xbrl.org/2003/role/disclosureRef
-Topic 470
-SubTopic 20
-Name Accounting Standards Codification
-Section 50
-Paragraph 1B
-Subparagraph (e)
-Publisher FASB
-URI https://asc.fasb.org//1943274/2147481139/470-20-50-1B
Reference 13: http://www.xbrl.org/2003/role/disclosureRef
-Topic 470
-SubTopic 20
-Name Accounting Standards Codification
-Section 50
-Paragraph 1B
-Subparagraph (f)
-Publisher FASB
-URI https://asc.fasb.org//1943274/2147481139/470-20-50-1B
Reference 14: http://www.xbrl.org/2003/role/disclosureRef
-Topic 470
-SubTopic 20
-Name Accounting Standards Codification
-Section 50
-Paragraph 1B
-Subparagraph (h)
-Publisher FASB
-URI https://asc.fasb.org//1943274/2147481139/470-20-50-1B
Reference 15: http://www.xbrl.org/2003/role/disclosureRef
-Topic 470
-SubTopic 20
-Name Accounting Standards Codification
-Section 50
-Paragraph 1D
-Subparagraph (a)
-Publisher FASB
-URI https://asc.fasb.org//1943274/2147481139/470-20-50-1D
Reference 16: http://www.xbrl.org/2003/role/disclosureRef
-Topic 470
-SubTopic 20
-Name Accounting Standards Codification
-Section 50
-Paragraph 1D
-Subparagraph (b)
-Publisher FASB
-URI https://asc.fasb.org//1943274/2147481139/470-20-50-1D
Reference 17: http://www.xbrl.org/2003/role/disclosureRef
-Topic 470
-SubTopic 20
-Name Accounting Standards Codification
-Section 50
-Paragraph 1D
-Subparagraph (c)
-Publisher FASB
-URI https://asc.fasb.org//1943274/2147481139/470-20-50-1D
Reference 18: http://www.xbrl.org/2003/role/disclosureRef
-Topic 470
-SubTopic 20
-Name Accounting Standards Codification
-Section 50
-Paragraph 1E
-Subparagraph (a)
-Publisher FASB
-URI https://asc.fasb.org//1943274/2147481139/470-20-50-1E
Reference 19: http://www.xbrl.org/2003/role/disclosureRef
-Topic 470
-SubTopic 20
-Name Accounting Standards Codification
-Section 50
-Paragraph 1E
-Subparagraph (c)
-Publisher FASB
-URI https://asc.fasb.org//1943274/2147481139/470-20-50-1E
Reference 20: http://www.xbrl.org/2003/role/disclosureRef
-Topic 470
-SubTopic 20
-Name Accounting Standards Codification
-Section 50
-Paragraph 1E
-Subparagraph (d)
-Publisher FASB
-URI https://asc.fasb.org//1943274/2147481139/470-20-50-1E
Reference 21: http://www.xbrl.org/2003/role/disclosureRef
-Topic 470
-SubTopic 20
-Name Accounting Standards Codification
-Section 50
-Paragraph 1F
-Subparagraph (a)
-Publisher FASB
-URI https://asc.fasb.org//1943274/2147481139/470-20-50-1F
Reference 22: http://www.xbrl.org/2003/role/disclosureRef
-Topic 470
-SubTopic 20
-Name Accounting Standards Codification
-Section 50
-Paragraph 1F
-Subparagraph (b)
-Publisher FASB
-URI https://asc.fasb.org//1943274/2147481139/470-20-50-1F
Reference 23: http://www.xbrl.org/2003/role/disclosureRef
-Topic 470
-SubTopic 20
-Name Accounting Standards Codification
-Section 50
-Paragraph 1F
-Subparagraph (b)(1)
-Publisher FASB
-URI https://asc.fasb.org//1943274/2147481139/470-20-50-1F
Reference 24: http://www.xbrl.org/2003/role/disclosureRef
-Topic 470
-SubTopic 20
-Name Accounting Standards Codification
-Section 50
-Paragraph 1F
-Subparagraph (b)(2)
-Publisher FASB
-URI https://asc.fasb.org//1943274/2147481139/470-20-50-1F
Reference 25: http://www.xbrl.org/2003/role/disclosureRef
-Topic 470
-SubTopic 20
-Name Accounting Standards Codification
-Section 50
-Paragraph 1I
-Subparagraph (c)
-Publisher FASB
-URI https://asc.fasb.org//1943274/2147481139/470-20-50-1I
| Name: |
us-gaap_DebtInstrumentLineItems |
| Namespace Prefix: |
us-gaap_ |
| Data Type: |
xbrli:stringItemType |
| Balance Type: |
na |
| Period Type: |
duration |
|
| X |
- DefinitionAmount, after deduction of unamortized premium (discount) and debt issuance cost, of long-term debt. Excludes lease obligation. Reference 1: http://fasb.org/us-gaap/role/ref/legacyRef
-Name Accounting Standards Codification
-Section S99
-Paragraph 1
-Subparagraph (SX 210.5-02(22))
-SubTopic 10
-Topic 210
-Publisher FASB
-URI https://asc.fasb.org//1943274/2147480566/210-10-S99-1
Reference 2: http://www.xbrl.org/2003/role/exampleRef
-Topic 470
-SubTopic 20
-Name Accounting Standards Codification
-Section 55
-Paragraph 69B
-Publisher FASB
-URI https://asc.fasb.org//1943274/2147481568/470-20-55-69B
Reference 3: http://www.xbrl.org/2003/role/exampleRef
-Topic 470
-SubTopic 20
-Name Accounting Standards Codification
-Section 55
-Paragraph 69C
-Publisher FASB
-URI https://asc.fasb.org//1943274/2147481568/470-20-55-69C
Reference 4: http://www.xbrl.org/2003/role/disclosureRef
-Topic 470
-SubTopic 20
-Name Accounting Standards Codification
-Section 50
-Paragraph 1D
-Subparagraph (b)
-Publisher FASB
-URI https://asc.fasb.org//1943274/2147481139/470-20-50-1D
Reference 5: http://www.xbrl.org/2009/role/commonPracticeRef
-Topic 944
-SubTopic 210
-Name Accounting Standards Codification
-Section S99
-Paragraph 1
-Subparagraph (SX 210.7-03(a)(16)(a)(2))
-Publisher FASB
-URI https://asc.fasb.org//1943274/2147479440/944-210-S99-1
Reference 6: http://fasb.org/us-gaap/role/ref/legacyRef
-Topic 942
-SubTopic 210
-Name Accounting Standards Codification
-Section S99
-Paragraph 1
-Subparagraph (SX 210.9-03(16))
-Publisher FASB
-URI https://asc.fasb.org//1943274/2147479853/942-210-S99-1
Reference 7: http://www.xbrl.org/2003/role/disclosureRef
-Topic 470
-SubTopic 20
-Name Accounting Standards Codification
-Section 50
-Paragraph 4
-Subparagraph (b)(3)
-Publisher FASB
-URI https://asc.fasb.org//1943274/2147481139/470-20-50-4
| Name: |
us-gaap_LongTermDebt |
| Namespace Prefix: |
us-gaap_ |
| Data Type: |
xbrli:monetaryItemType |
| Balance Type: |
credit |
| Period Type: |
instant |
|
| X |
- DefinitionThe fair value amount of long-term debt whether such amount is presented as a separate caption or as a parenthetical disclosure. Additionally, this element may be used in connection with the fair value disclosures required in the footnote disclosures to the financial statements. The element may be used in both the balance sheet and disclosure in the same submission.
| Name: |
us-gaap_LongTermDebtFairValue |
| Namespace Prefix: |
us-gaap_ |
| Data Type: |
xbrli:monetaryItemType |
| Balance Type: |
credit |
| Period Type: |
instant |
|
| X |
- Details
| Name: |
us-gaap_DebtInstrumentAxis=rezi_A4OfSeniorUnsecuredNotesDue2029Member |
| Namespace Prefix: |
|
| Data Type: |
na |
| Balance Type: |
|
| Period Type: |
|
|
| X |
- Details
| Name: |
us-gaap_DebtInstrumentAxis=rezi_AAndRTermBFacilityMember |
| Namespace Prefix: |
|
| Data Type: |
na |
| Balance Type: |
|
| Period Type: |
|
|
v3.23.3
Fair Value - Summary of the Carrying Amount and Fair Value of Interest Rate Swap (Details) - USD ($)
$ in Millions |
Sep. 30, 2023 |
Dec. 31, 2022 |
| Fair Value, Measured on Recurring Basis, Gain (Loss) Included in Earnings |
|
|
| Fair value, assets, interest rate swaps |
$ 41
|
$ 45
|
| Level 2 | Fair Value, Recurring |
|
|
| Fair Value, Measured on Recurring Basis, Gain (Loss) Included in Earnings |
|
|
| Carrying value, assets, interest rate swaps |
41
|
45
|
| Fair value, assets, interest rate swaps |
$ 41
|
$ 45
|
| X |
- DefinitionFair value, after the effects of master netting arrangements, of a financial asset or other contract with one or more underlyings, notional amount or payment provision or both, and the contract can be net settled by means outside the contract or delivery of an asset. Includes assets not subject to a master netting arrangement and not elected to be offset. Reference 1: http://www.xbrl.org/2003/role/disclosureRef
-Topic 946
-SubTopic 210
-Name Accounting Standards Codification
-Section 50
-Paragraph 12
-Publisher FASB
-URI https://asc.fasb.org//1943274/2147480524/946-210-50-12
Reference 2: http://www.xbrl.org/2003/role/disclosureRef
-Topic 946
-SubTopic 210
-Name Accounting Standards Codification
-Section 50
-Paragraph 6
-Subparagraph (e)
-Publisher FASB
-URI https://asc.fasb.org//1943274/2147480524/946-210-50-6
Reference 3: http://www.xbrl.org/2003/role/exampleRef
-Topic 946
-SubTopic 210
-Name Accounting Standards Codification
-Section 55
-Paragraph 1
-Publisher FASB
-URI https://asc.fasb.org//1943274/2147480493/946-210-55-1
Reference 4: http://www.xbrl.org/2003/role/disclosureRef
-Topic 946
-SubTopic 210
-Name Accounting Standards Codification
-Section 50
-Paragraph 6
-Subparagraph (a)(1)
-Publisher FASB
-URI https://asc.fasb.org//1943274/2147480524/946-210-50-6
Reference 5: http://www.xbrl.org/2003/role/disclosureRef
-Topic 946
-SubTopic 210
-Name Accounting Standards Codification
-Section 50
-Paragraph 6
-Subparagraph (a)(2)
-Publisher FASB
-URI https://asc.fasb.org//1943274/2147480524/946-210-50-6
Reference 6: http://www.xbrl.org/2003/role/disclosureRef
-Topic 946
-SubTopic 210
-Name Accounting Standards Codification
-Section 50
-Paragraph 6
-Subparagraph (a)(4)
-Publisher FASB
-URI https://asc.fasb.org//1943274/2147480524/946-210-50-6
Reference 7: http://www.xbrl.org/2003/role/disclosureRef
-Topic 946
-SubTopic 210
-Name Accounting Standards Codification
-Section 50
-Paragraph 1
-Subparagraph (a)(1)
-Publisher FASB
-URI https://asc.fasb.org//1943274/2147480524/946-210-50-1
Reference 8: http://www.xbrl.org/2003/role/disclosureRef
-Topic 946
-SubTopic 210
-Name Accounting Standards Codification
-Section 50
-Paragraph 1
-Subparagraph (b)(1)
-Publisher FASB
-URI https://asc.fasb.org//1943274/2147480524/946-210-50-1
Reference 9: http://www.xbrl.org/2003/role/disclosureRef
-Topic 946
-SubTopic 210
-Name Accounting Standards Codification
-Section 50
-Paragraph 1
-Subparagraph (b)(2)
-Publisher FASB
-URI https://asc.fasb.org//1943274/2147480524/946-210-50-1
Reference 10: http://www.xbrl.org/2003/role/disclosureRef
-Topic 946
-SubTopic 210
-Name Accounting Standards Codification
-Section 50
-Paragraph 1
-Subparagraph (c)(2)
-Publisher FASB
-URI https://asc.fasb.org//1943274/2147480524/946-210-50-1
Reference 11: http://www.xbrl.org/2003/role/disclosureRef
-Topic 946
-SubTopic 210
-Name Accounting Standards Codification
-Section 50
-Paragraph 6
-Subparagraph (f)
-Publisher FASB
-URI https://asc.fasb.org//1943274/2147480524/946-210-50-6
Reference 12: http://www.xbrl.org/2009/role/commonPracticeRef
-Topic 946
-SubTopic 210
-Name Accounting Standards Codification
-Section 50
-Paragraph 6
-Subparagraph (a)(3)
-Publisher FASB
-URI https://asc.fasb.org//1943274/2147480524/946-210-50-6
Reference 13: http://www.xbrl.org/2003/role/disclosureRef
-Topic 946
-SubTopic 210
-Name Accounting Standards Codification
-Section S99
-Paragraph 1
-Subparagraph (SX 210.6-04(3)(c))
-Publisher FASB
-URI https://asc.fasb.org//1943274/2147479617/946-210-S99-1
Reference 14: http://www.xbrl.org/2003/role/disclosureRef
-Topic 946
-SubTopic 320
-Name Accounting Standards Codification
-Section S99
-Paragraph 5C
-Subparagraph (SX 210.12-13C(Column H)(Footnote 7))
-Publisher FASB
-URI https://asc.fasb.org//1943274/2147480032/946-320-S99-5C
Reference 15: http://www.xbrl.org/2003/role/disclosureRef
-Topic 946
-SubTopic 210
-Name Accounting Standards Codification
-Section S99
-Paragraph 1
-Subparagraph (SX 210.6-04(3)(b))
-Publisher FASB
-URI https://asc.fasb.org//1943274/2147479617/946-210-S99-1
Reference 16: http://www.xbrl.org/2003/role/disclosureRef
-Topic 946
-SubTopic 320
-Name Accounting Standards Codification
-Section S99
-Paragraph 5
-Subparagraph (SX 210.12-13(Column A)(Footnote 3))
-Publisher FASB
-URI https://asc.fasb.org//1943274/2147480032/946-320-S99-5
Reference 17: http://www.xbrl.org/2003/role/disclosureRef
-Topic 946
-SubTopic 320
-Name Accounting Standards Codification
-Section S99
-Paragraph 5C
-Subparagraph (SX 210.12-13C(Column H))
-Publisher FASB
-URI https://asc.fasb.org//1943274/2147480032/946-320-S99-5C
Reference 18: http://www.xbrl.org/2003/role/disclosureRef
-Topic 946
-SubTopic 320
-Name Accounting Standards Codification
-Section S99
-Paragraph 5A
-Subparagraph (SX 210.12-13A(Column E))
-Publisher FASB
-URI https://asc.fasb.org//1943274/2147480032/946-320-S99-5A
Reference 19: http://www.xbrl.org/2003/role/disclosureRef
-Topic 946
-SubTopic 320
-Name Accounting Standards Codification
-Section S99
-Paragraph 5B
-Subparagraph (SX 210.12-13B(Column E))
-Publisher FASB
-URI https://asc.fasb.org//1943274/2147480032/946-320-S99-5B
Reference 20: http://www.xbrl.org/2003/role/disclosureRef
-Topic 946
-SubTopic 320
-Name Accounting Standards Codification
-Section S99
-Paragraph 5B
-Subparagraph (SX 210.12-13B(Column E)(Footnote 4))
-Publisher FASB
-URI https://asc.fasb.org//1943274/2147480032/946-320-S99-5B
Reference 21: http://www.xbrl.org/2003/role/disclosureRef
-Topic 210
-SubTopic 20
-Name Accounting Standards Codification
-Section 50
-Paragraph 3
-Subparagraph (c)
-Publisher FASB
-URI https://asc.fasb.org//1943274/2147483466/210-20-50-3
Reference 22: http://www.xbrl.org/2003/role/exampleRef
-Topic 210
-SubTopic 20
-Name Accounting Standards Codification
-Section 55
-Paragraph 22
-Publisher FASB
-URI https://asc.fasb.org//1943274/2147483444/210-20-55-22
Reference 23: http://www.xbrl.org/2003/role/disclosureRef
-Topic 210
-SubTopic 20
-Name Accounting Standards Codification
-Section 55
-Paragraph 10
-Publisher FASB
-URI https://asc.fasb.org//1943274/2147483444/210-20-55-10
Reference 24: http://www.xbrl.org/2003/role/disclosureRef
-Topic 825
-SubTopic 10
-Name Accounting Standards Codification
-Section 50
-Paragraph 10
-Publisher FASB
-URI https://asc.fasb.org//1943274/2147482907/825-10-50-10
| Name: |
us-gaap_DerivativeAssets |
| Namespace Prefix: |
us-gaap_ |
| Data Type: |
xbrli:monetaryItemType |
| Balance Type: |
debit |
| Period Type: |
instant |
|
| X |
- DefinitionFair value, before effects of master netting arrangements, of a financial asset or other contract with one or more underlyings, notional amount or payment provision or both, and the contract can be net settled by means outside the contract or delivery of an asset. Includes assets elected not to be offset. Excludes assets not subject to a master netting arrangement. Reference 1: http://www.xbrl.org/2003/role/exampleRef
-Topic 210
-SubTopic 20
-Name Accounting Standards Codification
-Section 55
-Paragraph 22
-Publisher FASB
-URI https://asc.fasb.org//1943274/2147483444/210-20-55-22
Reference 2: http://www.xbrl.org/2003/role/disclosureRef
-Topic 210
-SubTopic 20
-Name Accounting Standards Codification
-Section 50
-Paragraph 3
-Subparagraph (a)
-Publisher FASB
-URI https://asc.fasb.org//1943274/2147483466/210-20-50-3
Reference 3: http://fasb.org/us-gaap/role/ref/legacyRef
-Topic 210
-SubTopic 20
-Name Accounting Standards Codification
-Section 55
-Paragraph 7
-Publisher FASB
-URI https://asc.fasb.org//1943274/2147483444/210-20-55-7
Reference 4: http://fasb.org/us-gaap/role/ref/legacyRef
-Name Accounting Standards Codification
-Topic 815
-SubTopic 10
-Section 50
-Paragraph 4B
-Subparagraph (a),(c)
-Publisher FASB
-URI https://asc.fasb.org//1943274/2147480434/815-10-50-4B
Reference 5: http://fasb.org/us-gaap/role/ref/legacyRef
-Name Accounting Standards Codification
-Section 50
-Paragraph 4D
-Subparagraph (c)(2)
-SubTopic 20
-Topic 860
-Publisher FASB
-URI https://asc.fasb.org//1943274/2147481326/860-20-50-4D
| Name: |
us-gaap_DerivativeFairValueOfDerivativeAsset |
| Namespace Prefix: |
us-gaap_ |
| Data Type: |
xbrli:monetaryItemType |
| Balance Type: |
debit |
| Period Type: |
instant |
|
| X |
- DefinitionLine items represent financial concepts included in a table. These concepts are used to disclose reportable information associated with domain members defined in one or many axes to the table.
| Name: |
us-gaap_FairValueMeasuredOnRecurringBasisGainLossIncludedInEarningsAbstract |
| Namespace Prefix: |
us-gaap_ |
| Data Type: |
xbrli:stringItemType |
| Balance Type: |
na |
| Period Type: |
duration |
|
| X |
- Details
| Name: |
us-gaap_FairValueByMeasurementFrequencyAxis=us-gaap_FairValueMeasurementsRecurringMember |
| Namespace Prefix: |
|
| Data Type: |
na |
| Balance Type: |
|
| Period Type: |
|
|
v3.23.3
| X |
- DefinitionAccrued Liabilities, Held-for-sale
| Name: |
rezi_AccruedLiabilitiesHeldForSale |
| Namespace Prefix: |
rezi_ |
| Data Type: |
xbrli:monetaryItemType |
| Balance Type: |
credit |
| Period Type: |
instant |
|
| X |
- DefinitionObligations payable under Indemnification Agreements current.
| Name: |
rezi_ObligationsPayableUnderIndemnificationAgreementsCurrent |
| Namespace Prefix: |
rezi_ |
| Data Type: |
xbrli:monetaryItemType |
| Balance Type: |
credit |
| Period Type: |
instant |
|
| X |
- DefinitionCarrying value as of the balance sheet date of obligations incurred and payable, pertaining to costs that are statutory in nature, are incurred on contractual obligations, or accumulate over time and for which invoices have not yet been received or will not be rendered. Examples include taxes, interest, rent and utilities. Used to reflect the current portion of the liabilities (due within one year or within the normal operating cycle if longer). Reference 1: http://fasb.org/us-gaap/role/ref/legacyRef
-Name Accounting Standards Codification
-Topic 210
-SubTopic 10
-Section S99
-Paragraph 1
-Subparagraph (SX 210.5-02.20)
-Publisher FASB
-URI https://asc.fasb.org//1943274/2147480566/210-10-S99-1
| Name: |
us-gaap_AccruedLiabilitiesCurrent |
| Namespace Prefix: |
us-gaap_ |
| Data Type: |
xbrli:monetaryItemType |
| Balance Type: |
credit |
| Period Type: |
instant |
|
| X |
- References
+ Details
| Name: |
us-gaap_AccruedLiabilitiesCurrentAbstract |
| Namespace Prefix: |
us-gaap_ |
| Data Type: |
xbrli:stringItemType |
| Balance Type: |
na |
| Period Type: |
duration |
|
| X |
- DefinitionAmount of obligation to transfer good or service to customer for which consideration has been received or is receivable, classified as current. Reference 1: http://www.xbrl.org/2003/role/disclosureRef
-Topic 606
-SubTopic 10
-Name Accounting Standards Codification
-Section 45
-Paragraph 1
-Publisher FASB
-URI https://asc.fasb.org//1943274/2147479837/606-10-45-1
Reference 2: http://www.xbrl.org/2003/role/disclosureRef
-Topic 606
-SubTopic 10
-Name Accounting Standards Codification
-Section 50
-Paragraph 8
-Subparagraph (a)
-Publisher FASB
-URI https://asc.fasb.org//1943274/2147479806/606-10-50-8
Reference 3: http://www.xbrl.org/2003/role/disclosureRef
-Topic 606
-SubTopic 10
-Name Accounting Standards Codification
-Section 45
-Paragraph 2
-Publisher FASB
-URI https://asc.fasb.org//1943274/2147479837/606-10-45-2
| Name: |
us-gaap_ContractWithCustomerLiabilityCurrent |
| Namespace Prefix: |
us-gaap_ |
| Data Type: |
xbrli:monetaryItemType |
| Balance Type: |
credit |
| Period Type: |
instant |
|
| X |
- DefinitionCurrent regulatory liabilities generally represent obligations to make refunds to customers for various reasons including overpayment.
| Name: |
us-gaap_CustomerRefundLiabilityCurrent |
| Namespace Prefix: |
us-gaap_ |
| Data Type: |
xbrli:monetaryItemType |
| Balance Type: |
credit |
| Period Type: |
instant |
|
| X |
- DefinitionPresent value of lessee's discounted obligation for lease payments from operating lease, classified as current. Reference 1: http://www.xbrl.org/2003/role/disclosureRef
-Topic 842
-SubTopic 20
-Name Accounting Standards Codification
-Section 45
-Paragraph 1
-Subparagraph (b)
-Publisher FASB
-URI https://asc.fasb.org//1943274/2147479041/842-20-45-1
| Name: |
us-gaap_OperatingLeaseLiabilityCurrent |
| Namespace Prefix: |
us-gaap_ |
| Data Type: |
xbrli:monetaryItemType |
| Balance Type: |
credit |
| Period Type: |
instant |
|
| X |
- DefinitionAmount of expenses incurred but not yet paid classified as other, due within one year or the normal operating cycle, if longer. Reference 1: http://fasb.org/us-gaap/role/ref/legacyRef
-Name Accounting Standards Codification
-Topic 210
-SubTopic 10
-Section S99
-Paragraph 1
-Subparagraph (SX 210.5-02.20)
-Publisher FASB
-URI https://asc.fasb.org//1943274/2147480566/210-10-S99-1
| Name: |
us-gaap_OtherAccruedLiabilitiesCurrent |
| Namespace Prefix: |
us-gaap_ |
| Data Type: |
xbrli:monetaryItemType |
| Balance Type: |
credit |
| Period Type: |
instant |
|
| X |
- DefinitionCarrying amount (including both current and noncurrent portions of the accrual) as of the balance sheet date pertaining to a specified type of cost associated with exit from or disposal of business activities or restructuring pursuant to a duly authorized plan. Reference 1: http://www.xbrl.org/2003/role/disclosureRef
-Topic 420
-SubTopic 10
-Name Accounting Standards Codification
-Section 50
-Paragraph 1
-Subparagraph (b)(2)
-Publisher FASB
-URI https://asc.fasb.org//1943274/2147482017/420-10-50-1
Reference 2: http://www.xbrl.org/2003/role/disclosureRef
-Topic 420
-SubTopic 10
-Name Accounting Standards Codification
-Section S99
-Paragraph 2
-Subparagraph (SAB TOPIC 5.P.4(b)(2))
-Publisher FASB
-URI https://asc.fasb.org//1943274/2147479823/420-10-S99-2
| Name: |
us-gaap_RestructuringReserve |
| Namespace Prefix: |
us-gaap_ |
| Data Type: |
xbrli:monetaryItemType |
| Balance Type: |
credit |
| Period Type: |
instant |
|
| X |
- DefinitionCarrying value as of the balance sheet date of obligations incurred and payable for statutory income, sales, use, payroll, excise, real, property and other taxes. Used to reflect the current portion of the liabilities (due within one year or within the normal operating cycle if longer). Reference 1: http://fasb.org/us-gaap/role/ref/legacyRef
-Name Accounting Standards Codification
-Topic 210
-SubTopic 10
-Section S99
-Paragraph 1
-Subparagraph (SX 210.5-02.19,20)
-Publisher FASB
-URI https://asc.fasb.org//1943274/2147480566/210-10-S99-1
| Name: |
us-gaap_TaxesPayableCurrent |
| Namespace Prefix: |
us-gaap_ |
| Data Type: |
xbrli:monetaryItemType |
| Balance Type: |
credit |
| Period Type: |
instant |
|
v3.23.3
| X |
- DefinitionIndemnification payable percentage of net insurance receipts.
| Name: |
rezi_IndemnificationPayablePercentageOfNetInsuranceReceipts |
| Namespace Prefix: |
rezi_ |
| Data Type: |
dtr-types1:percentItemType |
| Balance Type: |
na |
| Period Type: |
duration |
|
| X |
- DefinitionIndemnification payable percentage of net proceeds received.
| Name: |
rezi_IndemnificationPayablePercentageOfNetProceedsReceived |
| Namespace Prefix: |
rezi_ |
| Data Type: |
dtr-types1:percentItemType |
| Balance Type: |
na |
| Period Type: |
duration |
|
| X |
- DefinitionIndemnification payable percentage of payments.
| Name: |
rezi_IndemnificationPayablePercentageOfPayments |
| Namespace Prefix: |
rezi_ |
| Data Type: |
dtr-types1:percentItemType |
| Balance Type: |
na |
| Period Type: |
duration |
|
| X |
- DefinitionIndemnity liability annual cap.
| Name: |
rezi_IndemnityLiabilityAnnualCap |
| Namespace Prefix: |
rezi_ |
| Data Type: |
xbrli:monetaryItemType |
| Balance Type: |
credit |
| Period Type: |
instant |
|
| X |
- DefinitionReimbursement agreement expenses.
| Name: |
rezi_ReimbursementAgreementExpenses |
| Namespace Prefix: |
rezi_ |
| Data Type: |
xbrli:monetaryItemType |
| Balance Type: |
debit |
| Period Type: |
duration |
|
| X |
- DefinitionTrademark license agreement.
| Name: |
rezi_TrademarkLicenseAgreement |
| Namespace Prefix: |
rezi_ |
| Data Type: |
xbrli:durationItemType |
| Balance Type: |
na |
| Period Type: |
duration |
|
| X |
- DefinitionTotal costs accrued as of the balance sheet date for environmental loss contingencies. Reference 1: http://www.xbrl.org/2003/role/recommendedDisclosureRef
-Topic 410
-SubTopic 30
-Name Accounting Standards Codification
-Section 50
-Paragraph 10
-Subparagraph (d)(1)
-Publisher FASB
-URI https://asc.fasb.org//1943274/2147481931/410-30-50-10
Reference 2: http://www.xbrl.org/2003/role/recommendedDisclosureRef
-Topic 410
-SubTopic 30
-Name Accounting Standards Codification
-Section 50
-Paragraph 10
-Subparagraph (d)(3)
-Publisher FASB
-URI https://asc.fasb.org//1943274/2147481931/410-30-50-10
Reference 3: http://www.xbrl.org/2003/role/exampleRef
-Topic 410
-SubTopic 30
-Name Accounting Standards Codification
-Section 55
-Paragraph 16
-Publisher FASB
-URI https://asc.fasb.org//1943274/2147481899/410-30-55-16
Reference 4: http://www.xbrl.org/2009/role/commonPracticeRef
-Topic 450
-SubTopic 20
-Name Accounting Standards Codification
-Section 50
-Paragraph 1
-Publisher FASB
-URI https://asc.fasb.org//1943274/2147483076/450-20-50-1
Reference 5: http://www.xbrl.org/2003/role/disclosureRef
-Topic 450
-SubTopic 20
-Name Accounting Standards Codification
-Section S99
-Paragraph 1
-Subparagraph (SAB Topic 5.Y.Q1)
-Publisher FASB
-URI https://asc.fasb.org//1943274/2147480102/450-20-S99-1
Reference 6: http://www.xbrl.org/2009/role/commonPracticeRef
-Topic 410
-SubTopic 30
-Name Accounting Standards Codification
-Section 50
-Paragraph 7
-Publisher FASB
-URI https://asc.fasb.org//1943274/2147481931/410-30-50-7
| Name: |
us-gaap_AccrualForEnvironmentalLossContingencies |
| Namespace Prefix: |
us-gaap_ |
| Data Type: |
xbrli:monetaryItemType |
| Balance Type: |
credit |
| Period Type: |
instant |
|
| X |
- DefinitionIndicates line item in statement of financial position that includes accrual for environmental loss contingency. Reference 1: http://www.xbrl.org/2003/role/exampleRef
-Topic 410
-SubTopic 30
-Name Accounting Standards Codification
-Section 55
-Paragraph 16
-Publisher FASB
-URI https://asc.fasb.org//1943274/2147481899/410-30-55-16
Reference 2: http://www.xbrl.org/2003/role/disclosureRef
-Topic 450
-SubTopic 20
-Name Accounting Standards Codification
-Section S99
-Paragraph 1
-Subparagraph (SAB TOPIC 5.Y.Q4)
-Publisher FASB
-URI https://asc.fasb.org//1943274/2147480102/450-20-S99-1
| Name: |
us-gaap_EnvironmentalLossContingencyStatementOfFinancialPositionExtensibleEnumeration |
| Namespace Prefix: |
us-gaap_ |
| Data Type: |
enum2:enumerationSetItemType |
| Balance Type: |
na |
| Period Type: |
instant |
|
| X |
- DefinitionAmount of litigation expense, including but not limited to legal, forensic, accounting, and investigative fees.
| Name: |
us-gaap_LitigationSettlementExpense |
| Namespace Prefix: |
us-gaap_ |
| Data Type: |
xbrli:monetaryItemType |
| Balance Type: |
debit |
| Period Type: |
duration |
|
| X |
- DefinitionLine items represent financial concepts included in a table. These concepts are used to disclose reportable information associated with domain members defined in one or many axes to the table. Reference 1: http://www.xbrl.org/2003/role/disclosureRef
-Topic 460
-SubTopic 10
-Name Accounting Standards Codification
-Section 50
-Paragraph 3
-Publisher FASB
-URI https://asc.fasb.org//1943274/2147482425/460-10-50-3
Reference 2: http://www.xbrl.org/2003/role/disclosureRef
-Topic 450
-SubTopic 20
-Name Accounting Standards Codification
-Section 50
-Paragraph 1
-Publisher FASB
-URI https://asc.fasb.org//1943274/2147483076/450-20-50-1
Reference 3: http://www.xbrl.org/2009/role/commonPracticeRef
-Topic 450
-SubTopic 20
-Name Accounting Standards Codification
-Section 50
-Paragraph 4
-Subparagraph (a)
-Publisher FASB
-URI https://asc.fasb.org//1943274/2147483076/450-20-50-4
Reference 4: http://www.xbrl.org/2003/role/disclosureRef
-Topic 450
-SubTopic 20
-Name Accounting Standards Codification
-Section 50
-Paragraph 4
-Subparagraph (b)
-Publisher FASB
-URI https://asc.fasb.org//1943274/2147483076/450-20-50-4
Reference 5: http://www.xbrl.org/2009/role/commonPracticeRef
-Topic 450
-SubTopic 20
-Name Accounting Standards Codification
-Section 50
-Paragraph 9
-Subparagraph (a)
-Publisher FASB
-URI https://asc.fasb.org//1943274/2147483076/450-20-50-9
Reference 6: http://www.xbrl.org/2003/role/disclosureRef
-Topic 450
-SubTopic 20
-Name Accounting Standards Codification
-Section 50
-Paragraph 9
-Subparagraph (b)
-Publisher FASB
-URI https://asc.fasb.org//1943274/2147483076/450-20-50-9
| Name: |
us-gaap_LossContingenciesLineItems |
| Namespace Prefix: |
us-gaap_ |
| Data Type: |
xbrli:stringItemType |
| Balance Type: |
na |
| Period Type: |
duration |
|
| X |
- DefinitionAmount of expense related to royalty payments under a contractual arrangement such as payment for mineral and drilling rights and use of technology or intellectual property. Reference 1: http://fasb.org/us-gaap/role/ref/legacyRef
-Topic 220
-SubTopic 10
-Name Accounting Standards Codification
-Section S99
-Paragraph 2
-Subparagraph (SX 210.5-03.3)
-Publisher FASB
-URI https://asc.fasb.org//1943274/2147483621/220-10-S99-2
| Name: |
us-gaap_RoyaltyExpense |
| Namespace Prefix: |
us-gaap_ |
| Data Type: |
xbrli:monetaryItemType |
| Balance Type: |
debit |
| Period Type: |
duration |
|
| X |
- DefinitionAmounts payable for money transfers, money orders, and consumer payment service arrangements. Settlement liabilities include amounts payable to intermediaries for global payment transfers.
| Name: |
us-gaap_SettlementLiabilitiesCurrent |
| Namespace Prefix: |
us-gaap_ |
| Data Type: |
xbrli:monetaryItemType |
| Balance Type: |
credit |
| Period Type: |
instant |
|
| X |
- Details
| Name: |
us-gaap_IncomeStatementLocationAxis=us-gaap_OtherExpenseMember |
| Namespace Prefix: |
|
| Data Type: |
na |
| Balance Type: |
|
| Period Type: |
|
|
| X |
- Details
| Name: |
srt_CounterpartyNameAxis=rezi_HoneywellMember |
| Namespace Prefix: |
|
| Data Type: |
na |
| Balance Type: |
|
| Period Type: |
|
|
| X |
- Details
| Name: |
us-gaap_TypeOfArrangementAxis=rezi_TrademarkLicenseAgreementMember |
| Namespace Prefix: |
|
| Data Type: |
na |
| Balance Type: |
|
| Period Type: |
|
|
| X |
- Details
| Name: |
us-gaap_LossContingenciesByNatureOfContingencyAxis=us-gaap_IndemnificationGuaranteeMember |
| Namespace Prefix: |
|
| Data Type: |
na |
| Balance Type: |
|
| Period Type: |
|
|
| X |
- Details
| Name: |
srt_RangeAxis=srt_MaximumMember |
| Namespace Prefix: |
|
| Data Type: |
na |
| Balance Type: |
|
| Period Type: |
|
|
v3.23.3
| X |
- DefinitionAccrual for indemnficiation loss contignencies payments1.
| Name: |
rezi_AccrualForIndemnficiationLossContignenciesPayments |
| Namespace Prefix: |
rezi_ |
| Data Type: |
xbrli:monetaryItemType |
| Balance Type: |
credit |
| Period Type: |
duration |
|
| X |
- DefinitionAccrual for indemnification loss contigencies.
| Name: |
rezi_AccrualForIndemnificationLossContigenciesRollForward |
| Namespace Prefix: |
rezi_ |
| Data Type: |
xbrli:stringItemType |
| Balance Type: |
na |
| Period Type: |
duration |
|
| X |
- DefinitionAccrual for indemnification loss contingencies.
| Name: |
rezi_AccrualForIndemnificationLossContingencies |
| Namespace Prefix: |
rezi_ |
| Data Type: |
xbrli:monetaryItemType |
| Balance Type: |
credit |
| Period Type: |
instant |
|
| X |
- DefinitionAccrual for indemnification loss contingencies charges to expense for new losses.
| Name: |
rezi_AccrualForIndemnificationLossContingenciesChargesToExpenseForNewLosses |
| Namespace Prefix: |
rezi_ |
| Data Type: |
xbrli:monetaryItemType |
| Balance Type: |
debit |
| Period Type: |
duration |
|
| X |
- DefinitionIndemnification payable late payment fee percentage.
| Name: |
rezi_IndemnificationPayableLatePaymentFeePercentage |
| Namespace Prefix: |
rezi_ |
| Data Type: |
dtr-types1:percentItemType |
| Balance Type: |
na |
| Period Type: |
duration |
|
| X |
- DefinitionIndemnity liability annual cap.
| Name: |
rezi_IndemnityLiabilityAnnualCap |
| Namespace Prefix: |
rezi_ |
| Data Type: |
xbrli:monetaryItemType |
| Balance Type: |
credit |
| Period Type: |
instant |
|
| X |
- DefinitionTermination minimum three year payment reimbursement obligation amount.
| Name: |
rezi_TerminationMinimumThreeYearPaymentReimbursementObligationAmount |
| Namespace Prefix: |
rezi_ |
| Data Type: |
xbrli:monetaryItemType |
| Balance Type: |
credit |
| Period Type: |
instant |
|
| X |
- Details
| Name: |
us-gaap_LossContingenciesByNatureOfContingencyAxis=us-gaap_IndemnificationGuaranteeMember |
| Namespace Prefix: |
|
| Data Type: |
na |
| Balance Type: |
|
| Period Type: |
|
|
| X |
- Details
| Name: |
srt_CounterpartyNameAxis=rezi_HoneywellMember |
| Namespace Prefix: |
|
| Data Type: |
na |
| Balance Type: |
|
| Period Type: |
|
|
| X |
- Details
| Name: |
us-gaap_OtherCommitmentsAxis=rezi_ReimbursementAgreementMember |
| Namespace Prefix: |
|
| Data Type: |
na |
| Balance Type: |
|
| Period Type: |
|
|
| X |
- Details
| Name: |
us-gaap_OtherCommitmentsAxis=rezi_TaxMattersAgreementMember |
| Namespace Prefix: |
|
| Data Type: |
na |
| Balance Type: |
|
| Period Type: |
|
|
v3.23.3
| X |
- DefinitionAccrual for indemnification loss contingencies.
| Name: |
rezi_AccrualForIndemnificationLossContingencies |
| Namespace Prefix: |
rezi_ |
| Data Type: |
xbrli:monetaryItemType |
| Balance Type: |
credit |
| Period Type: |
instant |
|
| X |
- DefinitionAccrual for indemnification loss contingencies of current portion.
| Name: |
rezi_AccrualForIndemnificationLossContingenciesCurrent |
| Namespace Prefix: |
rezi_ |
| Data Type: |
xbrli:monetaryItemType |
| Balance Type: |
credit |
| Period Type: |
instant |
|
| X |
- DefinitionAccrual for indemnification loss contingencies of non-current portion.
| Name: |
rezi_AccrualForIndemnificationLossContingenciesNonCurrent |
| Namespace Prefix: |
rezi_ |
| Data Type: |
xbrli:monetaryItemType |
| Balance Type: |
credit |
| Period Type: |
instant |
|
| X |
- References
+ Details
| Name: |
us-gaap_LossContingencyClassificationOfAccrualAbstract |
| Namespace Prefix: |
us-gaap_ |
| Data Type: |
xbrli:stringItemType |
| Balance Type: |
na |
| Period Type: |
duration |
|
| X |
- Details
| Name: |
srt_CounterpartyNameAxis=rezi_HoneywellMember |
| Namespace Prefix: |
|
| Data Type: |
na |
| Balance Type: |
|
| Period Type: |
|
|
| X |
- Details
| Name: |
us-gaap_BalanceSheetLocationAxis=us-gaap_AccountsPayableAndAccruedLiabilitiesMember |
| Namespace Prefix: |
|
| Data Type: |
na |
| Balance Type: |
|
| Period Type: |
|
|
| X |
- Details
| Name: |
us-gaap_BalanceSheetLocationAxis=rezi_ObligationsPayableUnderIndemnificationAgreementsMember |
| Namespace Prefix: |
|
| Data Type: |
na |
| Balance Type: |
|
| Period Type: |
|
|
v3.23.3
| X |
- DefinitionA roll forward is a reconciliation of a concept from the beginning of a period to the end of a period.
| Name: |
us-gaap_MovementInStandardProductWarrantyAccrualRollForward |
| Namespace Prefix: |
us-gaap_ |
| Data Type: |
xbrli:stringItemType |
| Balance Type: |
na |
| Period Type: |
duration |
|
| X |
- DefinitionAmount as of the balance sheet date of the aggregate standard product warranty liability. Does not include the balance for the extended product warranty liability. Reference 1: http://www.xbrl.org/2009/role/commonPracticeRef
-Topic 460
-SubTopic 10
-Name Accounting Standards Codification
-Section 50
-Paragraph 8
-Subparagraph (c)(1)
-Publisher FASB
-URI https://asc.fasb.org//1943274/2147482425/460-10-50-8
Reference 2: http://www.xbrl.org/2009/role/commonPracticeRef
-Topic 460
-SubTopic 10
-Name Accounting Standards Codification
-Section 50
-Paragraph 8
-Subparagraph (c)(5)
-Publisher FASB
-URI https://asc.fasb.org//1943274/2147482425/460-10-50-8
| Name: |
us-gaap_StandardProductWarrantyAccrual |
| Namespace Prefix: |
us-gaap_ |
| Data Type: |
xbrli:monetaryItemType |
| Balance Type: |
credit |
| Period Type: |
instant |
|
| X |
- DefinitionAmount of increase in the standard product warranty accrual from a business acquisition. Excludes extended product warranties. Reference 1: http://www.xbrl.org/2009/role/commonPracticeRef
-Topic 460
-SubTopic 10
-Name Accounting Standards Codification
-Section 50
-Paragraph 8
-Subparagraph (c)
-Publisher FASB
-URI https://asc.fasb.org//1943274/2147482425/460-10-50-8
| Name: |
us-gaap_StandardProductWarrantyAccrualAdditionsFromBusinessAcquisition |
| Namespace Prefix: |
us-gaap_ |
| Data Type: |
xbrli:monetaryItemType |
| Balance Type: |
credit |
| Period Type: |
duration |
|
| X |
- DefinitionAmount of decrease in the standard product warranty accrual from payments made in cash or in kind to satisfy claims under the terms of the standard product warranty. Excludes extended product warranties. Reference 1: http://www.xbrl.org/2009/role/commonPracticeRef
-Topic 460
-SubTopic 10
-Name Accounting Standards Codification
-Section 50
-Paragraph 8
-Subparagraph (c)(2)
-Publisher FASB
-URI https://asc.fasb.org//1943274/2147482425/460-10-50-8
| Name: |
us-gaap_StandardProductWarrantyAccrualPayments |
| Namespace Prefix: |
us-gaap_ |
| Data Type: |
xbrli:monetaryItemType |
| Balance Type: |
debit |
| Period Type: |
duration |
|
| X |
- DefinitionAmount of increase (decrease) in the standard product warranty accrual from changes in estimates attributable to preexisting product warranties. Excludes extended product warranties. Reference 1: http://www.xbrl.org/2009/role/commonPracticeRef
-Topic 460
-SubTopic 10
-Name Accounting Standards Codification
-Section 50
-Paragraph 8
-Subparagraph (c)(4)
-Publisher FASB
-URI https://asc.fasb.org//1943274/2147482425/460-10-50-8
| Name: |
us-gaap_StandardProductWarrantyAccrualPreexistingIncreaseDecrease |
| Namespace Prefix: |
us-gaap_ |
| Data Type: |
xbrli:monetaryItemType |
| Balance Type: |
credit |
| Period Type: |
duration |
|
| X |
- DefinitionAmount of increase in the standard product warranty accrual from warranties issued. Excludes extended product warranties. Reference 1: http://www.xbrl.org/2009/role/commonPracticeRef
-Topic 460
-SubTopic 10
-Name Accounting Standards Codification
-Section 50
-Paragraph 8
-Subparagraph (c)(3)
-Publisher FASB
-URI https://asc.fasb.org//1943274/2147482425/460-10-50-8
| Name: |
us-gaap_StandardProductWarrantyAccrualWarrantiesIssued |
| Namespace Prefix: |
us-gaap_ |
| Data Type: |
xbrli:monetaryItemType |
| Balance Type: |
credit |
| Period Type: |
duration |
|
v3.23.3
v3.23.3
| X |
- References
+ Details
| Name: |
us-gaap_DilutiveSecuritiesAbstract |
| Namespace Prefix: |
us-gaap_ |
| Data Type: |
xbrli:stringItemType |
| Balance Type: |
na |
| Period Type: |
duration |
|
| X |
- References
+ Details
| Name: |
us-gaap_EarningsPerShareAbstract |
| Namespace Prefix: |
us-gaap_ |
| Data Type: |
xbrli:stringItemType |
| Balance Type: |
na |
| Period Type: |
duration |
|
| X |
- DefinitionThe amount of net income (loss) for the period per each share of common stock or unit outstanding during the reporting period. Reference 1: http://www.xbrl.org/2003/role/disclosureRef
-Topic 250
-SubTopic 10
-Name Accounting Standards Codification
-Section 50
-Paragraph 3
-Publisher FASB
-URI https://asc.fasb.org//1943274/2147483443/250-10-50-3
Reference 2: http://www.xbrl.org/2003/role/disclosureRef
-Topic 260
-SubTopic 10
-Name Accounting Standards Codification
-Section 55
-Paragraph 15
-Publisher FASB
-URI https://asc.fasb.org//1943274/2147482635/260-10-55-15
Reference 3: http://www.xbrl.org/2003/role/disclosureRef
-Topic 815
-SubTopic 40
-Name Accounting Standards Codification
-Section 65
-Paragraph 1
-Subparagraph (e)(4)
-Publisher FASB
-URI https://asc.fasb.org//1943274/2147480175/815-40-65-1
Reference 4: http://www.xbrl.org/2003/role/disclosureRef
-Topic 815
-SubTopic 40
-Name Accounting Standards Codification
-Section 65
-Paragraph 1
-Subparagraph (f)
-Publisher FASB
-URI https://asc.fasb.org//1943274/2147480175/815-40-65-1
Reference 5: http://www.xbrl.org/2003/role/disclosureRef
-Topic 250
-SubTopic 10
-Name Accounting Standards Codification
-Section 50
-Paragraph 11
-Subparagraph (a)
-Publisher FASB
-URI https://asc.fasb.org//1943274/2147483443/250-10-50-11
Reference 6: http://www.xbrl.org/2003/role/disclosureRef
-Topic 250
-SubTopic 10
-Name Accounting Standards Codification
-Section 50
-Paragraph 11
-Subparagraph (b)
-Publisher FASB
-URI https://asc.fasb.org//1943274/2147483443/250-10-50-11
Reference 7: http://www.xbrl.org/2003/role/disclosureRef
-Topic 250
-SubTopic 10
-Name Accounting Standards Codification
-Section 50
-Paragraph 7
-Subparagraph (a)
-Publisher FASB
-URI https://asc.fasb.org//1943274/2147483443/250-10-50-7
Reference 8: http://www.xbrl.org/2003/role/disclosureRef
-Topic 260
-SubTopic 10
-Name Accounting Standards Codification
-Section 45
-Paragraph 2
-Publisher FASB
-URI https://asc.fasb.org//1943274/2147482689/260-10-45-2
Reference 9: http://www.xbrl.org/2003/role/disclosureRef
-Topic 260
-SubTopic 10
-Name Accounting Standards Codification
-Section 45
-Paragraph 60B
-Subparagraph (d)
-Publisher FASB
-URI https://asc.fasb.org//1943274/2147482689/260-10-45-60B
Reference 10: http://www.xbrl.org/2003/role/disclosureRef
-Topic 250
-SubTopic 10
-Name Accounting Standards Codification
-Section 50
-Paragraph 4
-Publisher FASB
-URI https://asc.fasb.org//1943274/2147483443/250-10-50-4
Reference 11: http://www.xbrl.org/2003/role/disclosureRef
-Topic 260
-SubTopic 10
-Name Accounting Standards Codification
-Section 50
-Paragraph 1
-Subparagraph (a)
-Publisher FASB
-URI https://asc.fasb.org//1943274/2147482662/260-10-50-1
Reference 12: http://www.xbrl.org/2003/role/disclosureRef
-Topic 260
-SubTopic 10
-Name Accounting Standards Codification
-Section 45
-Paragraph 10
-Publisher FASB
-URI https://asc.fasb.org//1943274/2147482689/260-10-45-10
Reference 13: http://www.xbrl.org/2003/role/disclosureRef
-Topic 220
-SubTopic 10
-Name Accounting Standards Codification
-Section S99
-Paragraph 2
-Subparagraph (SX 210.5-03(25))
-Publisher FASB
-URI https://asc.fasb.org//1943274/2147483621/220-10-S99-2
Reference 14: http://www.xbrl.org/2003/role/disclosureRef
-Topic 942
-SubTopic 220
-Name Accounting Standards Codification
-Section S99
-Paragraph 1
-Subparagraph (SX 210.9-04(27))
-Publisher FASB
-URI https://asc.fasb.org//1943274/2147483589/942-220-S99-1
Reference 15: http://www.xbrl.org/2003/role/disclosureRef
-Topic 944
-SubTopic 220
-Name Accounting Standards Codification
-Section S99
-Paragraph 1
-Subparagraph (SX 210.7-04(23))
-Publisher FASB
-URI https://asc.fasb.org//1943274/2147483586/944-220-S99-1
Reference 16: http://www.xbrl.org/2003/role/exampleRef
-Topic 260
-SubTopic 10
-Name Accounting Standards Codification
-Section 55
-Paragraph 52
-Publisher FASB
-URI https://asc.fasb.org//1943274/2147482635/260-10-55-52
Reference 17: http://www.xbrl.org/2003/role/disclosureRef
-Topic 260
-SubTopic 10
-Name Accounting Standards Codification
-Section 45
-Paragraph 7
-Publisher FASB
-URI https://asc.fasb.org//1943274/2147482689/260-10-45-7
| Name: |
us-gaap_EarningsPerShareBasic |
| Namespace Prefix: |
us-gaap_ |
| Data Type: |
dtr-types:perShareItemType |
| Balance Type: |
na |
| Period Type: |
duration |
|
| X |
- References
+ Details
| Name: |
us-gaap_EarningsPerShareBasicAbstract |
| Namespace Prefix: |
us-gaap_ |
| Data Type: |
xbrli:stringItemType |
| Balance Type: |
na |
| Period Type: |
duration |
|
| X |
- DefinitionThe amount of net income (loss) for the period available to each share of common stock or common unit outstanding during the reporting period and to each share or unit that would have been outstanding assuming the issuance of common shares or units for all dilutive potential common shares or units outstanding during the reporting period. Reference 1: http://www.xbrl.org/2003/role/disclosureRef
-Topic 250
-SubTopic 10
-Name Accounting Standards Codification
-Section 50
-Paragraph 3
-Publisher FASB
-URI https://asc.fasb.org//1943274/2147483443/250-10-50-3
Reference 2: http://www.xbrl.org/2003/role/disclosureRef
-Topic 260
-SubTopic 10
-Name Accounting Standards Codification
-Section 55
-Paragraph 15
-Publisher FASB
-URI https://asc.fasb.org//1943274/2147482635/260-10-55-15
Reference 3: http://www.xbrl.org/2003/role/disclosureRef
-Topic 815
-SubTopic 40
-Name Accounting Standards Codification
-Section 65
-Paragraph 1
-Subparagraph (e)(4)
-Publisher FASB
-URI https://asc.fasb.org//1943274/2147480175/815-40-65-1
Reference 4: http://www.xbrl.org/2003/role/disclosureRef
-Topic 815
-SubTopic 40
-Name Accounting Standards Codification
-Section 65
-Paragraph 1
-Subparagraph (f)
-Publisher FASB
-URI https://asc.fasb.org//1943274/2147480175/815-40-65-1
Reference 5: http://www.xbrl.org/2003/role/disclosureRef
-Topic 250
-SubTopic 10
-Name Accounting Standards Codification
-Section 50
-Paragraph 11
-Subparagraph (a)
-Publisher FASB
-URI https://asc.fasb.org//1943274/2147483443/250-10-50-11
Reference 6: http://www.xbrl.org/2003/role/disclosureRef
-Topic 250
-SubTopic 10
-Name Accounting Standards Codification
-Section 50
-Paragraph 11
-Subparagraph (b)
-Publisher FASB
-URI https://asc.fasb.org//1943274/2147483443/250-10-50-11
Reference 7: http://www.xbrl.org/2003/role/disclosureRef
-Topic 250
-SubTopic 10
-Name Accounting Standards Codification
-Section 50
-Paragraph 7
-Subparagraph (a)
-Publisher FASB
-URI https://asc.fasb.org//1943274/2147483443/250-10-50-7
Reference 8: http://www.xbrl.org/2003/role/disclosureRef
-Topic 260
-SubTopic 10
-Name Accounting Standards Codification
-Section 45
-Paragraph 2
-Publisher FASB
-URI https://asc.fasb.org//1943274/2147482689/260-10-45-2
Reference 9: http://www.xbrl.org/2003/role/disclosureRef
-Topic 260
-SubTopic 10
-Name Accounting Standards Codification
-Section 45
-Paragraph 60B
-Subparagraph (d)
-Publisher FASB
-URI https://asc.fasb.org//1943274/2147482689/260-10-45-60B
Reference 10: http://www.xbrl.org/2003/role/disclosureRef
-Topic 250
-SubTopic 10
-Name Accounting Standards Codification
-Section 50
-Paragraph 4
-Publisher FASB
-URI https://asc.fasb.org//1943274/2147483443/250-10-50-4
Reference 11: http://www.xbrl.org/2003/role/disclosureRef
-Topic 260
-SubTopic 10
-Name Accounting Standards Codification
-Section 50
-Paragraph 1
-Subparagraph (a)
-Publisher FASB
-URI https://asc.fasb.org//1943274/2147482662/260-10-50-1
Reference 12: http://www.xbrl.org/2003/role/disclosureRef
-Topic 220
-SubTopic 10
-Name Accounting Standards Codification
-Section S99
-Paragraph 2
-Subparagraph (SX 210.5-03(25))
-Publisher FASB
-URI https://asc.fasb.org//1943274/2147483621/220-10-S99-2
Reference 13: http://www.xbrl.org/2003/role/disclosureRef
-Topic 942
-SubTopic 220
-Name Accounting Standards Codification
-Section S99
-Paragraph 1
-Subparagraph (SX 210.9-04(27))
-Publisher FASB
-URI https://asc.fasb.org//1943274/2147483589/942-220-S99-1
Reference 14: http://www.xbrl.org/2003/role/disclosureRef
-Topic 944
-SubTopic 220
-Name Accounting Standards Codification
-Section S99
-Paragraph 1
-Subparagraph (SX 210.7-04(23))
-Publisher FASB
-URI https://asc.fasb.org//1943274/2147483586/944-220-S99-1
Reference 15: http://www.xbrl.org/2003/role/exampleRef
-Topic 260
-SubTopic 10
-Name Accounting Standards Codification
-Section 55
-Paragraph 52
-Publisher FASB
-URI https://asc.fasb.org//1943274/2147482635/260-10-55-52
Reference 16: http://www.xbrl.org/2003/role/disclosureRef
-Topic 260
-SubTopic 10
-Name Accounting Standards Codification
-Section 45
-Paragraph 7
-Publisher FASB
-URI https://asc.fasb.org//1943274/2147482689/260-10-45-7
| Name: |
us-gaap_EarningsPerShareDiluted |
| Namespace Prefix: |
us-gaap_ |
| Data Type: |
dtr-types:perShareItemType |
| Balance Type: |
na |
| Period Type: |
duration |
|
| X |
- DefinitionThe portion of profit or loss for the period, net of income taxes, which is attributable to the parent. Reference 1: http://www.xbrl.org/2003/role/disclosureRef
-Topic 235
-SubTopic 10
-Name Accounting Standards Codification
-Section S99
-Paragraph 1
-Subparagraph (SX 210.4-08(g)(1)(ii))
-Publisher FASB
-URI https://asc.fasb.org//1943274/2147480678/235-10-S99-1
Reference 2: http://www.xbrl.org/2003/role/disclosureRef
-Topic 323
-SubTopic 10
-Name Accounting Standards Codification
-Section 50
-Paragraph 3
-Subparagraph (c)
-Publisher FASB
-URI https://asc.fasb.org//1943274/2147481687/323-10-50-3
Reference 3: http://www.xbrl.org/2003/role/disclosureRef
-Topic 825
-SubTopic 10
-Name Accounting Standards Codification
-Section 50
-Paragraph 28
-Subparagraph (f)
-Publisher FASB
-URI https://asc.fasb.org//1943274/2147482907/825-10-50-28
Reference 4: http://www.xbrl.org/2003/role/disclosureRef
-Topic 220
-SubTopic 10
-Name Accounting Standards Codification
-Section 50
-Paragraph 6
-Publisher FASB
-URI https://asc.fasb.org//1943274/2147482765/220-10-50-6
Reference 5: http://www.xbrl.org/2003/role/disclosureRef
-Topic 250
-SubTopic 10
-Name Accounting Standards Codification
-Section 50
-Paragraph 3
-Publisher FASB
-URI https://asc.fasb.org//1943274/2147483443/250-10-50-3
Reference 6: http://www.xbrl.org/2003/role/disclosureRef
-Topic 250
-SubTopic 10
-Name Accounting Standards Codification
-Section 50
-Paragraph 1
-Subparagraph (b)(2)
-Publisher FASB
-URI https://asc.fasb.org//1943274/2147483443/250-10-50-1
Reference 7: http://www.xbrl.org/2003/role/disclosureRef
-Topic 815
-SubTopic 40
-Name Accounting Standards Codification
-Section 65
-Paragraph 1
-Subparagraph (f)
-Publisher FASB
-URI https://asc.fasb.org//1943274/2147480175/815-40-65-1
Reference 8: http://www.xbrl.org/2003/role/disclosureRef
-Topic 250
-SubTopic 10
-Name Accounting Standards Codification
-Section 50
-Paragraph 8
-Publisher FASB
-URI https://asc.fasb.org//1943274/2147483443/250-10-50-8
Reference 9: http://www.xbrl.org/2003/role/disclosureRef
-Topic 250
-SubTopic 10
-Name Accounting Standards Codification
-Section 50
-Paragraph 9
-Publisher FASB
-URI https://asc.fasb.org//1943274/2147483443/250-10-50-9
Reference 10: http://www.xbrl.org/2003/role/disclosureRef
-Topic 250
-SubTopic 10
-Name Accounting Standards Codification
-Section 50
-Paragraph 11
-Subparagraph (a)
-Publisher FASB
-URI https://asc.fasb.org//1943274/2147483443/250-10-50-11
Reference 11: http://www.xbrl.org/2003/role/disclosureRef
-Topic 250
-SubTopic 10
-Name Accounting Standards Codification
-Section 50
-Paragraph 11
-Subparagraph (b)
-Publisher FASB
-URI https://asc.fasb.org//1943274/2147483443/250-10-50-11
Reference 12: http://www.xbrl.org/2003/role/disclosureRef
-Topic 250
-SubTopic 10
-Name Accounting Standards Codification
-Section 50
-Paragraph 4
-Publisher FASB
-URI https://asc.fasb.org//1943274/2147483443/250-10-50-4
Reference 13: http://www.xbrl.org/2003/role/exampleRef
-Topic 946
-SubTopic 830
-Name Accounting Standards Codification
-Section 55
-Paragraph 10
-Publisher FASB
-URI https://asc.fasb.org//1943274/2147480167/946-830-55-10
Reference 14: http://www.xbrl.org/2003/role/disclosureRef
-Topic 946
-SubTopic 220
-Name Accounting Standards Codification
-Section 45
-Paragraph 7
-Publisher FASB
-URI https://asc.fasb.org//1943274/2147483581/946-220-45-7
Reference 15: http://www.xbrl.org/2003/role/disclosureRef
-Topic 944
-SubTopic 220
-Name Accounting Standards Codification
-Section S99
-Paragraph 1
-Subparagraph (SX 210.7-04(18))
-Publisher FASB
-URI https://asc.fasb.org//1943274/2147483586/944-220-S99-1
Reference 16: http://www.xbrl.org/2003/role/disclosureRef
-Topic 280
-SubTopic 10
-Name Accounting Standards Codification
-Section 50
-Paragraph 22
-Publisher FASB
-URI https://asc.fasb.org//1943274/2147482810/280-10-50-22
Reference 17: http://www.xbrl.org/2003/role/disclosureRef
-Topic 946
-SubTopic 220
-Name Accounting Standards Codification
-Section S99
-Paragraph 1
-Subparagraph (SX 210.6-07(9))
-Publisher FASB
-URI https://asc.fasb.org//1943274/2147483575/946-220-S99-1
Reference 18: http://www.xbrl.org/2003/role/disclosureRef
-Topic 946
-SubTopic 220
-Name Accounting Standards Codification
-Section S99
-Paragraph 3
-Subparagraph (SX 210.6-09(1)(d))
-Publisher FASB
-URI https://asc.fasb.org//1943274/2147483575/946-220-S99-3
Reference 19: http://www.xbrl.org/2003/role/disclosureRef
-Topic 470
-SubTopic 10
-Name Accounting Standards Codification
-Section S99
-Paragraph 1A
-Subparagraph (SX 210.13-01(a)(4)(i))
-Publisher FASB
-URI https://asc.fasb.org//1943274/2147480097/470-10-S99-1A
Reference 20: http://www.xbrl.org/2009/role/commonPracticeRef
-Topic 470
-SubTopic 10
-Name Accounting Standards Codification
-Section S99
-Paragraph 1A
-Subparagraph (SX 210.13-01(a)(4)(ii))
-Publisher FASB
-URI https://asc.fasb.org//1943274/2147480097/470-10-S99-1A
Reference 21: http://www.xbrl.org/2003/role/disclosureRef
-Topic 470
-SubTopic 10
-Name Accounting Standards Codification
-Section S99
-Paragraph 1A
-Subparagraph (SX 210.13-01(a)(4)(iii)(A))
-Publisher FASB
-URI https://asc.fasb.org//1943274/2147480097/470-10-S99-1A
Reference 22: http://www.xbrl.org/2003/role/disclosureRef
-Topic 470
-SubTopic 10
-Name Accounting Standards Codification
-Section S99
-Paragraph 1A
-Subparagraph (SX 210.13-01(a)(4)(iv))
-Publisher FASB
-URI https://asc.fasb.org//1943274/2147480097/470-10-S99-1A
Reference 23: http://www.xbrl.org/2003/role/disclosureRef
-Topic 470
-SubTopic 10
-Name Accounting Standards Codification
-Section S99
-Paragraph 1A
-Subparagraph (SX 210.13-01(a)(5))
-Publisher FASB
-URI https://asc.fasb.org//1943274/2147480097/470-10-S99-1A
Reference 24: http://www.xbrl.org/2003/role/disclosureRef
-Topic 470
-SubTopic 10
-Name Accounting Standards Codification
-Section S99
-Paragraph 1B
-Subparagraph (SX 210.13-02(a)(4)(i))
-Publisher FASB
-URI https://asc.fasb.org//1943274/2147480097/470-10-S99-1B
Reference 25: http://www.xbrl.org/2003/role/disclosureRef
-Topic 470
-SubTopic 10
-Name Accounting Standards Codification
-Section S99
-Paragraph 1B
-Subparagraph (SX 210.13-02(a)(4)(iii)(A))
-Publisher FASB
-URI https://asc.fasb.org//1943274/2147480097/470-10-S99-1B
Reference 26: http://www.xbrl.org/2003/role/disclosureRef
-Topic 470
-SubTopic 10
-Name Accounting Standards Codification
-Section S99
-Paragraph 1B
-Subparagraph (SX 210.13-02(a)(4)(iii)(B))
-Publisher FASB
-URI https://asc.fasb.org//1943274/2147480097/470-10-S99-1B
Reference 27: http://www.xbrl.org/2003/role/disclosureRef
-Topic 470
-SubTopic 10
-Name Accounting Standards Codification
-Section S99
-Paragraph 1B
-Subparagraph (SX 210.13-02(a)(4)(iv))
-Publisher FASB
-URI https://asc.fasb.org//1943274/2147480097/470-10-S99-1B
Reference 28: http://www.xbrl.org/2003/role/disclosureRef
-Topic 470
-SubTopic 10
-Name Accounting Standards Codification
-Section S99
-Paragraph 1B
-Subparagraph (SX 210.13-02(a)(5))
-Publisher FASB
-URI https://asc.fasb.org//1943274/2147480097/470-10-S99-1B
Reference 29: http://www.xbrl.org/2003/role/disclosureRef
-Topic 280
-SubTopic 10
-Name Accounting Standards Codification
-Section 50
-Paragraph 30
-Subparagraph (b)
-Publisher FASB
-URI https://asc.fasb.org//1943274/2147482810/280-10-50-30
Reference 30: http://www.xbrl.org/2003/role/disclosureRef
-Topic 280
-SubTopic 10
-Name Accounting Standards Codification
-Section 50
-Paragraph 32
-Subparagraph (f)
-Publisher FASB
-URI https://asc.fasb.org//1943274/2147482810/280-10-50-32
Reference 31: http://www.xbrl.org/2003/role/disclosureRef
-Topic 260
-SubTopic 10
-Name Accounting Standards Codification
-Section 45
-Paragraph 60B
-Subparagraph (a)
-Publisher FASB
-URI https://asc.fasb.org//1943274/2147482689/260-10-45-60B
Reference 32: http://www.xbrl.org/2003/role/exampleRef
-Topic 280
-SubTopic 10
-Name Accounting Standards Codification
-Section 50
-Paragraph 31
-Publisher FASB
-URI https://asc.fasb.org//1943274/2147482810/280-10-50-31
Reference 33: http://www.xbrl.org/2003/role/disclosureRef
-Topic 280
-SubTopic 10
-Name Accounting Standards Codification
-Section 50
-Paragraph 32
-Subparagraph (c)
-Publisher FASB
-URI https://asc.fasb.org//1943274/2147482810/280-10-50-32
Reference 34: http://www.xbrl.org/2003/role/disclosureRef
-Topic 205
-SubTopic 20
-Name Accounting Standards Codification
-Section 50
-Paragraph 7
-Publisher FASB
-URI https://asc.fasb.org//1943274/2147483499/205-20-50-7
Reference 35: http://fasb.org/us-gaap/role/ref/legacyRef
-Topic 230
-SubTopic 10
-Name Accounting Standards Codification
-Section 45
-Paragraph 28
-Publisher FASB
-URI https://asc.fasb.org//1943274/2147482740/230-10-45-28
Reference 36: http://www.xbrl.org/2003/role/disclosureRef
-Topic 220
-SubTopic 10
-Name Accounting Standards Codification
-Section 45
-Paragraph 1A
-Subparagraph (a)
-Publisher FASB
-URI https://asc.fasb.org//1943274/2147482790/220-10-45-1A
Reference 37: http://www.xbrl.org/2003/role/disclosureRef
-Topic 220
-SubTopic 10
-Name Accounting Standards Codification
-Section 45
-Paragraph 1B
-Subparagraph (a)
-Publisher FASB
-URI https://asc.fasb.org//1943274/2147482790/220-10-45-1B
Reference 38: http://fasb.org/us-gaap/role/ref/legacyRef
-Topic 220
-SubTopic 10
-Name Accounting Standards Codification
-Section S99
-Paragraph 2
-Subparagraph (SX 210.5-03(20))
-Publisher FASB
-URI https://asc.fasb.org//1943274/2147483621/220-10-S99-2
Reference 39: http://fasb.org/us-gaap/role/ref/legacyRef
-Topic 942
-SubTopic 220
-Name Accounting Standards Codification
-Section S99
-Paragraph 1
-Subparagraph (SX 210.9-04(22))
-Publisher FASB
-URI https://asc.fasb.org//1943274/2147483589/942-220-S99-1
| Name: |
us-gaap_NetIncomeLoss |
| Namespace Prefix: |
us-gaap_ |
| Data Type: |
xbrli:monetaryItemType |
| Balance Type: |
credit |
| Period Type: |
duration |
|
| X |
- DefinitionThe sum of dilutive potential common shares or units used in the calculation of the diluted per-share or per-unit computation. Reference 1: http://www.xbrl.org/2009/role/commonPracticeRef
-Topic 260
-SubTopic 10
-Name Accounting Standards Codification
-Section 50
-Paragraph 1
-Subparagraph (a)
-Publisher FASB
-URI https://asc.fasb.org//1943274/2147482662/260-10-50-1
| Name: |
us-gaap_WeightedAverageNumberDilutedSharesOutstandingAdjustment |
| Namespace Prefix: |
us-gaap_ |
| Data Type: |
xbrli:sharesItemType |
| Balance Type: |
na |
| Period Type: |
duration |
|
| X |
- DefinitionThe average number of shares or units issued and outstanding that are used in calculating diluted EPS or earnings per unit (EPU), determined based on the timing of issuance of shares or units in the period. Reference 1: http://www.xbrl.org/2003/role/disclosureRef
-Topic 260
-SubTopic 10
-Name Accounting Standards Codification
-Section 50
-Paragraph 1
-Subparagraph (a)
-Publisher FASB
-URI https://asc.fasb.org//1943274/2147482662/260-10-50-1
Reference 2: http://www.xbrl.org/2003/role/disclosureRef
-Topic 260
-SubTopic 10
-Name Accounting Standards Codification
-Section 45
-Paragraph 16
-Publisher FASB
-URI https://asc.fasb.org//1943274/2147482689/260-10-45-16
| Name: |
us-gaap_WeightedAverageNumberOfDilutedSharesOutstanding |
| Namespace Prefix: |
us-gaap_ |
| Data Type: |
xbrli:sharesItemType |
| Balance Type: |
na |
| Period Type: |
duration |
|
| X |
- DefinitionNumber of [basic] shares or units, after adjustment for contingently issuable shares or units and other shares or units not deemed outstanding, determined by relating the portion of time within a reporting period that common shares or units have been outstanding to the total time in that period. Reference 1: http://www.xbrl.org/2003/role/disclosureRef
-Topic 260
-SubTopic 10
-Name Accounting Standards Codification
-Section 50
-Paragraph 1
-Subparagraph (a)
-Publisher FASB
-URI https://asc.fasb.org//1943274/2147482662/260-10-50-1
Reference 2: http://www.xbrl.org/2003/role/disclosureRef
-Topic 260
-SubTopic 10
-Name Accounting Standards Codification
-Section 45
-Paragraph 10
-Publisher FASB
-URI https://asc.fasb.org//1943274/2147482689/260-10-45-10
| Name: |
us-gaap_WeightedAverageNumberOfSharesOutstandingBasic |
| Namespace Prefix: |
us-gaap_ |
| Data Type: |
xbrli:sharesItemType |
| Balance Type: |
na |
| Period Type: |
duration |
|
v3.23.3
| X |
- DefinitionSecurities (including those issuable pursuant to contingent stock agreements) that could potentially dilute basic earnings per share (EPS) or earnings per unit (EPU) in the future that were not included in the computation of diluted EPS or EPU because to do so would increase EPS or EPU amounts or decrease loss per share or unit amounts for the period presented. Reference 1: http://www.xbrl.org/2003/role/disclosureRef
-Topic 260
-SubTopic 10
-Name Accounting Standards Codification
-Section 50
-Paragraph 1
-Subparagraph (c)
-Publisher FASB
-URI https://asc.fasb.org//1943274/2147482662/260-10-50-1
| Name: |
us-gaap_AntidilutiveSecuritiesExcludedFromComputationOfEarningsPerShareAmount |
| Namespace Prefix: |
us-gaap_ |
| Data Type: |
xbrli:sharesItemType |
| Balance Type: |
na |
| Period Type: |
duration |
|
| X |
- Details
| Name: |
us-gaap_AntidilutiveSecuritiesExcludedFromComputationOfEarningsPerShareByAntidilutiveSecuritiesAxis=rezi_OptionsAndOtherRightsMember |
| Namespace Prefix: |
|
| Data Type: |
na |
| Balance Type: |
|
| Period Type: |
|
|
v3.23.3
| X |
- DefinitionLine items represent financial concepts included in a table. These concepts are used to disclose reportable information associated with domain members defined in one or many axes to the table. Reference 1: http://www.xbrl.org/2003/role/exampleRef
-Topic 505
-SubTopic 10
-Name Accounting Standards Codification
-Section 50
-Paragraph 13
-Subparagraph (d)
-Publisher FASB
-URI https://asc.fasb.org//1943274/2147481112/505-10-50-13
Reference 2: http://www.xbrl.org/2003/role/recommendedDisclosureRef
-Topic 272
-SubTopic 10
-Name Accounting Standards Codification
-Section 45
-Paragraph 3
-Publisher FASB
-URI https://asc.fasb.org//1943274/2147483014/272-10-45-3
Reference 3: http://www.xbrl.org/2003/role/disclosureRef
-Topic 272
-SubTopic 10
-Name Accounting Standards Codification
-Section 50
-Paragraph 1
-Publisher FASB
-URI https://asc.fasb.org//1943274/2147482987/272-10-50-1
Reference 4: http://www.xbrl.org/2009/role/commonPracticeRef
-Topic 235
-SubTopic 10
-Name Accounting Standards Codification
-Section S99
-Paragraph 1
-Subparagraph (SX 210.4-08(d))
-Publisher FASB
-URI https://asc.fasb.org//1943274/2147480678/235-10-S99-1
Reference 5: http://www.xbrl.org/2003/role/disclosureRef
-Topic 505
-SubTopic 10
-Name Accounting Standards Codification
-Section 50
-Paragraph 13
-Subparagraph (a)
-Publisher FASB
-URI https://asc.fasb.org//1943274/2147481112/505-10-50-13
Reference 6: http://www.xbrl.org/2003/role/disclosureRef
-Topic 505
-SubTopic 10
-Name Accounting Standards Codification
-Section 50
-Paragraph 13
-Subparagraph (b)
-Publisher FASB
-URI https://asc.fasb.org//1943274/2147481112/505-10-50-13
Reference 7: http://www.xbrl.org/2003/role/disclosureRef
-Topic 505
-SubTopic 10
-Name Accounting Standards Codification
-Section 50
-Paragraph 13
-Subparagraph (e)
-Publisher FASB
-URI https://asc.fasb.org//1943274/2147481112/505-10-50-13
Reference 8: http://www.xbrl.org/2003/role/disclosureRef
-Topic 505
-SubTopic 10
-Name Accounting Standards Codification
-Section 50
-Paragraph 13
-Subparagraph (h)
-Publisher FASB
-URI https://asc.fasb.org//1943274/2147481112/505-10-50-13
Reference 9: http://www.xbrl.org/2003/role/disclosureRef
-Topic 505
-SubTopic 10
-Name Accounting Standards Codification
-Section 50
-Paragraph 14
-Subparagraph (b)
-Publisher FASB
-URI https://asc.fasb.org//1943274/2147481112/505-10-50-14
Reference 10: http://www.xbrl.org/2003/role/disclosureRef
-Topic 505
-SubTopic 10
-Name Accounting Standards Codification
-Section 50
-Paragraph 18
-Subparagraph (c)
-Publisher FASB
-URI https://asc.fasb.org//1943274/2147481112/505-10-50-18
Reference 11: http://www.xbrl.org/2003/role/disclosureRef
-Topic 210
-SubTopic 10
-Name Accounting Standards Codification
-Section S99
-Paragraph 1
-Subparagraph (SX 210.5-02(27)(b))
-Publisher FASB
-URI https://asc.fasb.org//1943274/2147480566/210-10-S99-1
Reference 12: http://www.xbrl.org/2003/role/disclosureRef
-Topic 210
-SubTopic 10
-Name Accounting Standards Codification
-Section S99
-Paragraph 1
-Subparagraph (SX 210.5-02(28))
-Publisher FASB
-URI https://asc.fasb.org//1943274/2147480566/210-10-S99-1
Reference 13: http://www.xbrl.org/2003/role/disclosureRef
-Topic 505
-SubTopic 10
-Name Accounting Standards Codification
-Section 50
-Paragraph 2
-Publisher FASB
-URI https://asc.fasb.org//1943274/2147481112/505-10-50-2
Reference 14: http://www.xbrl.org/2003/role/disclosureRef
-Topic 210
-SubTopic 10
-Name Accounting Standards Codification
-Section S99
-Paragraph 1
-Subparagraph (SX 210.5-02(29))
-Publisher FASB
-URI https://asc.fasb.org//1943274/2147480566/210-10-S99-1
Reference 15: http://www.xbrl.org/2003/role/disclosureRef
-Topic 946
-SubTopic 10
-Name Accounting Standards Codification
-Section S99
-Paragraph 3
-Subparagraph (SX 210.6-03(i)(2))
-Publisher FASB
-URI https://asc.fasb.org//1943274/2147479886/946-10-S99-3
Reference 16: http://www.xbrl.org/2003/role/disclosureRef
-Topic 946
-SubTopic 10
-Name Accounting Standards Codification
-Section S99
-Paragraph 3
-Subparagraph (SX 210.6-03(i)(1))
-Publisher FASB
-URI https://asc.fasb.org//1943274/2147479886/946-10-S99-3
Reference 17: http://www.xbrl.org/2003/role/disclosureRef
-Topic 946
-SubTopic 10
-Name Accounting Standards Codification
-Section S99
-Paragraph 3
-Subparagraph (SX 210.6-03(i)(2)(i))
-Publisher FASB
-URI https://asc.fasb.org//1943274/2147479886/946-10-S99-3
Reference 18: http://www.xbrl.org/2003/role/disclosureRef
-Topic 946
-SubTopic 10
-Name Accounting Standards Codification
-Section S99
-Paragraph 3
-Subparagraph (SX 210.6-03(i)(2)(ii))
-Publisher FASB
-URI https://asc.fasb.org//1943274/2147479886/946-10-S99-3
| Name: |
us-gaap_ClassOfStockLineItems |
| Namespace Prefix: |
us-gaap_ |
| Data Type: |
xbrli:stringItemType |
| Balance Type: |
na |
| Period Type: |
duration |
|
| X |
- DefinitionAmount of stock repurchase plan authorized.
| Name: |
us-gaap_StockRepurchaseProgramAuthorizedAmount1 |
| Namespace Prefix: |
us-gaap_ |
| Data Type: |
xbrli:monetaryItemType |
| Balance Type: |
credit |
| Period Type: |
instant |
|
| X |
- DefinitionAmount remaining of a stock repurchase plan authorized.
| Name: |
us-gaap_StockRepurchaseProgramRemainingAuthorizedRepurchaseAmount1 |
| Namespace Prefix: |
us-gaap_ |
| Data Type: |
xbrli:monetaryItemType |
| Balance Type: |
credit |
| Period Type: |
instant |
|
| X |
- DefinitionNumber of shares that have been repurchased during the period and are being held in treasury. Reference 1: http://fasb.org/us-gaap/role/ref/legacyRef
-Name Accounting Standards Codification
-Section 50
-Paragraph 2
-SubTopic 10
-Topic 505
-Publisher FASB
-URI https://asc.fasb.org//1943274/2147481112/505-10-50-2
Reference 2: http://fasb.org/us-gaap/role/ref/legacyRef
-Topic 505
-SubTopic 10
-Name Accounting Standards Codification
-Section S99
-Paragraph 1
-Subparagraph (SX 210.3-04)
-Publisher FASB
-URI https://asc.fasb.org//1943274/2147480008/505-10-S99-1
Reference 3: http://fasb.org/us-gaap/role/ref/legacyRef
-Topic 210
-SubTopic 10
-Name Accounting Standards Codification
-Section S99
-Paragraph 1
-Subparagraph (SX 210.5-02(29))
-Publisher FASB
-URI https://asc.fasb.org//1943274/2147480566/210-10-S99-1
| Name: |
us-gaap_TreasuryStockSharesAcquired |
| Namespace Prefix: |
us-gaap_ |
| Data Type: |
xbrli:sharesItemType |
| Balance Type: |
na |
| Period Type: |
duration |
|
| X |
- DefinitionEquity impact of the cost of common and preferred stock that were repurchased during the period. Recorded using the cost method. Reference 1: http://fasb.org/us-gaap/role/ref/legacyRef
-Name Accounting Standards Codification
-Section 50
-Paragraph 2
-SubTopic 10
-Topic 505
-Publisher FASB
-URI https://asc.fasb.org//1943274/2147481112/505-10-50-2
Reference 2: http://fasb.org/us-gaap/role/ref/legacyRef
-Topic 505
-SubTopic 10
-Name Accounting Standards Codification
-Section S99
-Paragraph 1
-Subparagraph (SX 210.3-04)
-Publisher FASB
-URI https://asc.fasb.org//1943274/2147480008/505-10-S99-1
Reference 3: http://fasb.org/us-gaap/role/ref/legacyRef
-Name Accounting Standards Codification
-Topic 505
-SubTopic 30
-Section 45
-Paragraph 1
-Publisher FASB
-URI https://asc.fasb.org//1943274/2147481549/505-30-45-1
| Name: |
us-gaap_TreasuryStockValueAcquiredCostMethod |
| Namespace Prefix: |
us-gaap_ |
| Data Type: |
xbrli:monetaryItemType |
| Balance Type: |
debit |
| Period Type: |
duration |
|
| X |
- Details
| Name: |
us-gaap_StatementClassOfStockAxis=us-gaap_CommonStockMember |
| Namespace Prefix: |
|
| Data Type: |
na |
| Balance Type: |
|
| Period Type: |
|
|
Resideo Technologies (NYSE:REZI)
과거 데이터 주식 차트
부터 4월(4) 2024 으로 5월(5) 2024

Resideo Technologies (NYSE:REZI)
과거 데이터 주식 차트
부터 5월(5) 2023 으로 5월(5) 2024
