UNITED STATES
SECURITIES AND EXCHANGE COMMISSION
Washington, D.C. 20549
FORM 8-K
CURRENT REPORT
PURSUANT
TO SECTION 13 OR 15(D)
OF THE SECURITIES EXCHANGE ACT OF 1934
Date of Report (Date of earliest event reported): August 10, 2023
Flame Acquisition Corp.
(Exact name of registrant as specified in its charter)
|
|
|
|
|
| Delaware |
|
001-40111 |
|
85-3514078 |
| (State or other jurisdiction
of incorporation) |
|
(Commission
File Number) |
|
(I.R.S. Employer
Identification No.) |
|
|
|
| 700 Milam Street, Suite 3300
Houston, Texas |
|
77002 |
| (Address of Principal Executive Offices) |
|
(Zip Code) |
(713) 579-6106
(Registrant’s telephone number, including area code)
Check the appropriate box below if the Form 8-K is intended to simultaneously satisfy the filing obligation of the registrant under any of the following
provisions:
| |
☐ |
Written communication pursuant to Rule 425 under the Securities Act (17 CFR 230.425) |
| |
☒ |
Soliciting material pursuant to Rule 14a-12 under the Exchange Act (17 CFR 240.14a-12) |
| |
☐ |
Pre-commencement communications pursuant to Rule 14d-2(b) under the Exchange Act (17 CFR 240.14d-2(b))
|
| |
☐ |
Pre-commencements communications pursuant to Rule 13e-4(c) under the Exchange Act (17 CFR 240.13e-4(c))
|
Securities registered pursuant to Section 12(b) of the Act:
|
|
|
|
|
| Title of each class |
|
Trading
Symbol(s) |
|
Name of each exchange
on which registered |
| Units, each consisting of one share of Class A common stock and one-half of one warrant |
|
FLME.U |
|
The New York Stock Exchange |
| Class A common stock, par value $0.0001 per share |
|
FLME |
|
The New York Stock Exchange |
| Warrants, each whole warrant exercisable for one share of Class A common stock at an exercise price of $11.50 per share |
|
FLME.WS |
|
The New York Stock Exchange |
Indicate by check mark whether the registrant is an emerging growth company as defined in Rule 405 of the Securities Act of
1933 (§230.405 of this chapter) or Rule 12b-2 of the Securities Exchange Act of 1934 (§240.12b-2 of this chapter).
Emerging growth company
☒
If an emerging growth company, indicate by check mark if the registrant has elected not to use the extended transition period for complying with
any new or revised financial accounting standards provided pursuant to Section 13(a) of the Exchange Act. ☐
IMPORTANT NOTICES
Additional Information and Where to Find It
This
communication relates to the proposed Business Combination (as defined in the Current Report on Form 8-K filed with the SEC on November 2, 2022) by and among Flame Acquisition Corp. (“Flame”),
Sable Offshore Holdings LLC, a Delaware limited liability company (“Holdco”) and Sable Offshore Corp., a Texas corporation and a wholly owned subsidiary of Holdco (“Sable”). In connection with the proposed Business Combination,
Flame filed with the SEC a preliminary proxy statement on Schedule 14A on November 10, 2022 (as may be amended from time to time, including on December 23, 2022 and January 27, 2023, the “Proxy Statement”). Flame may also
file other documents regarding the proposed Business Combination with the SEC. The Proxy Statement which will be sent or given to the Flame stockholders will contain important information about the proposed Business Combination and related matters.
INVESTORS ARE URGED TO READ THE PROXY STATEMENT (INCLUDING ALL AMENDMENTS AND SUPPLEMENTS THERETO), WHICH IS CURRENTLY AVAILABLE, AND OTHER RELEVANT DOCUMENTS FILED WITH THE SEC IF AND WHEN THEY BECOME AVAILABLE BECAUSE THEY CONTAIN, AND WILL
CONTAIN, IMPORTANT INFORMATION WITH RESPECT TO THE PROPOSED BUSINESS COMBINATION AND THE OTHER TRANSACTIONS CONTEMPLATED BY THE BUSINESS COMBINATION AGREEMENT (AS DEFINED IN THE PROXY STATEMENT). You may obtain a free copy of the Proxy Statement and
other relevant documents filed by Flame with the SEC at the SEC’s website at www.sec.gov. You may also obtain Flame’s documents on its website at www.Flameacq.com.
Participants in the Solicitation
Flame and its directors
and officers may be deemed participants in the solicitation of proxies of Flame’s stockholders in connection with the Business Combination. Flame’s stockholders and other interested persons may obtain, without charge, more detailed
information regarding the directors and officers of Flame in Flame’s Registration Statement on Form S-1, which was initially filed with the SEC on February 5, 2021 and amended on February 18,
2021 and February 22, 2021, in Flame’s Annual Report on Form 10-K for the fiscal year ended December 31, 2022, which was filed with the SEC on March 31, 2023, and in the Proxy Statement.
Information regarding the persons who may, under SEC rules, be deemed participants in the solicitation of proxies of Flame’s stockholders in
connection with the Business Combination and other matters to be voted upon at the special meeting will be set forth in the definitive proxy statement for the Business Combination.
Forward-Looking Statements
This communication contains a number of “forward-looking statements” within the meaning of Section 27A of the Securities Act of 1933, as amended
(the “Securities Act”), and Section 21E of the Securities Exchange Act of 1934, as amended (the “Exchange Act”). Forward-looking statements include information concerning the SYU Assets (as defined in the Proxy Statement),
Sable’s, Holdco’s or Flame’s possible or assumed future results of operations, business strategies, debt levels, competitive position, industry environment, potential growth opportunities and effects of regulation, including
Sable’s ability to close the transaction to acquire the SYU Assets and Flame’s ability to close the transaction with Sable. When used in this communication, including any oral statements made in connection therewith, the words
“could,” “should,” “will,” “ may,” “ believe,” “ anticipate,” “ intend,” “ estimate,” “ expect,” “project,” “continue,” “plan,”
forecast,” “predict,” “potential,” “future,” “outlook,” and “target,” the negative of such terms and other similar expressions are intended to identify forward-looking statements, although not
all forward-looking statements will contain such identifying words. These forward-looking statements are based on Sable’s, Holdco’s and Flame’s management’s current expectations and assumptions about future events and are based
on currently available information as to the outcome and timing of future events. Except as otherwise required by applicable law, Sable, Holdco and Flame disclaim any duty to update any forward-looking statements, all of which are expressly
qualified by the statements in this section, to reflect events or circumstances after the date of this communication. Sable, Holdco and Flame caution you that these forward-looking statements are subject to all of the risks and uncertainties, most
of which are difficult to predict and many of which are beyond the control of Sable and Flame, incidental to the development, production, gathering, transportation and sale of oil, natural gas and natural gas liquids. These risks include, but are
not limited to, (a) the occurrence of any event, change or other circumstance that could give rise to the termination of negotiations and any subsequent definitive agreements with respect to the Business Combination; (b) the outcome of any
legal proceedings that may be instituted against Sable, Holdco, Flame or others following the announcement of the Business Combination and any definitive agreements with respect thereto; (c) the inability to complete the Business Combination
due to the failure to obtain approval of the stockholders of Flame, to obtain financing to complete the Business Combination or to satisfy other conditions to closing the Business Combination; (d) the ability to meet the applicable stock
exchange listing standards following the consummation of the Business Combination; (e) the ability to recommence production of the SYU Assets and the cost and time required therefor, and production levels once recommenced; (f) commodity
price volatility, low prices for oil, natural gas and/or natural gas liquids, global economic conditions, inflation, increased operating costs, lack of availability of drilling and production equipment, supplies, services and qualified personnel,
processing volumes and pipeline throughput; (g) uncertainties related to new technologies, geographical concentration of operations, environmental risks, weather risks, security risks, drilling and other operating risks, regulatory changes and
regulatory risks; (h) the uncertainty inherent in estimating oil and natural gas reserves and in projecting future rates of production; (i) reductions in cash flow and lack of access to capital; (j) Flame’s ability to satisfy
future cash obligations; (k) restrictions in existing or future debt agreements or structured or other financing arrangements; (l) the timing of development expenditures, managing growth and integration of acquisitions, and failure to
realize expected value creation from acquisitions; and (m) the ability to recognize the anticipated benefits of the Business Combination. While forward-looking statements are based on assumptions and analyses that management of Flame, Holdco
and Sable believe to be reasonable under the circumstances, whether actual results and developments will meet such expectations and predictions depends on a number of risks and uncertainties that could cause actual results, performance, and
financial condition to differ materially from such expectations. Any forward-looking statement made in this communication speaks only as of the date on which it is made. Factors or events that could cause actual results to differ may emerge from
time to time, and it is not possible to predict all of them. These forward-looking statements are provided for illustrative purposes only and are not intended to serve as, and must not be relied on by any investor as, a guarantee, an assurance, a
prediction or a definitive statement of fact or probability. You should carefully consider the foregoing factors and the other risks and uncertainties described in the “Risk Factors” section of the Annual Report on Form 10-K, Quarterly Reports on Form 10-Q, Proxy Statement and other documents filed by Flame from time to time with the SEC. These filings identify and address other important
risks and uncertainties that could cause actual events and results to differ materially from those contained in the forward-looking statements. Forward-looking statements speak only as of the date they are made. Readers are cautioned not to put
undue reliance on forward-looking statements, and Flame, Holdco and Sable assume no obligation and do not intend to update or revise these forward-looking statements, whether as a result of new information, future events, or otherwise, except as
required by securities and other applicable laws. Neither Flame, Holdco nor Sable gives any assurance that any of Flame, Holdco, Sable or the combined company will achieve its expectations.
Item 7.01 Regulation FD Disclosure
Furnished as Exhibit 99.1 hereto and incorporated into this Item 7.01 by reference is an investor presentation that Flame and Sable have prepared for use in
presentations to potential PIPE Investors (as defined in the Proxy Statement) and other persons with respect to the proposed Business Combination.
The
statements under this Item 7.01 and Exhibit 99.1 are being furnished pursuant to Item 7.01 and will not be deemed to be filed for purposes of Section 18 of the Exchange Act or otherwise be subject to the liabilities of that section, nor will
they be deemed to be incorporated by reference in any filing under the Securities Act or the Exchange Act.
| Item 9.01. |
Financial Statements and Exhibits. |
|
|
|
| Exhibit No. |
|
Description of Exhibits |
|
|
| 99.1 |
|
Investor Presentation, dated August 10, 2023. |
|
|
| 104 |
|
Cover Page Interactive Data File (embedded within Inline XBRL document) |
SIGNATURE
Pursuant to the requirements of the Securities Exchange Act of 1934, the registrant has duly caused this report to be signed on its behalf by
the undersigned hereunto duly authorized.
|
|
|
|
|
|
|
|
|
|
|
Flame Acquisition Corp. |
|
|
|
|
| Date: August 10, 2023 |
|
|
|
By: |
|
/s/ Gregory D. Patrinely |
|
|
|
|
Name: |
|
Gregory D. Patrinely |
|
|
|
|
Title: |
|
Executive Vice President and Chief
Financial Officer |
Exhibit 99.1 Sable Offshore Corp. Investor Presentation August
2023
Disclaimer CONFIDENTIALITY The information in this presentation,
together with oral statements made in connection herewith, is highly confidential. The distribution of this presentation by an authorized recipient to any other person is unauthorized. Any photocopying, disclosure, reproduction or alteration of the
contents of this presentation and any forwarding of a copy of this presentation or any portion of this presentation to any other person is prohibited. The recipient of this presentation shall keep this presentation and its contents confidential,
shall not use this presentation and its contents for any purpose other than as expressly authorized by Sable Offshore Corp. (“Sable”). By accepting delivery of this presentation, the recipient is deemed to agree to the foregoing
confidentiality requirements and to return or destroy (and direct its representatives to return or destroy) all copies of this presentation or portions thereof in its possession upon request. This presentation has been prepared solely for
informational purposes and is being provided to you solely in your capacity as a prospective investor in considering an investment in Flame Acquisition Corp., (the “SPAC”), which will become the successor to Sable in a business
combination (as defined below) and will be the issuer, in a private placement, of the PIPE securities described in this presentation. This presentation does not purport to contain all of the information that may be required or desired by you in
order to evaluate the investment described in this presentation. This presentation shall not constitute an offer to sell, or the solicitation of an offer to buy, any securities, nor shall there be any sale of securities in any states or
jurisdictions in which such offer, solicitation or sale would be unlawful. Neither the U.S. Securities and Exchange Commission (the “SEC”) nor any securities commission of any other U.S. or non-U.S. jurisdiction has approved or
disapproved of the securities in the proposed PIPE offering or of the proposed business combination as contemplated hereby or determined that this presentation is truthful or complete. Any representation to the contrary is a criminal offense. In all
cases, interested parties should consult their own legal, regulatory, tax, business, financial and accounting advisors to the extent they deem necessary, and must make their own investment decision and perform their own independent investigation and
analysis of the investment described in this presentation. Investors should be aware that they might be required to bear the final risk of their investment for an indefinite period of time. The securities referred to herein have not been registered
under the Securities Act of 1933, as amended (the “Securities Act”), or the securities laws of any other jurisdiction. Unless they are registered, any such securities may be offered and sold only in transactions that are exempt from
registration under the Securities Act and the securities laws of any other jurisdiction. No representations or warranties, express or implied are given in, or in respect of, this presentation and the accuracy, completeness or reliability of the
information contained in this presentation. To the fullest extent permitted by law, in no circumstances will Sable, the SPAC, any bank serving as a placement agent in the proposed PIPE securities or any of their respective subsidiaries, security
holders, affiliates, representatives, partners, directors, officers, employees, advisers, or agents be responsible or liable for any direct, indirect, or consequential loss or loss of profit arising from the use of this presentation, its contents,
its omissions, reliance on the information contained within it, or on opinions communicated in relation thereto or otherwise arising in connection therewith. This information is subject to change. FORWARD LOOKING STATEMENTS The information in this
presentation and the oral statements made in connection therewith include “forward looking statements” within the meaning of Section 27 A of the Securities Act and Section 21 E of the Securities Exchange Act of 1934 as amended.
Forward-looking statements include information concerning assets of Exxon Mobil Corporation's (“Exxon”), Sable's or the SPAC's possible or assumed future results of operations, business strategies, debt levels, competitive position,
industry environment, potential growth opportunities and effects of regulation, including Sable's ability to close the transaction to acquire Exxon's assets (the asset acquisition ), Sable’s ability to close the transaction with Sable Offshore
Holdings, LLC (“HoldCo”) and the SPAC (the “SPAC transaction” and, together with the asset acquisition, the “business combination”). When used in this presentation, including any oral statements made in connection
therewith, the words “could,” “should,” “will,” “ may,” “ believe,” “ anticipate,” “ intend,” “ estimate,” “ expect,” “project,”
“continue,” “plan,” forecast,” “predict,” “potential,” “future,” “outlook,” and “target,” the negative of such terms and other similar expressions are intended
to identify forward looking statements, although not all forward looking statements will contain such identifying words. These forward looking statements are based on Sable’s, HoldCo’s and the SPAC’s management’s current
expectations and assumptions about future events and are based on currently available information as to the outcome and timing of future events. Except as otherwise required by applicable law, Sable, HoldCo and the SPAC disclaim any duty to update
any forward looking statements, all of which are expressly qualified by the statements in this section, to reflect events or circumstances after the date of this presentation. Sable, HoldCo and the SPAC caution you that these forward looking
statements are subject to all of the risks and uncertainties, most of which are difficult to predict and many of which are beyond the control of Sable and the SPAC, incidental to the development, production, gathering, transportation and sale of
oil, natural gas and natural gas liquids. These risks include, but are not limited to, (a) the occurrence of any event, change or other circumstance that could give rise to the termination of negotiations and any subsequent definitive agreements
with respect to the business combination; (b) the outcome of any legal proceedings that may be instituted against Sable, HoldCo, the SPAC or others following the announcement of the business combination and any definitive agreements with respect
thereto; (c) the inability to complete the business combination due to the failure to obtain approval of the shareholders of the SPAC, to obtain financing to complete the business combination or to satisfy other conditions to closing; (d) the
ability to meet the applicable stock exchange listing standards following the consummation of the business combination; (e) the ability to recommence production of the assets acquired in the asset acquisition and the cost and time required therefor,
production levels once recommenced; (f) commodity price volatility, low prices for oil and/or natural gas, global economic conditions, inflation, increased operating costs, lack of availability of drilling and production equipment, supplies,
services and qualified personnel, processing volumes and pipeline throughput; (g) uncertainties related to new technologies, geographical concentration of operations, environmentalrisks, weather risks, security risks, drilling and other operating
risks, regulatory changes and regulatory risks; (h) the uncertainty inherent in estimating oil and natural gas resources and in projecting future rates of production; (i) reductions in cash flow and lack of access to capital; (j) the SPAC’s
ability to satisfy future cash obligations; (k) restrictions in existing or future debt agreements or structured or other financing arrangements; (l) the timing of development expenditures, managing growth and integration of acquisitions, and
failure to realize expected value creation from acquisitions; and (m) the ability to recognize the anticipated benefits of the business combination. Should one or more of the risks or uncertainties described in this presentation and the oral
statements made in connection therewith occur, or should underlying assumptions prove incorrect, actual results and plans could differ materially from those expressed in any forward looking statements. You should also carefully consider the risks
and uncertainties described in the “Risk Factors” section of the SPAC’s Annual Report on Form 10-K, Quarterly Reports on Form 10-Q, preliminary proxy statement on Schedule 14A filed with the SEC on November 10, 2022 (as may be
amended from time to time, including on December 23, 2022 and January 27, 2023), and other documents filed by the SPAC, HoldCo and Sable from time to time with the SEC. These filings identify and address other important risks and uncertainties that
could cause actual events and results to differ materially from those contained in the forward-looking statements. The SPAC’s SEC filings are available publicly on the SEC’s website at www sec gov. 1
Disclaimer (Cont’d) PARTICIPANTS IN A SOLICITATION Sable, the
SPAC, and certain of their respective directors, executive officers and employees may be deemed to be participants in the solicitation of proxies in connection with certain matters related to the business combination and may have direct or indirect
interests in the business combination. Additional information regarding the interests of those persons and other persons who may be deemed participants in the proposed business combination may be obtained by reading the proxy statement relating to
the business combination. Stockholders may obtain free copies of the preliminary proxy statement, the definitive proxy statement and other documents filed with the SEC, once available, without charge, at the SEC’s website located at
www.sec.gov, or by directing a request to Flame Acquisition Corp., 700 Milam Street Suite 3300, Houston, TX 77002. NON-PRODUCING ASSETS The assets that are the subject of the asset acquisition and the business combination have not produced
commercial quantities of hydrocarbons since the assets were shut-in during May of 2015 when the only pipeline transporting hydrocarbons produced from such assets to market ceased operations. We estimate in this presentation that production can be
recommenced by July 1, 2024; however, there can be no assurance that the necessary permits will be obtained that would allow the pipeline to recommence transportation and allow the assets to recommence production by that date or at all. If
production is not recommenced by January 1, 2026, the terms of the asset acquisition with Exxon Mobil Corporation (“Exxon”) would result in the assets, which are expected to be the major assets of the SPAC at the closing of the business
combination, being reverted to Exxon without any compensation to the SPAC therefor as further described in this presentation. OIL AND GAS RESOURCE INFORMATION This presentation includes information regarding estimates of oil and natural gas
resources attributable to the assets that are the subject of the business combination. None of the oil and gas resources attributable to the assets are currently classifiable as proved or other reserves because, since the cessation of operations on
the pipeline transporting production from the assets, there has been no means to deliver production from the assets to market. Sable has obtained a report (the “NSAI Report”) from Netherland, Sewell & Associates, Inc.
(“NSAI”), independent petroleum consultants, with respect to the net estimated contingent resources attributable to the acquired assets and the related pre-tax discounted (at 10%) future net contingent cash flow from such contingent
resources, as of December 31, 2021, based on 12-month unweighted arithmetic average of the first-day-of-the-month prices for each month in the period from January to December 2021. As defined by the Society of Petroleum Engineers and used in the
NSAI Report, “contingent resources” are those quantities of petroleum which are estimated, on a given date, to be potentially recoverable from known accumulations, but which are not currently considered to be commercially recoverable.
Contingent resource estimates may be characterized further as 1C (low estimate), 2C (best estimate) and 3C (high estimate). The contingent resources reflected in the NSAI Report are, as stated in the report, category 1C (low estimate). The NSAI
Report states that the estimates included in the report are contingent on (1) approval from federal, state and local regulators to restart production, (2) reestablishment of oil transportation systems to deliver production to market, and (3)
commitment to restart the wells and facilities. The NSAI Report states that, if these contingencies are successfully addressed, some portion of the contingent resources estimated in the report may be reclassified as reserves but notes that the
estimates have not been risked to account for the possibility that the contingencies are not successfully addressed. The NSAI Report does not address (1) the portion of the contingent resources that could be reclassified as reserves if the
contingencies are successfully addressed or (2) whether or to what extentany of the contingent resources that could be so reclassified would be classified as proved, probable or possible reserves. As defined in the Society of Petroleum
Engineers’ Petroleum Resources Management System (“PRMS”), best estimate is the most realistic assessment of recoverable quantities if only a single result were reported. There is at least a 50% probability that the quantities
actually recovered will equal or exceed the “best estimate.” As defined in the PRMS, low estimate is a conservative estimate of the quantity that will actually be recovered from the accumulation by a project. There is at least a 90%
probability that the quantities actually recovered will equal or exceed the “low estimate.” The resource estimates and related future cash flow information included in this presentation reflect management's estimates, based in part on
the contingent resources estimated in the NSAI Report and supplemented by management's own estimates of contingent resources attributable to the acquired assets and using the pricing and other assumptions noted in this presentation, of the
contingent resources and cash flow that may have been attributable to the acquired assets if the contingencies had been addressed successfully on the date as of which the information is presented. Resource engineering is a process of estimating
underground accumulations of hydrocarbons that cannot be measured in an exact way. The accuracy of any resource or reserve estimate depends on the quality of available data, the interpretation of such data, and price and cost assumptions made by
reserve engineers. In addition, the results of drilling, testing, and production activities may justify revisions of estimates that were made previously. If significant, such revisions could impact the combined company’s strategy and change
the schedule of any production and development drilling. Accordingly, resource estimates may differ significantly from the quantitiesof oil and natural gas that are ultimately recovered. 2
Disclaimer (Cont’d) USE OF PROJECTIONS This presentation contains
financial projections for Sable and the SPAC (as successor to Sable in the business combination) after giving effect to the business combination, including with respect to its future revenues, EBITDA, capital expenditures and non-GAAP cash flow
measures referred to under “Use of Non-GAAP Financial Measures” below. Neither Sable’s nor the SPAC’s auditors have audited, reviewed, compiled or performed any procedures with respect to the projections for the purpose of
their inclusion in this presentation, and, accordingly, no such auditors have expressed an opinion or provided any other form of assurance with respect thereto for the purpose of this presentation. These projections are for illustrative purposes
only and should not be relied upon as being necessarily indicative of future results. The assumptions and estimates underlying the projected informationare inherently uncertain and are subject to a wide variety of significant business, regulatory,
economic and competitive risks and uncertainties that could cause actual results to differ materially from those contained in the projected information. Even if the assumptions and estimates are correct, projections are inherently uncertain due to a
number of factors outside Sable and the SPAC’s control. Accordingly, there can be no assurance that the projected results are indicative of the future performance of the SPAC after completion of the business combination or that actual results
will not differ materially from those presented in the projected information. Inclusion of the projected information in this presentation should not be regarded as a representation by any person, including, without limitation, Sable, the SPAC and
any placement agent, that the results contained in the projected information will be achieved. USE OF NON-GAAP FINANCIAL MEASURES This presentation includes projections for Sable and the SPAC (as successor to Sable in the business combination) of
certain non-GAAP financial measures (including on a forward-looking basis) after giving effect to the business combination, including EBITDA, Unlevered Free Cash Flow, and Levered Free Cash Flow. Sable defines EBITDA as net income before interest
expense, income tax expense and depletion, depreciation and amortization. Sable defines (1) Unlevered Free Cash Flow as EBITDA minus capital expenditures, (2) Levered Free Cash Flow as Unlevered Free Cash Flow minus interest expense, and (3) Net
free cash flow as revenue less operating expenses, taxes, and capital expenditures. Sable believes that these measures are useful to investors for the following reasons. First, Sable believes that these measures may assist investors in evaluating
the SPAC’s projected future performance and ability to pay cash dividends to its stockholders by excluding the impact of items that do not reflect core operating performance or that are not expected to affect the ability of the SPAC to pay
cash dividends to its stockholders. Second, these measures are expected to be used by Sable’s management to assess the SPAC’s performance following completion of the business combination. Sable believes that the future, continuing use of
these non-GAAP financial measures will provide an additional tool for investors to use in evaluating ongoing operating results and trends over various reporting periods on a consistent basis. These non-GAAP financial measures should not be
considered in isolation from, or as an alternative to, financial measures determinedinaccordancewithGAAP. Other companies may calculate these non-GAAP financial measures differently, and therefore such financial measures may not be directly
comparable to similarly tilted measures of other companies. INDUSTRY AND MARKET DATA This presentation has been prepared by Sable and includes market data and other statistical information from sources believed by Sable to be reliable, including
independent industry publications, governmental publications or other published independent sources. Some data is also based on the good faith estimates of Sable, which are derived from their review of internal sources as well as the independent
sources described above. Although Sable believes these sources are reliable, neither Sable, the SPAC nor any placement agent has independently verified the information and can guarantee its accuracy and completeness. TRADEMARKS This presentation may
contain trademarks, service marks, trade names and copyrights of other companies, which are the property of their respective owners, and the SPAC's and Sable's use thereof does not imply an affiliation with, or endorsement by, the owners of such
trademarks, service marks, trade names and copyrights. Solely for convenience, some of the trademarks, service marks, trade names and copyrights referred to in this presentation may be listed without the TM, © or ® symbols, but the SPAC
and Sable will assert, to the fullest extent under applicable law, the rights of the applicable owners, if any, to these trademarks, service marks, trade names and copyrights. 3

Key Transaction Highlights Sable Offshore Corp. (“Sable”)
has entered into an agreement to merge with Flame Acquisition Corp. (“FLME”, “Flame”, or the “Company”). Sable has separately agreed to acquire the Santa Ynez Field and associated assets (“Santa Ynez”,
“SYU”, or the “Acquired Assets”) from ExxonMobil (“Exxon”) Proprietarily sourced, bi-laterally negotiated, and seller financed Santa Ynez Unit Acquisition n Identified by Sable / Flame executives as a
foundational public company Background asset and exclusively negotiated with Exxon st n Purchase price is financed by a 1 Lien Term Loan held by Exxon Santa Ynez is a massive oil-weighted resource n Three offshore platforms located in
federal waters north of Santa Barbara, California High Quality n Wholly owned onshore production treatment facilities Asset n Discovered in 1968 with significant production history n >100 identified infill drilling and step-out
opportunities, along with (1) workovers and ESP installation on existing wellbores Asset re-start process well underway n Facilities well maintained during downtime; ~34 MBoe/d average gross Las Flores Canyon Processing Facility Pathway to
production in 2014 prior to shut-in for pipeline leak Production n March 2020 consent decree establishes path for pipeline restart; permitting process well underway n Target online date of July 2024 Sable management are well-qualified to
operate Santa Ynez (2) Highly-Qualified n Exemplary track record of operating safely in California and offshore Stewards n Demonstrated expertise via numerous awards from state and federal agencies of the Asset n Developing strategy
for carbon capture and underground storage (“CCUS”) leveraging existing infrastructure and access (1) Electric submersible pump. (2) While at Plains Exploration & Production, current Sable management team operated platforms included
Irene at Point Pedernales and Hidalgo, Harvest and Hermosa at Point Arguello. 4
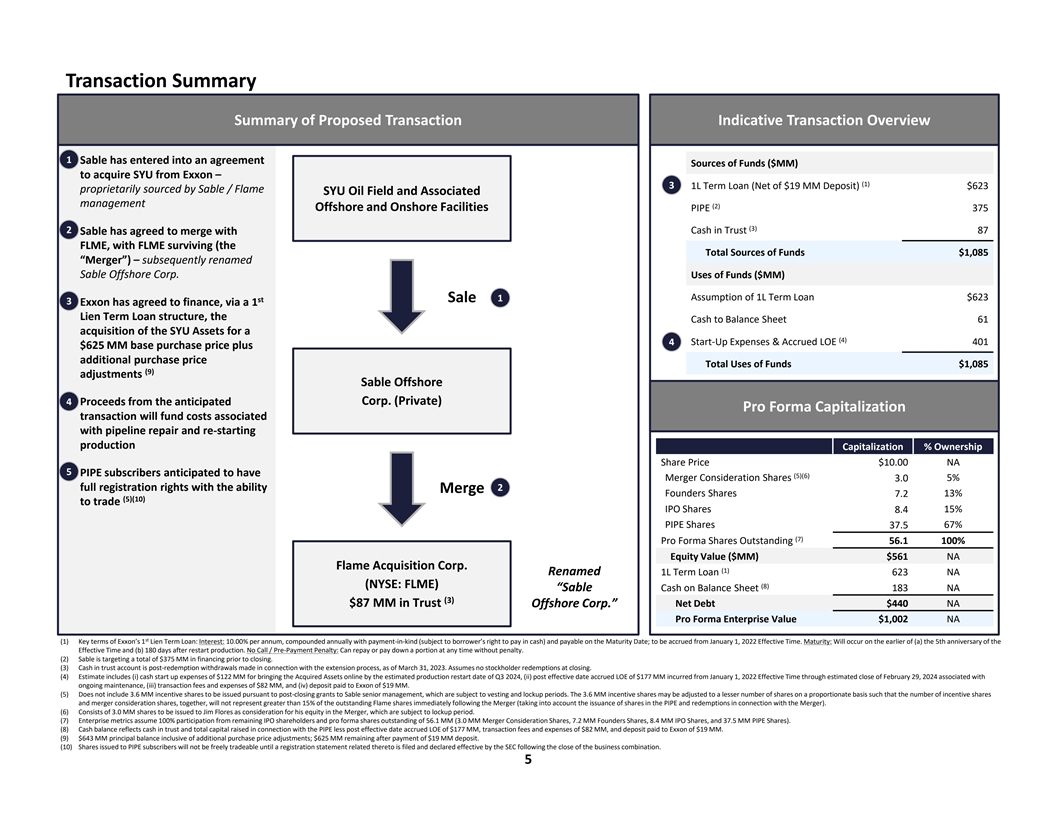
Transaction Summary Summary of Proposed Transaction Indicative
Transaction Overview 1 n Sable has entered into an agreement Sources of Funds ($MM) to acquire SYU from Exxon – (1) 3 1L Term Loan (Net of $19 MM Deposit) $623 proprietarily sourced by Sable / Flame SYU Oil Field and Associated management
(2) Offshore and Onshore Facilities PIPE 375 (3) 2 Cash in Trust 87 n Sable has agreed to merge with FLME, with FLME surviving (the Total Sources of Funds $1,085 “Merger”) – subsequently renamed Sable Offshore Corp. Uses of
Funds ($MM) Assumption of 1L Term Loan $623 1 st Sale 3 n Exxon has agreed to finance, via a 1 Lien Term Loan structure, the Cash to Balance Sheet 61 acquisition of the SYU Assets for a (4) 4 Start-Up Expenses & Accrued LOE 401 $625 MM base
purchase price plus additional purchase price Total Uses of Funds $1,085 (9) adjustments Sable Offshore n 4 Proceeds from the anticipated Corp. (Private) Pro Forma Capitalization transaction will fund costs associated with pipeline repair and
re-starting production Capitalization % Ownership Share Price $10.00 NA 5 n PIPE subscribers anticipated to have (5)(6) Merger Consideration Shares 3.0 5% full registration rights with the ability 2 Merge Founders Shares 7.2 13% (5)(10) to
trade IPO Shares 15% 8.4 PIPE Shares 67% 37.5 (7) Pro Forma Shares Outstanding 56.1 100% Equity Value ($MM) $561 NA Flame Acquisition Corp. (1) Renamed 1L Term Loan 623 NA (NYSE: FLME) (8) “Sable Cash on Balance Sheet 183 NA (3) $87 MM in
Trust Net Debt $440 NA Offshore Corp.” Pro Forma Enterprise Value $1,002 NA st (1) Key terms of Exxon’s 1 Lien Term Loan: Interest: 10.00% per annum, compounded annually with payment-in-kind (subject to borrower’s right to pay in
cash) and payable on the Maturity Date; to be accrued from January 1, 2022 Effective Time. Maturity: Will occur on the earlier of (a) the 5th anniversary of the Effective Time and (b) 180 days after restart production. No Call / Pre-Payment Penalty:
Can repay or pay down a portion at any time without penalty. (2) Sable is targeting a total of $375 MM in financing prior to closing. (3) Cash in trust account is post-redemption withdrawals made in connection with the extension process, as of March
31, 2023. Assumes no stockholder redemptions at closing. (4) Estimate includes (i) cash start up expenses of $122 MM for bringing the Acquired Assets online by the estimated production restart date of Q3 2024, (ii) post effective date accrued LOE of
$177 MM incurred from January 1, 2022 Effective Time through estimated close of February 29, 2024 associated with ongoing maintenance, (iii) transaction fees and expenses of $82 MM, and (iv) deposit paid to Exxon of $19 MM. (5) Does not include 3.6
MM incentive shares to be issued pursuant to post-closing grants to Sable senior management, which are subject to vesting and lockup periods. The 3.6 MM incentive shares may be adjusted to a lesser number of shares on a proportionate basis such that
the number of incentive shares and merger consideration shares, together, will not represent greater than 15% of the outstanding Flame shares immediately following the Merger (taking into account the issuance of shares in the PIPE and redemptions in
connection with the Merger). (6) Consists of 3.0 MM shares to be issued to Jim Flores as consideration for his equity in the Merger, which are subject to lockup period. (7) Enterprise metrics assume 100% participation from remaining IPO shareholders
and pro forma shares outstanding of 56.1 MM (3.0 MM Merger Consideration Shares, 7.2 MM Founders Shares, 8.4 MM IPO Shares, and 37.5 MM PIPE Shares). (8) Cash balance reflects cash in trust and total capital raised in connection with the PIPE less
post effective date accrued LOE of $177 MM, transaction fees and expenses of $82 MM, and deposit paid to Exxon of $19 MM. (9) $643 MM principal balance inclusive of additional purchase price adjustments; $625 MM remaining after payment of $19 MM
deposit. (10) Shares issued to PIPE subscribers will not be freely tradeable until a registration statement related thereto is filed and declared effective by the SEC following the close of the business combination. 5
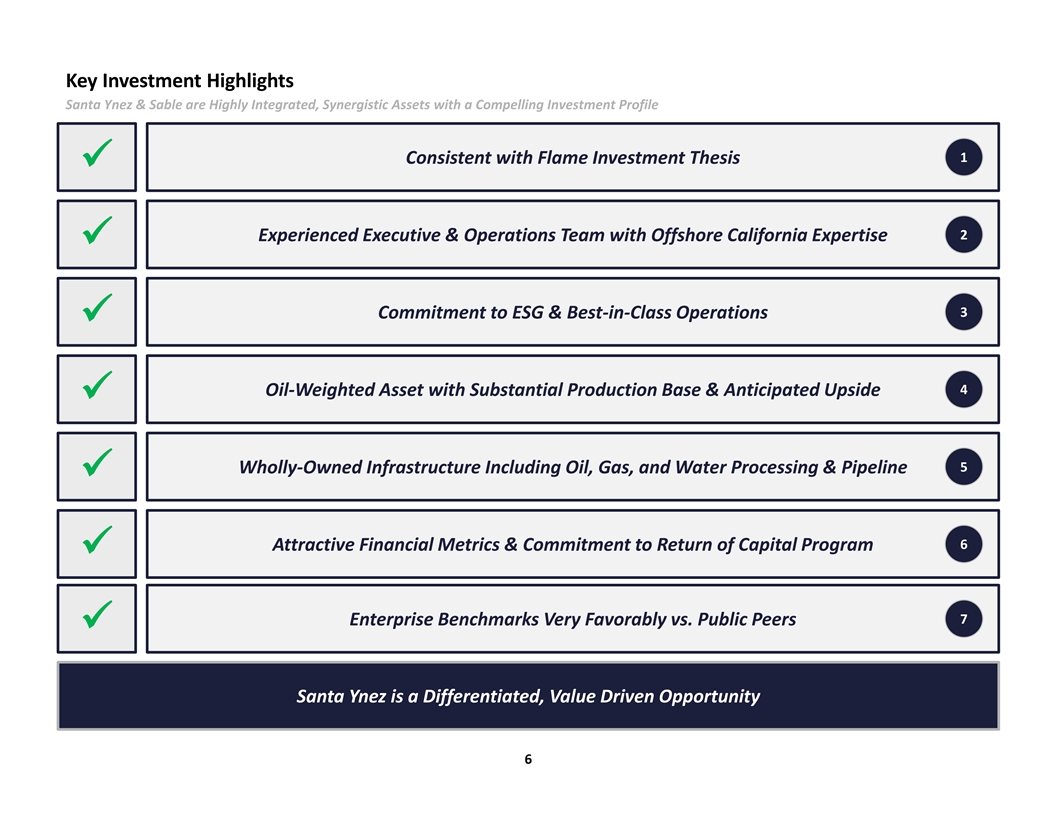
Key Investment Highlights Santa Ynez & Sable are Highly Integrated,
Synergistic Assets with a Compelling Investment Profile 1 Consistent with Flame Investment Thesis ü 2 Experienced Executive & Operations Team with Offshore California Expertise ü 3 Commitment to ESG & Best-in-Class Operations
ü 4 Oil-Weighted Asset with Substantial Production Base & Anticipated Upside ü 5 Wholly-Owned Infrastructure Including Oil, Gas, and Water Processing & Pipeline ü 6 Attractive Financial Metrics & Commitment to Return of
Capital Program ü 7 Enterprise Benchmarks Very Favorably vs. Public Peers ü Santa Ynez is a Differentiated, Value Driven Opportunity 6
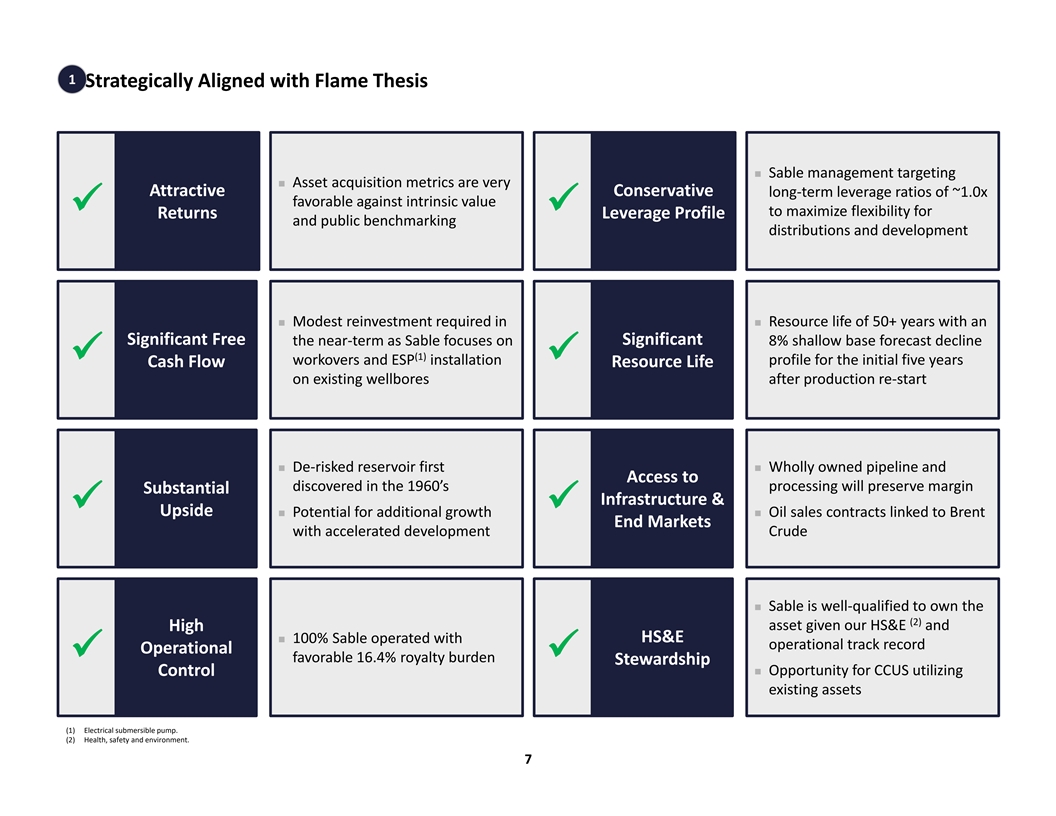
1 Strategically Aligned with Flame Thesis n Sable management
targeting n Asset acquisition metrics are very Attractive Conservative long-term leverage ratios of ~1.0x favorable against intrinsic value üü to maximize flexibility for Returns Leverage Profile and public benchmarking distributions
and development n Modest reinvestment required in n Resource life of 50+ years with an Significant Free the near-term as Sable focuses on Significant 8% shallow base forecast decline (1) ü workovers and ESP installation ü profile
for the initial five years Cash Flow Resource Life on existing wellbores after production re-start n De-risked reservoir first n Wholly owned pipeline and Access to discovered in the 1960’s processing will preserve margin Substantial
Infrastructure & üü Upside n Potential for additional growth n Oil sales contracts linked to Brent End Markets with accelerated development Crude n Sable is well-qualified to own the (2) asset given our HS&E and High
n 100% Sable operated with HS&E operational track record Operational ü favorable 16.4% royalty burdenü Stewardship Controln Opportunity for CCUS utilizing existing assets (1) Electrical submersible pump. (2) Health, safety
and environment. 7

2 Sable – Management Team Sable has Re-Assembled its Premier
Management and Operations Team n Mr. Flores is Sable’s founder and has served as the Chairman and Chief Executive Officer since its inception Jim Flores n From May 2017 until February 2021, Mr. Flores served as Chairman, Chief
Executive Officer and President of Sable Permian Resources n Prior to Sable Permian Resources, Mr. Flores served as Vice Chairman of Freeport-McMoRan, Inc. and CEO of Freeport-McMoRan Oil & Gas, a Chairman of wholly owned subsidiary of
Freeport-McMoRan Inc. the Board n From 2001 until 2013, Mr. Flores was the Chairman, CEO and President of Plains Exploration & Production Company and Chairman and CEO and Chief of Plains Resources Inc. Executive n Mr. Flores founded
and oversaw the IPO of Flores & Rucks, renamed Ocean Energy, and served multiple offices including President, CEO, Officer Vice Chair and Chairman through 2001 n Mr. Patrinely has served as the Chief Financial Officer of Sable since its
inception Gregory n From June 2018 until February 2021, Mr. Patrinely served as Executive Vice President and Chief Financial Officer of Sable Permian Resources Patrinely n Mr. Patrinely previously served as Treasurer for Sable Permian
Resources, from May 2017 to June 2018, where he oversaw the financial Chief analysis and execution of refinancing, restructuring and acquisition efforts Financial n Prior to Sable Permian Resources, Mr. Patrinely was a Manager in the
Acquisitions & Divestments Group of Freeport-McMoRan Oil & Gas, a Officer wholly owned subsidiary of Freeport-McMoRan Inc. Sable Organizational Structure Jim Flores Chairman and CEO Management Team Caldwell Flores Doss Bourgeois Gregory
Patrinely Anthony Duenner President Chief Operating Officer Chief Financial Officer General Counsel 8
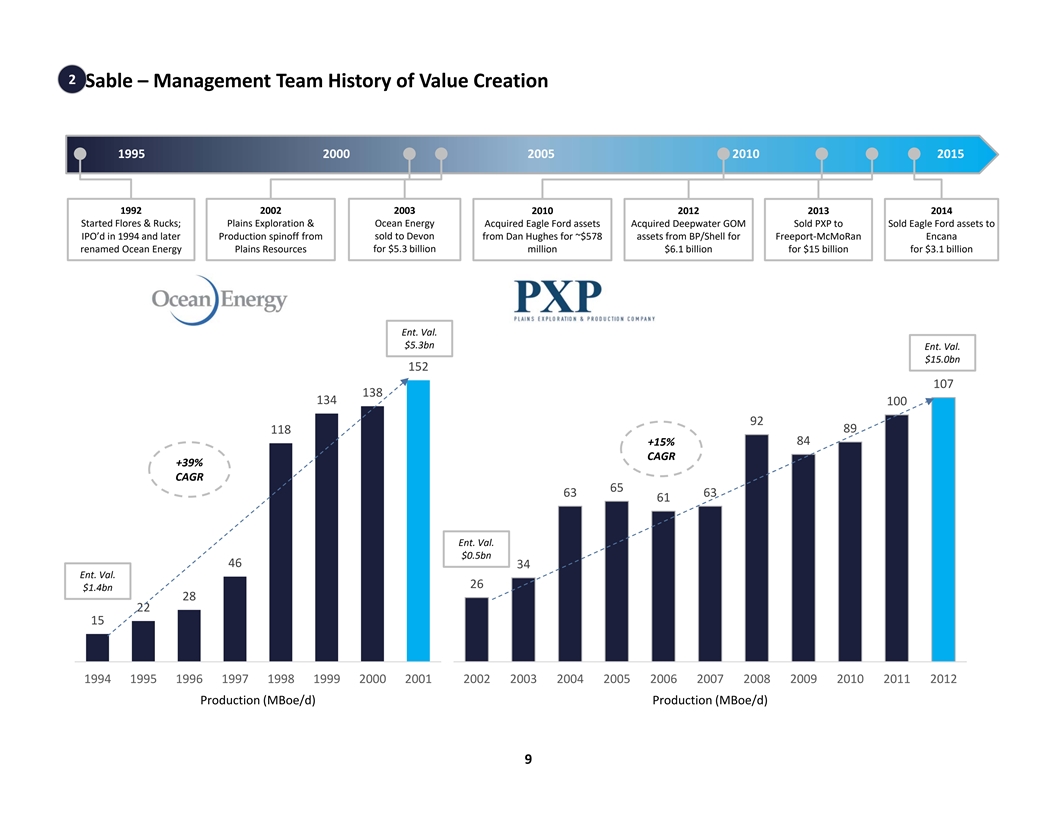
2 Sable – Management Team History of Value Creation 1995 2000
2005 2010 2015 1992 2002 2003 2010 2012 2013 2014 Started Flores & Rucks; Plains Exploration & Ocean Energy Acquired Eagle Ford assets Acquired Deepwater GOM Sold PXP to Sold Eagle Ford assets to IPO’d in 1994 and later Production
spinoff from sold to Devon from Dan Hughes for ~$578 assets from BP/Shell for Freeport-McMoRan Encana renamed Ocean Energy Plains Resources for $5.3 billion million for $15 billion for $3.1 billion $6.1 billion Ent. Val. $5.3bn Ent. Val. $15.0bn 152
107 138 134 100 92 118 89 +15% 84 CAGR +39% CAGR 65 63 63 61 Ent. Val. $0.5bn 46 34 Ent. Val. 26 $1.4bn 28 22 15 1994 1995 1996 1997 1998 1999 2000 2001 2002 2003 2004 2005 2006 2007 2008 2009 2010 2011 2012 Production (MBoe/d) Production (MBoe/d)
9
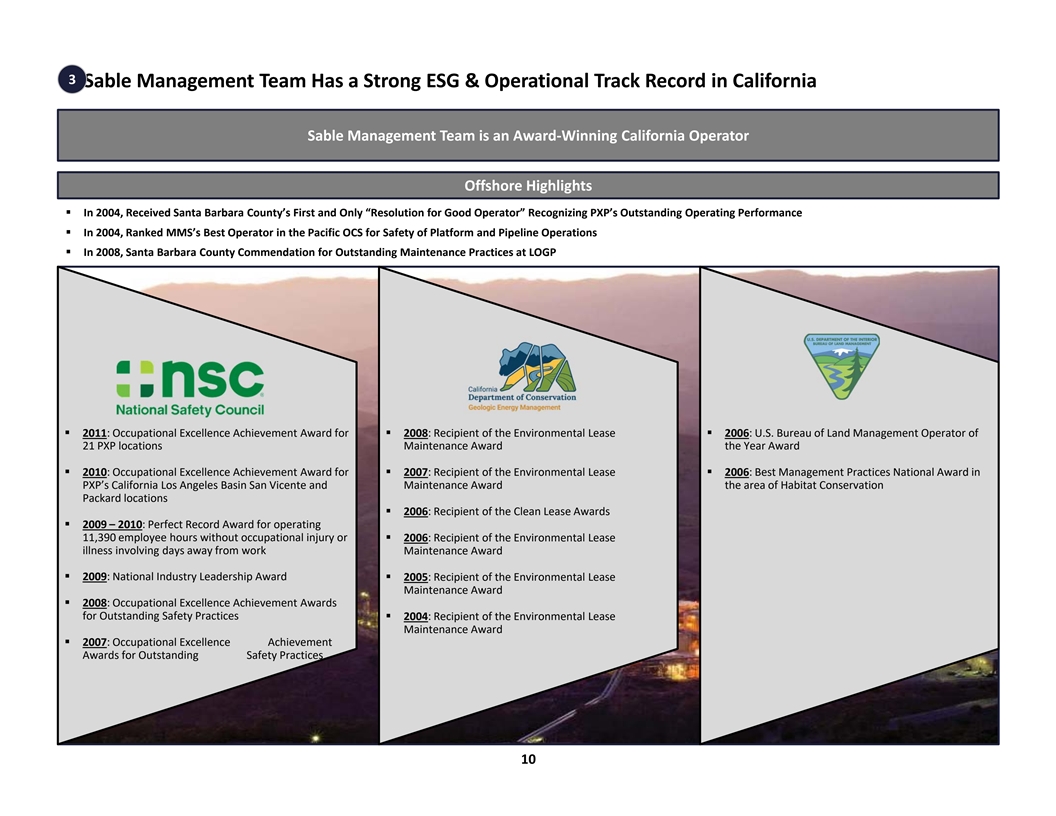
3 Sable Management Team Has a Strong ESG & Operational Track Record
in California Sable Management Team is an Award-Winning California Operator Offshore Highlights § In 2004, Received Santa Barbara County’s First and Only “Resolution for Good Operator” Recognizing PXP’s Outstanding
Operating Performance § In 2004, Ranked MMS’s Best Operator in the Pacific OCS for Safety of Platform and Pipeline Operations § In 2008, Santa Barbara County Commendation for Outstanding Maintenance Practices at LOGP § 2011:
Occupational Excellence Achievement Award for § 2008: Recipient of the Environmental Lease § 2006: U.S. Bureau of Land Management Operator of 21 PXP locations Maintenance Award the Year Award § 2010: Occupational Excellence
Achievement Award for § 2007: Recipient of the Environmental Lease § 2006: Best Management Practices National Award in PXP’s California Los Angeles Basin San Vicente and Maintenance Award the area of Habitat Conservation Packard
locations § 2006: Recipient of the Clean Lease Awards § 2009 – 2010: Perfect Record Award for operating 11,390 employee hours without occupational injury or § 2006: Recipient of the Environmental Lease illness involving days
away from work Maintenance Award § 2009: National Industry Leadership Award § 2005: Recipient of the Environmental Lease Maintenance Award § 2008: Occupational Excellence Achievement Awards for Outstanding Safety Practices§ 2004:
Recipient of the Environmental Lease Maintenance Award § 2007: Occupational Excellence Achievement Awards Awards f for or O Outstanding utstanding Safety Safety Practices Practices 10
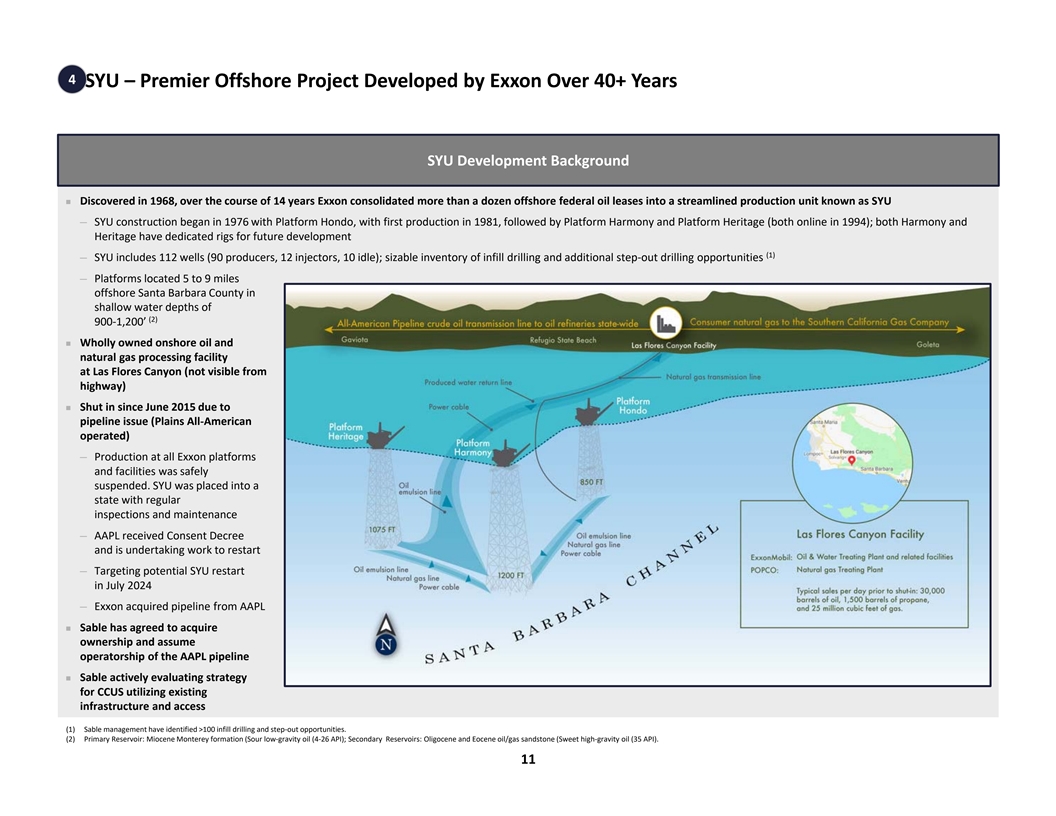
4 SYU – Premier Offshore Project Developed by Exxon Over 40+
Years SYU Development Background n Discovered in 1968, over the course of 14 years Exxon consolidated more than a dozen offshore federal oil leases into a streamlined production unit known as SYU ─ SYU construction began in 1976 with
Platform Hondo, with first production in 1981, followed by Platform Harmony and Platform Heritage (both online in 1994); both Harmony and Heritage have dedicated rigs for future development (1) ─ SYU includes 112 wells (90 producers, 12
injectors, 10 idle); sizable inventory of infill drilling and additional step-out drilling opportunities ─ Platforms located 5 to 9 miles offshore Santa Barbara County in shallow water depths of (2) 900-1,200’ n Wholly owned onshore
oil and natural gas processing facility at Las Flores Canyon (not visible from highway) n Shut in since June 2015 due to pipeline issue (Plains All-American Pipeline (“AAPL”) operated) ─ Production at all Exxon platforms and
facilities was safely suspended. SYU was placed into a preserved state with regular inspections and maintenance ─ AAPL received Consent Decree and is undertaking work to restart ─ Targeting potential SYU restart in July 2024 ─
Exxon acquired pipeline from AAPL n Sable has agreed to acquire ownership and assume operatorship of the AAPL pipeline n Sable actively evaluating strategy for CCUS utilizing existing infrastructure and access (1) Sable management have
identified >100 infill drilling and step-out opportunities. (2) Primary Reservoir: Miocene Monterey formation (Sour low-gravity oil (4-26 API); Secondary Reservoirs: Oligocene and Eocene oil/gas sandstone (Sweet high-gravity oil (35 API).
11
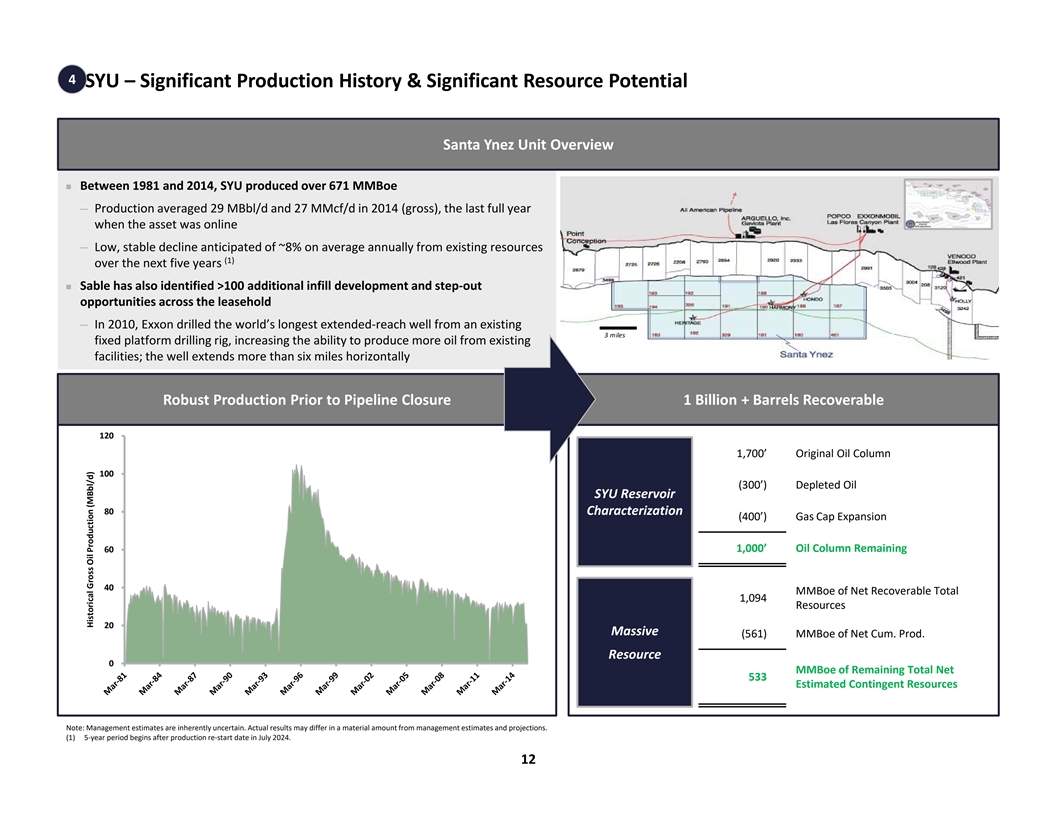
4 SYU – Significant Production History & Significant Resource
Potential Santa Ynez Unit Overview n Between 1981 and 2014, SYU produced over 671 MMBoe ─ Production averaged 29 MBbl/d and 27 MMcf/d in 2014 (gross), the last full year when the asset was online ─ Low, stable decline anticipated of
~8% on average annually from existing resources (1) over the next five years n Sable has also identified >100 additional infill development and step-out opportunities across the leasehold ─ In 2010, Exxon drilled the world’s
longest extended-reach well from an existing 3 miles fixed platform drilling rig, increasing the ability to produce more oil from existing facilities; the well extends more than six miles horizontally Robust Production Prior to Pipeline Closure 1
Billion + Barrels Recoverable 120 1,700’ Original Oil Column 100 (300’) Depleted Oil SYU Reservoir 80 Characterization (400’) Gas Cap Expansion 60 1,000’ Oil Column Remaining 40 MMBoe of Net Recoverable Total 1,094 Resources
20 Massive (561) MMBoe of Net Cum. Prod. Resource 0 MMBoe of Remaining Total Net 533 Estimated Contingent Resources Note: Management estimates are inherently uncertain. Actual results may differ in a material amount from management estimates and
projections. (1) 5-year period begins after production re-start date in July 2024. 12 Historical Gross Oil Production (MBbl/d)
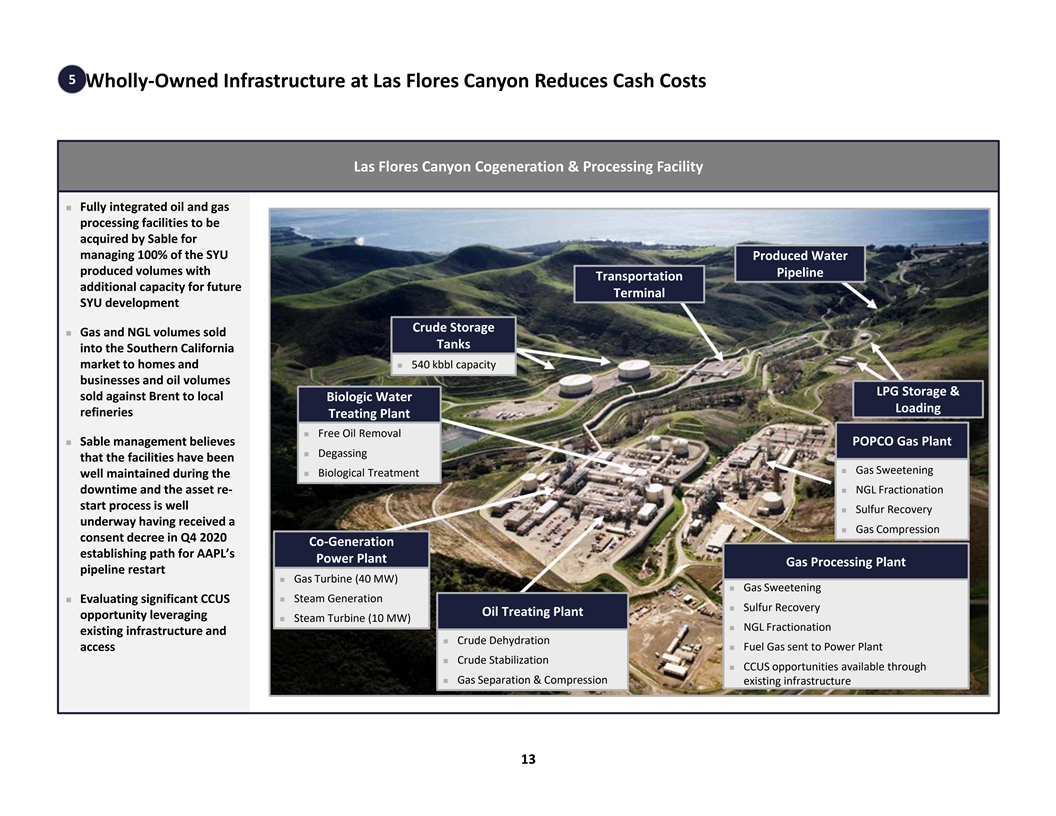
5 Wholly-Owned Infrastructure at Las Flores Canyon Reduces Cash Costs
Las Flores Canyon Cogeneration & Processing Facility n Fully integrated oil and gas processing facilities to be acquired by Sable for managing 100% of the SYU Produced Water produced volumes with Pipeline Transportation additional capacity
for future Terminal SYU development Crude Storage n Gas and NGL volumes sold Tanks into the Southern California market to homes and n 540 kbbl capacity businesses and oil volumes LPG Storage & sold against Brent to local Biologic Water
Loading refineries Treating Plant n Free Oil Removal n Sable management believes POPCO Gas Plant n Degassing that the facilities have been n Gas Sweetening well maintained during the n Biological Treatment downtime and the
asset re-n NGL Fractionation start process is well n Sulfur Recovery underway having received a n Gas Compression consent decree in Q4 2020 Co-Generation establishing path for AAPL’s Power Plant Gas Processing Plant pipeline
restart n Gas Turbine (40 MW) n Gas Sweetening n Evaluating significant CCUS n Steam Generation n Sulfur Recovery Oil Treating Plant opportunity leveraging n Steam Turbine (10 MW) n NGL Fractionation existing
infrastructure and n Crude Dehydration accessn Fuel Gas sent to Power Plant n Crude Stabilization n CCUS opportunities available through n Gas Separation & Compression existing infrastructure 13

6 Substantial Run-Rate Cash Flow Generation Once SYU Re-Start is
Complete… Ability to Implement a Robust Shareholder Return Policy Once SYU is Online (1) Forecast & Financial Summary Overview of Financial Projections – “Run Rate” Annual Cash Flow (2) Strip $90 / $4.50 $80.00 / $4.50
n Run-Rate period reflects the first 12 months after production Benchmark Price ($ / Bbl) $79.37 $90.00 $80.00 re-start, which is July 2024 through June 2025 Benchmark Price ($ / MMBtu) $6.48 $4.50 $4.50 n Sable management anticipate
initial production rates of 28.2 Oil Production (MMBoe) 9 9 9 MBoe/d based upon historic production, reservoir Gas Production (Bcf) 9 9 9 characteristics, and precedent shut-in events NGL Production (MMBoe) 0 0 0 n Base forecast production
decline of ~8% per annum for the Total Production (MMBoe) 10 10 10 initial five years after production re-start based upon Daily Rate (MBoe/d) 28.2 28.2 28.2 management forecast; NSAI decline forecast of ~8% % Oil 85% 85% 85% n Management
capital forecast assumes ~$27 MM of annual Oil Revenue $651 $744 $657 ESP capex in first three years of production, along with ~$5 Gas Revenue 59 42 42 MM of annual average capex attributable to the workover NGL Revenue 4 4 4 program over the same
period; ~$36 MM of annual average Total Revenue $714 $790 $703 capex attributable to sidetrack drilling beginning one year Production Expenses (168) (168) (168) (5) after production start Production Taxes (6) (6) (6) n Asset generates
significant free cash flow and Sable General & Administrative (38) (38) (38) anticipates implementing a robust dividend policy once the Interest Expense (83) (83) (83) asset is online Depreciation Expense (0) (0) (0) Income Taxes (0) (0) (0)
n As part of the acquisition and asset re-start, Sable will have Net Income $419 $495 $408 a large NOL that will limit corporate cash taxes in the near- Interest Expense 83 83 83 term Depreciation Expense 0 0 0 n Sable management also
plans to implement a hedging Income Taxes 0 0 0 strategy after production restarts that caps downside and (3) EBITDA $502 $578 $491 (7) preserves upside (4) Pro Forma Enterprise Value / EBITDA 2.0x 1.7x 2.0x (5) Capital Expenditures (30) (30) (30)
(8) (3) Pre-Production Estimated Costs & Expenses ($MM) Unlevered Free Cash Flow $472 $548 $461 (9) Operating Expenses $20 Interest Expense (83) (83) (83) (3) (9) General & Administrative 12 Levered Free Cash Flow $389 $465 $378 (10) (6)
Pipeline Repair and Restart 90 Total Debt $623 $623 $623 Total Debt / Run-Rate EBITDA 1.2x 1.1x 1.3x Total Pre-Production Costs & Expenses $122 Note: Sable metrics are based on management estimates. Management estimates are inherently uncertain.
Actual results may differ in a material amount from management estimates and projections. (1) Estimated re-start date of July 2024. Run-rate period reflects 12 months of cash flows following production re-start, which is July 2024 through June 2025.
In $MM unless otherwise noted. (2) 2024 monthly NYMEX Brent Crude and Socal Citygate pricing as of July 31, 2023. (3) Sable defines EBITDA as net income before interest expense, income tax expense and depletion, depreciation and amortization. Sable
defines Unlevered Free Cash Flow as EBITDA minus capital expenditures. Sable defines Levered Free Cash Flow as Unlevered Free Cash Flow minus interest expense. (4) Pro Forma Enterprise Value (“TEV”) metrics assume 100% participation from
remaining IPO shareholders, $375 MM in PIPE financing and pro forma shares outstanding of 56.1 MM (3.0 MM Merger Consideration Shares, 7.2 MM Founders Shares, 8.4 MM IPO Shares, and 37.5 MM PIPE Shares), and $10.00 per share. (5) Sable management
anticipates near-term capital expenditures will be focused on workovers and ESP installation to improve production from existing producing wellbores. st (6) Reflects initial balance of the Exxon 1 Lien Term Loan less $19 MM deposit. (7) Hedge plan
likely to consist of costless deferred premium put spread / 3-way collar strategy. Hedging strategy is consistent with Sable management prior experience. (8) Estimated costs for the period prior to production re-start in July 2024. Excludes post
effective date accrued LOE of $177 MM post Effective Time incurred from January 1, 2022 effective date associated with ongoing maintenance, transaction fees and expenses of $82 MM, and deposit paid to Exxon of $19 MM. (9) Estimated pre-production
opex from March 1, 2024 through June 30, 2024. G&A estimate reflects the same time period. (10) Estimated pipeline repair and restart accrued prior to production start date. 14

7 …& Attractive Valuation Relative to Peer Group (1) (2)
Category Acquired Asset Metric PF Multiple Peer Average st 1 Full Year Unlevered Free (4) (5) Highest Yield of the Peer Group $472 MM 47% 17% (3) Cash Flow Yield (%) st 42% Discount to Peer Group TEV / 1 Full Year (4) (5) $502 MM 2.0x 3.5x (3) on
TEV / EBITDA EBITDA NSAI Adjusted Low Estimate (1) (6) Deep Discount to Intrinsic Value Base $1,728 MM 1.7x NA Forecast PV-10 / TEV TEV / 66% Discount to Peer Group NSAI Adjusted Low Estimate (8) 133 MMBoe $7.53 $22.32 (7) on PDP Reserves Base
Contingent Resources ($/Boe) TEV / 26% Discount to Peer Group (9) 28.2 MBoe/d $35,493 $48,087 on Net Production Net Production ($/MBoe/d) Note: Sable metrics assume NYMEX Brent and Socal Citygate Pricing as of July 31, 2023 and effective date of
January 1, 2022, and are based on management estimates. Management estimates are inherently uncertain. Actual results may differ in a material amount from management estimates and projections. Sable TEV assumes 100% participation from remaining IPO
shareholders and pro forma shares outstanding of 56.1 MM (3.0 MM Merger Consideration Shares, 7.2 MM Founders Shares, 8.4 MM IPO Shares, and 37.5 MM PIPE Shares). (1) Assumes NYMEX Brent and Socal Citygate Pricing as of July 31, 2023. (5) Reflects
2024E metrics. (2) Peer group includes: BRY, CHRD, CIVI, CRC, KOS, MGY, MUR, TALO and WTI as of July 31, 2023. (6) Peer group does not disclose PDP PV-10 metrics at a similar pricing and effective date. (3) Sable defines EBITDA as net income before
interest expense, income tax expense and depletion, depreciation and amortization. Sable defines Unlevered Free Cash (7) Peer metrics assume PDP and Sable estimates are based on Low Estimate Contingent Resources. Flow as EBITDA minus capital
expenditures. (8) NYMEX SEC category for nonproducing reserves is contingent; NSAI estimate increased due to extension (4) Reflects cash flows from first 12 months online: July 2024 – June 2025. of field life with development drilling program
and management estimated LOE. 15 (9) Reflects July 2024 through June 2025 production.
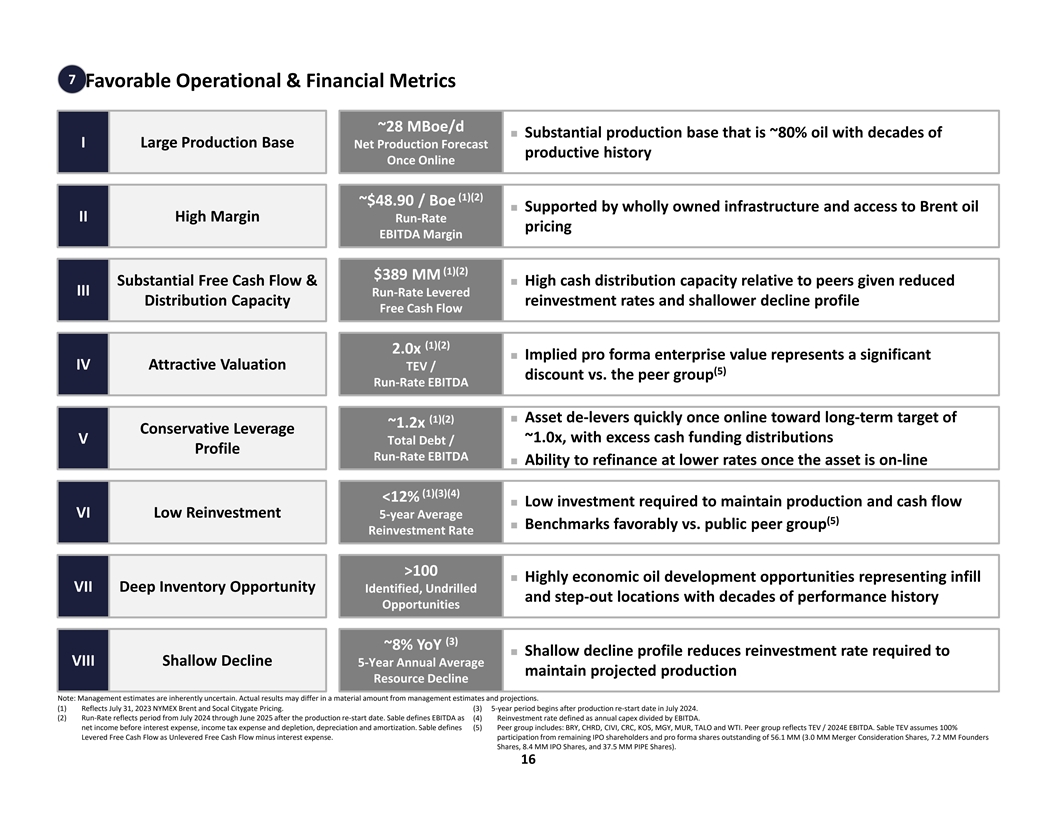
7 Favorable Operational & Financial Metrics ~28 MBoe/d n
Substantial production base that is ~80% oil with decades of I Large Production Base Net Production Forecast productive history Once Online (1)(2) ~$48.90 / Boe n Supported by wholly owned infrastructure and access to Brent oil II High Margin
Run-Rate pricing EBITDA Margin (1)(2) $389 MM Substantial Free Cash Flow & n High cash distribution capacity relative to peers given reduced III Run-Rate Levered Distribution Capacity reinvestment rates and shallower decline profile Free
Cash Flow (1)(2) 2.0x n Implied pro forma enterprise value represents a significant IV Attractive Valuation TEV / (5) discount vs. the peer group Run-Rate EBITDA (1)(2)n Asset de-levers quickly once online toward long-term target of ~1.2x
Conservative Leverage ~1.0x, with excess cash funding distributions V Total Debt / Profile Run-Rate EBITDA n Ability to refinance at lower rates once the asset is on-line (1)(3)(4) <12% n Low investment required to maintain production
and cash flow VI Low Reinvestment 5-year Average (5) n Benchmarks favorably vs. public peer group Reinvestment Rate >100 n Highly economic oil development opportunities representing infill VII Deep Inventory Opportunity Identified,
Undrilled and step-out locations with decades of performance history Opportunities (3) ~8% YoY n Shallow decline profile reduces reinvestment rate required to VIII Shallow Decline 5-Year Annual Average maintain projected production Resource
Decline Note: Management estimates are inherently uncertain. Actual results may differ in a material amount from management estimates and projections. (1) Reflects July 31, 2023 NYMEX Brent and Socal Citygate Pricing. (3) 5-year period begins after
production re-start date in July 2024. (2) Run-Rate reflects period from July 2024 through June 2025 after the production re-start date. Sable defines EBITDA as (4) Reinvestment rate defined as annual capex divided by EBITDA. net income before
interest expense, income tax expense and depletion, depreciation and amortization. Sable defines (5) Peer group includes: BRY, CHRD, CIVI, CRC, KOS, MGY, MUR, TALO and WTI. Peer group reflects TEV / 2024E EBITDA. Sable TEV assumes 100% Levered Free
Cash Flow as Unlevered Free Cash Flow minus interest expense. participation from remaining IPO shareholders and pro forma shares outstanding of 56.1 MM (3.0 MM Merger Consideration Shares, 7.2 MM Founders Shares, 8.4 MM IPO Shares, and 37.5 MM PIPE
Shares). 16

Additional Detail
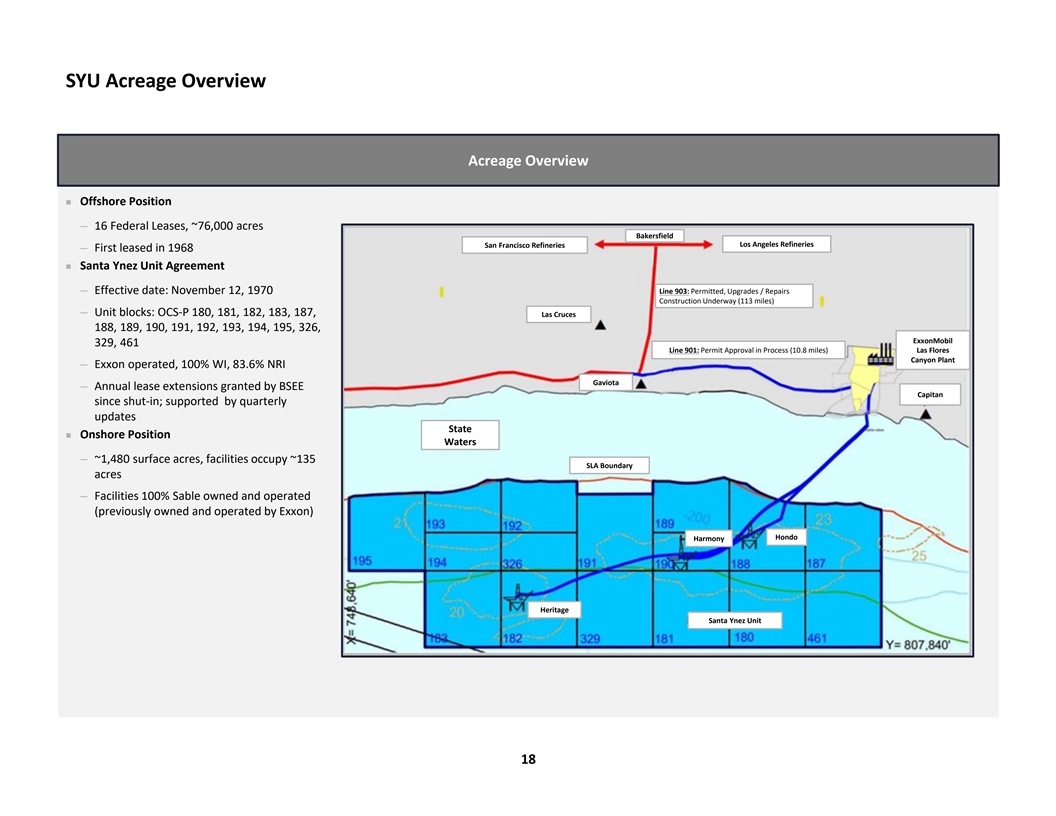
SYU Acreage Overview Acreage Overview n Offshore Position ─
16 Federal Leases, ~76,000 acres Bakersfield Los Angeles Refineries San Francisco Refineries ─ First leased in 1968 n Santa Ynez Unit Agreement ─ Effective date: November 12, 1970 Line 903: Permitted, Upgrades / Repairs Construction
Underway (113 miles) ─ Unit blocks: OCS-P 180, 181, 182, 183, 187, Las Cruces 188, 189, 190, 191, 192, 193, 194, 195, 326, ExxonMobil 329, 461 Line 901: Permit Approval in Process (10.8 miles) Las Flores Canyon Plant ─ Exxon operated,
100% WI, 83.6% NRI Gaviota ─ Annual lease extensions granted by BSEE Capitan since shut-in; supported by quarterly updates State n Onshore Position Waters ─ ~1,480 surface acres, facilities occupy ~135 SLA Boundary acres ─
Facilities 100% Sable owned and operated (previously owned and operated by Exxon) Hondo Harmony Heritage Santa Ynez Unit 18
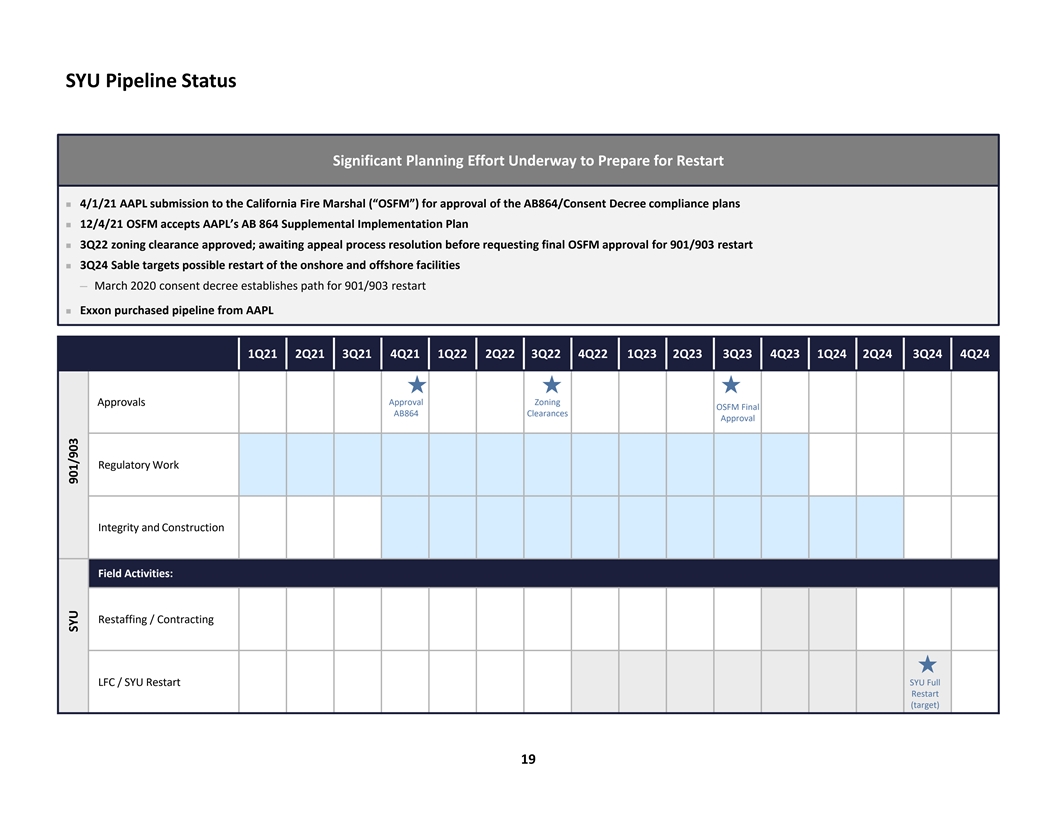
SYU Pipeline Status Significant Planning Effort Underway to Prepare for
Restart n 4/1/21 AAPL submission to the California Fire Marshal (“OSFM”) for approval of the AB864/Consent Decree compliance plans n 12/4/21 OSFM accepts AAPL’s AB 864 Supplemental Implementation Plan n 3Q22 zoning
clearance approved; awaiting appeal process resolution before requesting final OSFM approval for 901/903 restart n 3Q24 Sable targets possible restart of the onshore and offshore facilities ─ March 2020 consent decree establishes path for
901/903 restart n Exxon purchased pipeline from AAPL 1Q21 2Q21 3Q21 4Q21 1Q22 2Q22 3Q22 4Q22 1Q23 2Q23 3Q23 4Q23 1Q24 2Q24 3Q24 4Q24 Approval Zoning Approvals OSFM Final AB864 Clearances Approval Regulatory Work Integrity and Construction Field
Activities: Restaffing / Contracting SYU Full LFC / SYU Restart Restart (target) 19 SYU 901/903

Undrilled Inventory Overview New Drill Inventory Overview n SYU
comprises several discrete fault bound accumulations; compartments defined by pressure compartments n 2015 analysis identified step out potential for untested fault compartments or sub accumulations ─ Technical opportunity inventory based
on spacing assumptions range from 20–80 acres (102 total opportunities) ─ For every platform, more opportunities exist than available donor wellbores at current spacing assumptions (i.e., slot-constrained) Hondo Harmony Heritage 13°
API Elevation 2014/2015 Campaign Drillwell Infill / Step-Out Drilling Opportunity Success Case Step-Out Offset Opportunity Being Matured for Drilling Prior To Shut in 20
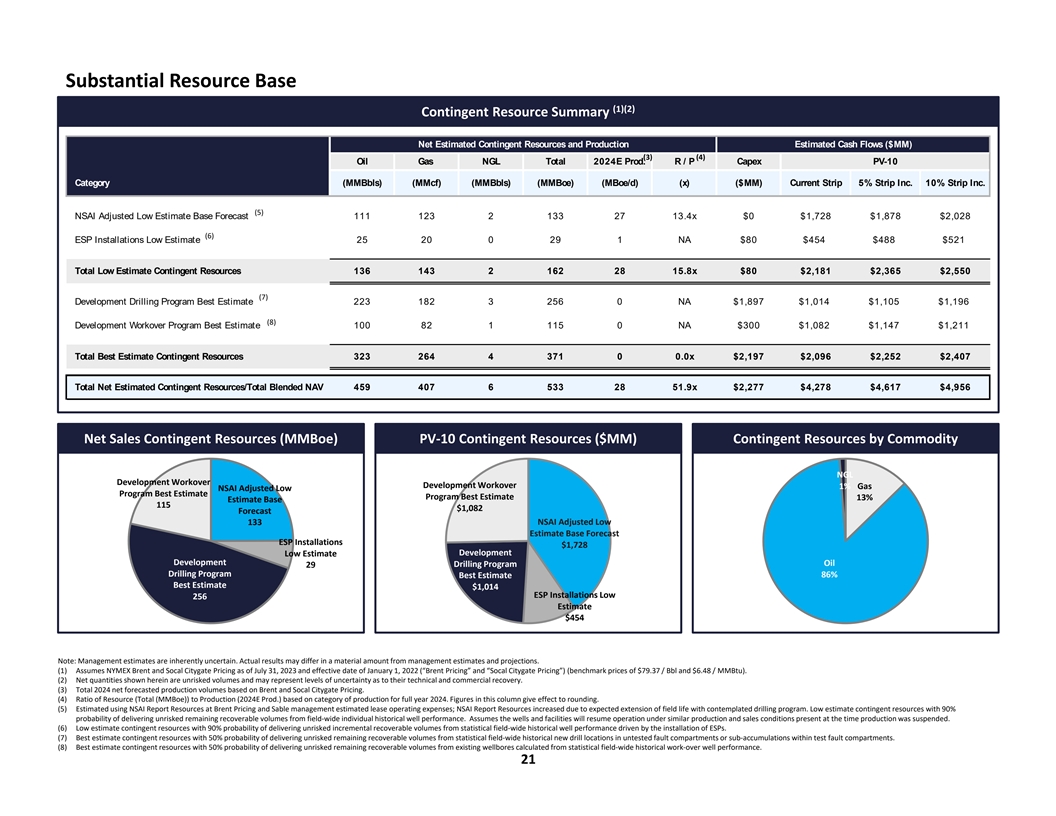
Substantial Resource Base (1)(2) Contingent Resource Summary Net
Estimated Contingent Resources and Production Estimated Cash Flows ($MM) (3) (4) Oil Gas NGL Total 2024E Prod. R / P Capex PV-10 Category (MMBbls) (MMcf) (MMBbls) (MMBoe) (MBoe/d) (x) ($MM) Current Strip 5% Strip Inc. 10% Strip Inc. (5) NSAI
Adjusted Low Estimate Base Forecast 111 123 2 133 27 13.4x $0 $1,728 $1,878 $2,028 (6) ESP Installations Low Estimate 25 20 0 29 1 NA $80 $454 $488 $521 Total Low Estimate Contingent Resources 136 143 2 162 28 15.8x $80 $2,181 $2,365 $2,550 (7)
Development Drilling Program Best Estimate 223 182 3 256 0 NA $1,897 $1,014 $1,105 $1,196 (8) Development Workover Program Best Estimate 100 82 1 115 0 NA $300 $1,082 $1,147 $1,211 Total Best Estimate Contingent Resources 323 264 4 371 0 0.0x $2,197
$2,096 $2,252 $2,407 Total Net Estimated Contingent Resources/Total Blended NAV 459 407 6 533 28 51.9x $2,277 $4,278 $4,617 $4,956 Net Sales Contingent Resources (MMBoe) PV-10 Contingent Resources ($MM) Contingent Resources by Commodity NGL
Development Workover Development Workover 1% Gas NSAI Adjusted Low Program Best Estimate Program Best Estimate 13% Estimate Base 115 $1,082 Forecast 133 NSAI Adjusted Low Estimate Base Forecast ESP Installations $1,728 Development Low Estimate
Development Drilling Program Oil 29 Drilling Program 86% Best Estimate Best Estimate $1,014 ESP Installations Low 256 Estimate $454 Note: Management estimates are inherently uncertain. Actual results may differ in a material amount from management
estimates and projections. (1) Assumes NYMEX Brent and Socal Citygate Pricing as of July 31, 2023 and effective date of January 1, 2022 (“Brent Pricing” and “Socal Citygate Pricing”) (benchmark prices of $79.37 / Bbl and
$6.48 / MMBtu). (2) Net quantities shown herein are unrisked volumes and may represent levels of uncertainty as to their technical and commercial recovery. (3) Total 2024 net forecasted production volumes based on Brent and Socal Citygate Pricing.
(4) Ratio of Resource (Total (MMBoe)) to Production (2024E Prod.) based on category of production for full year 2024. Figures in this column give effect to rounding. (5) Estimated using NSAI Report Resources at Brent Pricing and Sable management
estimated lease operating expenses; NSAI Report Resources increased due to expected extension of field life with contemplated drilling program. Low estimate contingent resources with 90% probability of delivering unrisked remaining recoverable
volumes from field-wide individual historical well performance. Assumes the wells and facilities will resume operation under similar production and sales conditions present at the time production was suspended. (6) Low estimate contingent resources
with 90% probability of delivering unrisked incremental recoverable volumes from statistical field-wide historical well performance driven by the installation of ESPs. (7) Best estimate contingent resources with 50% probability of delivering
unrisked remaining recoverable volumes from statistical field-wide historical new drill locations in untested fault compartments or sub-accumulations within test fault compartments. (8) Best estimate contingent resources with 50% probability of
delivering unrisked remaining recoverable volumes from existing wellbores calculated from statistical field-wide historical work-over well performance. 21
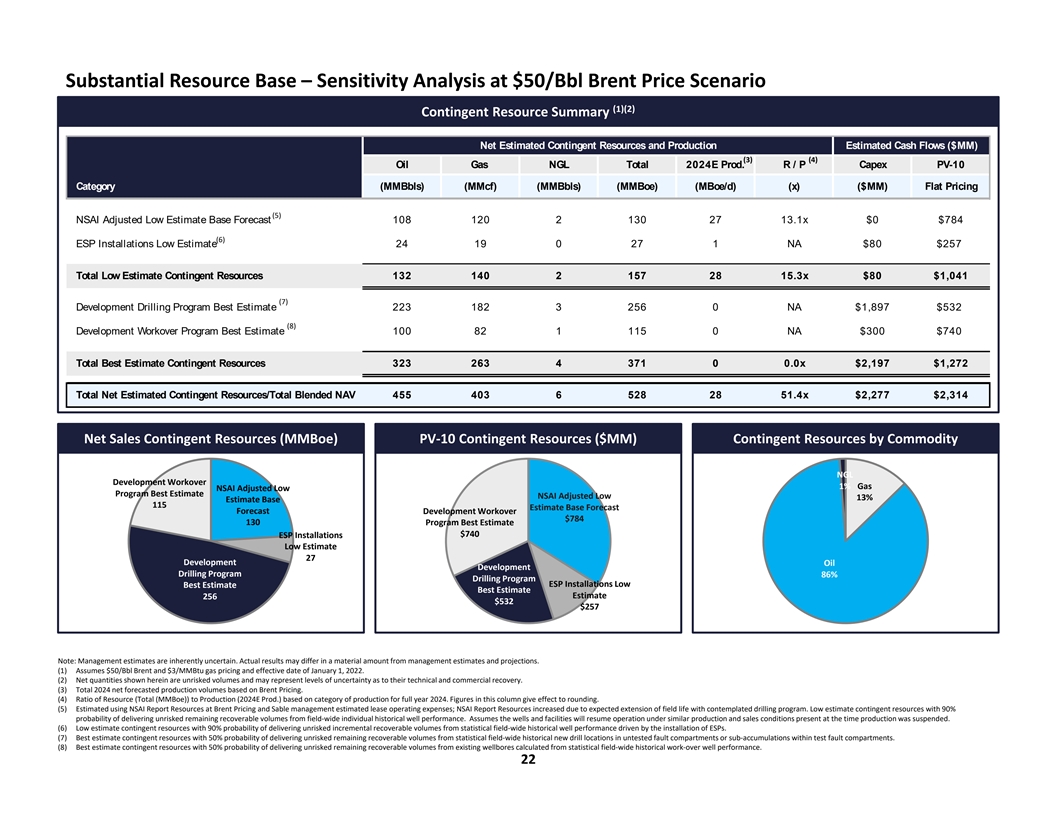
Substantial Resource Base – Sensitivity Analysis at $50/Bbl Brent
Price Scenario (1)(2) Contingent Resource Summary Net Estimated Contingent Resources and Production Estimated Cash Flows ($MM) (3) (4) Oil Gas NGL Total 2024E Prod. R / P Capex PV-10 Category (MMBbls) (MMcf) (MMBbls) (MMBoe) (MBoe/d) (x) ($MM) Flat
Pricing (5) NSAI Adjusted Low Estimate Base Forecast 108 120 2 130 27 13.1x $0 $784 (6) ESP Installations Low Estimate 24 19 0 27 1 NA $80 $257 Total Low Estimate Contingent Resources 132 140 2 157 28 15.3x $80 $1,041 (7) Development Drilling
Program Best Estimate 223 182 3 256 0 NA $1,897 $532 (8) Development Workover Program Best Estimate 100 82 1 115 0 NA $300 $740 Total Best Estimate Contingent Resources 323 263 4 371 0 0.0x $2,197 $1,272 Total Net Estimated Contingent
Resources/Total Blended NAV 455 403 6 528 28 51.4x $2,277 $2,314 Net Sales Contingent Resources (MMBoe) PV-10 Contingent Resources ($MM) Contingent Resources by Commodity NGL Development Workover 1% Gas NSAI Adjusted Low Program Best Estimate NSAI
Adjusted Low 13% Estimate Base 115 Estimate Base Forecast Forecast Development Workover $784 130 Program Best Estimate $740 ESP Installations Low Estimate 27 Development Oil Development Drilling Program 86% Drilling Program ESP Installations Low
Best Estimate Best Estimate Estimate 256 $532 $257 Note: Management estimates are inherently uncertain. Actual results may differ in a material amount from management estimates and projections. (1) Assumes $50/Bbl Brent and $3/MMBtu gas pricing and
effective date of January 1, 2022. (2) Net quantities shown herein are unrisked volumes and may represent levels of uncertainty as to their technical and commercial recovery. (3) Total 2024 net forecasted production volumes based on Brent Pricing.
(4) Ratio of Resource (Total (MMBoe)) to Production (2024E Prod.) based on category of production for full year 2024. Figures in this column give effect to rounding. (5) Estimated using NSAI Report Resources at Brent Pricing and Sable management
estimated lease operating expenses; NSAI Report Resources increased due to expected extension of field life with contemplated drilling program. Low estimate contingent resources with 90% probability of delivering unrisked remaining recoverable
volumes from field-wide individual historical well performance. Assumes the wells and facilities will resume operation under similar production and sales conditions present at the time production was suspended. (6) Low estimate contingent resources
with 90% probability of delivering unrisked incremental recoverable volumes from statistical field-wide historical well performance driven by the installation of ESPs. (7) Best estimate contingent resources with 50% probability of delivering
unrisked remaining recoverable volumes from statistical field-wide historical new drill locations in untested fault compartments or sub-accumulations within test fault compartments. (8) Best estimate contingent resources with 50% probability of
delivering unrisked remaining recoverable volumes from existing wellbores calculated from statistical field-wide historical work-over well performance. 22
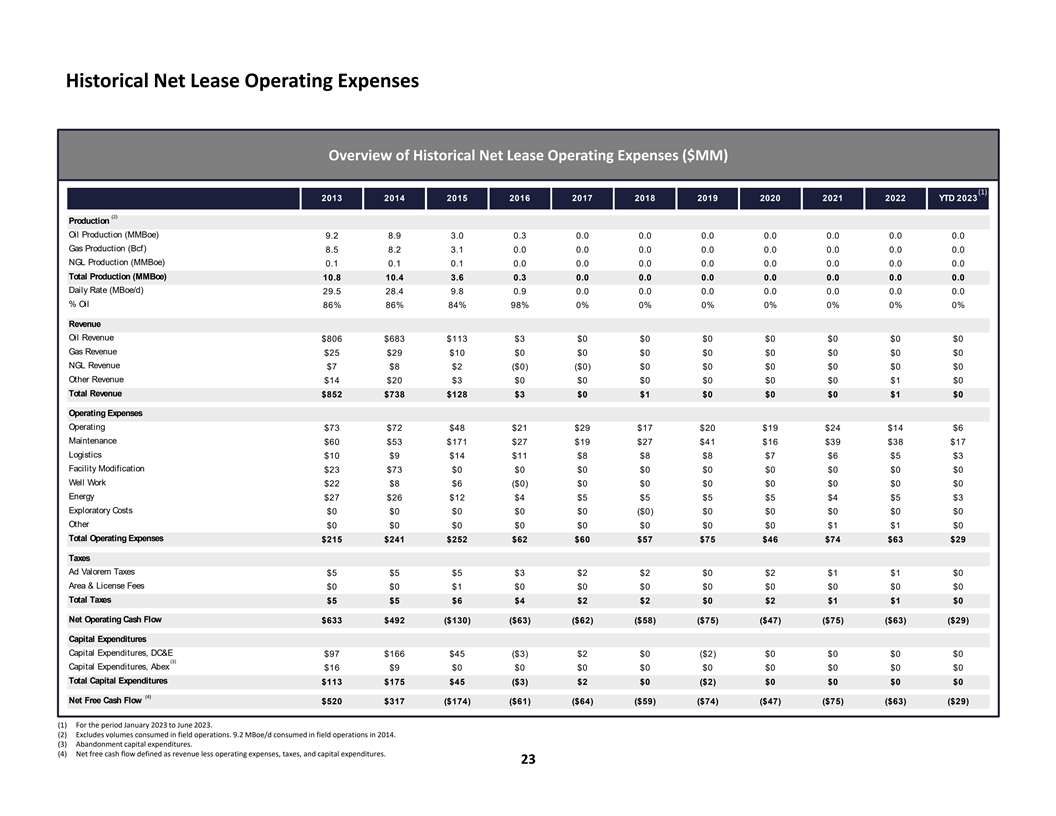
Historical Net Lease Operating Expenses Overview of Historical Net
Lease Operating Expenses ($MM) (1) 2013 2014 2015 2016 2017 2018 2019 2020 2021 2022 YTD 2023 (2) Production Oil Production (MMBoe) 9.2 8.9 3.0 0.3 0.0 0.0 0.0 0.0 0.0 0.0 0.0 Gas Production (Bcf) 8.5 8.2 3.1 0.0 0.0 0.0 0.0 0.0 0.0 0.0 0.0 NGL
Production (MMBoe) 0.1 0.1 0.1 0.0 0.0 0.0 0.0 0.0 0.0 0.0 0.0 Total Production (MMBoe) 10.8 10.4 3.6 0.3 0.0 0.0 0.0 0.0 0.0 0.0 0.0 Daily Rate (MBoe/d) 29.5 28.4 9.8 0.9 0.0 0.0 0.0 0.0 0.0 0.0 0.0 % Oil 86% 86% 84% 98% 0% 0% 0% 0% 0% 0% 0%
Revenue Oil Revenue $806 $683 $113 $3 $0 $0 $0 $0 $0 $0 $0 Gas Revenue $25 $29 $10 $0 $0 $0 $0 $0 $0 $0 $0 NGL Revenue $7 $8 $2 ($0) ($0) $0 $0 $0 $0 $0 $0 Other Revenue $14 $20 $3 $0 $0 $0 $0 $0 $0 $1 $0 Total Revenue $852 $738 $128 $3 $0 $1 $0 $0
$0 $1 $0 Operating Expenses Operating $73 $72 $48 $21 $29 $17 $20 $19 $24 $14 $6 Maintenance $60 $53 $171 $27 $19 $27 $41 $16 $39 $38 $17 Logistics $10 $9 $14 $11 $8 $8 $8 $7 $6 $5 $3 Facility Modification $23 $73 $0 $0 $0 $0 $0 $0 $0 $0 $0 Well
Work $22 $8 $6 ($0) $0 $0 $0 $0 $0 $0 $0 Energy $27 $26 $12 $4 $5 $5 $5 $5 $4 $5 $3 Exploratory Costs $0 $0 $0 $0 $0 ($0) $0 $0 $0 $0 $0 Other $0 $0 $0 $0 $0 $0 $0 $0 $1 $1 $0 Total Operating Expenses $215 $241 $252 $62 $60 $57 $75 $46 $74 $63 $29
Taxes Ad Valorem Taxes $5 $5 $5 $3 $2 $2 $0 $2 $1 $1 $0 Area & License Fees $0 $0 $1 $0 $0 $0 $0 $0 $0 $0 $0 Total Taxes $5 $5 $6 $4 $2 $2 $0 $2 $1 $1 $0 Net Operating Cash Flow $633 $492 ($130) ($63) ($62) ($58) ($75) ($47) ($75) ($63) ($29)
Capital Expenditures Capital Expenditures, DC&E $97 $166 $45 ($3) $2 $0 ($2) $0 $0 $0 $0 (3) Capital Expenditures, Abex $16 $9 $0 $0 $0 $0 $0 $0 $0 $0 $0 Total Capital Expenditures $113 $175 $45 ($3) $2 $0 ($2) $0 $0 $0 $0 (4) Net Free Cash Flow
$520 $317 ($174) ($61) ($64) ($59) ($74) ($47) ($75) ($63) ($29) (1) For the period January 2023 to June 2023. (2) Excludes volumes consumed in field operations. 9.2 MBoe/d consumed in field operations in 2014. (3) Abandonment capital expenditures.
(4) Net free cash flow defined as revenue less operating expenses, taxes, and capital expenditures. 23
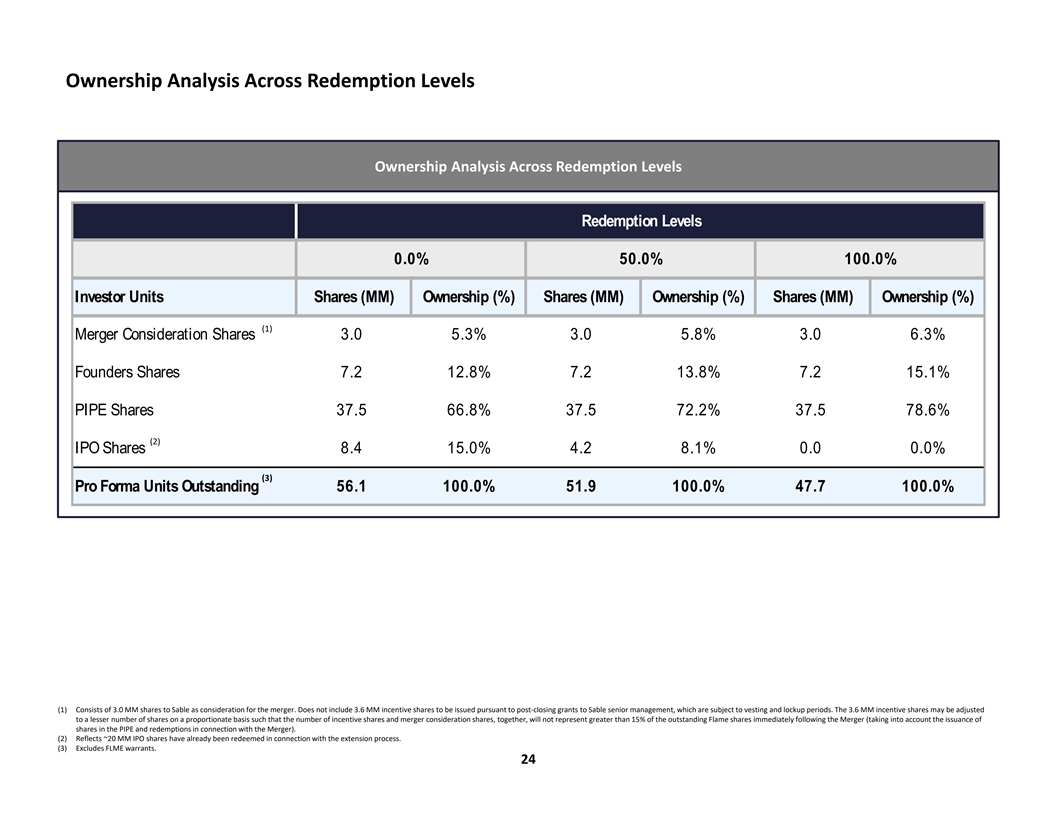
Ownership Analysis Across Redemption Levels Ownership Analysis Across
Redemption Levels Redemption Levels 0.0% 50.0% 100.0% Investor Units Shares (MM) Ownership (%) Shares (MM) Ownership (%) Shares (MM) Ownership (%) (1) Merger Consideration Shares 3.0 5.3% 3.0 5.8% 3.0 6.3% Founders Shares 7.2 12.8% 7.2 13.8% 7.2
15.1% PIPE Shares 37.5 66.8% 37.5 72.2% 37.5 78.6% (2) IPO Shares 8.4 15.0% 4.2 8.1% 0.0 0.0% (3) Pro Forma Units Outstanding 56.1 100.0% 51.9 100.0% 47.7 100.0% (1) Consists of 3.0 MM shares to Sable as consideration for the merger. Does not
include 3.6 MM incentive shares to be issued pursuant to post-closing grants to Sable senior management, which are subject to vesting and lockup periods. The 3.6 MM incentive shares may be adjusted to a lesser number of shares on a proportionate
basis such that the number of incentive shares and merger consideration shares, together, will not represent greater than 15% of the outstanding Flame shares immediately following the Merger (taking into account the issuance of shares in the PIPE
and redemptions in connection with the Merger). (2) Reflects ~20 MM IPO shares have already been redeemed in connection with the extension process. (3) Excludes FLME warrants. 24
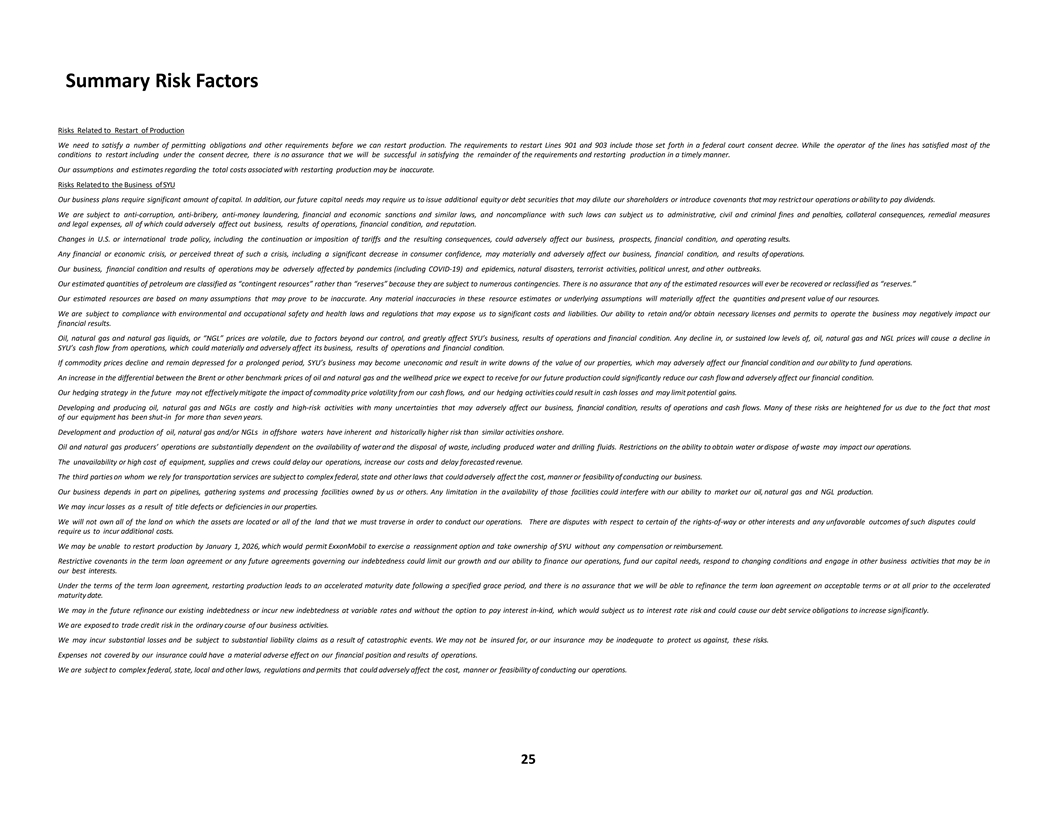
Summary Risk Factors Risks Related to Restart of Production We need to
satisfy a number of permitting obligations and other requirements before we can restart production. The requirements to restart Lines 901 and 903 include those set forth in a federal court consent decree. While the operator of the lines has
satisfied most of the conditions to restart including under the consent decree, there is no assurance that we will be successful in satisfying the remainder of the requirements and restarting production in a timely manner. Our assumptions and
estimates regarding the total costs associated with restarting production may be inaccurate. Risks Related to the Business of SYU Our business plans require significant amount of capital. In addition, our future capital needs may require us to issue
additional equity or debt securities that may dilute our shareholders or introduce covenants that may restrict our operations or ability to pay dividends. We are subject to anti-corruption, anti-bribery, anti-money laundering, financial and economic
sanctions and similar laws, and noncompliance with such laws can subject us to administrative, civil and criminal fines and penalties, collateral consequences, remedial measures and legal expenses, all of which could adversely affect out business,
results of operations, financial condition, and reputation. Changes in U.S. or international trade policy, including the continuation or imposition of tariffs and the resulting consequences, could adversely affect our business, prospects, financial
condition, and operating results. Any financial or economic crisis, or perceived threat of such a crisis, including a significant decrease in consumer confidence, may materially and adversely affect our business, financial condition, and results of
operations. Our business, financial condition and results of operations may be adversely affected by pandemics (including COVID-19) and epidemics, natural disasters, terrorist activities, political unrest, and other outbreaks. Our estimated
quantities of petroleum are classified as “contingent resources” rather than “reserves” because they are subject to numerous contingencies. There is no assurance that any of the estimated resources will ever be recovered or
reclassified as “reserves.” Our estimated resources are based on many assumptions that may prove to be inaccurate. Any material inaccuracies in these resource estimates or underlying assumptions will materially affect the quantities and
present value of our resources. We are subject to compliance with environmental and occupational safety and health laws and regulations that may expose us to significant costs and liabilities. Our ability to retain and/or obtain necessary licenses
and permits to operate the business may negatively impact our financial results. Oil, natural gas and natural gas liquids, or “NGL” prices are volatile, due to factors beyond our control, and greatly affect SYU’s business, results
of operations and financial condition. Any decline in, or sustained low levels of, oil, natural gas and NGL prices will cause a decline in SYU’s cash flow from operations, which could materially and adversely affect its business, results of
operations and financial condition. If commodity prices decline and remain depressed for a prolonged period, SYU’s business may become uneconomic and result in write downs of the value of our properties, which may adversely affect our
financial condition and our ability to fund operations. An increase in the differential between the Brent or other benchmark prices of oil and natural gas and the wellhead price we expect to receive for our future production could significantly
reduce our cash flow and adversely affect our financial condition. Our hedging strategy in the future may not effectively mitigate the impact of commodity price volatility from our cash flows, and our hedging activities could result in cash losses
and may limit potential gains. Developing and producing oil, natural gas and NGLs are costly and high-risk activities with many uncertainties that may adversely affect our business, financial condition, results of operations and cash flows. Many of
these risks are heightened for us due to the fact that most of our equipment has been shut-in for more than seven years. Development and production of oil, natural gas and/or NGLs in offshore waters have inherent and historically higher risk than
similar activities onshore. Oil and natural gas producers’ operations are substantially dependent on the availability of water and the disposal of waste, including produced water and drilling fluids. Restrictions on the ability to obtain water
or dispose of waste may impact our operations. The unavailability or high cost of equipment, supplies and crews could delay our operations, increase our costs and delay forecasted revenue. The third parties on whom we rely for transportation
services are subject to complex federal, state and other laws that could adversely affect the cost, manner or feasibility of conducting our business. Our business depends in part on pipelines, gathering systems and processing facilities owned by us
or others. Any limitation in the availability of those facilities could interfere with our ability to market our oil, natural gas and NGL production. We may incur losses as a result of title defects or deficiencies in our properties. We will not own
all of the land on which the assets are located or all of the land that we must traverse in order to conduct our operations. There are disputes with respect to certain of the rights-of-way or other interests and any unfavorable outcomes of such
disputes could require us to incur additional costs. We may be unable to restart production by January 1, 2026, which would permit ExxonMobil to exercise a reassignment option and take ownership of SYU without any compensation or reimbursement.
Restrictive covenants in the term loan agreement or any future agreements governing our indebtedness could limit our growth and our ability to finance our operations, fund our capital needs, respond to changing conditions and engage in other
business activities that may be in our best interests. Under the terms of the term loan agreement, restarting production leads to an accelerated maturity date following a specified grace period, and there is no assurance that we will be able to
refinance the term loan agreement on acceptable terms or at all prior to the accelerated maturity date. We may in the future refinance our existing indebtedness or incur new indebtedness at variable rates and without the option to pay interest
in-kind, which would subject us to interest rate risk and could cause our debt service obligations to increase significantly. We are exposed to trade credit risk in the ordinary course of our business activities. We may incur substantial losses and
be subject to substantial liability claims as a result of catastrophic events. We may not be insured for, or our insurance may be inadequate to protect us against, these risks. Expenses not covered by our insurance could have a material adverse
effect on our financial position and results of operations. We are subject to complex federal, state, local and other laws, regulations and permits that could adversely affect the cost, manner or feasibility of conducting our operations.
25
Summary Risk Factors (Cont’d) The listing of a species as either
“threatened” or “endangered” under the federal and/or California Endangered Species Act could result in increased costs, new operating restrictions, or delays in our operations, which could adversely affect our results of
operations and financial condition. Conservation measures, technological advances and increasing public attention and activism with respect to climate change and environmental matters could reduce demand for oil, natural gas and NGLs and have an
adverse effect on our business, financial condition and reputation. Climate change legislation or regulations restricting emissions of “greenhouse gases” could result in increased operating costs and reduced demand for the oil, natural
gas and NGL we expect to produce. The enactment of derivatives legislation could have an adverse effect on our ability to use derivative instruments to reduce the effect of commodity price, interest rate and other risks associated with our business.
Attempts by the California state government to restrict the production of oil and gas could negatively impact our operations and result in decreased demand for fossil fuels in California. Our production, revenue and cash flow from operating
activities are derived from assets that are located in California and offshore areas, making us vulnerable to risks associated with having operations concentrated in one geographic area. All of our operations are in California and offshore areas,
much of which are conducted in areas that may be at risk of damage from fire, mudslides, earthquakes or other natural disasters. Increasing attention to environmental, social and governance matters may impact our business. Environmental groups may
initiate litigation and take other actions to attempt to delay or prevent us from obtaining required approvals to restart production. The Inflation Reduction Act of 2022 could accelerate the transition to a low carbon economy and may impose new
costs on our operations. Certain U.S. federal income tax deductions currently available with respect to oil and natural gas exploration and production may be eliminated as a result of future legislation. The cost of decommissioning and the cost of
financial assurance to satisfy decommissioning obligations are uncertain. We may be required to post cash collateral pursuant to our agreements with sureties, letter of credit providers or regulators under our existing or future bonding or other
arrangements, which may have a material adverse effect on our liquidity and our ability to execute our capital expenditure plan and our asset retirement obligation plan and comply with the agreements governing our existing or future indebtedness.
Our business could be negatively affected by security threats, including cybersecurity threats, destructive forms of protest and opposition by activists and other disruptions. Risks Related to Ownership of Flame Securities and the Potential Business
Combination Our Sponsor, certain members of the Flame board of directors and certain other Flame officers have interests in the potential business combination that are different from or are in addition to other stockholders in recommending that
stockholders vote in favor of approval of the potential business combination proposal and approval of the other proposals described in the proxy statement that will be filed in connection with the potential business combination. Our sponsor, certain
insiders, directors, officers, advisors and their affiliates may elect to purchase public shares from public stockholders, which may influence a vote on the potential business combination, reduce the public “float” of Flame common stock
and affect its market price, and have interests in the potential business combination different from the interests of Flame’s public stockholders. We and SYU will be subject to business uncertainties and contractual restrictions while the
potential business combination is pending. We have identified material weaknesses in our internal control over financial reporting. These material weaknesses could continue to adversely affect investor confidence in us and materially adversely
affect our ability to report our results of operations and financial condition accurately and in a timely manner. Shareholder litigation could prevent or delay the closing of the potential business combination or otherwise negatively impact our
business, operating results and financial condition. The exercise of Flame’s directors’ and officers’ discretion in agreeing to changes or waivers in the terms of the potential business combination may result in a conflict of
interest when determining whether such changes to the terms of the potential business combination or waivers of conditions are appropriate and in Flame’s stockholders’ best interest. Our ability to successfully effect the potential
business combination and to be successful thereafter will be dependent upon the efforts of certain key personnel, including the key personnel of SYU whom we expect to stay with the post-combination business following the potential business
combination. The loss of key personnel could negatively impact the operations and profitability of our post-combination business and its financial condition could suffer as a result. Upon closing of the potential business combination, we expect to
have a significant amount of cash and our management will have broad discretion over the use of that cash, subject to limitations imposed on us under the term loan agreement with ExxonMobil. We may use our cash in ways that stockholders may not
approve. Unanticipated changes in effective tax rates or adverse outcomes resulting from examination of our income or other tax returns could adversely affect our financial condition and results of operations. Going public through a merger rather
than an underwritten offering presents risks to unaffiliated investors. Subsequent to completion of the potential business combination, Flame may be required to take write-downs or write-offs, restructure its operations, or take impairment or other
charges, any of which could have a significant negative effect on Flame’s financial condition, results of operations and Flame’s stock price, which could cause you to lose some or all of your investment. 26
Flame Acquisition (NYSE:FLME)
과거 데이터 주식 차트
부터 4월(4) 2024 으로 5월(5) 2024

Flame Acquisition (NYSE:FLME)
과거 데이터 주식 차트
부터 5월(5) 2023 으로 5월(5) 2024
