UNITED STATES
SECURITIES AND EXCHANGE COMMISSION
Washington, D.C. 20549
Form 6-K
REPORT OF FOREIGN PRIVATE ISSUER
PURSUANT TO RULE 13a-16 OR 15d-16 UNDER
THE SECURITIES EXCHANGE ACT OF 1934
For the month of August 2023
Commission File Number: 001-36898
COLLIERS INTERNATIONAL GROUP INC.
(Translation of registrant's name into English)
1140 Bay Street, Suite 4000
Toronto, Ontario, Canada
M5S 2B4
(Address of principal executive office)
Indicate by check mark whether the registrant files or will file annual reports under cover of Form 20-F or Form 40-F.
Form 20-F [ ] Form 40-F [ X ]
SIGNATURE
Pursuant to the requirements of the Securities Exchange Act of 1934, the registrant has duly caused this report to be signed on its behalf by the undersigned, thereunto duly authorized.
| | | COLLIERS INTERNATIONAL GROUP INC. |
| | | |
| | | |
| | | |
| Date: August 2, 2023 | | /s/ Christian Mayer |
| | | Name: Christian Mayer |
| | | Title: Chief Financial Officer |
| | | |
EXHIBIT INDEX
EXHIBIT 99.1
Colliers Reports Second Quarter Results
High value recurring revenues continue to scale
Maintains full year financial outlook
Second quarter and year to date operating highlights:
| | Three months ended | | Six months ended |
| | June 30 | | June 30 |
| (in millions of US$, except EPS) | | 2023 | | | | 2022 | | | 2023 | | | | 2022 |
| | | | | | | | | | | | |
| Revenues | $ | 1,078.0 | | | $ | 1,127.8 | | $ | 2,043.9 | | | $ | 2,128.8 |
| Adjusted EBITDA (note 1) | | 147.1 | | | | 161.3 | | | 251.7 | | | | 282.8 |
| Adjusted EPS (note 2) | | 1.31 | | | | 1.84 | | | 2.16 | | | | 3.28 |
| | | | | | | | | | | | |
| GAAP operating earnings | | 75.3 | | | | 103.9 | | | 97.4 | | | | 144.7 |
| GAAP diluted net earnings (loss) per share | | (0.16 | ) | | | 0.67 | | | (0.61 | ) | | | 0.26 |
TORONTO, Aug. 02, 2023 (GLOBE NEWSWIRE) -- Colliers International Group Inc. (NASDAQ and TSX: CIGI) (“Colliers” or the “Company”) today announced operating and financial results for the second quarter ended June 30, 2023. All amounts are in US dollars.
For the quarter ended June 30, 2023, revenues were $1.08 billion, down 4% (4% in local currency) and adjusted EBITDA (note 1) was $147.1 million, down 9% (8% in local currency). Adjusted EPS (note 2) was $1.31, relative to $1.84 in the prior year quarter and was primarily impacted by higher interest expense. Second quarter adjusted EPS would have been approximately $0.01 higher excluding foreign exchange impacts. The GAAP operating earnings were $75.3 million as compared to $103.9 million in the prior year quarter. The GAAP diluted net loss per share was $0.16 versus earnings of $0.67 in the prior year quarter primarily due to lower operating earnings and higher interest expense. The second quarter GAAP diluted net loss per share would have been approximately $0.01 lower excluding changes in foreign exchange rates.
For the six months ended June 30, 2023, revenues were $2.04 billion, down 4% (3% in local currency), adjusted EBITDA (note 1) was $251.7 million, down 11% (11% in local currency) and adjusted EPS (note 2) was $2.16, relative to $3.28 in the prior year period. Six months ended June 30, 2023 adjusted EPS would have been approximately $0.01 higher excluding foreign exchange impacts. The GAAP operating earnings were $97.4 million as compared to $144.7 million in the prior year period. The GAAP diluted net loss per share was $0.61 as compared to earnings per share of $0.26 in the prior year period. Six months ended June 30, 2023 GAAP diluted net loss per share would have been approximately $0.01 lower excluding changes in foreign exchange rates.
“During the second quarter, Colliers’ recurring revenues continued to grow, accounting for 65% of Adjusted EBITDA. Having significant recurring revenues highlights our balanced and resilient business model, enables us to withstand market fluctuations and sets us apart from the others. While Investment Management and Outsourcing & Advisory experienced robust growth during the quarter with revenues up 58% and 10%, respectively, Capital Markets and, to a lesser extent, Leasing declined compared to the prior year’s record revenue levels. Lower transaction volumes were caused by rising interest rates, challenging debt availability and continued price discovery, which we expect will rebound once market conditions stabilize. Since most of our business is performing well, we are maintaining our financial outlook for the year,” said Jay S. Hennick, Chairman & CEO of Colliers.
“In the quarter, Colliers continued to complete strategic investments across the board, adding Engineering and Project Management companies in the US, Australia and New Zealand. Since 2015, Colliers has transformed into a highly diversified and global professional services company with significant recurring revenue streams and a proven record of creating value for shareholders,” he concluded.
About Colliers
Colliers (NASDAQ, TSX: CIGI) is a leading diversified professional services and investment management company. With operations in 66 countries, our 18,000 enterprising professionals work collaboratively to provide expert real estate and investment advice to clients. For more than 28 years, our experienced leadership with significant inside ownership has delivered compound annual investment returns of approximately 20% for shareholders. With annual revenues of $4.5 billion and $99 billion of assets under management, Colliers maximizes the potential of property and real assets to accelerate the success of our clients, our investors and our people. Learn more at corporate.colliers.com, Twitter @Colliers or LinkedIn.
Consolidated Revenues by Line of Service
| | Three months ended
June 30 | Change
in US$ | Change
in LC | | Six months ended
June 30 | Change
in US$ | Change
in LC |
| (in thousands of US$) | |
| (LC = local currency) | 2023 | | 2022 | % | % | | 2023 | | 2022 | % | % |
| | | | | | | | | | | | | | | | |
| Outsourcing & Advisory | $ | 519,578 | | $ | 475,865 | 9% | 10% | | $ | 974,508 | | $ | 890,410 | 9% | 11% |
| Investment Management (1) | | 118,860 | | | 75,127 | 58% | 58% | | | 239,606 | | | 161,504 | 48% | 48% |
| Leasing | | 256,684 | | | 277,396 | -7% | -7% | | | 495,071 | | | 514,668 | -4% | -2% |
| Capital Markets | | 182,916 | | | 299,458 | -39% | -38% | | | 334,756 | | | 562,176 | -40% | -39% |
| Total revenues | $ | 1,078,038 | | $ | 1,127,846 | -4% | -4% | | $ | 2,043,941 | | $ | 2,128,758 | -4% | -3% |
| (1) Investment Management local currency revenues, excluding pass-through carried interest, were up 62% and 78% for the three and six months ended June 30, 2023, respectively. |
For the second quarter, consolidated revenues decreased 4% on a local currency basis. Investment Management and Outsourcing & Advisory generated robust growth. Capital Markets and, to a lesser extent, Leasing declined as expected relative to the prior year’s record levels, consistent with the overall market. Consolidated internal revenues measured in local currencies declined 10% (note 3) versus the prior year quarter.
For the six months ended June 30, 2023, consolidated revenues decreased 3% on a local currency basis. Investment Management and Outsourcing & Advisory were up strongly while Capital Markets and, to a lesser extent, Leasing declined in line with overall market conditions. Consolidated internal revenues measured in local currencies were down 10% (note 3).
Segmented Second Quarter Results
Revenues in the Americas region totalled $631.3 million down 15% (14% in local currency) versus $740.7 million in the comparative prior year quarter. The decline was attributable to lower Capital Markets activity and, to a lesser extent, Leasing relative to a record prior year quarter. Outsourcing & Advisory revenues were up, led by Engineering & Design and Project Management. Adjusted EBITDA was $69.6 million, down 31% (31% in local currency) relative to the prior year quarter, which was favourably impacted by an $11.7 million gain on the termination of a lease. GAAP operating earnings were $46.5 million, relative to $81.1 million in the prior year quarter.
Revenues in the EMEA region totalled $173.8 million, up 3% (1% in local currency) compared to $169.3 million in the prior year quarter on higher Outsourcing & Advisory revenues (including recent acquisitions), while Capital Markets and Leasing declined, consistent with market conditions in the region. Adjusted EBITDA was $6.3 million compared to $14.4 million in the prior year quarter, attributable to the reduction in higher-margin transactional revenues. The GAAP operating loss was $5.1 million compared to earnings of $4.2 million in the prior year quarter.
Revenues in the Asia Pacific region totalled $153.9 million compared to $142.6 million in the prior year quarter, up 8% (14% in local currency), with growth in Leasing and Outsourcing & Advisory (including recent acquisitions) more than offsetting a modest decline in Capital Markets. Adjusted EBITDA was $23.0 million, up 18% (24% in local currency) primarily on changes in service mix. GAAP operating earnings were $19.6 million, versus $17.6 million in the prior year quarter.
Investment Management revenues were $118.9 million compared to $75.1 million in the prior year quarter, up 58% (58% in local currency). Passthrough revenue (from historical carried interest) was nil versus $1.9 million in the prior year quarter. Excluding the impact of carried interest, revenue was up 62% (62% in local currency) driven by both acquisitions and management fee growth from increased assets under management (“AUM”). Adjusted EBITDA was $50.0 million, up 71% (71% in local currency) over the prior year quarter. GAAP operating earnings were $26.4 million in the quarter, versus $19.2 million in the prior year quarter. AUM were $99.0 billion as of June 30, 2023 compared to $97.7 billion as of December 31, 2022.
Unallocated global corporate costs as reported in Adjusted EBITDA were $1.9 million in the second quarter, relative to $3.4 million in the prior year quarter. The corporate GAAP operating loss for the quarter was $12.1 million relative to $18.2 million in the second quarter of 2022.
Outlook for 2023
The Company is maintaining the outlook previously provided in May 2023. Lower Capital Markets and Leasing transaction volumes are expected to persist for the remainder of the year. Robust growth (including the impact of recent acquisitions) is expected to continue in the Company’s high value recurring service lines, Investment Management and Outsourcing & Advisory. The Company expects higher Adjusted EBITDA margins in 2023 due to the change in service mix (greater proportion of earnings coming from higher-margin Investment Management) offset in part by lower Capital Markets margins, net of cost control measures across the Company. Adjusted EPS growth is expected to continue to be impacted by increased interest expense as well as a larger proportion of earnings growth generated from non-wholly owned operations.
The outlook for 2023, including the impact of acquisitions completed in 2022 and to the present date in 2023, is as follows:
| Measure | 2022 | Outlook for 2023 |
| Revenue | $4.5 billion | $4.4 billion - $4.6 billion |
| AEBITDA | $630.5 million | $670 million - $720 million |
| AEPS | $6.99 | $6.70 - $7.50 |
The financial outlook is based on the Company’s best available information as of the date of this press release, and remains subject to change based on numerous macroeconomic, health, social, geopolitical and related factors.
Conference Call
Colliers will be holding a conference call on Wednesday, August 2, 2023 at 11:00 a.m. Eastern Time to discuss the quarter’s results. The call, as well as a supplemental slide presentation, will be simultaneously web cast and can be accessed live or after the call at corporate.colliers.com in the Events section.
Forward-looking Statements
This press release includes or may include forward-looking statements. Forward-looking statements include the Company’s financial performance outlook and statements regarding goals, beliefs, strategies, objectives, plans or current expectations. These statements involve known and unknown risks, uncertainties and other factors which may cause the actual results to be materially different from any future results, performance or achievements contemplated in the forward-looking statements. Such factors include: economic conditions, especially as they relate to commercial and consumer credit conditions and consumer spending, particularly in regions where our business may be concentrated; commercial real estate and real asset values, vacancy rates and general conditions of financial liquidity for real estate transactions; trends in pricing and risk assumption for commercial real estate services; the effect of significant movements in average capitalization rates across different asset types; a reduction by companies in their reliance on outsourcing for their commercial real estate needs, which would affect revenues and operating performance; competition in the markets served by the Company; the ability to attract new clients and to retain major clients and renew related contracts; the ability to retain and incentivize employees; increases in wage and benefit costs; the effects of changes in interest rates on the cost of borrowing; unexpected increases in operating costs, such as insurance, workers’ compensation and health care; changes in the frequency or severity of insurance incidents relative to historical experience; the effects of changes in foreign exchange rates in relation to the US dollar on the Company’s Canadian dollar, Euro, Australian dollar and UK pound sterling denominated revenues and expenses; the impact of pandemics on client demand for the Company’s services, the ability of the Company to deliver its services and the health and productivity of its employees; the impact of global climate change; the impact of political events including elections, referenda, trade policy changes, immigration policy changes, hostilities, war and terrorism on the Company’s operations; the ability to identify and make acquisitions at reasonable prices and successfully integrate acquired operations; the ability to execute on, and adapt to, information technology strategies and trends; the ability to comply with laws and regulations related to our global operations, including real estate investment management and mortgage banking licensure, labour and employment laws and regulations, as well as the anti-corruption laws and trade sanctions; and changes in government laws and policies at the federal, state/provincial or local level that may adversely impact the business.
Additional information and risk factors are identified in the Company’s other periodic filings with Canadian and US securities regulators (which factors are adopted herein and a copy of which can be obtained at www.sedar.com). Forward looking statements contained in this press release are made as of the date hereof and are subject to change. All forward-looking statements in this press release are qualified by these cautionary statements. Except as required by applicable law, Colliers undertakes no obligation to publicly update or revise any forward-looking statement, whether as a result of new information, future events or otherwise.
Summary financial information is provided in this press release. This press release should be read in conjunction with the Company's consolidated financial statements and MD&A to be made available on SEDAR at www.sedar.com.
This press release does not constitute an offer to sell or a solicitation of an offer to purchase an interest in any fund.
Notes
Non-GAAP Measures
1. Reconciliation of net earnings to adjusted EBITDA
Adjusted EBITDA is defined as net earnings, adjusted to exclude: (i) income tax; (ii) other expense (income); (iii) interest expense; (iv) loss on disposal of operations; (v) depreciation and amortization, including amortization of mortgage servicing rights (“MSRs”); (vi) gains attributable to MSRs; (vii) acquisition-related items (including contingent acquisition consideration fair value adjustments, contingent acquisition consideration-related compensation expense and transaction costs); (viii) restructuring costs and (ix) stock-based compensation expense. We use Adjusted EBITDA to evaluate our own operating performance and our ability to service debt, as well as an integral part of our planning and reporting systems. Additionally, we use this measure in conjunction with discounted cash flow models to determine the Company’s overall enterprise valuation and to evaluate acquisition targets. We present Adjusted EBITDA as a supplemental measure because we believe such measure is useful to investors as a reasonable indicator of operating performance because of the low capital intensity of the Company’s service operations. We believe this measure is a financial metric used by many investors to compare companies, especially in the services industry. This measure is not a recognized measure of financial performance under GAAP in the United States, and should not be considered as a substitute for operating earnings, net earnings or cash flow from operating activities, as determined in accordance with GAAP. Our method of calculating adjusted EBITDA may differ from other issuers and accordingly, this measure may not be comparable to measures used by other issuers. A reconciliation of net earnings to adjusted EBITDA appears below.
| | | Three months ended | | Six months ended |
| | June 30 | | June 30 |
| (in thousands of US$) | 2023 | | 2022 | | 2023 | | 2022 |
| | | | | | | | | | | | | |
| Net earnings | $ | 35,001 | | | $ | 66,731 | | | $ | 34,094 | | | $ | 88,048 | |
| Income tax | | 16,477 | | | | 28,610 | | | | 20,016 | | | | 44,937 | |
| Other income, including equity earnings from non-consolidated investments | | (886 | ) | | | (1,062 | ) | | | (4,206 | ) | | | (4,190 | ) |
| Interest expense, net | | 24,670 | | | | 9,571 | | | | 47,502 | | | | 15,889 | |
| Operating earnings | | 75,262 | | | | 103,850 | | | | 97,406 | | | | 144,684 | |
| Loss on disposal of operations | | 2,282 | | | | 950 | | | | 2,282 | | | | 27,040 | |
| Depreciation and amortization | | 50,794 | | | | 44,097 | | | | 100,286 | | | | 80,737 | |
| Gains attributable to MSRs | | (6,052 | ) | | | (2,526 | ) | | | (9,087 | ) | | | (7,823 | ) |
| Equity earnings from non-consolidated investments | | 532 | | | | 906 | | | | 3,686 | | | | 4,066 | |
| Acquisition-related items | | 11,668 | | | | 9,365 | | | | 38,136 | | | | 24,448 | |
| Restructuring costs | | 7,038 | | | | 181 | | | | 7,781 | | | | 271 | |
| Stock-based compensation expense | | 5,556 | | | | 4,490 | | | | 11,213 | | | | 9,351 | |
| Adjusted EBITDA | $ | 147,080 | | | $ | 161,313 | | | $ | 251,703 | | | $ | 282,774 | |
2. Reconciliation of net earnings and diluted net earnings per common share to adjusted net earnings and adjusted EPS
Adjusted EPS is defined as diluted net earnings per share as calculated under the “if-converted” method, adjusted for the effect, after income tax, of: (i) the non-controlling interest redemption increment; (ii) loss on disposal of operations; (iii) amortization expense related to intangible assets recognized in connection with acquisitions and MSRs; (iv) gains attributable to MSRs; (v) acquisition-related items; (vi) restructuring costs and (vii) stock-based compensation expense. We believe this measure is useful to investors because it provides a supplemental way to understand the underlying operating performance of the Company and enhances the comparability of operating results from period to period. Adjusted EPS is not a recognized measure of financial performance under GAAP, and should not be considered as a substitute for diluted net earnings per share from continuing operations, as determined in accordance with GAAP. Our method of calculating this non-GAAP measure may differ from other issuers and, accordingly, this measure may not be comparable to measures used by other issuers. A reconciliation of net earnings to adjusted net earnings and of diluted net earnings per share to adjusted EPS appears below.
Adjusted EPS is calculated using the “if-converted” method of calculating earnings per share in relation to the Convertible Notes, which were issued on May 19, 2020 and fully converted or redeemed by June 1, 2023. As such, the interest (net of tax) on the Convertible Notes is added to the numerator and the additional shares issuable on conversion of the Convertible Notes are added to the denominator of the earnings per share calculation to determine if an assumed conversion is more dilutive than no assumption of conversion. The “if-converted” method is used if the impact of the assumed conversion is dilutive. The “if-converted” method is dilutive for the adjusted EPS calculation for all periods presented.
| | Three months ended | | Six months ended |
| | June 30 | | June 30 |
| (in thousands of US$) | 2023 | | 2022 | | 2023 | | 2022 |
| | | | | | | | | | | | |
| Net earnings | $ | 35,001 | | | $ | 66,731 | | | $ | 34,094 | | | $ | 88,048 | |
| Non-controlling interest share of earnings | | (13,816 | ) | | | (11,806 | ) | | | (24,757 | ) | | | (20,322 | ) |
| Interest on Convertible Notes | | 561 | | | | 2,300 | | | | 2,861 | | | | 4,600 | |
| Loss on disposal of operations | | 2,282 | | | | 950 | | | | 2,282 | | | | 27,040 | |
| Amortization of intangible assets | | 37,330 | | | | 32,279 | | | | 74,173 | | | | 56,870 | |
| Gains attributable to MSRs | | (6,052 | ) | | | (2,526 | ) | | | (9,087 | ) | | | (7,823 | ) |
| Acquisition-related items | | 11,668 | | | | 9,365 | | | | 38,136 | | | | 24,448 | |
| Restructuring costs | | 7,038 | | | | 181 | | | | 7,781 | | | | 271 | |
| Stock-based compensation expense | | 5,556 | | | | 4,490 | | | | 11,213 | | | | 9,351 | |
| Income tax on adjustments | | (11,845 | ) | | | (9,891 | ) | | | (23,193 | ) | | | (16,310 | ) |
| Non-controlling interest on adjustments | | (5,773 | ) | | | (4,269 | ) | | | (10,926 | ) | | | (7,939 | ) |
| Adjusted net earnings | $ | 61,950 | | | $ | 87,804 | | | $ | 102,577 | | | $ | 158,234 | |
| | | | | | | | | | | | |
| | Three months ended | | Six months ended |
| | June 30 | | June 30 |
| (in US$) | 2023 | | 2022 | | 2023 | | 2022 |
| | | | | | | | | | | | |
| Diluted net earnings (loss) per common share(1) | $ | (0.14 | ) | | $ | 0.64 | | | $ | (0.57 | ) | | $ | 0.24 | |
| Interest on Convertible Notes, net of tax | | 0.01 | | | | 0.04 | | | | 0.04 | | | | 0.07 | |
| Non-controlling interest redemption increment | | 0.59 | | | | 0.51 | | | | 0.77 | | | | 1.16 | |
| Loss on disposal of operations | | 0.05 | | | | 0.02 | | | | 0.05 | | | | 0.56 | |
| Amortization expense, net of tax | | 0.49 | | | | 0.41 | | | | 0.97 | | | | 0.71 | |
| Gains attributable to MSRs, net of tax | | (0.07 | ) | | | (0.03 | ) | | | (0.11 | ) | | | (0.09 | ) |
| Acquisition-related items | | 0.19 | | | | 0.18 | | | | 0.70 | | | | 0.45 | |
| Restructuring costs, net of tax | | 0.11 | | | | - | | | | 0.12 | | | | - | |
| Stock-based compensation expense, net of tax | | 0.08 | | | | 0.07 | | | | 0.19 | | | | 0.18 | |
| Adjusted EPS | $ | 1.31 | | | $ | 1.84 | | | $ | 2.16 | | | $ | 3.28 | |
| | | | | | | | | | | | |
| Diluted weighted average shares for Adjusted EPS (thousands) | | 47,422 | | | | 47,804 | | | | 47,442 | | | | 48,302 | |
| (1) Amounts shown reflect the "if-converted" method's dilutive impact on the adjusted EPS calculation for the three months and six months ended June 30, 2023 and 2022, respectively. |
3. Reconciliation of net cash flow from operations to free cash flow
Free cash flow is defined as net cash flow from operating activities plus contingent acquisition consideration paid, less purchases of fixed assets, plus cash collections on AR Facility deferred purchase price less distributions to non-controlling interests. We use free cash flow as a measure to evaluate and monitor operating performance as well as our ability to service debt, fund acquisitions and pay of dividends to shareholders. We present free cash flow as a supplemental measure because we believe this measure is a financial metric used by many investors to compare valuation and liquidity measures across companies, especially in the services industry. This measure is not a recognized measure of financial performance under GAAP in the United States, and should not be considered as a substitute for operating earnings, net earnings or cash flow from operating activities, as determined in accordance with GAAP. Our method of calculating free cash flow may differ from other issuers and accordingly, this measure may not be comparable to measures used by other issuers. A reconciliation of net cash flow from operating activities to free cash flow appears below.
| | Three months ended | | Six months ended |
| | June 30 | | June 30 |
| (in thousands of US$) | 2023 | | 2022 | | 2023 | | 2022 |
| | | | | | | | | | | | |
| Net cash provided by (used in) operating activities | $ | 98,973 | | | $ | 32,399 | | | $ | (33,595 | ) | | $ | (248,310 | ) |
| Contingent acquisition consideration paid | | 2,719 | | | | 1,257 | | | | 2,991 | | | | 60,810 | |
| Purchase of fixed assets | | (22,179 | ) | | | (13,581 | ) | | | (41,062 | ) | | | (23,416 | ) |
| Cash collections on AR Facility deferred purchase price | | 28,539 | | | | 90,101 | | | | 59,311 | | | | 256,429 | |
| Distributions paid to non-controlling interests | | (40,059 | ) | | | (26,628 | ) | | | (51,120 | ) | | | (41,554 | ) |
| Free cash flow | $ | 67,993 | | | $ | 83,548 | | | $ | (63,475 | ) | | $ | 3,959 | |
4. Local currency revenue and AEBITDA growth rate and internal revenue growth rate measures
Percentage revenue and AEBITDA variances presented on a local currency basis are calculated by translating the current period results of our non-US dollar denominated operations to US dollars using the foreign currency exchange rates from the periods against which the current period results are being compared. Percentage revenue variances presented on an internal growth basis are calculated assuming no impact from acquired entities in the current and prior periods. Revenue from acquired entities, including any foreign exchange impacts, are treated as acquisition growth until the respective anniversaries of the acquisitions. We believe that these revenue growth rate methodologies provide a framework for assessing the Company’s performance and operations excluding the effects of foreign currency exchange rate fluctuations and acquisitions. Since these revenue growth rate measures are not calculated under GAAP, they may not be comparable to similar measures used by other issuers.
5. Assets under management
We use the term assets under management (“AUM”) as a measure of the scale of our Investment Management operations. AUM is defined as the gross market value of operating assets and the projected gross cost of development assets of the funds, partnerships and accounts to which we provide management and advisory services, including capital that such funds, partnerships and accounts have the right to call from investors pursuant to capital commitments. Our definition of AUM may differ from those used by other issuers and as such may not be directly comparable to similar measures used by other issuers.
6. Adjusted EBITDA from recurring revenue percentage
Adjusted EBITDA from recurring revenue percentage is computed on a trailing twelve-month basis and represents the proportion of adjusted EBITDA (note 1) that is derived from Outsourcing & Advisory and Investment Management service lines. Both these service lines represent medium to long-term duration revenue streams that are either contractual or repeatable in nature. Adjusted EBITDA for this purpose is calculated in the same manner as for our debt agreement covenant calculation purposes, incorporating the expected full year impact of business acquisitions and dispositions.
| Colliers International Group Inc. |
| Condensed Consolidated Statements of Earnings (Loss) |
| (in thousands of US$, except per share amounts) |
| | | Three months | | | Six months |
| | | ended June 30 | | | ended June 30 |
| | | 2023 | | | | 2022 | | | | 2023 | | | | 2022 | |
| Revenues | $ | 1,078,038 | | | $ | 1,127,846 | | | $ | 2,043,941 | | | $ | 2,128,758 | |
| Cost of revenues | | 640,650 | | | | 703,302 | | | | 1,226,910 | | | | 1,334,855 | |
| Selling, general and administrative expenses | | 297,382 | | | | 266,282 | | | | 578,921 | | | | 516,994 | |
| Depreciation | | 13,464 | | | | 11,818 | | | | 26,113 | | | | 23,867 | |
| Amortization of intangible assets | | 37,330 | | | | 32,279 | | | | 74,173 | | | | 56,870 | |
| Acquisition-related items (1) | | 11,668 | | | | 9,365 | | | | 38,136 | | | | 24,448 | |
| Loss on disposal of operations | | 2,282 | | | | 950 | | | | 2,282 | | | | 27,040 | |
| Operating earnings | | 75,262 | | | | 103,850 | | | | 97,406 | | | | 144,684 | |
| Interest expense, net | | 24,670 | | | | 9,571 | | | | 47,502 | | | | 15,889 | |
| Equity earnings from unconsolidated investments | | (532 | ) | | | (906 | ) | | | (3,686 | ) | | | (4,066 | ) |
| Other income | | (354 | ) | | | (156 | ) | | | (520 | ) | | | (124 | ) |
| Earnings before income tax | | 51,478 | | | | 95,341 | | | | 54,110 | | | | 132,985 | |
| Income tax | | 16,477 | | | | 28,610 | | | | 20,016 | | | | 44,937 | |
| Net earnings | | 35,001 | | | | 66,731 | | | | 34,094 | | | | 88,048 | |
| Non-controlling interest share of earnings | | 13,816 | | | | 11,806 | | | | 24,757 | | | | 20,322 | |
| Non-controlling interest redemption increment | | 28,036 | | | | 24,564 | | | | 36,340 | | | | 56,005 | |
| Net earnings (loss) attributable to Company | $ | (6,851 | ) | | $ | 30,361 | | | $ | (27,003 | ) | | $ | 11,721 | |
| | | | | | | | | | | | |
| Net earnings (loss) per common share | | | | | | | | | | | |
| | | | | | | | | | | | |
| Basic | $ | (0.15 | ) | | $ | 0.70 | | | $ | (0.61 | ) | | $ | 0.27 | |
| | | | | | | | | | | | |
| Diluted (2) | $ | (0.16 | ) | | $ | 0.67 | | | $ | (0.61 | ) | | $ | 0.26 | |
| | | | | | | | | | | | |
| Adjusted EPS (3) | $ | 1.31 | | | $ | 1.84 | | | $ | 2.16 | | | $ | 3.28 | |
| | | | | | | | | | | | |
| Weighted average common shares (thousands) | | | | | | | | | | | |
| Basic | | 45,069 | | | | 43,336 | | | | 44,064 | | | | 43,698 | |
| Diluted | | 45,362 | | | | 47,804 | | | | 44,064 | | | | 44,328 | |
Notes to Condensed Consolidated Statements of Earnings
- Acquisition-related items include contingent acquisition consideration fair value adjustments, contingent acquisition consideration-related compensation expense and transaction costs.
- Diluted EPS is calculated using the “if-converted” method of calculating earnings per share in relation to the Convertible Notes, which were issued on May 19, 2020 and fully converted or redeemed by June 1, 2023. As such, the interest (net of tax) on the Convertible Notes is added to the numerator and the additional shares issuable on conversion of the Convertible Notes are added to the denominator of the earnings per share calculation to determine if an assumed conversion is more dilutive than no assumption of conversion. The “if-converted” method is used if the impact of the assumed conversion is dilutive. The “if-converted” method is dilutive for the three-month periods ended June 30, 2023 and 2022, respectively and anti-dilutive for the six-month periods ended June 30, 2023 and 2022, respectively.
- See definition and reconciliation above.
| Colliers International Group Inc. | | | | | | | | |
| Condensed Consolidated Balance Sheets | | | | | | | | |
| (in thousands of US$) | | | |
| | | | | | | | | |
| | June 30, | | December 31, | | June 30, |
| | 2023 | | 2022 | | 2022 |
| | | | | | | | | |
| Assets | | | | | | | | |
| Cash and cash equivalents | $ | 172,371 | | $ | 173,661 | | $ | 171,312 |
| Restricted cash (1) | | 85,207 | | | 25,381 | | | 35,142 |
| Accounts receivable and contract assets | | 669,311 | | | 669,803 | | | 609,196 |
| Warehouse receivables (2) | | 77,443 | | | 29,623 | | | 33,595 |
| Prepaids and other assets | | 287,490 | | | 269,605 | | | 264,690 |
| Real estate assets held for sale | | 41,084 | | | 45,353 | | | 199,461 |
| Current assets | | 1,332,906 | | | 1,213,426 | | | 1,313,396 |
| Other non-current assets | | 182,305 | | | 166,726 | | | 140,677 |
| Fixed assets | | 182,944 | | | 164,493 | | | 144,346 |
| Operating lease right-of-use assets | | 365,198 | | | 341,623 | | | 316,731 |
| Deferred tax assets, net | | 67,959 | | | 63,460 | | | 68,429 |
| Goodwill and intangible assets | | 3,167,063 | | | 3,148,449 | | | 2,198,567 |
| Total assets | $ | 5,298,375 | | $ | 5,098,177 | | $ | 4,182,146 |
| | | | | | | | | |
| Liabilities and shareholders' equity | | | | | | | | |
| Accounts payable and accrued liabilities | $ | 1,008,318 | | $ | 1,128,754 | | $ | 913,059 |
| Other current liabilities | | 101,528 | | | 100,840 | | | 96,272 |
| Long-term debt - current | | 8,960 | | | 1,360 | | | 4,808 |
| Warehouse credit facilities (2) | | 70,009 | | | 24,286 | | | 27,208 |
| Operating lease liabilities - current | | 88,659 | | | 84,989 | | | 78,138 |
| Liabilities related to real estate assets held for sale | | - | | | 1,353 | | | 109,666 |
| Current liabilities | | 1,277,474 | | | 1,341,582 | | | 1,229,151 |
| Long-term debt - non-current | | 1,659,461 | | | 1,437,739 | | | 1,035,178 |
| Operating lease liabilities - non-current | | 348,707 | | | 322,496 | | | 298,121 |
| Other liabilities | | 157,379 | | | 139,392 | | | 129,094 |
| Deferred tax liabilities, net | | 44,722 | | | 57,754 | | | 55,093 |
| Convertible notes | | - | | | 226,534 | | | 225,866 |
| Redeemable non-controlling interests | | 1,093,696 | | | 1,079,306 | | | 720,685 |
| Shareholders' equity | | 716,936 | | | 493,374 | | | 488,958 |
| Total liabilities and equity | $ | 5,298,375 | | $ | 5,098,177 | | $ | 4,182,146 |
| | | | | | | | | |
| Supplemental balance sheet information | | | | | | | | |
| Total debt (3) | $ | 1,668,421 | | $ | 1,439,099 | | $ | 1,039,986 |
| Total debt, net of cash and cash equivalents (3) | | 1,496,050 | | | 1,265,438 | | | 868,674 |
| Net debt / pro forma adjusted EBITDA ratio (4) | | 2.4 | | | 1.8 | | | 1.4 |
Notes to Condensed Consolidated Balance Sheets
- Restricted cash consists primarily of cash amounts set aside to satisfy legal or contractual requirements arising in the normal course of business.
- Warehouse receivables represent mortgage loans receivable, the majority of which are offset by borrowings under warehouse credit facilities which fund loans that financial institutions have committed to purchase.
- Excluding warehouse credit facilities and convertible notes.
- Net debt for financial leverage ratio excludes restricted cash, warehouse credit facilities and convertible notes, in accordance with debt agreements.
| Colliers International Group Inc. | | | | | | | | | | | |
| Condensed Consolidated Statements of Cash Flows | | | | | | | |
| (in thousands of US$) |
| | Three months ended | | Six months ended |
| | June 30 | | June 30 |
| | 2023 | | 2022 | | 2023 | | 2022 |
| | | | | | | | | | | | |
| Cash provided by (used in) | | | | | | | | | | | |
| | | | | | | | | | | | |
| Operating activities | | | | | | | | | | | |
| Net earnings | $ | 35,001 | | | $ | 66,731 | | | $ | 34,094 | | | $ | 88,048 | |
| Items not affecting cash: | | | | | | | | | | | |
| Depreciation and amortization | | 50,794 | | | | 44,097 | | | | 100,286 | | | | 80,737 | |
| Loss on disposal of operations | | 2,282 | | | | 950 | | | | 2,282 | | | | 27,040 | |
| Gains attributable to mortgage servicing rights | | (6,052 | ) | | | (2,526 | ) | | | (9,087 | ) | | | (7,823 | ) |
| Gains attributable to the fair value of loan | | | | | | | | | | | |
| premiums and origination fees | | (4,009 | ) | | | (4,272 | ) | | | (8,026 | ) | | | (11,554 | ) |
| Deferred income tax | | (10,915 | ) | | | (16 | ) | | | (21,904 | ) | | | (11,193 | ) |
| Other | | 31,212 | | | | 22,842 | | | | 66,521 | | | | 40,629 | |
| | | 98,313 | | | | 127,806 | | | | 164,166 | | | | 205,884 | |
| | | | | | | | | | | | |
Increase in accounts receivable, prepaid
expenses and other assets | | (26,970 | ) | | | (165,922 | ) | | | (56,725 | ) | | | (337,927 | ) |
| Increase (decrease) in accounts payable, accruedexpenses and other liabilities | | (2,654 | ) | | | (19,206 | ) | | | 457 | | | | (9,346 | ) |
| Increase (decrease) in accrued compensation | | 26,678 | | | | 60,535 | | | | (153,630 | ) | | | (208,235 | ) |
| Contingent acquisition consideration paid | | (2,719 | ) | | | (1,257 | ) | | | (2,991 | ) | | | (60,810 | ) |
| Mortgage origination activities, net | | 6,285 | | | | 7,527 | | | | 9,070 | | | | 16,271 | |
| Sales to AR Facility, net | | 40 | | | | 22,916 | | | | 6,058 | | | | 145,853 | |
| Net cash provided by (used in) operating activities | | 98,973 | | | | 32,399 | | | | (33,595 | ) | | | (248,310 | ) |
| | | | | | | | | | | | |
| Investing activities | | | | | | | | | | | |
| Acquisition of businesses, net of cash acquired | | (59,698 | ) | | | (328,120 | ) | | | (59,698 | ) | | | (380,598 | ) |
| Purchases of fixed assets | | (22,179 | ) | | | (13,581 | ) | | | (41,062 | ) | | | (23,416 | ) |
| Purchase of held for sale real estate assets | | (2,580 | ) | | | (117,042 | ) | | | (40,576 | ) | | | (117,042 | ) |
| Proceeds from sale of held for sale real estate assets | | - | | | | 48,505 | | | | 44,000 | | | | 48,505 | |
| Cash collections on AR Facility deferred purchase price | | 28,539 | | | | 90,101 | | | | 59,311 | | | | 256,429 | |
| Other investing activities | | (8,476 | ) | | | (10,682 | ) | | | (29,543 | ) | | | (31,647 | ) |
| Net cash used in investing activities | | (64,394 | ) | | | (330,819 | ) | | | (67,568 | ) | | | (247,769 | ) |
| | | | | | | | | | | | |
| Financing activities | | | | | | | | | | | |
| Increase in long-term debt, net | | 47,248 | | | | 345,676 | | | | 219,668 | | | | 537,406 | |
| Purchases of non-controlling interests, net | | (3,789 | ) | | | (7,595 | ) | | | (16,333 | ) | | | (33,557 | ) |
| Dividends paid to common shareholders | | - | | | | - | | | | (6,440 | ) | | | (6,608 | ) |
| Distributions paid to non-controlling interests | | (40,059 | ) | | | (26,628 | ) | | | (51,120 | ) | | | (41,554 | ) |
| Repurchases of Subordinate Voting Shares | | - | | | | (53,681 | ) | | | - | | | | (126,366 | ) |
| Other financing activities | | (1,350 | ) | | | (4,329 | ) | | | 13,637 | | | | (34,053 | ) |
| Net cash provided by financing activities | | 2,050 | | | | 253,443 | | | | 159,412 | | | | 295,268 | |
| | | | | | | | | | | | |
| Effect of exchange rate changes on cash | | (1,704 | ) | | | (14,167 | ) | | | 287 | | | | (18,006 | ) |
| | | | | | | | | | | | |
| Net change in cash and cash equivalents and restricted cash | | 34,925 | | | | (59,144 | ) | | | 58,536 | | | | (218,817 | ) |
| Cash and cash equivalents and restricted cash, beginning of period | | 222,653 | | | | 265,598 | | | | 199,042 | | | | 425,271 | |
| Cash and cash equivalents and restricted cash, end of period | $ | 257,578 | | | $ | 206,454 | | | $ | 257,578 | | | $ | 206,454 | |
| Colliers International Group Inc. | | | | | | | | | | | | | | | |
| Segmented Results |
| (in thousands of US dollars) |
| | | | | | | | | | | | | | | | | | |
| | | | | | Asia | | Investment | | | | |
| | Americas | | EMEA | | Pacific | | Management | | Corporate | | Consolidated |
| | | | | | | | | | | | | | | | | | |
| Three months ended June 30 | | | | | | | | | | | | | | | | |
| | | | | | | | | | | | | | | | | | |
| 2023 | | | | | | | | | | | | | | | | | |
| Revenues | $ | 631,332 | | $ | 173,818 | | | $ | 153,915 | | $ | 118,860 | | $ | 113 | | | $ | 1,078,038 |
| Adjusted EBITDA | | 69,588 | | | 6,315 | | | | 23,032 | | | 50,042 | | | (1,897 | ) | | | 147,080 |
| Operating earnings (loss) | | 46,450 | | | (5,053 | ) | | | 19,554 | | | 26,407 | | | (12,096 | ) | | | 75,262 |
| | | | | | | | | | | | | | | | | | |
| 2022 | | | | | | | | | | | | | | | | | |
| Revenues | $ | 740,711 | | $ | 169,271 | | | $ | 142,604 | | $ | 75,148 | | $ | 112 | | | $ | 1,127,846 |
| Adjusted EBITDA | | 101,573 | | | 14,367 | | | | 19,543 | | | 29,199 | | | (3,369 | ) | | | 161,313 |
| Operating earnings (loss) | | 81,108 | | | 4,209 | | | | 17,558 | | | 19,150 | | | (18,175 | ) | | | 103,850 |
| | | | | | | | | | | | | | | | | | |
| | | | | | | | | | | | | | | | | | |
| | | | | | Asia | | Investment | | | | |
| | Americas | | EMEA | | Pacific | | Management | | Corporate | | Consolidated |
| | | | | | | | | | | | | | | | | | |
| Six months ended June 30 | | | | | | | | | | | | | | | | |
| | | | | | | | | | | | | | | | | | |
| 2023 | | | | | | | | | | | | | | | | | |
| Revenues | $ | 1,212,883 | | $ | 317,189 | | | $ | 274,008 | | $ | 239,606 | | $ | 255 | | | $ | 2,043,941 |
| Adjusted EBITDA | | 123,451 | | | (4,946 | ) | | | 31,081 | | | 104,936 | | | (2,819 | ) | | | 251,703 |
| Operating earnings (loss) | | 79,321 | | | (30,087 | ) | | | 24,593 | | | 41,211 | | | (17,632 | ) | | | 97,406 |
| | | | | | | | | | | | | | | | | | |
| 2022 | | | | | | | | | | | | | | | | | |
| Revenues | $ | 1,382,409 | | $ | 322,596 | | | $ | 261,984 | | $ | 161,525 | | $ | 244 | | | $ | 2,128,758 |
| Adjusted EBITDA | | 182,639 | | | 19,286 | | | | 29,762 | | | 56,000 | | | (4,913 | ) | | | 282,774 |
| Operating earnings (loss) (1) | | 142,415 | | | (26,572 | ) | | | 25,783 | | | 36,371 | | | (33,313 | ) | | | 144,684 |
Notes to Segmented Results
- Operating earnings (loss) include loss on disposal of certain operations, primarily in EMEA.
COMPANY CONTACTS:
Jay S. Hennick
Chairman & Chief Executive Officer
Chris McLernon
Chief Executive Officer, Real Estate Services
Christian Mayer
Chief Financial Officer
(416) 960-9500
Exhibit 99.2

Second Quarter 2023 Financial Results August 2, 2023 1
Forward - Looking Statements Colliers 2 This presentation includes or may include forward - looking statements. Forward - looking statements include the Company’s financial performance outlook and statements regarding goals, beliefs, strategies, objectives, plans or current expectations. These statements involve known and unknown risks, unce rta inties and other factors which may cause the actual results to be materially different from any future results, performance or achievements contemplated in the forward - looking stat ements. Such factors include: economic conditions, especially as they relate to commercial and consumer credit conditions and business spending; commercial real estate property va lues, vacancy rates and general conditions of financial liquidity for real estate transactions; the effects of changes in foreign exchange rates in relation to the US dollar on Cana dia n dollar, Australian dollar, UK pound sterling and Euro denominated revenues and expenses; competition in markets served by the Company; labor shortages or increases in commission, wag e and benefit costs; the impact of higher than expected inflation could impact profitability of certain contracts; impact of pandemics on client demand, ability to deliver ser vices and ensure the health and productivity of employees; disruptions or security failures in information technology systems; cybersecurity risks; a change in/loss of our relationship wi th US government agencies could significantly impact our ability to originate mortgage loans; default on loans originated under the Fannie Mae Delegated Underwriting and Servicing pr ogr am could materially affect our profitability; the effect of increases in interest rates on our cost of borrowing and political conditions or events, including elections, referenda, chan ges to international trade and immigration policies and any outbreak or escalation of terrorism or hostilities. Additional factors and explanatory information are identified in the Company’s Annual Information Form for the year ended Dec emb er 31, 2022 under the heading “Risk Factors” (which factors are adopted herein, and which can be accessed at www.sedar.com) and other periodic filings with Canadian and US secur iti es regulators. Forward looking statements contained in this presentation are made as of the date hereof and are subject to change. All forward - looking statements in this press rele ase are qualified by these cautionary statements. Except as required by applicable law, Colliers undertakes no obligation to publicly update or revise any forward - looking statement, whe ther as a result of new information, future events or otherwise. This presentation does not constitute an offer to sell or a solicitation of an offer to purchase an interest in any fund. Non - GAAP measures This presentation makes reference to certain non - GAAP measures, including local currency (“LC”) revenue growth rate, internal re venue growth rate, Adjusted EBITDA (“AEBITDA”), Adjusted EPS (“AEPS”) and assets under management (“AUM”). Please refer to Appendix for reconciliations to GAAP measures.

USD LC (1) Revenue 2,043.9 2,128.8 -4% -3% Adjusted EBITDA 251.7 282.8 -11% -11% Adjusted EBITDA Margin 12.3% 13.3% Adjusted EPS 2.16 3.28 -34% GAAP Operating Earnings (Loss) 97.4 144.7 -33% GAAP Operating Earnings Margin 4.8% 6.8% GAAP diluted EPS (0.61) 0.26 NM Six months ended June 30 2023 2022 % Change Colliers 3 (US$ millions, except per share amounts) High value recurring revenues continue to scale Highlights Robust growth in Investment Management and Outsourcing & Advisory Capital Markets and, to a lesser extent, Leasing declined compared to the prior year’s record transactional revenue levels Completed three strategic Engineering and Project Management investments in Australia, New Zealand and the US Completed early redemption of 4% convertible notes, substantially all of which were converted to subordinate voting shares Maintaining outlook for 2023 previously provided in May 2023 USD LC (1) Revenue 1,078.0 1,127.8 -4% -4% Adjusted EBITDA 147.1 161.3 -9% -8% Adjusted EBITDA Margin 13.6% 14.3% Adjusted EPS 1.31 1.84 -29% GAAP Operating Earnings 75.3 103.9 -28% GAAP Operating Earnings Margin 7.0% 9.2% GAAP diluted net loss per share (0.16) 0.67 NM Three months ended June 30 2023 2022 %Change
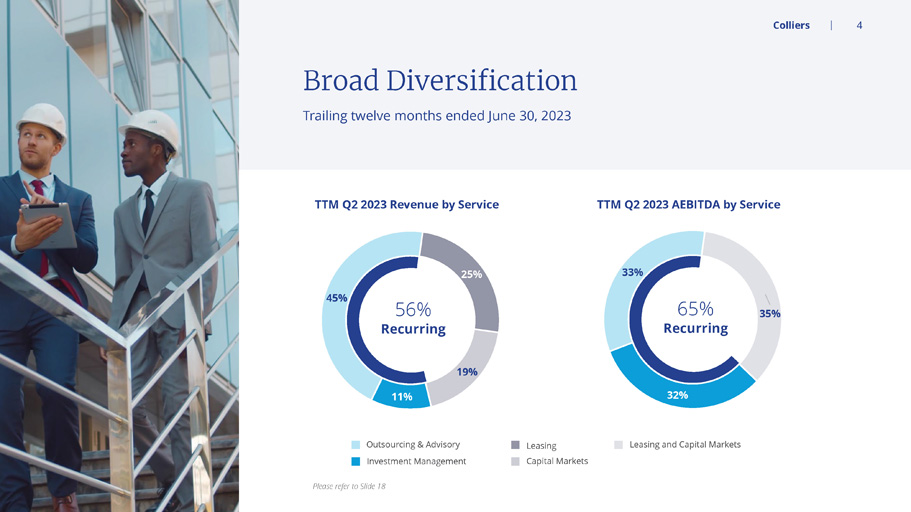
33% 35% 32% 45% 25% 19% 11% 56% Recurring 65% Recurring TTM Q2 2023 Revenue by Service TTM Q2 2023 AEBITDA by Service Colliers 4 Please refer to Slide 18 Outsourcing & Advisory Leasing Capital Markets Leasing and Capital Markets Trailing twelve months ended June 30, 2023 Broad Diversification Investment Management
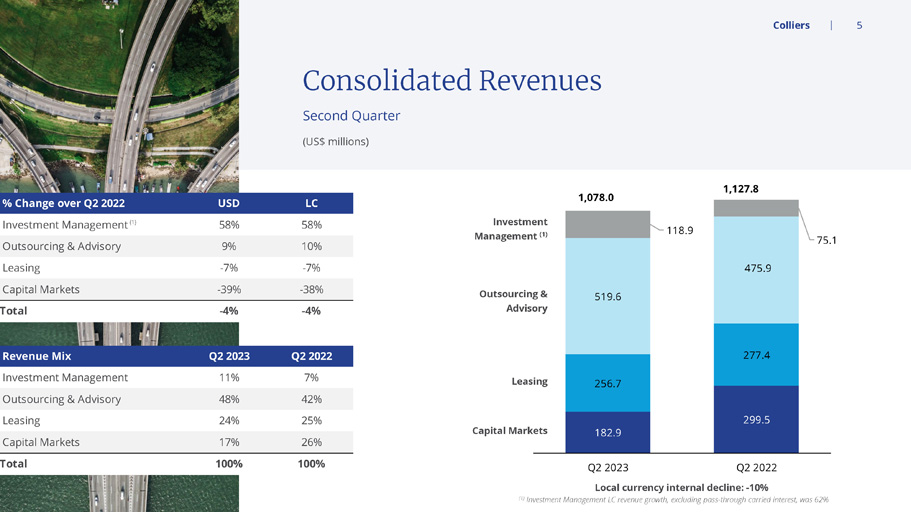
% Change over Q2 2022 USD LC Investment Management (1) 58% 58% Outsourcing & Advisory 9% 10% Leasing -7% -7% Capital Markets -39% -38% Total -4% -4% Revenue Mix Q2 2023 Q2 2022 Investment Management 11% 7% Outsourcing & Advisory 48% 42% Leasing 24% 25% Capital Markets 17% 26% Total 100% 100% Colliers 5 Outsourcing & Advisory Investment Management (1) Capital Markets Leasing Local currency internal decline: - 10% (1) Investment Management LC revenue growth, excluding pass - through carried interest, was 62% ��� � �� ��� � �� ��� � �� ��� � �� ��� � �� ��� � �� ��� � �� �� � �� � � ��� � �� � � ��� � �� 4 ������ 4 ������ Second Quarter Consolidated Revenues (US$ millions)

Colliers 6 Second Quarter Geographic Mix Q2 2023 Revenues Q2 2022 Revenues $PHULFDV �� � �� (0($ � � � $VLD�3DFLȴF �� � �� ΖQYHVWPHQW� 0DQDJHPHQW �� � �� �� � �� � �� � � � Q2 2023 AEBITDA Q2 2022 AEBITDA (1) Q2 2023 GAAP Operating Earnings: $46.5M Americas, ($5.1M) EMEA, $19.6M Asia Pacific, $26.4M Investment Management (2) Q2 2022 GAAP Operating Earnings: $81.1M Americas, $4.2M EMEA, $17.6M Asia Pacific, $19.2M Investment Management $PHULFDV ��� � �� (0($ ��� � �� $VLD�3DFLȴF ��� � �� ΖQYHVWPHQW� 0DQDJHPHQW ��� � �� �� � �� � �� � �� � (US$ millions)

Colliers 7 GAAP Operating Earnings: Q2 2023 $46.5M at 7.4% margin; Q2 2022 $81.1M at 11.0% margin Capital Markets and, to a lesser extent, Leasing declined relative to a record prior year quarter Outsourcing & Advisory growth led by Engineering & Design and Project Management Adjusted EBITDA benefitted from cost control actions; Prior year included an $11.7 million gain on termination of a lease Second Quarter Americas (US$ millions) ��� � � ��� � � ��� � � ��� � � ��� � � ��� � � ��� � � ��� � � 4 ������ 4 ������ USD LC Revenue Growth -15% -14% Revenues AEBITDA Outsourcing & Advisory Leasing Capital Markets
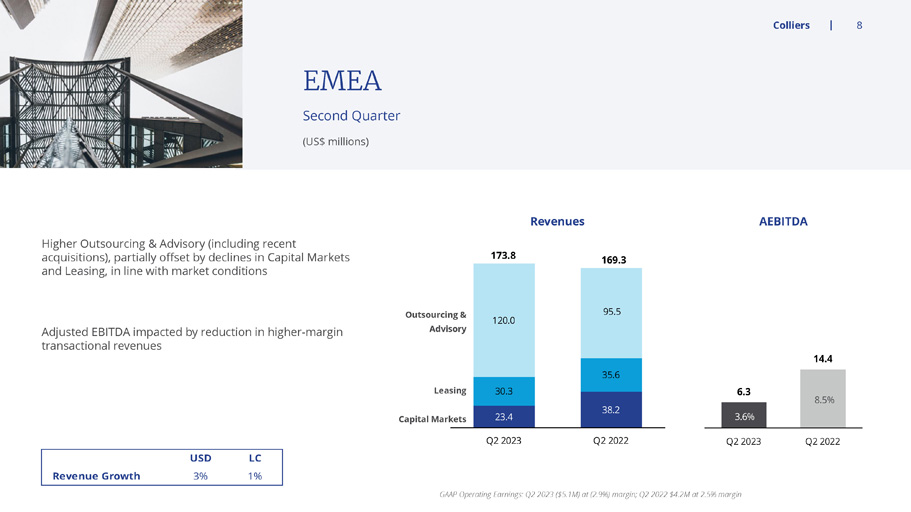
Colliers 8 GAAP Operating Earnings: Q2 2023 ($5.1M) at (2.9%) margin; Q2 2022 $4.2M at 2.5% margin Higher Outsourcing & Advisory (including recent acquisitions), partially offset by declines in Capital Markets and Leasing, in line with market conditions Adjusted EBITDA impacted by reduction in higher - margin transactional revenues Second Quarter EMEA (US$ millions) �� � � �� � � �� � � �� � � ��� � � �� � � ��� � � ��� � � 4 ������ 4 ������ USD LC Revenue Growth 3% 1% Revenues AEBITDA Outsourcing & Advisory Leasing Capital Markets

Colliers 9 GAAP Operating Earnings: Q2 2023 $19.6M at 12.7% margin; Q2 2022 $17.6M at 12.3% margin Leasing and Outsourcing & Advisory (including recent acquisitions) growth more than offset a modest decline in Capital Markets Foreign exchange headwinds impacted revenues by 6% Adjusted EBITDA favourably impacted by higher revenues and the impact of recent acquisitions Second Quarter APAC (US$ millions) �� � � �� � � �� � � �� � � �� � � �� � � ��� � � ��� � � 4 ������ 4 ������ USD LC Revenue Growth 8% 14% Revenues AEBITDA Outsourcing & Advisory Leasing Capital Markets
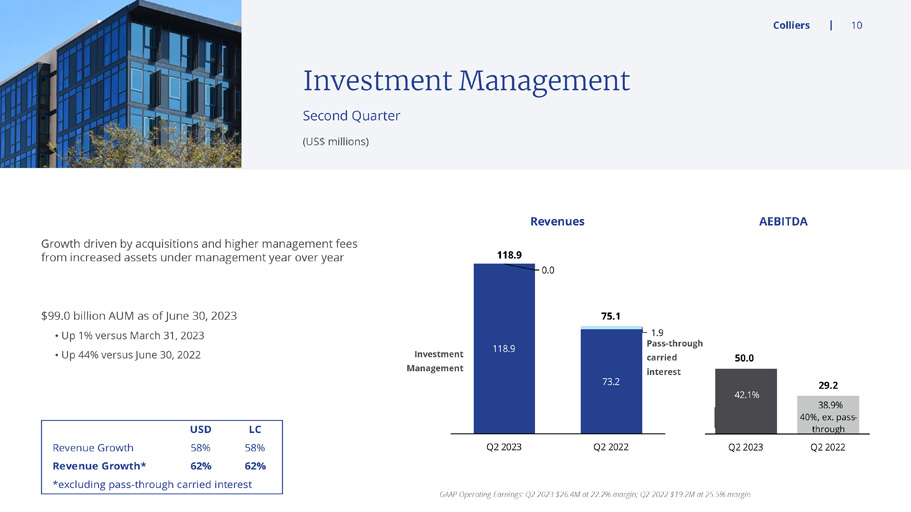
Colliers 10 GAAP Operating Earnings: Q2 2023 $26.4M at 22.2% margin; Q2 2022 $19.2M at 25.5% margin Growth driven by acquisitions and higher management fees from increased assets under management year over year $99.0 billion AUM as of June 30, 2023 • Up 1% versus March 31, 2023 • Up 44% versus June 30, 2022 Second Quarter Investment Management (US$ millions) ��� � � �� � � � � � � � � ��� � � �� � � 4 ������ 4 ������ USD LC Revenue Growth 58% 58% Revenue Growth* 62% 62% *excluding pass-through carried interest Revenues AEBITDA Pass - through carried interest Investment Management
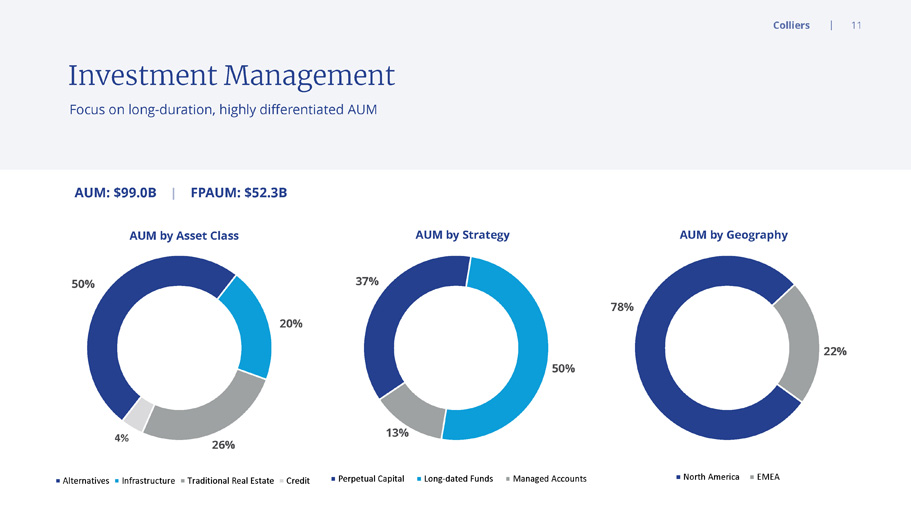
Colliers 11 50% 20% 26% 4% Alternatives Infrastructure Traditional Real Estate Credit AUM by Asset Class 37% 50% 13% Perpetual Capital Long-dated Funds Managed Accounts AUM by Strategy 78% 22% North America EMEA AUM by Geography AUM: $99.0B | FPAUM: $52.3B Focus on long - duration, highly differentiated AUM Investment Management

(1) Net debt for financial leverage ratio excludes restricted cash, warehouse credit facilities and convertible notes, in acc ord ance with debt agreements (2) Includes business acquisitions, contingent acquisition consideration and purchases of non - controlling interests in subsidiar ies Colliers 12 Cash $ 172.4 $ 173.7 $ 171.3 Total Debt 1,668.4 1,439.1 1,040.0 Net Debt $ 1,496.1 $ 1,265.4 $ 868.7 Convertible Notes - 226.5 225.9 Redeemable non-controlling interests 1,093.7 1,079.3 720.7 Shareholders' equity 716.9 493.4 489.0 Total capitalization $ 3,306.7 $ 3,064.6 $ 2,304.3 Net debt / pro forma adjusted EBITDA - Leverage Ratio (1) 2.4x 1.8x 1.4x Capital Expenditures $ 41.1 $ 23.4 Acquisition Spend (2) $ 82.1 $ 517.9 Six months ended June 30, 2023 June 30, 2022 June 30, 2023 December 31, 2022 June 30, 2022 Highlights • Leverage ratio of 2.4x • Early redemption of 4% convertible notes; Substantially all converted into subordinate voting shares • 55% of debt at fixed rates as of June 30, 2023 • Ample liquidity to fund acquisitions and internal growth • Anticipating capital expenditures of $90 - $100 million in 2023 (US$ millions) Capitalization & Capital Allocation
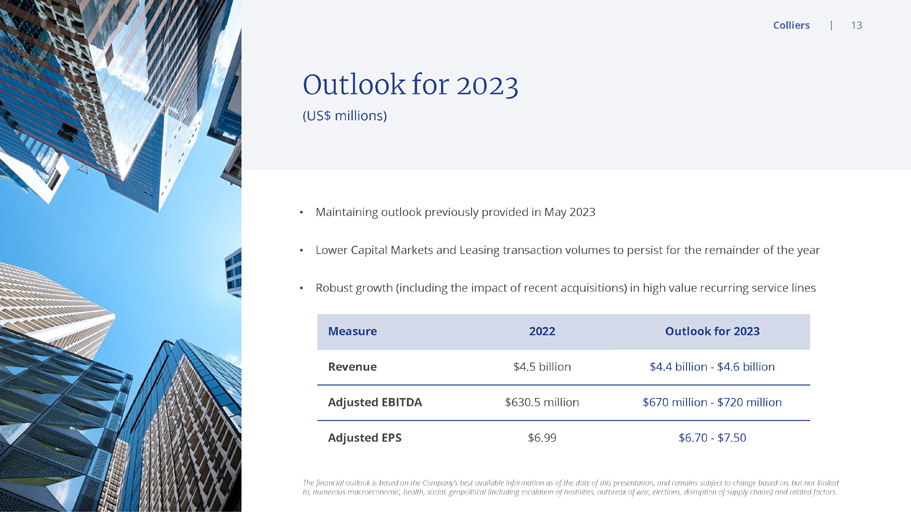
Colliers 13 (US$ millions) Outlook for 2023 • Maintaining outlook previously provided in May 2023 • Lower Capital Markets and Leasing transaction volumes to persist for the remainder of the year • Robust growth (including the impact of recent acquisitions) in high value recurring service lines Outlook for 2023 2022 Measure $4.4 billion - $4.6 billion $4.5 billion Revenue $670 million - $720 million $630.5 million Adjusted EBITDA $6.70 - $7.50 $6.99 Adjusted EPS The financial outlook is based on the Company’s best available information as of the date of this presentation, and remains s ubj ect to change based on, but not limited to, numerous macroeconomic, health, social, geopolitical (including escalation of hostilities, outbreak of war, elections, di sru ption of supply chains) and related factors.

Appendix Reconciliation of non - GAAP measures
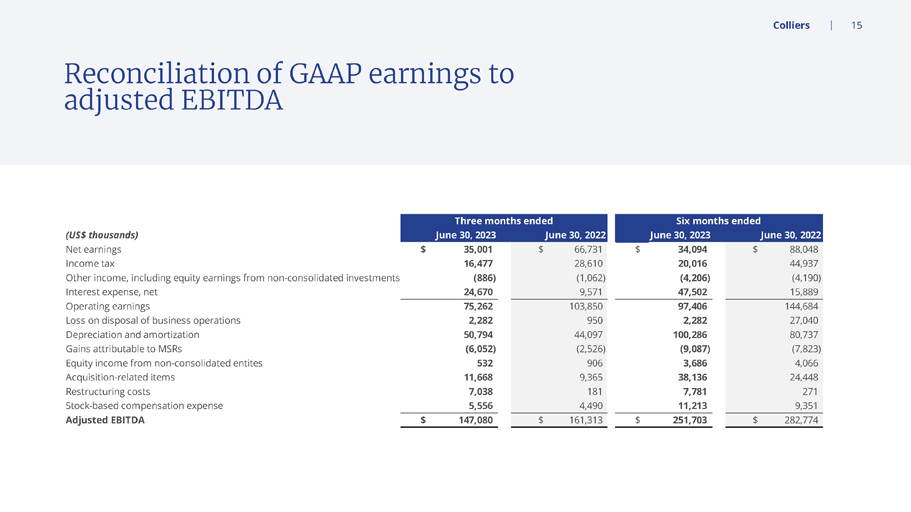
Colliers 15 Reconciliation of GAAP earnings to adjusted EBITDA (US$ thousands) Net earnings $ 35,001 $ 66,731 $ 34,094 $ 88,048 Income tax 16,477 28,610 20,016 44,937 Other income, including equity earnings from non-consolidated investments (886) (1,062) (4,206) (4,190) Interest expense, net 24,670 9,571 47,502 15,889 Operating earnings 75,262 103,850 97,406 144,684 Loss on disposal of business operations 2,282 950 2,282 27,040 Depreciation and amortization 50,794 44,097 100,286 80,737 Gains attributable to MSRs (6,052) (2,526) (9,087) (7,823) Equity income from non-consolidated entites 532 906 3,686 4,066 Acquisition-related items 11,668 9,365 38,136 24,448 Restructuring costs 7,038 181 7,781 271 Stock-based compensation expense 5,556 4,490 11,213 9,351 Adjusted EBITDA $ 147,080 $ 161,313 $ 251,703 $ 282,774 Three months ended Six months ended June 30, 2023 June 30, 2022 June 30, 2023 June 30, 2022

Colliers 16 Adjusted EPS is calculated using the “if - converted” method of calculating earnings per share in relation to the Convertible Note s, which were issued on May 19, 2020 and fully converted or redeemed by June 1, 2023 Reconciliation of GAAP earnings to adjusted net earnings and adjusted earnings per share (US$ thousands) Net earnings $ 35,001 $ 66,731 $ 34,094 $ 88,048 Non-controlling interest share of earnings (13,816) (11,806) (24,757) (20,322) Interest on Convertible Notes 561 2,300 2,861 4,600 Loss on disposal of operations 2,282 950 2,282 27,040 Amortization of intangible assets 37,330 32,279 74,173 56,870 Gains attributable to MSRs (6,052) (2,526) (9,087) (7,823) Acquisition-related items 11,668 9,365 38,136 24,448 Restructuring costs 7,038 181 7,781 271 Stock-based compensation expense 5,556 4,490 11,213 9,351 Income tax on adjustments (11,845) (9,891) (23,193) (16,310) Non-controlling interest on adjustments (5,773) (4,269) (10,926) (7,939) Adjusted net earnings $ 61,950 $ 87,804 $ 102,577 $ 158,234 (US$) Diluted net earnings (loss) per common share $ (0.14) $ 0.64 $ (0.57) $ 0.24 Interest on Convertible Notes, net of tax 0.01 0.04 0.04 0.07 Non-controlling interest redemption increment 0.59 0.51 0.77 1.16 Loss on disposal of operations 0.05 0.02 0.05 0.56 Amortization expense, net of tax 0.49 0.41 0.97 0.71 Gains attributable to MSRs, net of tax (0.07) (0.03) (0.11) (0.09) Acquisition-related items 0.19 0.18 0.70 0.45 Restructuring costs, net of tax 0.11 - 0.12 - Stock-based compensation expense, net of tax 0.08 0.07 0.19 0.18 Adjusted EPS $ 1.31 $ 1.84 $ 2.16 $ 3.28 Diluted weighted average shares for Adjusted EPS (thousands) 47,422 47,804 47,442 48,302 Three months ended Six months ended June 30, 2023 June 30, 2022 June 30, 2023 June 30, 2022 Three months ended Six months ended June 30, 2023 June 30, 2022 June 30, 2023 June 30, 2022
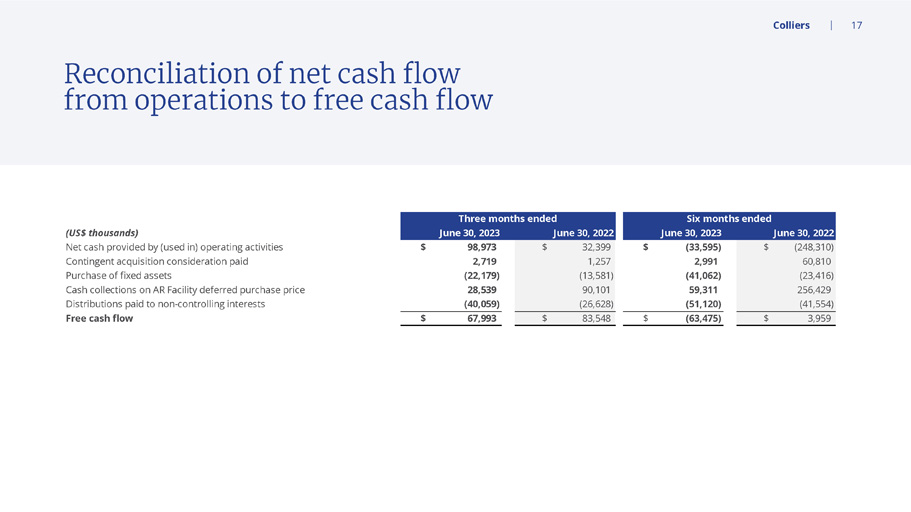
Colliers 17 (US$ thousands) Net cash provided by (used in) operating activities $ 98,973 $ 32,399 $ (33,595) $ (248,310) Contingent acquisition consideration paid 2,719 1,257 2,991 60,810 Purchase of fixed assets (22,179) (13,581) (41,062) (23,416) Cash collections on AR Facility deferred purchase price 28,539 90,101 59,311 256,429 Distributions paid to non-controlling interests (40,059) (26,628) (51,120) (41,554) Free cash flow $ 67,993 $ 83,548 $ (63,475) $ 3,959 Three months ended Six months ended June 30, 2023 June 30, 2022 June 30, 2023 June 30, 2022 Reconciliation of net cash flow from operations to free cash flow

Local currency revenue growth rate and internal revenue growth rate measures Percentage revenue and AEBITDA variances presented on a local currency basis are calculated by translating the current period results of our non - US dollar denominated operations to US dollars using the foreign currency exchange rates from the periods against which the current period results are being compared. Percentage revenue variances presented on an internal growth basis are calculated assuming no impact from acquired entities in the current and prior periods. Revenue from acquired entities, including any foreign exchange impacts, are treated as acquisition growth until the respective anniversaries of the acquisitions. We believe that these revenue growth rate methodologies provide a framework for assessing the Company’s performance and operations excluding the effects of foreign currency exchange rate fluctuations and acquisitions. Since these revenue growth rate measures are not calculated under GAAP, they may not be comparable to similar measures used by other issuers. Assets under management We use the term assets under management (“AUM”) as a measure of the scale of our Investment Management operations. AUM is defined as the gross market value of operating assets and the projected gross cost of development assets of the funds, partnerships and accounts to which we provide management and advisory services, including capital that such funds, partnerships and accounts have the right to call from investors pursuant to capital commitments. Our definition of AUM may differ from those used by other issuers and as such may not be directly comparable to similar measures used by other issuers. Fee paying assets under management We use the term fee paying assets under management (“FPAUM”) to represent only the AUM on which the Company is entitled to receive management fees. We believe this measure is useful in providing additional insight into the capital base upon which the Company earns management fees. Our definition of FPAUM may differ from those used by other issuers and as such may not be directly comparable to similar measures used by other issuers. Recurring revenue percentage Recurring revenue percentage is computed on a trailing twelve - month basis and represents the proportion that is derived from Outsourcing & Advisory and Investment Management service lines. Both these service lines represent medium to long - term duration revenue streams that are either contractual or repeatable in nature. Revenue for this purpose incorporates the expected full year impact of acquisitions and dispositions. Adjusted EBITDA from recurring revenue percentage Adjusted EBITDA from recurring revenue percentage is computed on a trailing twelve - month basis and represents the proportion of adjusted EBITDA that is derived from Outsourcing & Advisory and Investment Management service lines. Both these service lines represent medium to long - term duration revenue streams that are either contractual or repeatable in nature. Adjusted EBITDA for this purpose is calculated in the same manner as calculated for our debt agreement covenant calculation purposes, incorporating the expected full year impact of business acquisitions and dispositions. Colliers 18 Other Non - GAAP Measures
Colliers (NASDAQ:CIGI)
과거 데이터 주식 차트
부터 4월(4) 2024 으로 5월(5) 2024

Colliers (NASDAQ:CIGI)
과거 데이터 주식 차트
부터 5월(5) 2023 으로 5월(5) 2024
