
Marimaca Announces Significant
Increase in Mineral Resources at the Marimaca Copper Project
- 98% increase in M&I Resource tonnes to 140Mt at
0.48% CuT for 665.5kt of Contained Copper
- 92% growth in Inferred Resource tonnes to 83Mt at 0.39%
CuT for 322.9kt of Contained Copper
- Marimaca Confirmed as One of the Largest Copper
Discoveries in the Last
Decade(2)
VANCOUVER, British Columbia, Oct. 14, 2022 -- InvestorsHub
NewsWire -- Marimaca Copper Corp. (“Marimaca Copper” or the
“Company”) (TSX: MARI) is
pleased to announce an updated Mineral Resource Estimate (“MRE”)
for the Marimaca Oxide Deposit (the “MOD” or the “Project”) located
in the Antofagasta region of northern Chile. The 2022 MRE
demonstrates significant resource growth over the 2019 MRE and
marks an important step-change in the scale of the Project,
supporting a potential production rate higher than proposed in the
Preliminary Economic Assessment (“PEA”).
The 2022 MRE incorporates 19,580m of ~41,500m of drilling
(reverse circulation (“RC”) + diamond) completed in 2022 for a
total of over 110,000m of drilling completed since 2016. The
balance of the 2022 infill drilling program, totalling
approximately 28,000m, will be included in a subsequent MRE planned
for early 2023 with the objective of converting the remaining
Inferred Resources to the Measured and Indicated Categories to
underpin the Definitive Feasibility Study (“DFS”) planned for
2023.
The 2022 MRE was prepared in accordance with the Canadian
Institute of Mining, Metallurgy and Petroleum ("CIM") Definition
Standards and National Instrument 43-101 - Standards of Disclosure
for Mineral Projects ("NI 43-101").
Highlights
- Significant increase in M&I and Inferred tonnage
and contained metal over the 2019
MRE1
- 98% growth in Measured and Indicated Resource tonnage
to 139.6Mt at 0.48% CuT (0.30% CuS) for ~665,000 tonnes of
contained Cu metal
- 92% growth in Inferred Resource tonnage to 82.7Mt at
0.39% CuT (0.16% CuS) for ~323,000 tonnes of contained
Cu
- Establishes Marimaca as one of the largest copper
discoveries globally in the last
decade2 and has
positive implications for production scale increases in future
development studies
- 50kt and 60kt per annum copper cathode production cases
(vs. 36ktpa LOM average in PEA) will be assessed for
DFS
- High grade core which comprises the first six years of
the 2019 PEA mine life is expected to remain intact and accessible
in a scaled-up development scenario
- Approximately 50Mt at 0.7% CuT commencing from surface
in green
oxide3 for
~350,000 tonnes of contained metal
- Very low strip ratio of 1:1 maintained in constraining
pit shell, with all resources captured in a single continuous
pit
- Low pre-strip and LOM strip ratio drive significant
cost advantages
- Clear opportunities remain for additional resource
expansion with further exploration:
- Mineralization at the MOD remains open to the east,
south-east, and down-plunge
- Near mine (<5km) satellite targets discovered in
2021 – Mercedes, Cindy, and Robles (see announcement dated January
20, 2022) – provide high probability targets for further mine life
extension
- 2019 MRE showed relatively low sensitivity to changes
in underlying copper price assumption indicating high return on
investment of 2021 and 2022 drilling campaigns as they pertained to
resource growth for the MOD (see Figure 1)
- Significant amount of remaining 2022 drilling to be
captured in planned early 2023 MRE
- Targeting majority of tonnes to be captured in M&I
categories to support eventual reserves
- Potential for new higher-grade green oxide zone
identified in the shallow north and north- eastern areas of MOD to
have positive grade implications for final MRE in early
2023
1 2019 MRE at a 0.22% cut-off grade, 2022 MRE at
a 0.15% cut-off grade
2 Source: S&P Global Market Intelligence
3 Per the June 2020 PEA mine plan
Hayden Locke, President & CEO of Marimaca
Copper, commented:
“Sergio Rivera and his team delivered two very successful
drilling programs in 2021 and 2022 through challenging operating
conditions discovering new additional mineralisation adjacent and
below the current Marimaca pit model. The 2022 MRE is a fantastic
achievement and reflects the exceptional exploration and geological
work completed by our extremely dedicated team.
“With the discovery of the MOD depth extensions in 2021, we
believed there was the potential to make a step change in the scale
of the resource. This MRE has clearly achieved that. It establishes
the MOD as one of the most significant greenfield copper oxide
discoveries in the last 20 years and confirms its potential to host
over one million tonnes of contained copper in a single
pit.
“Given the M&I resource estimate already points to more
than 600,000 tonnes of contained metal, the Project will now
clearly support a larger operation in terms of copper cathode
production, but also a meaningful mine life extension. We will
assess production scenarios between 50,000 and 60,000 tonnes per
annum prior to commencing our Definitive Feasibility Study in
2023.
“Importantly, the positive attributes which were key to the
MOD’s industry leading return on invested capital (ROIC) metrics –
low life of mine strip ratio, shallow high-grade core in the first
five years of the mine life, minimal pre-strip and low expected
start up capital cost – remain firmly intact, meaning this resource
upgrade will be reflected as a material improvement in project
value.
“We have completed another 28,000m of drilling for which we
are waiting on results. These will be released over the coming
months and incorporated into a final MRE in early 2023, which will
form the basis of our development plans for the Project.”
Summary of 2022 Mineral Resource Estimate
The 2022 MRE was completed by independent consultants NCL
Ingeniería y Construcción SpA (“NCL”) and verified by Luis Oviedo
of NCL, a qualified person under NI 43-101 and independent of
Marimaca. The 2022 MRE incorporates 110,790m of drilling across 424
drill holes completed between 2016 and 2022 and is reported with an
effective date of October 13, 2022. The Whittle Optimisations were
run using the operating cost parameters from the Preliminary
Economic Assessment for the Project and US$4/lb copper price
assumption.
| Mineral Resource
Category and Type |
Quantity |
CuT |
CuS |
CuT |
CuS |
| (kt) |
(%) |
(%) |
(t) |
(t) |
| Total Measured |
47,051 |
0.54 |
0.36 |
253,157 |
167,614 |
| Total Indicated |
92,516 |
0.45 |
0.26 |
412,375 |
244,200 |
| Total Measured and Indicated |
139,567 |
0.48 |
0.30 |
665,531 |
411,814 |
| Total Inferred |
82,678 |
0.39 |
0.16 |
322,910 |
128,416 |
Table 1. 2022 Mineral Resource Estimate
* Pit shell constrained resources with demonstrated reasonable
prospects for eventual economic extraction (RPEEE) are generated
using series of Lerchs-Grossmann pit shell optimizations completed
by NCL
* CuT means total copper and CuS means acid soluble copper.
Technical and economic parameters include: copper price US$4.00/lb;
mining cost US$1.51/t; HL processing cost US$5.94/t (incl.
G&A); ROM processing cost US$1.65/t (incl. G&A); selling
cost US$0.16/lb Cu; heap leach recovery 76% of CuT; ROM recovery
40% of CuT; and 45°-52° pit slope angle
* With the economic parameters stated above, the Cut-Off grade of
the Mineral Resource Estimate is approximately 0.15% CuT and a
strip ratio of 1:1 has been estimated by NCL.
* Mineral resources which are not mineral reserves do not have
demonstrated economic viability. Due to the uncertainty which may
attach to inferred mineral resources, it cannot be assumed that all
or any part of an inferred mineral resource will be upgraded to an
indicated or measured mineral resource as a result of continued
exploration
Cut-off grade
(% CuT)
|
Measured
|
Indicated
|
Measured +
Indicated |
Inferred |
|
| |
| Quantity kt |
CuT [%] |
CuS [%] |
Quantity kt |
CuT [%] |
CuS [%] |
Quantity kt |
CuT [%] |
CuS [%] |
Quantity kt |
CuT [%] |
CuS [%] |
|
| 0.40 |
24,607 |
0.79 |
0.53 |
37,550 |
0.72 |
0.44 |
62,158 |
0.74 |
0.48 |
27,222 |
0.68 |
0.25 |
|
| 0.30 |
32,157 |
0.68 |
0.46 |
54,563 |
0.60 |
0.37 |
86,720 |
0.63 |
0.40 |
41,422 |
0.56 |
0.22 |
|
| 0.25 |
36,837 |
0.63 |
0.42 |
65,910 |
0.55 |
0.33 |
102,746 |
0.58 |
0.36 |
52,332 |
0.50 |
0.20 |
|
| 0.22 |
40,000 |
0.60 |
0.40 |
73,517 |
0.51 |
0.31 |
113,517 |
0.54 |
0.34 |
60,431 |
0.47 |
0.19 |
|
| 0.20 |
42,206 |
0.58 |
0.39 |
78,880 |
0.49 |
0.30 |
121,086 |
0.52 |
0.33 |
66,256 |
0.44 |
0.18 |
|
| 0.18 |
44,291 |
0.56 |
0.37 |
84,610 |
0.47 |
0.28 |
128,900 |
0.50 |
0.31 |
72,670 |
0.42 |
0.17 |
|
| 0.15 |
47,051 |
0.54 |
0.36 |
92,516 |
0.45 |
0.26 |
139,567 |
0.48 |
0.30 |
82,678 |
0.39 |
0.16 |
|
| 0.10 |
50,536 |
0.51 |
0.34 |
100,946 |
0.42 |
0.25 |
151,482 |
0.45 |
0.28 |
96,064 |
0.35 |
0.14 |
|
| 0.05 |
57,125 |
0.46 |
0.30 |
119,653 |
0.36 |
0.21 |
176,777 |
0.39 |
0.24 |
123,552 |
0.29 |
0.11 |
|
| 0.00 |
61,333 |
0.43 |
0.28 |
129,985 |
0.34 |
0.20 |
191,318 |
0.37 |
0.22 |
134,056 |
0.27 |
0.11 |
|
Table 2. Mineral Resource Sensitivity
* Pit shell constrained resources with demonstrated reasonable
prospects for eventual economic extraction (RPEEE) are generated
using series of Lerchs-Grossmann pit shell optimizations completed
by NCL
* CuT means total copper and CuS means acid soluble copper.
Technical and economic parameters include: copper price US$4.00/lb;
mining cost US$1.51/t; HL processing cost US$5.94/t (incl.
G&A); ROM processing cost US$1.65/t (incl. G&A); selling
cost US$0.16/lb Cu; heap leach recovery 76% of CuT; ROM recovery
40% of CuT; and 45°-52° pit slope angle
* With the economic parameters stated above, the Cut-Off grade of
the Mineral Resource Estimate is approximately 0.15% CuT and a
strip ratio of 1:1 has been estimated by NCL.
* Mineral resources which are not mineral reserves do not have
demonstrated economic viability. Due to the uncertainty which may
attach to inferred mineral resources, it cannot be assumed that all
or any part of an inferred mineral resource will be upgraded to an
indicated or measured mineral resource as a result of continued
exploration
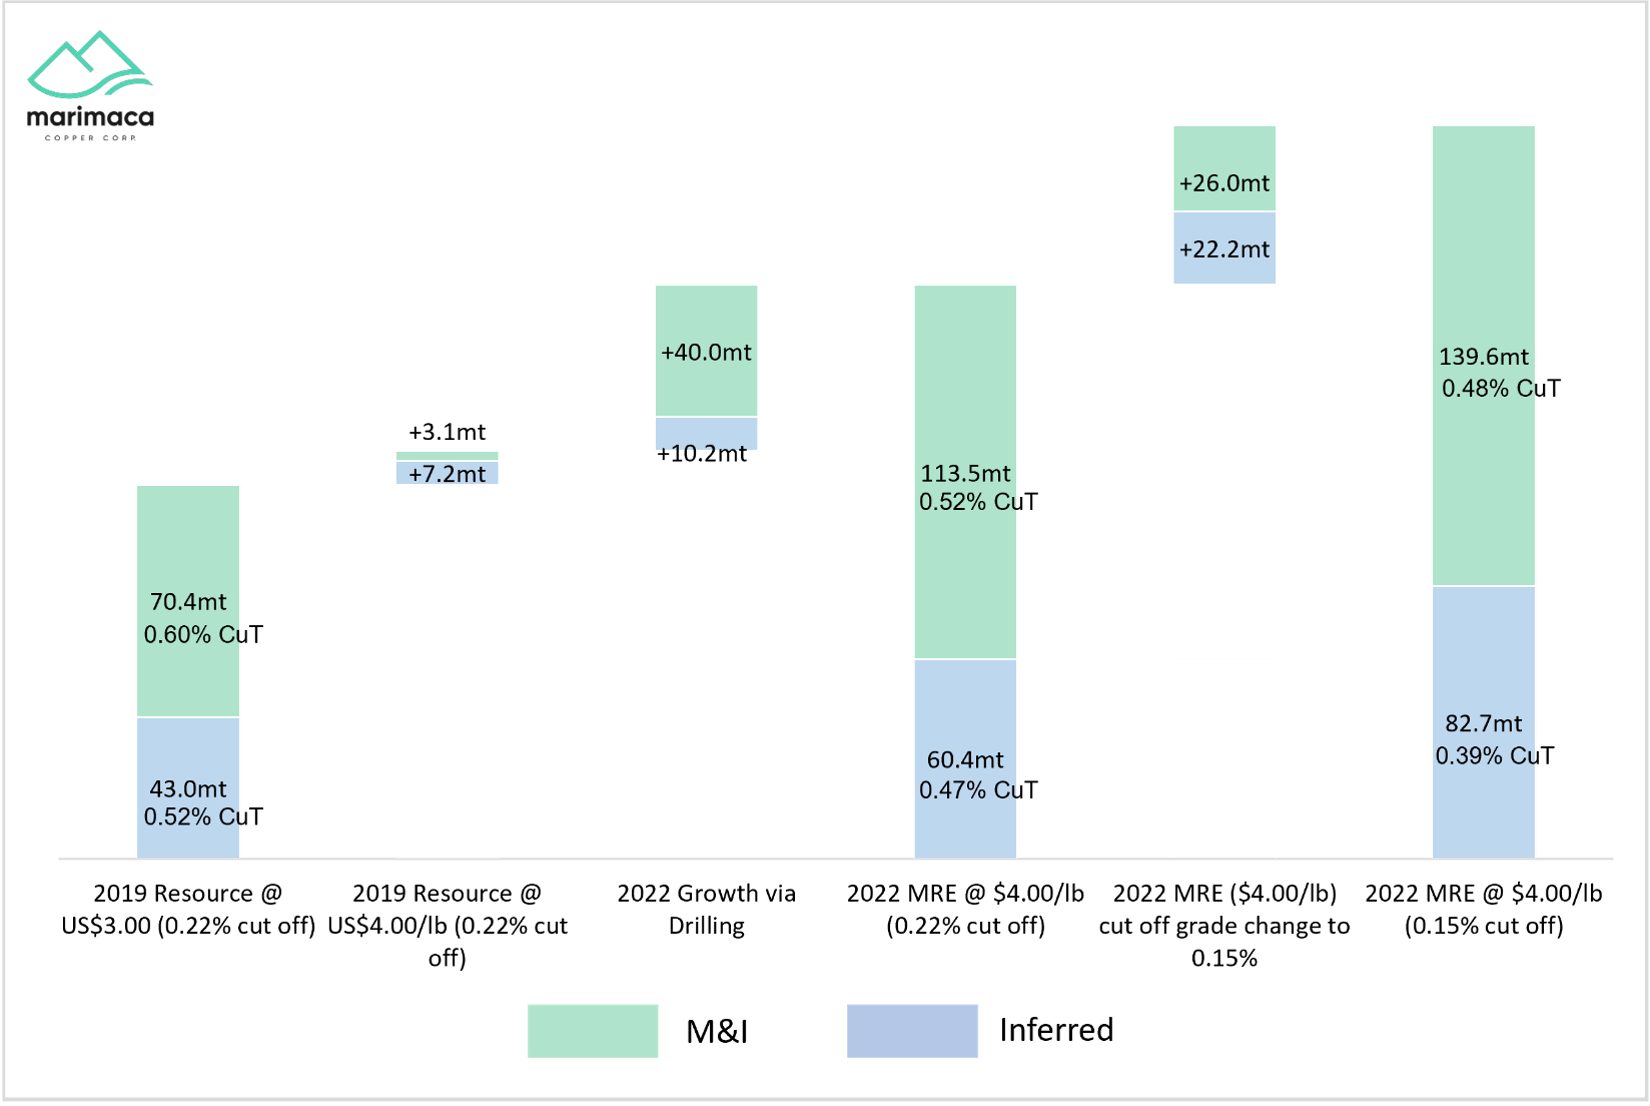
Outcome of 2021 and 2022 Expansion & Infill Drill
Programs
Figure 1 demonstrates Resource growth in the 2022 MRE
attributable to both the increased copper price assumption, and
growth driven by the results of the 2021 and 2022 drilling
campaigns. Drilling delivered strong extensions both below the
previously interpreted limits of the Marimaca oxide mineralization
into the newly-discovered zone of mixed mineralization (“MAMIX”),
as well as on the east and south-east periphery of the MOD where
mineralization was previously interpreted to be thinning. Both
areas delivered extensions to higher-grade zones and had a positive
influence on the contained metal increases in the 2022 MRE relative
to the 2019 MRE.
Figure 1. Resource Growth – Tonnage
Metallurgy Commentary
Marimaca has completed 5 phases of extensive metallurgical test
work at Marimaca. Results from Phase 5 were announced
on June
15, 2022 following a rigorous program including full-scale
column testing, mini-column testing, container-leach testing,
sulfation tests, acid sensitivity testing, Iso-pH testing, and head
characterization for heap leach (“HL”) and run-of-mine (“ROM”)
samples. In-line with results from Phases 1-4, Phase 5 recoveries
in the column and bottle roll tests generally exceeded the
solubility ratio (CuS/CuT) and leaching potential of the samples,
indicating a potentially larger proportion of total copper will be
recovered in industrial-scale operations. The leaching potential of
copper ores is defined as acid soluble copper (CuS) plus cyanide
soluble copper (CuCN) divided by total copper (CuT). The acid
solubility ratio (CuS/CuT) for copper oxides such as atacamite,
brochantite and chrysocolla, which dissolve quickly when exposed to
acid, is a good predictor of leachability. However, where the
mineralization has several copper bearing minerals with different
dissolution characteristics under these leaching conditions (such
as Marimaca’s black oxide (wad) component), the copper acid
solubility ratio may materially underestimate the acid leaching
potential for heap leach operations, especially where soluble
copper sulphides such as chalcocite, covellite and bornite are
present.
The Marimaca Deposit Commentary
The 2021/22 drilling programs and subsequent 2022 MRE provide
further validation of the Marimaca geological model developed by
the Company’s exploration team. Figure 2 (long section)
demonstrates the continuity of the oxide mineralization across the
N-S extent of the deposit. Mineralization is hosted consistently by
east-dipping fracture sets with higher grades concentrated along
controlling NW-SE structures and splays. Higher grade green oxide
mineralization (brochantite, atacamite, chrysocolla) dominates the
core of the deposit and is located near-surface. High grade zones
of oxides, mixed and enriched mineralization extend at depth into
the underlying MAMIX zone which was an important driver of growth
in the 2022 MRE. Due to the continuous nature of mineralization,
the increased copper price assumption does not materially impact
the Project’s strip ratio due to the extensive green and black
oxide (wad) mineralized halo which gets captured by the larger
resource pit.
The Company believes that significant oxide resource upside
remains at the MOD and in nearby satellite targets. At the MOD,
mineralized intercepts located to the east and southeast of the
deposit have not been captured in the 2022 MRE due to lack of
sufficient drill density. The MOD remains open to the east and
southeast and further exploration may be planned in due course. In
addition, the satellite oxide discoveries made in 2021 (Mercedes,
Cindy, Roble) have not received sufficient drilling to be included
in the 2022 MRE. The plan map seen in Figure 4 demonstrates the
proximity of the satellite targets to the 2022 MRE resource
pit.
Figure 2. Long Section, Looking North-East, 2022 MRE Pit
Shell
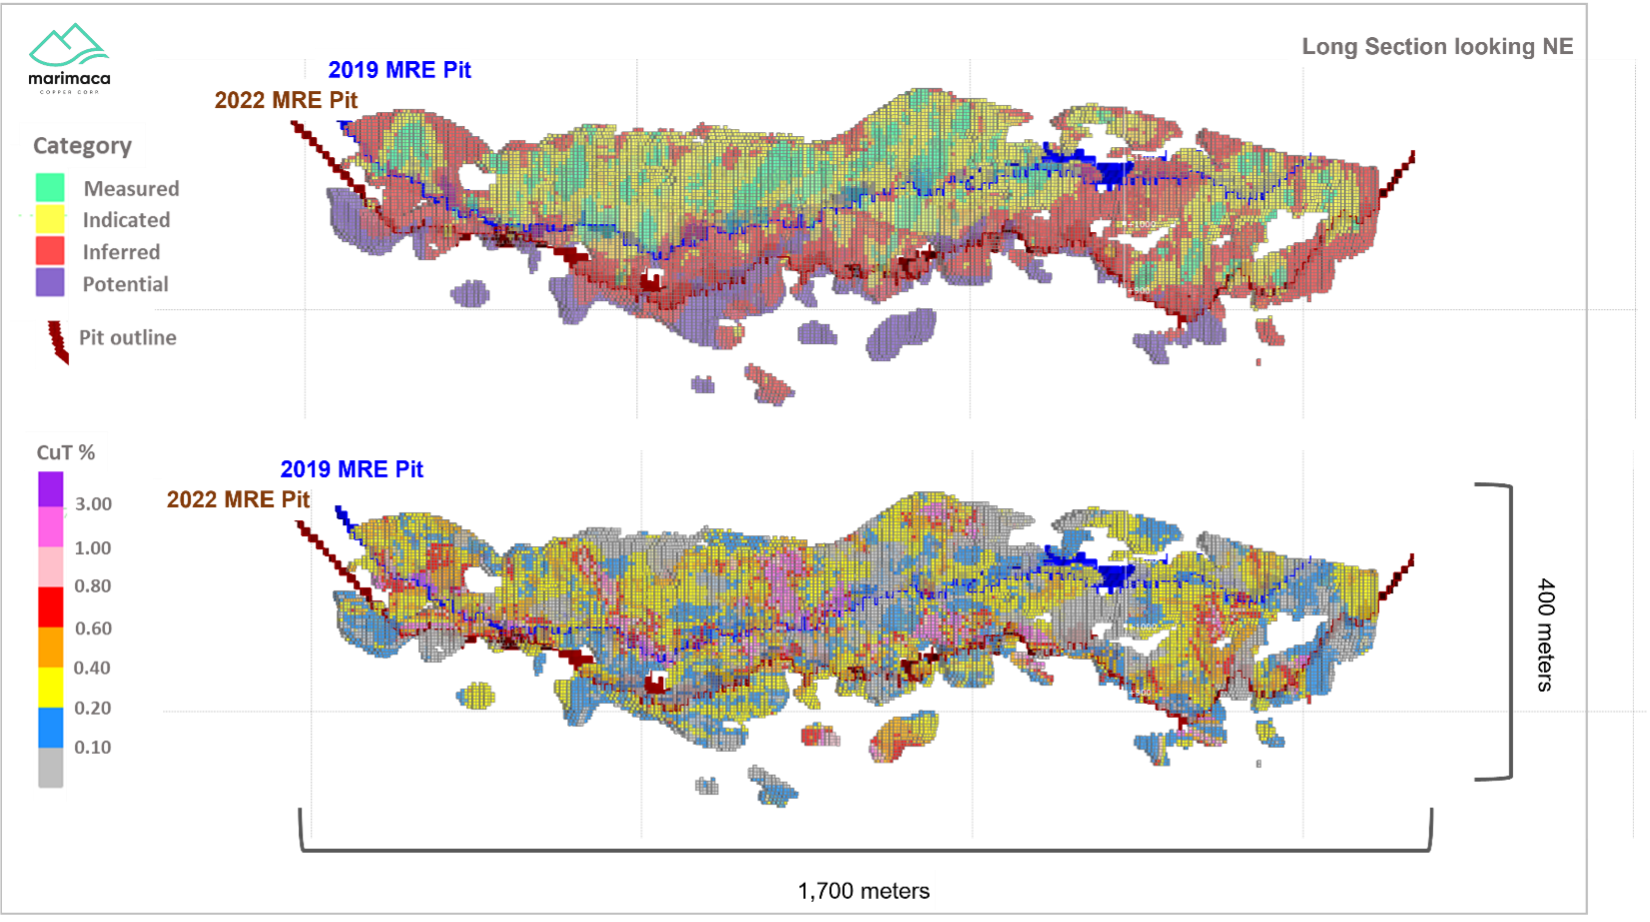
Figure 3. Block Model Plan View – 2022 MRE

Figure 4. Plan View of Marimaca Satellite Exploration
Targets

The potential quantity and grade presented in the
exploration target ranges are conceptual and have insufficient
exploration and drill density to define a Mineral Resource. At this
stage, it is uncertain if further exploration will result in the
targets being delineated as a Mineral Resource. Estimates of
exploration targets are not Mineral Resources and are too
speculative to meet the NI 43-101 reporting standards. The detailed
methodology for preparing the Exploration Targets and a summary of
supporting technical data can be found in the announcement dated
January 20, 2022 “Marimaca Announces Exploration Targets for
Near-Pit Oxide Satellites and MAMIX Depth Extension”.
2022 MRE Estimation Parameters
Grade estimates were completed using ordinary kriging with
nominal block size measuring 5m by 5m by 5m. Resources have been
classified by their proximity to sample locations and number of
drill holes and samples within different search ellipsoids, and are
reported according to Canadian Institute of Mining, Metallurgy and
Petroleum (CIM) Definition Standards for Mineral Resources and
Mineral Reserves and National Instrument 43-101 - Standards of
Disclosure for Mineral Projects.
Operating costs and certain operating parameters, such as
metallurgical recoveries, were taken from the 2020 Preliminary
Economic Assessment, which was completed by Ausenco according to
Canadian Institute of Mining, Metallurgy and Petroleum (CIM)
Definition Standards for Mineral Resources and Mineral Reserves and
National Instrument 43-101 - Standards of Disclosure for Mineral
Projects.
Mineral Resource
Category and Type
|
Quantity |
CuT |
CuS |
CuT |
CuS |
| (kt) |
(%) |
(%) |
(t) |
(t) |
| Measured |
|
|
|
|
|
| Brochantite |
22,371 |
0.65 |
0.47 |
144,870 |
104,957 |
| Chrysocolla |
12,252 |
0.46 |
0.36 |
56,558 |
44,057 |
| Wad/Black oxides |
6,578 |
0.31 |
0.17 |
20,366 |
11,445 |
| Mixed |
5,106 |
0.55 |
0.13 |
28,176 |
6,693 |
| Enriched |
743 |
0.43 |
0.06 |
3,186 |
462 |
| Total Measured |
47,051 |
0.54 |
0.36 |
253,157 |
167,614 |
| Indicated |
|
|
|
|
|
| Brochantite |
27,865 |
0.60 |
0.44 |
166,469 |
122,706 |
| Chrysocolla |
18,239 |
0.41 |
0.30 |
74,012 |
55,497 |
| Wad/Black oxides |
28,036 |
0.29 |
0.16 |
82,607 |
45,340 |
| Mixed |
14,557 |
0.51 |
0.13 |
73,595 |
18,413 |
| Enriched |
3,819 |
0.41 |
0.06 |
15,692 |
2,244 |
| Total Indicated |
92,516 |
0.45 |
0.26 |
412,375 |
244,200 |
| Measured and Indicated |
|
|
|
|
|
| Brochantite |
50,235 |
0.62 |
0.45 |
311,340 |
227,663 |
| Chrysocolla |
30,492 |
0.43 |
0.33 |
130,571 |
99,554 |
| Wad/Black oxides |
34,614 |
0.30 |
0.16 |
102,973 |
56,785 |
| Mixed |
19,664 |
0.52 |
0.13 |
101,771 |
25,106 |
| Enriched |
4,562 |
0.41 |
0.06 |
18,877 |
2,706 |
| Total Measured and Indicated |
139,567 |
0.48 |
0.30 |
665,531 |
411,814 |
| Inferred |
|
|
|
|
|
| Brochantite |
10,364 |
0.52 |
0.37 |
54,026 |
38,124 |
| Chrysocolla |
9,028 |
0.35 |
0.25 |
31,400 |
22,496 |
| Wad/Black oxides |
24,907 |
0.28 |
0.14 |
70,325 |
35,229 |
| Mixed |
17,129 |
0.47 |
0.12 |
80,152 |
19,809 |
| Enriched |
21,249 |
0.41 |
0.06 |
87,008 |
12,758 |
| Total Inferred |
82,678 |
0.39 |
0.16 |
322,910 |
128,416 |
Table 3. 2022 MRE by Mineralization Type
* Pit shell constrained resources with demonstrated reasonable
prospects for eventual economic extraction (RPEEE) are generated
using series of Lerchs-Grossmann pit shell optimizations completed
by NCL
* CuT means total copper and CuS means acid soluble copper.
Technical and economic parameters include: copper price US$4.00/lb;
mining cost US$1.51/t; HL processing cost US$5.94/t (incl.
G&A); ROM processing cost US$1.65/t (incl. G&A); selling
cost US$0.16/lb Cu; heap leach recovery 76% of CuT; ROM recovery
40% of CuT; and 45°-52° pit slope angle
* With the economic parameters stated above, the Cut-Off grade of
the Mineral Resource Estimate is approximately 0.15% CuT and a
strip ratio of 1:1 has been estimated by NCL.
* Mineral resources which are not mineral reserves do not have
demonstrated economic viability. Due to the uncertainty which may
attach to inferred mineral resources, it cannot be assumed that all
or any part of an inferred mineral resource will be upgraded to an
indicated or measured mineral resource as a result of continued
exploration
Qualified Person
The technical information in this news release, including the
information related to geology, drilling, mineralization, modeling
and estimation has been reviewed and approved by Luis Oviedo, an
independent Consulting Geologist with more than 45 years of
experience. Mr. Oviedo is a member of the Colegio de Geólogos and
the Institute of Mining Engineers of Chile and is an Independent
Qualified Person as defined by National Instrument 43-101 –
Standards of Disclosure for Mineral Projects.
The QP confirms he has visited the project area, has reviewed
relevant project information, is responsible for the information
contained in this news release, and consents to its
publication.
Contact Information
For further information please visit www.marimaca.com
or contact:
Tavistock
+44 (0) 207 920 3150
Emily Moss / Adam Baynes
marimaca@tavistock.co.uk
Forward Looking Statements
This news release includes certain “forward-looking statements”
under applicable Canadian securities legislation. There can be no
assurance that such statements will prove to be accurate, and
actual results and future events could differ materially from those
anticipated in such statements. Forward-looking statements reflect
the beliefs, opinions and projections on the date the statements
are made and are based upon a number of assumptions and estimates
that, while considered reasonable by Marimaca Copper, are
inherently subject to significant business, economic, competitive,
political and social uncertainties and contingencies. Many factors,
both known and unknown, could cause actual results, performance or
achievements to be materially different from the results,
performance or achievements that are or may be expressed or implied
by such forward-looking statements and the parties have made
assumptions and estimates based on or related to many of these
factors. Such factors include, without limitation: risks related to
share price and market conditions, the inherent risks involved in
the mining, exploration and development of mineral properties, the
uncertainties involved in interpreting drilling results and other
geological data, fluctuating metal prices, the possibility of
project delays or cost overruns or unanticipated excessive
operating costs and expenses, uncertainties related to the
necessity of financing, the availability of and costs of financing
needed in the future as well as those factors disclosed in the
annual information form of the Company dated March 28, 2022, the
final short form base prospectus and other filings made by the
Company with the Canadian securities regulatory authorities (which
may be viewed at www.sedar.com).
Accordingly, readers should not place undue reliance on
forward-looking statements. Marimaca Copper undertakes no
obligation to update publicly or otherwise revise any
forward-looking statements contained herein whether as a result of
new information or future events or otherwise, except as may be
required by law.
Neither the Toronto Stock Exchange nor the Investment Industry
Regulatory Organization of Canada accepts responsibility for
the adequacy or accuracy of this release.
Marimaca Copper (TSX:MARI)
과거 데이터 주식 차트
부터 4월(4) 2024 으로 5월(5) 2024

Marimaca Copper (TSX:MARI)
과거 데이터 주식 차트
부터 5월(5) 2023 으로 5월(5) 2024
