Form 6-K - Report of foreign issuer [Rules 13a-16 and 15d-16]
27 10월 2023 - 9:33PM
Edgar (US Regulatory)
UNITED STATES
SECURITIES AND EXCHANGE COMMISSION
Washington, DC 20549
FORM 6-K
REPORT OF FOREIGN PRIVATE ISSUER
PURSUANT TO RULE 13a-16 OR 15d-16
UNDER THE SECURITIES EXCHANGE ACT OF 1934
For the month of October, 2023.
Commission File Number 001-38755
Suzano S.A.
(Exact name of registrant as specified in its charter)
SUZANO INC.
(Translation of Registrant’s Name into English)
Av. Professor Magalhaes Neto, 1,752
10th Floor, Rooms 1010 and 1011
Salvador, Brazil 41 810-012
(Address of principal executive office)
Indicate by check mark whether the registrant files or will file annual reports under cover of Form 20-F or Form 40-F.
Form 20-F ⌧ Form 40-F ◻
Indicate by check mark if the registrant is submitting the Form 6-K in paper as permitted by Regulation S-T Rule 101(b)(1): ◻
Indicate by check mark if the registrant is submitting the Form 6-K in paper as permitted by Regulation S-T Rule 101(b)(7): ◻
SIGNATURE
Pursuant to the requirements of the Securities Exchange Act of 1934, the registrant has duly caused this report to be signed on its behalf by the undersigned, thereunto duly authorized.
Date: October 27, 2023
| | |
| | SUZANO S.A. |
| | |
| By: | /s/ Marcelo Feriozzi Bacci |
| Name: | Marcelo Feriozzi Bacci |
| Title: | Chief Financial and Investor Relations Officer |
3
Exhibit 99.1

| Earnings
Conference
Call 3Q23 |
| Disclaimer
2
This presentation contains what are considered “forward-looking statements,” as defined in Section 27A of the 1933
Securities Act and Section 21E of the 1934 Securities Exchange Act, as amended. Some of these forward-looking
statements are identified with words such as “believe,” “may,” “could,” “would,” “possible,” “will,” “should,” “expect,”
“intend,” “plan,” “anticipate,” “estimate,” “potential,” “outlook” or “continue,” as well as the negative forms of these
words, other terms of similar meaning or the use of future dates.
The forward-looking statements include, without limitation, statements related to the declaration or payment of
dividends, implementation of the key operational and financial strategies and investment plans, guidance about
future operations and factors or trends that influence the financial situation, liquidity or operational results. Such
statements reflect the current view of the management and are subject to diverse risks and uncertainties. These are
qualified in accordance with the inherent risks and uncertainties involving future expectations in general, and actual
results could differ materially from those currently anticipated due to various risks and uncertainties. There is no
guarantee that the expected events, trends or results will actually occur. The statements are based on diverse
assumptions and factors, including general economic and market conditions, industry conditions and operating
factors. Any changes in such assumptions or factors could cause actual results to differ materially from current
expectations. Suzano does not undertake any obligation to update any such forward-looking statements as a result
of new information, future events or otherwise, except as expressly required by law. All forward-looking statements
in this presentation are covered in their entirety by this disclaimer.
In addition, this presentation contains some financial indicators that are not recognized by the BR GAAP or IFRS.
These indicators do not have a standard meaning and may not be comparable to indicators with a similar description
used by other companies. We provide these indicators because we use them as measurements of Suzano's
performance; they should not be considered separately or as a replacement for other financial metrics that have
been disclosed in accordance with BR GAAP or IFRS. |

| With a new drop, cash cost reaches a lower level than same
quarter last year
3
HIGHLIGHTS
2.5 million tons
(vs. 2.8 million tons 3Q22 and
2.5 million tons 2Q23)
Pulp:
272 thousand tons
(vs. 299 thousand tons 3Q22 and
263 thousand tons 2Q23)
Paper1
:
Pulp Inventory:
Below optimum operational
levels
Adjusted EBITDA:
Operating Cash Generation2 :
Cash cost ex-downtimes :
R$3.7 bn
(vs. R$8.6 bn 3Q22 and
R$3.9 bn 2Q23)
R$1.9 bn
(vs. R$7.2 bn 3Q22 and
R$2.2 bn 2Q23)
R$861/ton
(vs. R$883/ton 3Q22 and
R$918/ton 2Q23)
Liquidity3
:
US$11.5 bn
(vs. US$10.7 bn 3Q22 and
R$11.3 bn 2Q23)
Leverage4
:
US$6.3 bn
(vs. US$4.7 bn 3Q22 and
US$6.3 bn 2Q23)
Net debt:
2.7x in US$
(vs. 2.1x in US$ 3Q22 and
2.2x in US$ 2Q23)
OPERATING
PERFORMANCE
SALES
VOLUME
FINANCIAL
MANAGEMENT
1 Excluding Consumer Goods. | 2 Operating Cash Generation = Adjusted EBITDA less Sustaining Capex. | 3 Considers Finnvera credit line. | 4 Net Debt / Adjusted EBITDA in the last twelve months. |
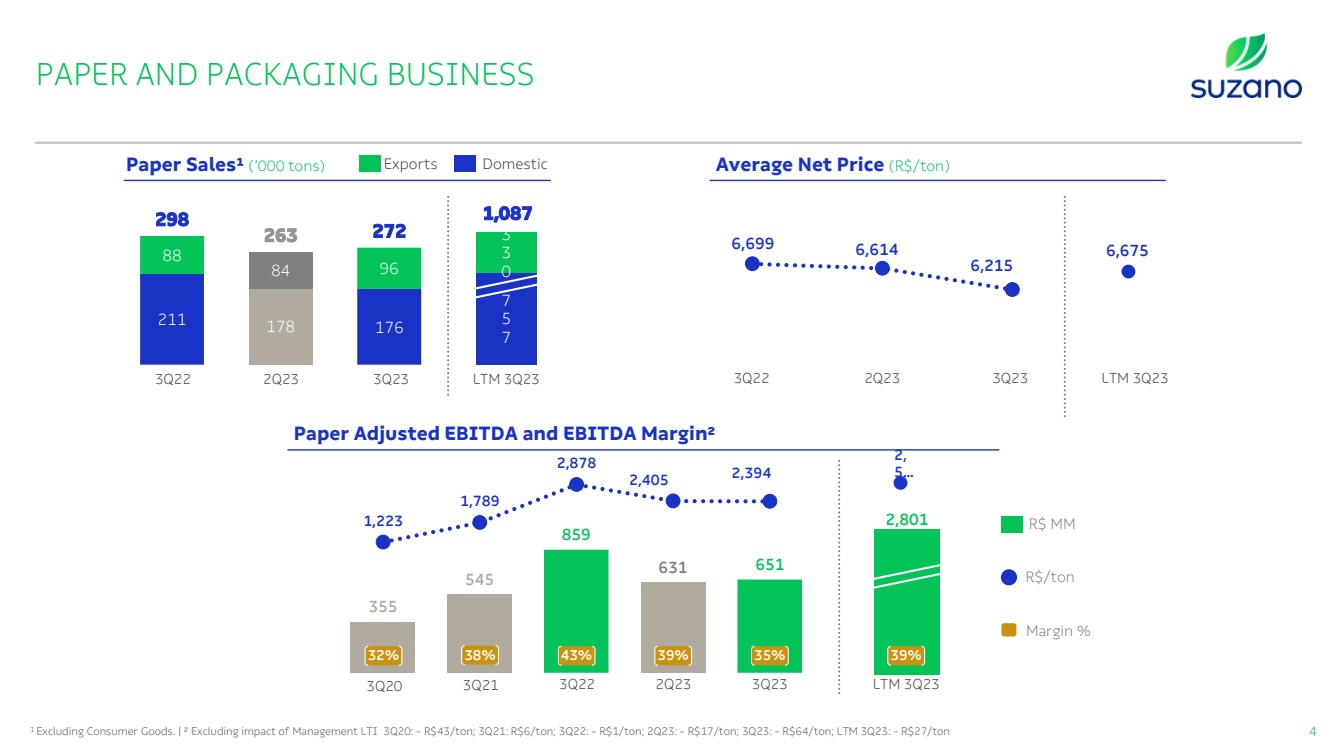
| 2,801
6,675 6,699 6,614
6,215
1,223
1,789
2,878
2,405 2,394
Paper Sales¹ (‘000 tons) Average Net Price (R$/ton)
4
3Q22 2Q23 3Q23 LTM 3Q23
7
5
7
3
3
0
1,087
211 178 176
88
84 96
298
263 272
355
545
859
631 651
43% 39% 35%
3Q22 2Q23 3Q23 LTM 3Q23
2,
5…
3Q22 2Q23 3Q23 LTM 3Q23
32% 38%
3Q20 3Q21
Paper Adjusted EBITDA and EBITDA Margin²
R$ MM
R$/ton
Margin %
39%
Exports Domestic
1 Excluding Consumer Goods. | ² Excluding impact of Management LTI 3Q20: - R$43/ton; 3Q21: R$6/ton; 3Q22: - R$1/ton; 2Q23: - R$17/ton; 3Q23: - R$64/ton; LTM 3Q23: - R$27/ton
PAPER AND PACKAGING BUSINESS |
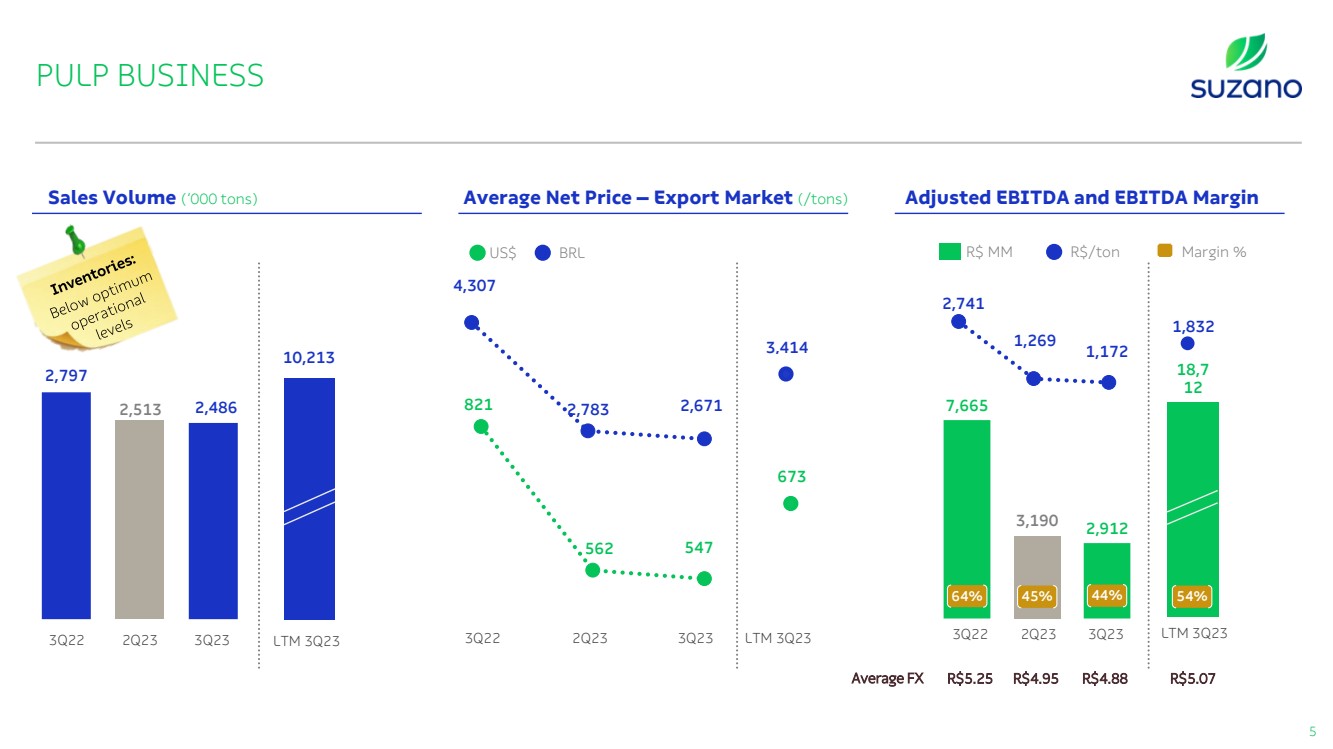
| 821
562 547
2,797
2,513 2,486
3Q22 2Q23 3Q23
10,213
LTM 3Q23
18,7
12
7,665
3,190 2,912
3Q22 2Q23 3Q23 LTM 3Q23
Average FX R$5.25 R$4.95 R$4.88 R$5.07
5
2,741
1,269 1,172
3Q22 2Q23 3Q23
4,307
2,783 2,671
US$ BRL
64% 45% 44% 54%
LTM 3Q23
1,832
Sales Volume (‘000 tons) Average Net Price – Export Market (/tons) Adjusted EBITDA and EBITDA Margin
R$ MM R$/ton Margin %
3,414
673
PULP BUSINESS |
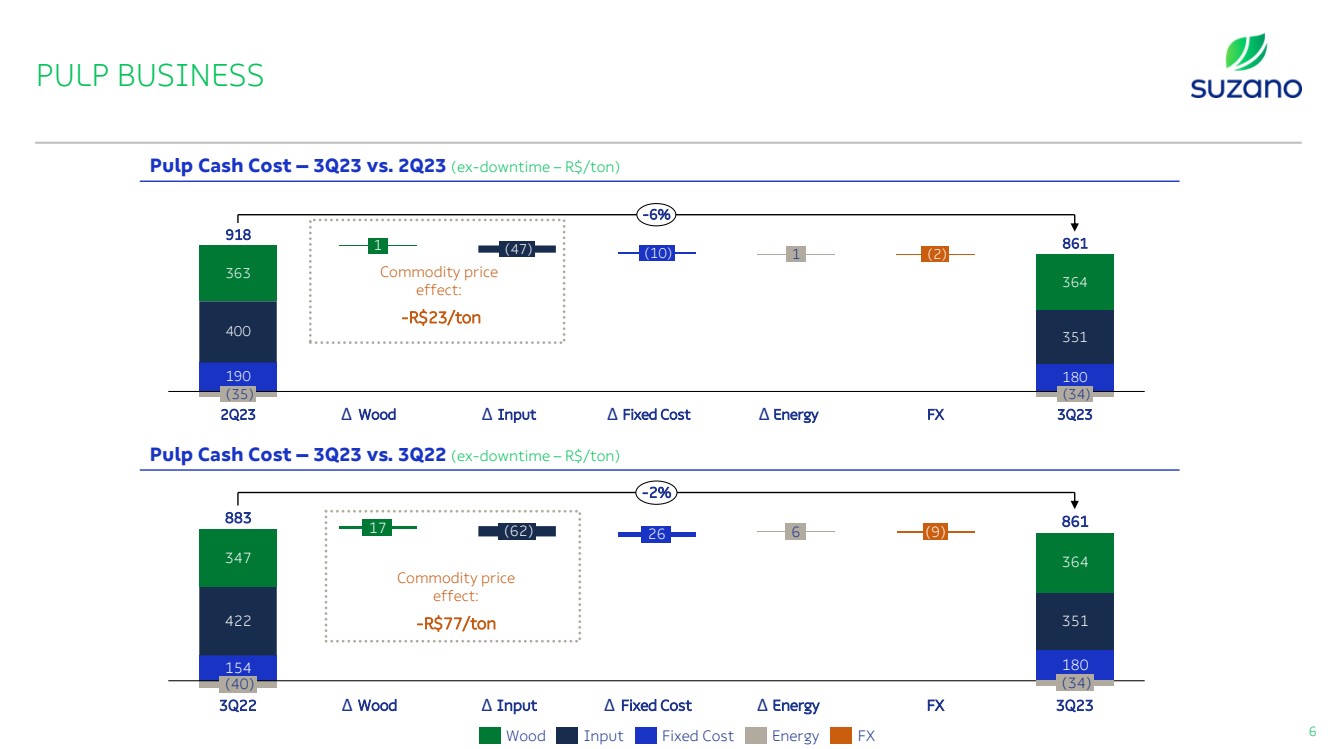
| 154
422
180
347
351
364
17
(40)
3Q22 Wood Fixed Cost
(62) 26
Input
6
Energy
(34)
(9)
FX 3Q23
883 861
-2%
190
400
180
363
351
364
Input
(10)
(35)
2Q23
1 (47)
Wood Fixed Cost
1
Energy
(2)
918
FX
(34)
3Q23
861
-6%
Pulp Cash Cost – 3Q23 vs. 2Q23 (ex-downtime – R$/ton)
Pulp Cash Cost – 3Q23 vs. 3Q22 (ex-downtime – R$/ton)
6
Commodity price
effect:
-R$23/ton
Commodity price
effect:
-R$77/ton
Δ Δ Δ Δ
Δ Δ Δ Δ
Wood Input Fixed Cost Energy FX
PULP BUSINESS |

| 7
% Physical progress:
(inside-the-fence¹)
3
43
82
100
2021 2022 2023 Jun. 2024
78%
¹ Inside the fence includes investments in industrial and infrastructure. | ² All figures in 2023 currency (in real terms). | ³ Structural cash production cost and sustaining capex, with wood sourcing in regime, as from the beginning of second forestry
cycle (2031)
68%
Total capex timeline
(R$ billion)
6.3
2.6
0.1 0.7
7.4
8.9
5.1
2020 2021 2022 2023 2024
onwards
Actual Expected
Financial progress
(inside-the-fence¹)
Cash production cost (R$/t)
Ex-downtimes²
- After ramp-up: ~R$500/t
- Structural³: ~R$400/t
CERRADO PROJECT |
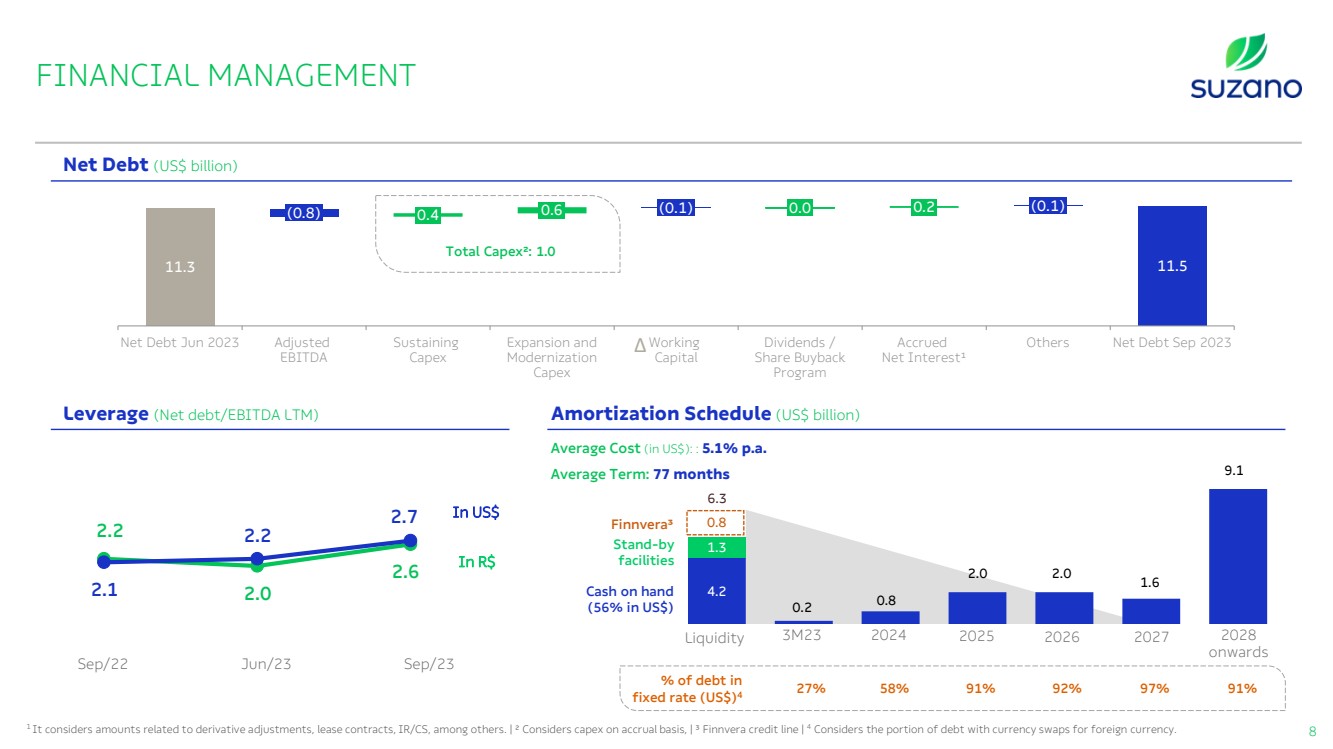
| 4.2
0.2 0.8
2.0 2.0
1.6
9.1
1.3
Net Debt (US$ billion)
8
2.2
2.0
2.6
2.1
2.2
2.7
Sep/22 Jun/23 Sep/23
In R$
In US$
1 It considers amounts related to derivative adjustments, lease contracts, IR/CS, among others. | ² Considers capex on accrual basis, | ³ Finnvera credit line | 4 Considers the portion of debt with currency swaps for foreign currency.
Amortization Schedule (US$ billion)
Cash on hand
(56% in US$)
Stand-by
facilities
Leverage (Net debt/EBITDA LTM)
Average Cost (in US$): : 5.1% p.a.
Average Term: 77 months
Liquidity 3M23 2024 2025 2026 2028
onwards
2027
6.3
11.3 11.5
0.0
Net Debt Jun 2023
(0.8) 0.6
Adjusted
EBITDA
Net Debt Sep 2023
0.4
Expansion and
Modernization
Capex
Sustaining
Capex
(0.1)
Working
Capital
Dividends /
Share Buyback
Program
0.2
Accrued
Net Interest¹
(0.1)
Δ Others
% of debt in
fixed rate (US$)4
27% 58% 91% 92% 97% 91%
Finnvera³ 0.8
Total Capex²: 1.0
FINANCIAL MANAGEMENT |

| 9
Cash Adjusments (ZCC)
R$ million
Portfolio Average
Sep/2023:
Put / Call
5.52 6.42
59%
FX gap
coverage
Jun/2023: US$4.8 billion Sep/2023: US$4.5 billion
ZCC Notional¹
1 Considers EUR/USD hedge with notional of EUR349MM and 1.03 avarage FX.
620
824
619
727
216
3Q23
(actual)
Expected cash flow impact
considering FX @5.01
4Q23 1H24 2H24 1H25
FINANCIAL MANAGEMENT |
| Thank you
3Q23
Investor Relations
www.suzano.com.br/ir
ri@suzano.com.br |
Suzano (NYSE:SUZ)
과거 데이터 주식 차트
부터 4월(4) 2024 으로 5월(5) 2024

Suzano (NYSE:SUZ)
과거 데이터 주식 차트
부터 5월(5) 2023 으로 5월(5) 2024
