As filed with the U.S. Securities and Exchange Commission
on August 7, 2023
UNITED STATES
SECURITIES AND EXCHANGE COMMISSION
Washington, D.C. 20549
FORM N-CSR
CERTIFIED SHAREHOLDER REPORT OF REGISTERED
MANAGEMENT
INVESTMENT COMPANIES
Investment Company Act file number 811-22499
NXG NextGen Infrastructure Income Fund
(Exact name of registrant as specified in charter)
600 N. Pearl Street, Suite 1205
Dallas, TX 75201
(Address of principal executive offices) (Zip code)
Mark Rhodes
600 N. Pearl Street, Suite 1205
Dallas, TX 75201
(Name and address of agent for service)
214-692-6334
Registrant's telephone number, including area code
Date of fiscal year end: November 30
Date of reporting period: May 31, 2023
Item 1. Reports to Stockholders.
Table of Contents
| |
|
Shareholder Letter (Unaudited) |
1 |
Hypothetical Growth of a $10,000 Investment (Unaudited) |
4 |
Key Financial Data (Supplemental Information) (Unaudited) |
5 |
Allocation of Portfolio Assets (Unaudited) |
6 |
Schedule of Investments (Unaudited) |
7 |
Statement of Assets & Liabilities (Unaudited) |
11 |
Statement of Operations (Unaudited) |
12 |
Statements of Changes in Net Assets |
13 |
Statement of Cash Flows (Unaudited) |
14 |
Financial Highlights |
15 |
Notes to Financial Statements (Unaudited) |
17 |
Additional Information (Unaudited) |
26 |
Board Approval of Investment Management Agreement (Unaudited) |
29 |
NXG NextGen Infrastructure Income Fund
Shareholder Letter (Unaudited) |
Dear Shareholder,
NXG NextGen Infrastructure Income Fund (formerly known as the Cushing® NextGen Infrastructure Income Fund) (the “Fund”) generated a negative return for shareholders for the Fund’s six-month fiscal period, which ended May 31, 2023 (the “Period”). For the Period, the Fund delivered a net asset value total return (equal to the change in net asset value (“NAV”) per share plus reinvested cash distributions paid during the period) of -10.96%, versus a total return of 1.94% for the S&P Global Infrastructure Index. Fn: See index descriptions on page 3 of this report. The Fund’s share price total return (equal to the change in market price per share plus reinvested cash distributions from underlying Fund investments paid during the period) was -12.15% for the period. The share price total return differs from the NAV total return due to fluctuations in the discount of share price to NAV. The Fund’s shares traded at a 23.3% discount to NAV as of the end of the Period, compared to a discount of 22.3% at the end of the Fund’s last fiscal year and a 19.8% discount on May 31, 2022.
Market & Strategy Overview
The Fund invests along four main themes:
| |
●
|
Clean & Sustainable Infrastructure – Renewable energy, sustainable and water
|
| |
●
|
Communication & Technology Infrastructure – Data storage, information highway, and payments
|
| |
●
|
Energy Infrastructure – Power and midstream energy
|
| |
●
|
Industrial Infrastructure – Toll roads, freight transportation, ports and airports
|
The Period saw underperformance in high-growth stocks and rotation into defensive and inflation-protected stocks as interest rates continued to rise. Clean & Sustainable Infrastructure was the largest allocation and the largest detracting theme. Energy Infrastructure was the second largest allocation and also detracted from performance due to declining global natural gas prices. The Fund had a positive contribution from Industrial Infrastructure. The Fund’s Identify the benchmark has >90% of its exposure to utilities, which traded higher with rising inflation, resulting in the relative underperformance.
Clean & Sustainable Infrastructure is the Fund’s largest allocation and has been a drag recently. We believe clean tech stocks are positioned to outperform because of improving earnings and fundamentals. Both the largest clean tech segments are seeing improving demand:
| |
●
|
Renewables are the unparalleled source of new electricity generation, as US utilities have proposed renewables for 90% of new installations in the next two years.1
|
| |
●
|
Desire to buy an electric vehicle (“EV”) has tripled (2020 to 2022), according to E&Y.2 The result is an expectation that the global passenger EV fleet will grow 182% by 2025.3
|
Demand is inflecting and we expect further acceleration over the next couple years. The short-term outlook is further aided by an incredible tailwind of falling costs.
Fund Performance
The best contributing sector to performance by a wide margin was Utility Solar Equipment, while Fixed Income and Solar Module Manufacturers also were positive. The two solar sectors benefitted from faster flowing imports and increased solar demand. The Fund’s top three contributors were European solar equipment manufacturer
|
1
|
EIA. “Electrical Power Monthly” data as of October 2022, released 12/22/2022.
|
|
2
|
EY. “EY Mobility Consumer Index 2022 Study” May 2022.
|
|
3
|
BNEF, “ Long-term Electric Vehicle Outlook 2022” 6/1/2022.
|
1
SMA Solar (S92 GR), energy storage provider Fluence (FLNC), and natural gas pipeline company Equitrans (ETRN). SMA and Fluence benefitted from improving demand that led to increased guidance. Equitrans rallied after finally receiving regulatory approval for their highly-disputed pipeline in West Virginia.
The largest detracting sectors were Renewable Generation, Residential Solar Equipment, and LNG Midstream. Renewable generation and residential solar equipment both sold off due to expectation that higher interest rates will impact the economics of their projects. LNG midstream companies underperformed as global natural gas prices normalized following the invasion of Ukraine in 2022. We still expect that demand for renewable projects and natural gas will increase above expectations and these sectors are experiencing a minor recalibration. The top three detracting stocks were hydrogen company Plug Power (PLUG) plus solar companies Sunrun (RUN) and NextEra Partners (NEP). All three companies suffered from concerns over their abilities to finance growth projects due to rising interest rates. The Fund continued to hold all three at the end of the period.
Leverage
The Fund employs leverage for additional income and total return potential. We seek to maintain a leverage ratio between zero and 30% of managed assets during normal market conditions. Average leverage for the period was 32% of managed assets, which compares to an average leverage ratio of 31% in the prior fiscal year. As the prices of the Fund’s investments increase or decline, there is a risk that the impact of the Fund’s NAV and total return will be negatively impacted by leverage.
Outlook
We believe that we will see a return of performance driven by fundamentals, and the acceleration in the clean markets will come to the forefront. We are as convinced as ever that we are at the beginning of the clean tech adoption inflection. We also anticipate additional tailwinds from government support and cyclical margin expansion to boost returns. Energy markets also remain very tight following years of underinvestment and global turmoil.
Thank you for entrusting us with your money. We truly appreciate your support, and we look forward to continuing to help you achieve your investment goals.
Sincerely,

Mark Rhodes
Chief Executive Officer
The information provided herein represents the opinion of the Fund’s portfolio managers and is not intended to be a forecast of future events, a guarantee of future results, nor investment advice. The opinions expressed are as of the date of this report and are subject to change.
The information in this report is not a complete analysis of every aspect of any market, sector, industry, security or the Fund itself. Statements of fact are from sources considered reliable, but the Fund makes no representation or warranty as to their completeness or accuracy. Discussions of specific investments are for illustration only and are not intended as recommendations of individual investments. Please refer to the Schedule of Investments for a complete list of Fund holdings.
Past performance does not guarantee future results. Investment return, net asset value and common share market price will fluctuate so that you may have a gain or loss when you sell shares. Since the Fund is a closed-end management investment company, shares of the Fund may trade at a discount or premium from net asset value. This characteristic is separate and distinct from the risk that net asset value could decrease as a result of investment activities and may be a greater risk to investors expecting to sell their shares after a short time. The Fund cannot predict whether shares will trade at, above or below net asset value. The Fund should not be viewed as a vehicle for trading purposes. It is designed primarily for risk-tolerant long-term investors.
2
An investment in the Fund involves risks. Leverage creates risks which may adversely affect returns, including the likelihood of greater volatility of net asset value and market price of the Fund’s common shares. The Fund is non-diversified, meaning it may concentrate its assets in fewer individual holdings than a diversified fund. Therefore, the Fund is more exposed to individual stock volatility than a diversified fund.
The Fund invests in infrastructure companies, which may be subject to a variety of factors that may adversely affect their business or operations, including high interest costs in connection with capital construction and improvement programs, high leverage, costs associated with environmental and other regulations, the effects of economic slowdown, surplus capacity, increased competition from other providers of services, uncertainties concerning the availability of fuel at reasonable prices, the effects of energy conservation policies and other factors. Sustainable infrastructure investments are subject to certain additional risks including high dependency upon on government policies that support renewable power generation and enhance the economic viability of owning renewable electric generation assets; adverse impacts from the reduction or discontinuation of tax benefits and other similar subsidies that benefit sustainable infrastructure companies; dependency on suitable weather condition and risk of damage to components used in the generation of renewable energy by severe weather; adverse changes and volatility in the wholesale market price for electricity in the markets served; the use of newly developed, less proven, technologies and the risk of failure of new technology to perform as anticipated; and dependence on a limited number of suppliers of system components and the occurrence of shortages, delays or component price changes. There is a risk that regulations that provide incentives for renewable energy could change or expire in a manner that adversely impacts the market for sustainable infrastructure companies generally. Technology and communications infrastructure investments are subject to certain additional risks including rapidly changing technologies and existing product obsolescence; short product life cycles; fierce competition; high research and development costs; aggressive pricing and reduced profit margins; the loss of patent, copyright and trademark protections; cyclical market patterns; evolving industry standards; frequent new product introductions and new market entrants; cyber security risks that include, among other things, theft, unauthorized monitoring, release, misuse, loss, destruction or corruption of confidential and highly restricted data, denial of service attacks, unauthorized access to relevant systems, compromises to networks or devices that the information infrastructure companies use, or operational disruption or failures in the physical infrastructure or operating systems, potentially resulting in, among other things, financial losses, violations of applicable privacy and other laws, regulatory fines, penalties, reputational damage, reimbursement or other compensation costs and/or additional compliance costs.
The Fund incurs operating expenses, including advisory fees, as well as leverage costs. Investment returns for the Fund are shown net of fees and expenses.
Fund holdings and sector allocations are subject to change at any time and are not recommendations to buy or sell any security. Please refer to the Schedule of Investments for a complete list of Fund holdings.
The S&P 500 Index is an unmanaged index of common stocks that is frequently used as a general measure of stock market performance. The S&P Global Infrastructure index is an unmanaged index of 75 companies around the world chosen to represent the infrastructure industry in three distinct infrastructure clusters: energy, transportation and utilities. The indices include reinvested dividends by do not include fees or expenses. It is not possible to invest directly in an index.
3
NXG NextGen Infrastructure Income Fund
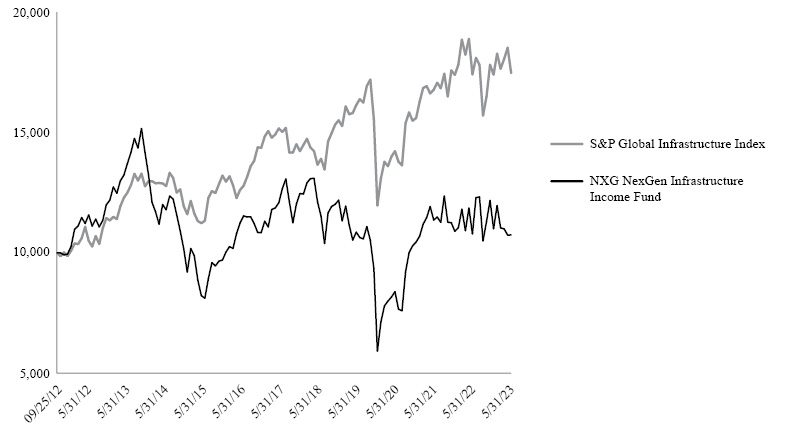
Hypothetical Growth of a $10,000 Investment (Unaudited) |
AVERAGE ANNUAL RETURNS
May 31, 2023 |
| |
1 Year |
5 Year |
10 Year |
Since
Inception |
Inception
Date |
NXG NextGen Infrastructure Income Fund |
(8.03)% |
(1.51)% |
0.80% |
1.80% |
9/25/12 |
The S&P Global Infrastructure Index |
(7.51)% |
4.19% |
5.22% |
5.36% |
9/25/12 |
Data for NXG NextGen Infrastructure Income Fund (the “Fund”) represents returns based on the change in the Fund’s net asset value assuming the reinvestment of all dividends and distributions. These returns differ from the total investment return based on market value of the Fund’s shares due to the difference between the Fund’s net asset value of its shares outstanding (See page 15 for total investment return based on market value). Past performance is no guarantee of future results.
The S&P 500 Global Infrastructure Index is an unmanaged index of 75 complanies around the world chosen to represent the infrastructure industry in three distinct clusters: energy, transportation and utiliities. You cannot invest directly in an index.
The graph and table do not reflect the deduction of taxes that a shareholder would pay on Fund distributions or the redemption of the Fund shares.
4
NXG NextGen Infrastructure Income Fund
Key Financial Data (Supplemental Information) (Unaudited) |
The information presented below regarding Distributable Cash Flow is supplemental non-GAAP financial information, which we believe is meaningful to understanding our operating performance. Supplemental non-GAAP measures should be read in conjunction with our full financial statements.
| |
|
Period From
December 1,
2022
through
May 31, 2023 |
|
|
Fiscal Year
Ended
11/30/22 |
|
|
Fiscal Year
Ended
11/30/21 |
|
|
Fiscal Year
Ended
11/30/20 |
|
|
Fiscal Year
Ended
11/30/19 (a) |
|
|
Fiscal Year
Ended
11/30/18 (a) |
|
FINANCIAL DATA |
|
|
|
|
|
|
|
|
|
|
|
|
|
|
|
|
|
|
|
|
|
|
|
|
Total income from investments |
|
|
|
|
|
|
|
|
|
|
|
|
|
|
|
|
|
|
|
|
|
|
|
|
Distributions and dividends received, net of foreign taxes withheld |
|
$ |
6,159,342 |
|
|
$ |
8,667,303 |
|
|
$ |
9,924,383 |
|
|
$ |
7,035,276 |
|
|
$ |
8,582,200 |
|
|
$ |
8,176,271 |
|
Interest income & other |
|
$ |
468,346 |
|
|
$ |
1,047,575 |
|
|
$ |
1,061,057 |
|
|
$ |
1,883,405 |
|
|
$ |
3,366,509 |
|
|
$ |
3,250,313 |
|
Total income from investments |
|
$ |
6,627,688 |
|
|
$ |
9,714,878 |
|
|
$ |
10,985,440 |
|
|
$ |
8,918,681 |
|
|
$ |
11,948,709 |
|
|
$ |
11,426,584 |
|
Advisory fee and operating expenses |
|
|
|
|
|
|
|
|
|
|
|
|
|
|
|
|
|
|
|
|
|
|
|
|
Advisory fees, less expenses waived by Adviser |
|
$ |
868,344 |
|
|
$ |
1,864,503 |
|
|
$ |
1,894,568 |
|
|
$ |
1,397,229 |
|
|
$ |
2,044,632 |
|
|
$ |
2,238,505 |
|
Operating expenses (b) |
|
|
358,829 |
|
|
|
778,446 |
|
|
|
735,891 |
|
|
|
720,285 |
|
|
|
628,582 |
|
|
|
569,546 |
|
Leverage costs |
|
|
1,330,971 |
|
|
|
1,285,151 |
|
|
|
538,072 |
|
|
|
169,833 |
|
|
|
723,266 |
|
|
|
1,130,139 |
|
Total advisory fees and operating expenses |
|
$ |
2,558,144 |
|
|
$ |
3,928,100 |
|
|
$ |
3,168,531 |
|
|
$ |
2,287,347 |
|
|
$ |
3,396,480 |
|
|
$ |
3,938,190 |
|
Distributable Cash Flow (DCF) (c) |
|
$ |
4,069,544 |
|
|
$ |
5,786,778 |
|
|
$ |
7,816,909 |
|
|
$ |
6,631,334 |
|
|
$ |
8,552,229 |
|
|
$ |
7,488,394 |
|
Distributions paid on common stock |
|
$ |
3,919,223 |
|
|
$ |
6,656,226 |
|
|
$ |
6,656,226 |
|
|
$ |
11,863,818 |
|
|
$ |
14,226,174 |
|
|
$ |
11,736,594 |
|
Distributions paid on common stock per share |
|
$ |
1.51 |
|
|
$ |
2.56 |
|
|
$ |
2.56 |
|
|
$ |
4.56 |
|
|
$ |
6.56 |
|
|
$ |
6.56 |
|
Distribution Coverage Ratio |
|
|
|
|
|
|
|
|
|
|
|
|
|
|
|
|
|
|
|
|
|
|
|
|
Before advisory fee and operating expenses |
|
|
1.7x |
|
|
|
1.5x |
|
|
|
1.7x |
|
|
|
0.8x |
|
|
|
0.8x |
|
|
|
1.0x |
|
After advisory fee and operating expenses |
|
|
1.0x |
|
|
|
0.9x |
|
|
|
1.2x |
|
|
|
0.6x |
|
|
|
0.6x |
|
|
|
0.6x |
|
OTHER FUND DATA (end of period) |
|
|
|
|
|
|
|
|
|
|
|
|
|
|
|
|
|
|
|
|
Total Assets, end of period |
|
|
156,679,805 |
|
|
|
194,194,289 |
|
|
|
202,602,696 |
|
|
|
137,938,612 |
|
|
|
151,957,589 |
|
|
|
179,341,093 |
|
Unrealized appreciation (depreciation) |
|
|
(14,065,910 |
) |
|
|
5,288,776 |
|
|
|
6,456,872 |
|
|
|
16,360,633 |
|
|
|
(14,379,305 |
) |
|
|
(1,971,116 |
) |
Short-term borrowings |
|
|
33,910,000 |
|
|
|
41,410,000 |
|
|
|
56,410,000 |
|
|
|
18,310,000 |
|
|
|
0 |
|
|
|
42,156,007 |
|
Short-term borrowings as a percent of total assets |
|
|
22 |
% |
|
|
21 |
% |
|
|
28 |
% |
|
|
13 |
% |
|
|
0 |
% |
|
|
24 |
% |
Net Assets, end of period |
|
|
121,936,893 |
|
|
|
142,434,269 |
|
|
|
138,537,314 |
|
|
|
119,348,473 |
|
|
|
151,638,988 |
|
|
|
136,843,193 |
|
Net Asset Value per common share |
|
$ |
46.87 |
|
|
$ |
54.75 |
|
|
$ |
53.25 |
|
|
$ |
45.87 |
|
|
$ |
58.28 |
|
|
$ |
70.13 |
|
Market Value per share |
|
$ |
35.94 |
|
|
$ |
42.53 |
|
|
$ |
45.02 |
|
|
$ |
35.74 |
|
|
$ |
50.72 |
|
|
$ |
64.68 |
|
Market Capitalization |
|
$ |
93,505,601 |
|
|
$ |
110,650,896 |
|
|
$ |
117,129,164 |
|
|
$ |
92,985,258 |
|
|
$ |
527,835,787 |
|
|
$ |
504,836,649 |
|
Shares Outstanding |
|
|
2,601,714 |
|
|
|
2,601,714 |
|
|
|
2,601,714 |
|
|
|
2,601,714 |
|
|
|
10,406,857 |
|
|
|
7,805,143 |
|
|
(a)
|
Per share data adjusted for 1:4 reverse stock split completed as of June 12, 2020.
|
|
(b)
|
Excludes expenses related to capital raising.
|
|
(c)
|
“Net Investment Income” on the Statement of Operations is adjusted as follows to reconcile to Distributable Cash Flow:
increased by the return of capital on MLP distributions.
|
5
NXG NextGen Infrastructure Income Fund
Allocation of Portfolio Assets(1) (Unaudited)
May 31, 2023
(Expressed as a Percentage of Total Investments) |
Natural Gas Gatherers & Processors (2)(3) |
|
|
8.2 |
% |
Solar (2) |
|
|
7.2 |
% |
Natural Gas Transportation & Storage (2)(3) |
|
|
6.6 |
% |
Large Cap Diversified C Corps (2)(3) |
|
|
6.4 |
% |
Refiners (2)(5) |
|
|
6.4 |
% |
Large Cap MLP (3) |
|
|
5.7 |
% |
Solar Equipment (2) |
|
|
5.0 |
% |
Yield Co (3) |
|
|
4.9 |
% |
Cruide Oil & Refined Products (3) |
|
|
4.6 |
% |
Utilities (2) |
|
|
4.1 |
% |
Upstream MLP (3) |
|
|
4.0 |
% |
Mineral Royalties (2) |
|
|
3.4 |
% |
Solar Energy Equipment (2) |
|
|
3.3 |
% |
Automobile Part Manufacturing (5) |
|
|
3.2 |
% |
Energy Metering & Management (2) |
|
|
2.8 |
% |
Solar Materials Modules (2) |
|
|
2.7 |
% |
Solar Generation (2) |
|
|
2.6 |
% |
LNG Midstream (2) |
|
|
2.4 |
% |
Industrials (2) |
|
|
1.9 |
% |
IT Services (2) |
|
|
1.8 |
% |
Renewable Generation(2) |
|
|
1.5 |
% |
Diversified Renewable Generation (2) |
|
|
1.4 |
% |
Communication Services (2) |
|
|
1.3 |
% |
Wind Equipment (2) |
|
|
1.1 |
% |
Natural Gas Pipeline (2) |
|
|
0.9 |
% |
Towers (2)(4) |
|
|
0.9 |
% |
Data Center Software (2) |
|
|
0.9 |
% |
Wind Generation (2) |
|
|
0.9 |
% |
Short-Term Investments |
|
|
0.8 |
% |
Data Centers (4) |
|
|
0.8 |
% |
Electric Vehicle Charging (2) |
|
|
0.7 |
% |
Solar Developer (2) |
|
|
0.5 |
% |
Battery Manufacturer (2) |
|
|
0.4 |
% |
Integrated Utility (2) |
|
|
0.4 |
% |
Electric Vehicle OEM (2) |
|
|
0.3 |
% |
| |
|
|
100.0 |
% |
|
(1)
|
Fund holdings and sector allocations are subject to change and there is no assurance that the Fund will continue to hold any particular security.
|
|
(3)
|
Master Limited Partnerships and Related Companies
|
|
(4)
|
Real Estate Investment Trusts
|
6
NXG NextGen Infrastructure Income Fund |
Schedule of Investments (Unaudited) |
May 31, 2023 |
Common Stock — 80.4% |
|
Shares |
|
|
Fair Value |
|
Battery Manufacturer — 0.5% |
|
|
|
|
|
|
|
|
Freyr Battery(2)(3) |
|
|
90,000 |
|
|
$ |
649,800 |
|
| |
|
|
|
|
|
|
|
|
Communication Services — 1.7% |
|
|
|
|
|
|
|
|
Infrastrutture Wireless Italiane SpA(1)(2) |
|
|
162,944 |
|
|
|
2,077,538 |
|
| |
|
|
|
|
|
|
|
|
Data Center Software — 1.1% |
|
|
|
|
|
|
|
|
Megaport Ltd.(2)(3) |
|
|
307,548 |
|
|
|
1,361,806 |
|
| |
|
|
|
|
|
|
|
|
Diversified Renewable Generation — 1.8% |
|
|
|
|
|
|
|
|
Renew Energy Global plc(2)(3) |
|
|
390,447 |
|
|
|
2,135,745 |
|
| |
|
|
|
|
|
|
|
|
Electric Vehicle Charging — 0.9% |
|
|
|
|
|
|
|
|
Chargepoint Holdings, Inc.(3) |
|
|
50,000 |
|
|
|
483,500 |
|
Tritium DCFC Limited(2)(3) |
|
|
564,057 |
|
|
|
654,306 |
|
| |
|
|
|
|
|
|
1,137,806 |
|
Electric Vehicle OEM — 0.4% |
|
|
|
|
|
|
|
|
Niu Technologies(2)(3) |
|
|
146,306 |
|
|
|
513,534 |
|
| |
|
|
|
|
|
|
|
|
Energy Metering & Management — 3.5% |
|
|
|
|
|
|
|
|
Fluence Energy, Inc.(3) |
|
|
114,012 |
|
|
|
2,827,498 |
|
STEM, Inc.(3) |
|
|
269,522 |
|
|
|
1,487,761 |
|
| |
|
|
|
|
|
|
4,315,259 |
|
Industrials- 2.4% |
|
|
|
|
|
|
|
|
Plug Power, Inc.(3) |
|
|
344,934 |
|
|
|
2,869,851 |
|
| |
|
|
|
|
|
|
|
|
Integrated Utility — 0.5% |
|
|
|
|
|
|
|
|
Enel Societa Per Azioni(1)(2) |
|
|
100,000 |
|
|
|
623,000 |
|
| |
|
|
|
|
|
|
|
|
IT Services — 2.2% |
|
|
|
|
|
|
|
|
21Vianet Group, Inc.(1)(2)(3) |
|
|
573,257 |
|
|
|
1,473,270 |
|
GDS Holdings Ltd.(1)(2)(3) |
|
|
127,638 |
|
|
|
1,245,747 |
|
| |
|
|
|
|
|
|
2,719,017 |
|
Large Cap Diversified C Corps. - 6.7% |
|
|
|
|
|
|
|
|
Enbridge, Inc.(2) |
|
|
100,000 |
|
|
|
3,520,000 |
|
Pembina Pipeline Corporation(1)(2) |
|
|
153,907 |
|
|
|
4,658,765 |
|
| |
|
|
|
|
|
|
8,178,765 |
|
LNG Midstream — 3.0% |
|
|
|
|
|
|
|
|
New Fortress Energy, Inc. |
|
|
140,985 |
|
|
|
3,703,676 |
|
| |
|
|
|
|
|
|
|
|
Mineral Royalties — 4.3% |
|
|
|
|
|
|
|
|
Sitio Royalties Corporation |
|
|
206,280 |
|
|
|
5,256,014 |
|
| |
|
|
|
|
|
|
|
|
Natural Gas Gatherers & Processors — 2.8% |
|
|
|
|
|
|
|
|
Targa Res Corporation |
|
|
50,728 |
|
|
|
3,452,040 |
|
| |
|
|
|
|
|
|
|
|
See Accompanying Notes to the Financial Statements.
7
NXG NextGen Infrastructure Income Fund |
Schedule of Investments (Unaudited) |
May 31, 2023 — (Continued) |
Common Stock — (Continued) |
|
Shares |
|
|
Fair Value |
|
Natural Gas Pipeline — 1.2% |
|
|
|
|
|
|
|
|
Williams Companies, Inc. |
|
|
50,000 |
|
|
$ |
1,433,000 |
|
| |
|
|
|
|
|
|
|
|
Natural Gas Transportation & Storage — 5.0% |
|
|
|
|
|
|
|
|
Equitrans Midstream Corporation(1) |
|
|
712,742 |
|
|
|
6,079,689 |
|
| |
|
|
|
|
|
|
|
|
Refiners — 4.2% |
|
|
|
|
|
|
|
|
Phillips 66 |
|
|
55,878 |
|
|
|
5,118,984 |
|
| |
|
|
|
|
|
|
|
|
Renewable Generation — 1.9% |
|
|
|
|
|
|
|
|
Sunnova Energy International, Inc.(3) |
|
|
128,353 |
|
|
|
2,266,714 |
|
| |
|
|
|
|
|
|
|
|
Solar — 9.2% |
|
|
|
|
|
|
|
|
Atlantica Sustainable Infrastructure plc(1)(2) |
|
|
295,000 |
|
|
|
7,130,150 |
|
SolarEdge Technologies, Inc.(1)(3) |
|
|
8,000 |
|
|
|
2,278,640 |
|
Sunrun, Inc.(1)(3) |
|
|
102,584 |
|
|
|
1,809,582 |
|
| |
|
|
|
|
|
|
11,218,372 |
|
Solar Developer — 0.6% |
|
|
|
|
|
|
|
|
Azure Power Global Ltd.(1)(2)(3) |
|
|
310,986 |
|
|
|
774,355 |
|
| |
|
|
|
|
|
|
|
|
Solar Energy Equipment — 4.3% |
|
|
|
|
|
|
|
|
Array Technologies, Inc.(1)(3) |
|
|
67,394 |
|
|
|
1,494,125 |
|
Enphase Energy, Inc.(3) |
|
|
11,070 |
|
|
|
1,924,852 |
|
Maxeon Solar Technologies Ltd.(2)(3) |
|
|
63,454 |
|
|
|
1,763,387 |
|
| |
|
|
|
|
|
|
5,182,364 |
|
Solar Equipment — 6.4% |
|
|
|
|
|
|
|
|
FTC Solar, Inc.(3) |
|
|
287,153 |
|
|
|
792,542 |
|
Shoals Technologies Group, Inc. - Class A(3) |
|
|
50,000 |
|
|
|
1,174,500 |
|
SMA Solar Technology AG(2)(3) |
|
|
53,928 |
|
|
|
5,816,510 |
|
| |
|
|
|
|
|
|
7,783,552 |
|
Solar Generation — 3.4% |
|
|
|
|
|
|
|
|
Altus Power, Inc.(3) |
|
|
228,682 |
|
|
|
1,086,240 |
|
Solaria Energia(1)(2)(3) |
|
|
220,426 |
|
|
|
3,003,358 |
|
| |
|
|
|
|
|
|
4,089,598 |
|
Solar Materials Modules — 3.5% |
|
|
|
|
|
|
|
|
First Solar, Inc.(3) |
|
|
12,661 |
|
|
|
2,569,677 |
|
Meyer Burger Technology AG(2)(3) |
|
|
2,669,233 |
|
|
|
1,686,102 |
|
| |
|
|
|
|
|
|
4,255,779 |
|
Towers — 1.2% |
|
|
|
|
|
|
|
|
Cellnex Telecom SA(2) |
|
|
35,000 |
|
|
|
1,418,394 |
|
| |
|
|
|
|
|
|
|
|
Utilities — 5.2% |
|
|
|
|
|
|
|
|
Clearway Energy, Inc.(1) |
|
|
219,156 |
|
|
|
6,296,352 |
|
| |
|
|
|
|
|
|
|
|
Wind Equipment — 1.4% |
|
|
|
|
|
|
|
|
TPI Composites, Inc.(3) |
|
|
165,480 |
|
|
|
1,764,017 |
|
See Accompanying Notes to the Financial Statements.
8
NXG NextGen Infrastructure Income Fund |
Schedule of Investments (Unaudited) |
May 31, 2023 — (Continued) |
Common Stock — (Continued) |
|
Shares |
|
|
Fair Value |
|
Wind Generation — 1.1% |
|
|
|
|
|
|
|
|
Orsted A/S(2)(4) |
|
|
15,398 |
|
|
$ |
1,354,825 |
|
| |
|
|
|
|
|
|
|
|
Total Common Stocks (Cost $117,831,031) |
|
|
|
|
|
$ |
98,029,846 |
|
| |
|
|
|
|
|
|
|
|
Master Limited Partnerships and
Related Companies — 36.9% |
|
Units |
|
|
|
|
Crude Oil & Refined Products — 5.8% |
|
|
|
|
|
|
|
|
Delek Logistics Partners, L.P.(1) |
|
|
26,520 |
|
|
$ |
1,426,776 |
|
Nustar Energy, L.P.(1) |
|
|
347,594 |
|
|
|
5,676,210 |
|
| |
|
|
|
|
|
|
7,102,986 |
|
Large Cap Diversified C Corps — 1.4% |
|
|
|
|
|
|
|
|
Plains GP Holdings, L.P.(1) |
|
|
128,643 |
|
|
|
1,749,545 |
|
| |
|
|
|
|
|
|
|
|
Large Cap MLP — 7.3% |
|
|
|
|
|
|
|
|
Energy Transfer, L.P.(1) |
|
|
389,472 |
|
|
|
4,829,458 |
|
MPLX, L.P.(1) |
|
|
120,227 |
|
|
|
4,008,368 |
|
| |
|
|
|
|
|
|
8,837,826 |
|
Natural Gas Gatherers & Processors — 7.7% |
|
|
|
|
|
|
|
|
Crestwood Equity Partners, L.P.(1) |
|
|
253,506 |
|
|
|
6,504,964 |
|
Western Midstream Partners, L.P.(1) |
|
|
112,802 |
|
|
|
2,847,122 |
|
| |
|
|
|
|
|
|
9,352,086 |
|
Natural Gas Transportation & Storage- 3.4% |
|
|
|
|
|
|
|
|
Cheniere Energy Partners, L.P. |
|
|
91,940 |
|
|
|
4,086,733 |
|
| |
|
|
|
|
|
|
|
|
Upstream MLP — 5.1% |
|
|
|
|
|
|
|
|
Kimbell Royalty Partners, L.P. |
|
|
151,128 |
|
|
|
2,226,115 |
|
TXO Energy Partners, L.P.(3) |
|
|
187,500 |
|
|
|
4,025,625 |
|
| |
|
|
|
|
|
|
6,251,740 |
|
YieldCo — 6.2% |
|
|
|
|
|
|
|
|
NextEra Energy Partners, L.P. |
|
|
126,194 |
|
|
|
7,561,544 |
|
| |
|
|
|
|
|
|
|
|
Total Master Limited Partnerships and Related Companies (Cost $34,148,728) |
|
|
|
|
|
$ |
44,942,460 |
|
| |
|
|
|
|
|
|
|
|
Real Estate Investment Trusts — 1.0% |
|
Shares |
|
|
|
|
Data Centers — 1.0% |
|
|
|
|
|
|
|
|
Keppel DC REIT(2) |
|
|
831,057 |
|
|
$ |
1,284,320 |
|
| |
|
|
|
|
|
|
|
|
Total Real Estate Investment Trusts (Cost $1,411,112) |
|
|
|
|
|
$ |
1,284,320 |
|
| |
|
|
|
|
|
|
|
|
Fixed Income — 8.0% |
|
Principal
Amount |
|
|
|
|
Automobile Parts Manufacturing — 4.1% |
|
|
|
|
|
|
|
|
Clarios Global, L.P., 8.500%, due 05/15/2027 (1)(2)(4) |
|
|
5,000,000 |
|
|
$ |
5,022,323 |
|
| |
|
|
|
|
|
|
|
|
Exploration & Production — 0.0% |
|
|
|
|
|
|
|
|
Sanchez Energy Corporation, 6.125%, due 01/15/2023(1) |
|
|
5,000,000 |
|
|
|
— |
|
See Accompanying Notes to the Financial Statements.
9
NXG NextGen Infrastructure Income Fund |
Schedule of Investments (Unaudited) |
May 31, 2023 — (Continued) |
Fixed Income — (Continued) |
|
Principal
Amount |
|
|
Fair Value |
|
Refiners — 3.9% |
|
|
|
|
|
|
|
|
PBF Holding Company, LLC / PBF Finance Corporation, 7.000%, due 11/15/2023(1) |
|
|
4,750,000 |
|
|
$ |
4,743,089 |
|
| |
|
|
|
|
|
|
|
|
Total Fixed Income (Cost $14,697,077) |
|
|
|
|
|
$ |
9,765,412 |
|
| |
|
|
|
|
|
|
|
|
Short-Term Investments -
Investment Companies — 1.1% |
|
Shares |
|
|
|
|
First American Government Obligations Fund - Class X, 4.97%(1)(5) |
|
|
642,883 |
|
|
$ |
642,882 |
|
First American Treasury Obligations Fund - Class X, 5.01%(1)(5) |
|
|
642,882 |
|
|
|
642,882 |
|
Total Short-Term Investments - Investment Companies (Cost $1,285,764) |
|
|
|
|
|
$ |
1,285,764 |
|
Total Investments — 127.4% (Cost $169,373,712) |
|
|
|
|
|
$ |
155,307,802 |
|
Written Options(6) — (0.0)% (Premiums received $161,953) |
|
|
|
|
|
|
(3,150 |
) |
Liabilities in Excess of Other Assets — (27.4)% |
|
|
|
|
|
|
(33,367,759 |
) |
Net Assets Applicable to Common Stockholders — 100.0% |
|
|
|
|
|
$ |
121,936,893 |
|
|
(1)
|
All or a portion of these securities are held as collateral pursuant to the loan agreements.
|
|
(2)
|
Foreign issued security. Foreign concentration is as follows: Canada 10.83%, United Kingdom 7.60%, and Germany 4.77%
|
|
(3)
|
No distribution or dividend was made during the period ended May 31, 2023. As such, it is classified as a non-income producing security as of May 31, 2023.
|
|
(4)
|
Securities purchased pursuant to Rule 144A of the Securities Act of 1933, as amended, and may be sold only to dealers in that program or other “qualified institutional buyers.” These securities have been deemed to be liquid by the Fund’s adviser under the supervision of the Board of Directors. As of May 31, 2023, the value of these investments was $6,377,148, or 5.23% of total net assets.
|
|
(5)
|
Rate reported is the current yield as of May 31, 2023.
|
Description |
|
|
Exercise
Price |
Expiration
Date |
Currency |
Number of
Contracts |
|
|
Premiums
Received |
|
|
Fair
Value |
|
Unrealized
Appreciation
(Depreciation) |
Maxeon Solar Technologies Ltd., Call Option |
|
$ |
40 |
6/2023 |
USD |
630 |
|
$ |
81,551 |
|
$ |
3,150 |
|
78,401 |
See Accompanying Notes to the Financial Statements.
10
NXG NextGen Infrastructure Income Fund
Statement of Assets & Liabilities (Unaudited)
May 31, 2023 |
Assets |
|
|
|
|
Investments, at fair value (cost $169,373,712) |
|
$ |
155,307,802 |
|
Foreign Currency (cost $385,221) |
|
|
367,395 |
|
Distributions and dividends receivable |
|
|
541,559 |
|
Prepaid expenses and other receivables |
|
|
463,049 |
|
Total assets |
|
|
156,679,805 |
|
Liabilities |
|
|
|
|
Written options, at fair value (premiums $81,551) |
|
|
3,150 |
|
Short-term borrowings |
|
|
33,910,000 |
|
Payable to Adviser, net of waiver |
|
|
133,748 |
|
Distributions and dividends payable |
|
|
7,608 |
|
Payable for investments purchased |
|
|
554,403 |
|
Accrued interest expense |
|
|
5,833 |
|
Accrued expenses and other liabilities |
|
|
128,170 |
|
Total liabilities |
|
|
34,742,912 |
|
Net assets applicable to common stockholders |
|
$ |
121,936,893 |
|
Components of Net Assets |
|
|
|
|
Capital stock, $0.001 par value; 2,601,714 shares issued and outstanding (unlimited shares authorized) |
|
$ |
2,602 |
|
Additional paid-in capital |
|
|
144,089,901 |
|
Accumulated net losses |
|
|
(22,155,610 |
) |
Net assets applicable to common stockholders |
|
$ |
121,936,893 |
|
Net asset value per common share outstanding (net assets applicable to common shares divided by common shares outstanding) |
|
$ |
46.87 |
|
See Accompanying Notes to the Financial Statements.
11
NXG NextGen Infrastructure Income Fund
Statement of Operations (Unaudited)
Period from December 1, 2022 through May 31, 2023 |
Investment Income |
|
|
|
|
Distributions and dividends received, net of foreign taxes withheld of $104,481 |
|
$ |
6,159,342 |
|
Less: return of capital on distributions |
|
|
(3,388,616 |
) |
Distribution and dividend income |
|
|
2,770,726 |
|
Interest income |
|
|
468,326 |
|
Other income |
|
|
20 |
|
Total Investment Income |
|
|
3,239,072 |
|
Expenses |
|
|
|
|
Adviser fees |
|
|
1,085,430 |
|
Trustees’ fees |
|
|
99,242 |
|
Professional fees |
|
|
96,300 |
|
Administrator fees |
|
|
68,460 |
|
Reports to stockholders |
|
|
30,734 |
|
Insurance expense |
|
|
26,762 |
|
Registration fees |
|
|
13,717 |
|
Custodian fees and expenses |
|
|
11,586 |
|
Transfer agent fees |
|
|
10,134 |
|
Fund accounting fees |
|
|
1,894 |
|
Total Expenses before Interest Expense |
|
|
1,444,259 |
|
Interest expense |
|
|
1,330,971 |
|
Total Expenses |
|
|
2,775,230 |
|
Less: expense waived by Adviser |
|
|
(217,086 |
) |
Net Expenses |
|
|
2,558,144 |
|
Net Investment Income |
|
|
680,928 |
|
Realized and Unrealized Loss on Investments |
|
|
|
|
Net realized gain on investments |
|
|
1,526,300 |
|
Net realized gain on options |
|
|
472,558 |
|
Net realized gain on investments |
|
|
1,998,858 |
|
Net change in unrealized appreciation/depreciation of investments |
|
|
(19,336,340 |
) |
Net change in unrealized appreciation/depreciation of written options |
|
|
78,401 |
|
Net change in unrealized appreciation/depreciation of investments and foreign currency |
|
|
(19,257,939 |
) |
Net Realized and Unrealized Loss on Investments |
|
|
(17,259,081 |
) |
Net Decrease in Net Assets Applicable to Common Stockholders |
|
|
|
|
Resulting from Operations |
|
$ |
(16,578,153 |
) |
See Accompanying Notes to the Financial Statements.
12
NXG NextGen Infrastructure Income Fund
Statements of Changes in Net Assets |
| |
|
Period from
December 1,
2022
through
May 31, 2023
(Unaudited) |
|
|
Fiscal Year
Ended
November 30,
2022 |
|
Operations |
|
|
|
|
|
|
|
|
Net investment income income (loss) |
|
$ |
680,928 |
|
|
$ |
(160,138 |
) |
Net realized gain on investments |
|
|
1,998,858 |
|
|
|
11,907,876 |
|
Net change in unrealized appreciation/depreciation of investments and foreign currency |
|
|
(19,257,939 |
) |
|
|
(1,194,557 |
) |
Net increase (decrease) in net assets applicable to common stockholders resulting from operations |
|
|
(16,578,153 |
) |
|
|
10,553,181 |
|
Distributions and Dividends to Common Stockholders |
|
|
|
|
|
|
|
|
Distributable earnings |
|
|
— |
|
|
|
— |
|
Return of capital |
|
|
(3,919,223 |
) |
|
|
(6,656,226 |
) |
Total distributions and dividends to common stockholders |
|
|
(3,919,223 |
) |
|
|
(6,656,226 |
) |
Total increase (decrease) in net assets applicable to common stockholders |
|
|
(20,497,376 |
) |
|
|
3,896,955 |
|
Net Assets |
|
|
|
|
|
|
|
|
Beginning of period |
|
|
142,434,269 |
|
|
|
138,537,314 |
|
End of period |
|
$ |
121,936,893 |
|
|
$ |
142,434,269 |
|
See Accompanying Notes to the Financial Statements.
13
NXG NextGen Infrastructure Income Fund
Statement of Cash Flows (Unaudited)
Period from December 1, 2022 through May 31, 2023 |
OPERATING ACTIVITIES |
|
|
|
|
Net Decrease in Net Assets Applicable to Common Stockholders |
|
|
|
|
Resulting from Operations |
|
$ |
(16,578,153 |
) |
Adjustments to reconcile net decrease in the net assets applicable to common stockholders resulting from operations to net cash provided by operating activities |
|
|
|
|
Net change in unrealized appreciation/depreciation of investments and foreign currency |
|
|
19,257,939 |
|
Purchases of investments |
|
|
(160,448,106 |
) |
Proceeds from sales of investments |
|
|
167,590,522 |
|
Proceeds from option transactions, net |
|
|
554,109 |
|
Return of capital on distributions and dividends |
|
|
3,388,616 |
|
Net realized gain on sales of investments |
|
|
(1,998,858 |
) |
Net sales of short-term investments |
|
|
9,258,331 |
|
Net accretion/amortization of senior notes’ premiums/discounts |
|
|
45,047 |
|
Changes in operating assets and liabilities |
|
|
|
|
Distributions and dividends receivable |
|
|
(156,496 |
) |
Prepaid expenses and other receivables |
|
|
(62,026 |
) |
Payable to Adviser, net of waiver |
|
|
(21,134 |
) |
Distributions and dividends payable |
|
|
2,959 |
|
Payable for investments purchased |
|
|
554,403 |
|
Due to custodian |
|
|
(10,000,000 |
) |
Accrued interest expense |
|
|
(3,674 |
) |
Net cash provided by operating activities |
|
|
11,383,479 |
|
FINANCING ACTIVITIES |
|
|
|
|
Proceeds from borrowing facility |
|
|
33,500,000 |
|
Repayment of borrowing facility |
|
|
(41,000,000 |
) |
Distributions and dividends paid to common stockholders |
|
|
(3,919,223 |
) |
Net cash used in financing activities |
|
|
(11,419,223 |
) |
DECREASE IN CASH AND CASH EQUIVALENTS |
|
|
(35,744 |
) |
CASH AND CASH EQUIVALENTS: |
|
|
|
|
Beginning of period |
|
|
403,139 |
|
End of period |
|
$ |
367,395 |
|
SUPPLEMENTAL DISCLOSURE OF CASH FLOW AND NON-CASH INFORMATION |
|
|
|
|
Interest Paid |
|
$ |
1,334,645 |
|
See Accompanying Notes to the Financial Statements.
14
NXG NextGen Infrastructure Income Fund
Financial Highlights |
| |
|
Period from
December 1,
2022
through
May 31, 2023
(Unaudited) |
|
|
Fiscal Year
Ended
November 30,
2022 |
|
|
Fiscal Year
Ended
November 30,
2021 |
|
|
Fiscal Year
Ended
November 30,
2020 |
|
|
Fiscal Year
Ended
November 30,
2019(1) |
|
|
Fiscal Year
Ended
November 30,
2018(1) |
|
Per Common Share Data (2) |
|
|
|
|
|
|
|
|
|
|
|
|
|
|
|
|
|
|
|
|
|
|
|
|
Net Asset Value, beginning of period |
|
$ |
54.75 |
|
|
$ |
53.25 |
|
|
$ |
45.87 |
|
|
$ |
58.28 |
|
|
$ |
70.12 |
|
|
$ |
79.88 |
|
Income from Investment Operations: |
|
|
|
|
|
|
|
|
|
|
|
|
|
|
|
|
|
|
|
|
|
|
|
|
Net investment income (loss) |
|
|
0.26 |
|
|
|
(0.06 |
) |
|
|
0.70 |
|
|
|
(0.11 |
) |
|
|
0.24 |
|
|
|
(3.60 |
) |
Net realized and unrealized gain (loss) on investments |
|
|
(6.63 |
) |
|
|
4.12 |
|
|
|
9.24 |
|
|
|
(7.74 |
) |
|
|
(1.80 |
) |
|
|
5.28 |
|
Total increase (decrease) from investment operations |
|
|
(6.37 |
) |
|
|
4.06 |
|
|
|
9.94 |
|
|
|
(7.85 |
) |
|
|
(1.56 |
) |
|
|
1.68 |
|
Less Distributions to Common Stockholders: |
|
|
|
|
|
|
|
|
|
|
|
|
|
|
|
|
|
|
|
|
|
|
|
|
Net investment income |
|
|
— |
|
|
|
— |
|
|
|
— |
|
|
|
(0.59 |
) |
|
|
(1.28 |
) |
|
|
(0.76 |
) |
Net realized gain |
|
|
— |
|
|
|
— |
|
|
|
— |
|
|
|
— |
|
|
|
(2.68 |
) |
|
|
(4.84 |
) |
Return of capital |
|
|
(1.51 |
) |
|
|
(2.56 |
) |
|
|
(2.56 |
) |
|
|
(3.97 |
) |
|
|
(2.60 |
) |
|
|
(0.96 |
) |
Total distributions to common stockholders |
|
|
(1.51 |
) |
|
|
(2.56 |
) |
|
|
(2.56 |
) |
|
|
(4.56 |
) |
|
|
(6.56 |
) |
|
|
(6.56 |
) |
Capital Share Transactions: |
|
|
|
|
|
|
|
|
|
|
|
|
|
|
|
|
|
|
|
|
|
|
|
|
Premiums less underwriting discounts and offering costs on issuance of common shares |
|
|
— |
|
|
|
— |
|
|
|
— |
|
|
|
— |
|
|
|
(3.72 |
)(4) |
|
|
(4.88 |
)(3) |
Net Asset Value, end of period |
|
$ |
46.87 |
|
|
$ |
54.75 |
|
|
$ |
53.25 |
|
|
$ |
45.87 |
|
|
$ |
58.28 |
|
|
$ |
70.12 |
|
Per common share fair value, end of period |
|
$ |
35.94 |
|
|
$ |
42.53 |
|
|
$ |
45.02 |
|
|
$ |
35.74 |
|
|
$ |
50.72 |
|
|
$ |
64.68 |
|
Total Investment Return Based on Fair Value (5) |
|
|
(12.11 |
)% |
|
|
0.34 |
% |
|
|
33.40 |
% |
|
|
(19.52 |
)% |
|
|
(12.23 |
)% |
|
|
(6.04 |
)% |
See Accompanying Notes to the Financial Statements.
15
NXG NextGen Infrastructure Income Fund
Financial Highlights — (Continued) |
| |
|
Period from
December 1,
2022
through
May 31, 2023
(Unaudited) |
|
|
Fiscal Year
Ended
November 30,
2022 |
|
|
Fiscal Year
Ended
November 30,
2021 |
|
|
Fiscal Year
Ended
November 30,
2020 |
|
|
Fiscal Year
Ended
November 30,
2019(1) |
|
|
Fiscal Year
Ended
November 30,
2018(1) |
|
Supplemental Data and Ratios |
|
|
|
|
|
|
|
|
|
|
|
|
|
|
|
|
|
|
|
|
|
|
|
|
Net assets applicable to common stockholders, end of period (000’s) |
|
$ |
121,937 |
|
|
$ |
142,434 |
|
|
$ |
138,537 |
|
|
$ |
119,348 |
|
|
$ |
151,639 |
|
|
$ |
136,843 |
|
Ratio of expenses to average net assets after waiver (6) |
|
|
4.00 |
% |
|
|
2.88 |
% |
|
|
2.25 |
% |
|
|
1.99 |
% |
|
|
2.39 |
% |
|
|
2.77 |
% |
Ratio of net investment income (loss) to average net assets before waiver (6) |
|
|
0.73 |
% |
|
|
(0.46 |
)% |
|
|
0.95 |
% |
|
|
0.92 |
% |
|
|
2.26 |
% |
|
|
1.94 |
% |
Ratio of net investment income (loss) to average net assets after waiver (6) |
|
|
1.06 |
% |
|
|
(0.12 |
)% |
|
|
1.29 |
% |
|
|
1.10 |
% |
|
|
2.26 |
% |
|
|
1.94 |
% |
Portfolio turnover rate |
|
|
94.82 |
%(7) |
|
|
124.56 |
% |
|
|
125.80 |
% |
|
|
71.35 |
% |
|
|
59.32 |
% |
|
|
74.00 |
% |
Total borrowings outstanding (in thousands) |
|
$ |
33,910 |
|
|
$ |
41,410 |
|
|
$ |
56,410 |
|
|
$ |
18,310 |
|
|
$ |
— |
|
|
$ |
42,156 |
|
Asset coverage, per $1,000 of indebtedness(8) |
|
$ |
4,596 |
|
|
$ |
4,440 |
|
|
$ |
3,456 |
|
|
$ |
7,518 |
|
|
$ |
— |
|
|
$ |
4,246 |
|
|
(1)
|
Per share data adjusted for 1:4 reverse stock split completed as of June 12, 2020.
|
|
(2)
|
Information presented relates to a share of common stock outstanding for the entire period.
|
|
(3)
|
Represents the share impact related to a rights offering, which was completed on March 22, 2018.
|
|
(4)
|
Represents the share impact related to a rights offering, which was completed on July 18, 2019.
|
|
(5)
|
Not annualized. The calculation assumes reinvestment of dividends at actual prices pursuant to the Fund’s dividend reinvestment plan. Total investment return does not reflect brokerage commissions.
|
|
(6)
|
The ratio of expenses to average net assets before waiver was 4.34%, 3.22%, 2.59%, 2.16%, 2.39%, and 2.77% for the period ended May 31, 2023 and fiscal years ended November 30, 2022, 2021, 2020, 2019, and 2018, respectively.
|
|
(8)
|
Calculated by subtracting the Fund’s total liabilities (not including borrowings) from the Fund’s total assets and dividing by the total borrowings.
|
See Accompanying Notes to the Financial Statements.
16
NXG NextGen Infrastructure Income Fund
Notes to Financial Statements (Unaudited)
May 31, 2023 |
1. Organization
NXG NextGen Infrastructure Income Fund (formerly, The Cushing® NextGen Infrastructure Income Fund) (the “Fund”) was formed as a Delaware statutory trust on November 16, 2010, and is registered as a diversified, closed- end management investment company under the Investment Company Act of 1940, as amended (the “1940 Act”). The Fund is managed by Cushing® Asset Management, LP, d/b/a NXG Investment Management (the “Adviser”). The Fund’s investment objective is to seek a high total return with an emphasis on current income. The Fund commenced operations on September 25, 2012. The Fund’s common shares are listed on the New York Stock Exchange under the symbol “NXG.”
2. Significant Accounting Policies
A. Use of Estimates
The following is a summary of significant accounting policies, consistently followed by the Fund in preparation of the financial statements. The Fund is considered an investment company and accordingly, follows the investment company accounting and reporting guidance of the Financial Accounting Standards Board Accounting Standard Codification Topic 946, Financial Services - Investment Companies, which is part of U.S. Generally Accepted Accounting Principles (“U.S. GAAP”).
The preparation of financial statements in conformity with U.S. GAAP requires management to make estimates and assumptions that affect the reported amount of assets and liabilities, recognition of distribution income and disclosure of contingent assets and liabilities at the date of the financial statements. Actual results could differ from those estimates.
The Board of Trustees has designated the Adviser as the “valuation designee” for the Fund pursuant to Rule 2a-5 under the 1940 Act. The valuation designee is responsible for making fair value determinations pursuant to valuation policies and procedures adopted by the Adviser and the Fund (the “Valuation Policy”). A committee of voting members comprised of senior personnel of the Adviser considers various pricing issues and establishes fair valuations of portfolio securities and other instruments held by the Fund in accordance with the Valuation Policy (the “Valuation Committee”). The Adviser as valuation designee is subject to monitoring and oversight by the Board of Trustees. As a general principle, the fair value of a portfolio instrument is the amount that an owner might reasonably expect to receive upon the instrument’s current sale. A range of factors and analysis may be considered when determining fair value, including relevant market data, interest rates, credit considerations and/or issuer specific news. The Valuation Committee may consult with and receive input from third parties and will utilize a variety of market data including yields or prices of investments of comparable quality, type of issue, coupon, maturity, rating, indications of value from security dealers, evaluations of anticipated cash flows or collateral, spread over U.S. Treasury obligations, and other information and analysis. In addition, the Valuation Committee may consider valuations provided by valuation firms retained to assist in the valuation of certain of the Fund’s investments. Fair valuation involves subjective judgments. While the Fund’s use of fair valuation is intended to result in calculation of net asset value that fairly reflects values of the Fund’s portfolio securities as of the time of pricing, the Fund cannot guarantee that any fair valuation will, in fact, approximate the amount the Fund would actually realize upon the sale of the securities in question. It is possible that the fair value determined for a portfolio instrument may be materially different from the value that could be realized upon the sale of that instrument.
17
B. Investment Valuation
The valuation designee uses the following valuation methods to determine fair value as either fair value for investments for which market quotations are available, or if not available, the fair value, as determined in good faith pursuant to the Valuation Policy. The valuation of the portfolio securities of the Fund currently includes the following processes:
| |
(i)
|
The market value of each security listed or traded on any recognized securities exchange or automated quotation system will be the last reported sale price at the relevant valuation date on the composite tape or on the principal exchange on which such security is traded except those listed on the NASDAQ Global Market®, NASDAQ Global Select Market® and the NASDAQ Capital Market® exchanges (collectively, “NASDAQ”). Securities traded on NASDAQ will be valued at the NASDAQ Official Closing Price (“NOCP”). If no sale is reported on that date, the security will be valued at the last reported bid price. If the Valuation Committee (the “Committee”) determines that price is not representative of the actual market price, the Committee may determine the fair value of the security.
|
| |
(ii)
|
Securities not traded on a U.S. exchange or NASDAQ and foreign securities that are traded on foreign exchanges whose operations are similar to the U.S. over-the-counter market will be valued at prices supplied by a pricing service. If the Committee determines that price is not representative of the actual market price, the Committee may determine the fair value of the security.
|
| |
(iii)
|
Debt securities will be valued based on evaluated mean prices by an outside pricing service that employs a pricing model that takes into account bids, yield spreads, and/or other market data and specific security characteristics (e.g., credit quality, maturity and coupon rate). If a price cannot be obtained from pricing services, quotes from market makers or brokers may be used. When possible, more than one market maker or broker should be utilized and the mean of bid and ask prices should be used.
|
| |
(iv)
|
Private Placements in Public Entities (“PIPES”) will be valued using the price of the publicly traded common stock as a baseline, deducting the discount realized on the original purchase and amortizing the difference over the restricted period.
|
| |
(v)
|
Listed options on debt or equity securities are valued at the last sale price or, if there are no trades for the day, the mean of the closing bid price and ask price. Unlisted options on debt or equity securities are valued based upon their composite bid prices if held long, or their composite ask prices if held short. Futures are valued at the settlement price. Premiums for the sale of options written by an investment company registered under the 1940 Act (a “Registered Fund”) Fund will be included in the assets of such Registered Fund, and the market value of such options will be included as a liability.
|
| |
(vi)
|
For valuation purposes, quotations of foreign portfolio securities, other assets and liabilities and forward contracts stated in foreign currency are as of the close of regular trading on the Exchange each day the Exchange is open for trading (or earlier as may be specified by the Registered Fund) and translated into U.S. dollar equivalents at the current prevailing market rates as quoted by a pricing service.
|
| |
(vii)
|
Foreign securities are valued using “fair value factors”. Fair value factors consider daily trade activity and price changes for depositary receipts, exchange-traded funds, index futures, foreign currency exchange activity, or other relevant market data.
|
| |
(viii)
|
Over-the-counter options on foreign securities and currencies are fair valued by obtaining the “last available bid” from a single dealer that is either the writer or purchaser of the option.
|
| |
(ix)
|
Swaps will be valued using market-based prices provided by pricing services or broker-dealer bid counterparty quotations.
|
18
| |
(x)
|
Whenever trading in a listed security held in a portfolio is temporarily suspended, halted or delisted from an exchange, the security may be priced using the last closing price for a period of up to 5 business days. The Committee will continue to monitor the security during this period and, if there is a belief that the last closing price does not reflect the fair value of such security, then the value of such security will be determined by the Committee based on factors the Committee deems relevant. Whenever any such valuation determination is made, the Committee will monitor the market and other sources of information available to it in order to ascertain whether any change in circumstance would suggest a change in the value so determined.
|
The Fund may engage in short sale transactions. For financial statement purposes, an amount equal to the settlement amount, if any, is included in the Statement of Assets and Liabilities as a liability. The amount of the liability is subsequently marked-to-market to reflect the fair value of the short positions. Subsequent fluctuations in market prices of securities sold short may require purchasing the securities at prices which may differ from the fair value reflected on the Statement of Assets and Liabilities. When the Fund sells a security short, it must borrow the security sold short and deliver it to the broker-dealer through which it made the short sale. A gain, limited to the price at which the Fund sold the security short, or a loss, unlimited in size, will be recognized under the termination of a short sale. The Fund is also subject to the risk that it may be unable to reacquire a security to terminate a short position except at a price substantially more than the last quoted price. The Fund is liable for any distributions and dividends (collectively referred to as “Distributions”) paid on securities sold short and such amounts, if any, would be reflected as Distribution expense in the Statement of Operations. The Fund’s obligation to replace the borrowed security will be secured by collateral deposited with the broker-dealer. The Fund also will be required to segregate similar collateral to the extent, if any, necessary so that the value of both collateral amounts in the aggregate is at all times equal to at least 100% of the current fair value of the securities sold short.
C. Security Transactions, Investment Income and Expenses
Security transactions are accounted for on the date the securities are purchased or sold (trade date). Realized gains and losses are reported on a high cost basis. Interest income is recognized on an accrual basis, including amortization of premiums and accretion of discounts. Distributions are recorded on the ex- dividend date. Distributions received from the Fund’s investments in master limited partnerships (“MLPs”) and real estate investment trusts (“REITs”) generally are comprised of ordinary income, capital gains and return of capital. The Fund records investment income on the ex-date of the distributions. For financial statement purposes, the Fund uses return of capital and income estimates to allocate the distribution income received. Such estimates are based on historical information available from each MLP and REIT and other industry sources. These estimates may subsequently be revised based on information received from the MLPs and REITs after their tax reporting periods are concluded, as the actual character of these distributions is not known until after the fiscal year end of the Fund.
The Fund estimates the allocation of investment income and return of capital for the distributions received from its portfolio investments within the Statement of Operations. For the period ended May 31, 2023, the Fund has estimated approximately 55% of the distributions from its portfolio investments to be return of capital.
Expenses are recorded on an accrual basis.
D. Distributions to Shareholders
The Fund’s distributions may include a return of capital to shareholders to the extent that distributions are in excess of the Fund’s net investment income and net capital gains, determined in accordance with U.S. federal income tax regulations. Distributions that are treated for U.S. federal income tax purposes as a return of capital will reduce each shareholder’s basis in his or her shares and, to the extent the return of capital exceeds such basis, will be treated as a gain to the shareholder from a sale of shares. Returns of shareholder capital may have the effect of reducing the Fund’s assets and increasing the Fund’s expense ratio.
For the fiscal year ended November 30, 2022, the Fund’s distributions were expected to be 100%, or $6,656,226,
19
return of capital1. The final character of distributions paid for the period ended May 31, 2023 will be determined in early 2024.
E. Federal Income Taxation
The Fund intends to qualify each year for special tax treatment afforded to a regulated investment company (“RIC”) under Subchapter M of the Internal Revenue Code of 1986, as amended (“IRC”). In order to qualify as a RIC, the Fund must, among other things, satisfy income, asset diversification and distribution requirements. As long as it so qualifies, the Fund will not be subject to U.S. federal income tax to the extent that it distributes annually its investment company taxable income (which includes ordinary income and the excess of net short- term capital gain over net long-term capital loss) and its “net capital gain” (i.e., the excess of net long-term capital gain over net short-term capital loss). The Fund intends to distribute at least annually substantially all of such income and gain. If the Fund retains any investment company taxable income or net capital gain, it will be subject to U.S. federal income tax on the retained amount at regular corporate tax rates. In addition, if the Fund fails to qualify as a RIC for any taxable year, it will be subject to U.S. federal income tax on all of its income and gains at regular corporate tax rates.
The Fund recognizes in the financial statements the impact of a tax position, if that position is more-likely- than-not to be sustained on examination by the taxing authorities, based on the technical merits of the position. Tax benefits resulting from such a position are measured as the amount that has a greater than fifty percent likelihood on a cumulative basis to be sustained on examination.
F. Cash and Cash Equivalents
The Fund considers all highly liquid investments purchased with initial maturity equal to or less than three months to be cash equivalents.
G. Cash Flow Information
The Fund makes distributions from investments, which include the amount received as cash distributions from MLPs, common stock dividends and interest payments. These activities are reported in the Statement of Changes in Net Assets, and additional information on cash receipts and payments is presented in the Statement of Cash Flows.
H. Indemnification
Under the Fund’s organizational documents, its officers and trustees are indemnified against certain liabilities arising out of the performance of their duties to the Fund. In addition, in the normal course of business, the Fund may enter into contracts that provide general indemnification to other parties. The Fund’s maximum exposure under such indemnification arrangements is unknown, as this would involve future claims that may be made against the Fund that have not yet occurred and may not occur. However, the Fund has not had prior claims or losses pursuant to these contracts and expects the risk of loss to be remote.
I. Derivative Financial Instruments
The Fund provides disclosure regarding derivatives and hedging activity to allow investors to understand how and why the Fund uses derivatives, how derivatives are accounted for, and how derivative instruments affect the Fund’s results of operations and financial position.
The Fund occasionally purchases and sells (“writes”) put and call equity options as a source of potential protection against a broad market decline. A purchaser of a put option has the right, but not the obligation, to sell the underlying instrument at an agreed upon price (“strike price”) to the option seller. A purchaser of a call option has the right, but not the obligation, to purchase the underlying instrument at the strike price from the option seller. Options are settled for cash.
|
1
|
For the period ended May 31, 2023, the Fund’s distributions are expected to be 100%, or $3,919,223, return of capital.
|
20
Purchased Options — Premiums paid by the Fund for purchased options are included in the Statement of Assets and Liabilities as an investment. The option is adjusted daily to reflect the fair value of the option and any change in fair value is recorded as unrealized appreciation or depreciation of investments. If the option is allowed to expire, the Fund will lose the entire premium paid and record a realized loss for the premium amount. Premiums paid for purchased options which are exercised or closed are added to the amounts paid or offset against the proceeds on the underlying investment transaction to determine the realized gain/loss or cost basis of the security.
Written Options — Premiums received by the Fund for written options are included in the Statement of Assets and Liabilities. The amount of the liability is adjusted daily to reflect the fair value of the written option and any change in fair value is recorded as unrealized appreciation or depreciation of investments. Premiums received from written options that expire are treated as realized gains. The Fund records a realized gain or loss on written options based on whether the cost of the closing transaction exceeds the premium received. If a call option is exercised by the option buyer, the premium received by the Fund is added to the proceeds from the sale of the underlying security to the option buyer and compared to the cost of the closing transaction to determine whether there has been a realized gain or loss. If a put option is exercised by an option buyer, the premium received by the option seller reduces the cost basis of the purchased security.
Written uncovered call options subject the Fund to unlimited risk of loss. Written covered call options limit the upside potential of a security above the strike price. Put options written subject the Fund to risk of loss if the value of the security declines below the exercise price minus the put premium.
The Fund is not subject to credit risk on written options as the counterparty has already performed its obligation by paying the premium at the inception of the contract.
The Fund has adopted the disclosure provisions of Financial Accounting Standards Board (“FASB”) Accounting Standard Codification 815, Derivatives and Hedging (“ASC 815”). ASC 815 requires enhanced disclosures about the Fund’s use of and accounting for derivative instruments and the effect of derivative instruments on the Fund’s results of operations and financial position. Tabular disclosure regarding derivative fair value and gain/ loss by contract type (e.g., interest rate contracts, foreign exchange contracts, credit contracts, etc.) is required and derivatives accounted for as hedging instruments under ASC 815 must be disclosed separately from those that do not qualify for hedge accounting. Even though the Fund may use derivatives in an attempt to achieve an economic hedge, the Fund’s derivatives are not accounted for as hedging instruments under ASC 815 because investment companies account for their derivatives at fair value and record any changes in fair value in current period earnings.
There were no transactions in purchased options during the period ended May 31, 2023.
The average monthly fair value of written options during the period ended May 31, 2023 was $52,608.
The effect of derivative instruments on the Statement of Operations for the period ended May 31, 2023:
Liability Derivatives |
Risk Exposure Category |
|
Statement of Asset and Liabilities Location |
|
|
Fair Value |
|
Equity Contracts |
|
|
Written options, at fair value |
|
|
$ |
3,150 |
|
Amount of Realized Gain on Derivatives Recognized in Income |
Derivatives not accounted for as hedging instruments under ASC 815 |
|
Purchased
Options |
|
|
Written
Options |
|
|
Total |
|
Equity Contracts |
|
$ |
— |
|
|
$ |
472,558 |
|
|
$ |
472,558 |
|
21
Amount of Unrealized Appreciation on Derivatives Recognized in Income |
Derivatives not accounted for as hedging instruments under ASC 815 |
|
Purchased
Options |
|
|
Written
Options |
|
|
Total |
|
Equity Contracts |
|
$ |
— |
|
|
$ |
78,401 |
|
|
$ |
78,401 |
|
J. Recent Accounting Pronouncements
In March 2020, the Financial Accounting Standards Board issued Accounting Standards Update (ASU) No. 2020-04, Reference Rate Reform (Topic 848) – Facilitation of the Effects of Reference Rate Reform on Financial Reporting. The amendments in the ASU provides optional temporary financial reporting relief from the effect of certain types of contract modifications due to the planned discontinuation of LIBOR and other interbank- offered based reference rates as of the end of 2021. The ASU is effective for certain reference rate-related contract modifications that occur during the period March 12, 2020 through December 31, 2022. Management is currently evaluating the impact, if any, of applying this ASU.
3. Concentrations of Risk
The Fund will pursue its investment objective by investing, under normal market conditions, at least 80% of its net assets, plus any borrowings for investment purposes, in a portfolio of equity and debt securities of infrastructure companies, including energy infrastructure companies, industrial infrastructure companies, sustainable infrastructure companies and technology and communication infrastructure companies. Infrastructure companies may be subject to a variety of factors that may adversely affect their business or operations, including high interest costs in connection with capital construction and improvement programs, high leverage, costs associated with environmental and other regulations, the effects of economic slowdown, surplus capacity, increased competition from other providers of services, uncertainties concerning the availability of fuel at reasonable prices, the effects of energy conservation policies and other factors. Infrastructure companies may also be affected by or subject to difficulty in raising capital in adequate amounts on reasonable terms in periods of high inflation and unsettled capital markets; inexperience with and potential losses resulting from a developing de-regulatory environment; costs associated with compliance with and changes in environmental and other regulations; regulation or adverse actions by various government authorities; government regulation of rates charged to customers; service interruption due to environmental, operational or other mishaps; the imposition of special tariffs and changes in tax laws, regulatory policies and accounting standards; technological innovations that may render existing plants, equipment or products obsolete; and general changes in market sentiment towards infrastructure assets.
4. Agreements and Related Party Transactions
The Fund has entered into an Investment Management Agreement with the Adviser (the “Agreement”). Under the terms of the Agreement, the Fund has agreed to pay the Adviser a fee payable at the end of each calendar month, at an annual rate equal to 1.25% of the average weekly value of the Fund’s Managed Assets during such month for the services and facilities provided by the Adviser of the Fund. “Managed Assets” means the total assets of the Fund, minus all accrued expenses incurred in the normal course of operations other than liabilities or obligations attributable to investment leverage, including, without limitation, investment leverage obtained through (i) indebtedness of any type (including, without limitation, borrowing through a credit facility or the issuance of debt securities), (ii) the issuance of shares of preferred stock or other similar preference securities and/or (iii) the reinvestment of collateral received for securities loaned in accordance with the Fund’s investment objective and policies. Effective on May 23, 2023, the Fund’s Board of Trustees approved a waiver of the advisory fees to be paid to the Adviser in the amount of 0.25% of the Fund’s Managed Assets. The Adviser earned $1,085,430 and waived $217,086 in advisory fees for the period ended May 31, 2023. The Adviser will not recoup any of the waived expenses from the Fund.
22
The Fund has engaged U.S. Bancorp Fund Services, LLC, d/b/a U.S. Bancorp Global Fund Services (“Fund Services”) to serve as the Fund’s administrator. The Fund pays the administrator a monthly fee computed at an annual rate of 0.09% of the first $100,000,000 of the Fund’s average daily net assets, 0.07% on the next $200,000,000 of average daily net assets and 0.04% on the balance of the Fund’s average daily net assets, with a minimum annual fee of $70,000.
Fund Services serves as the Fund’s transfer agent, dividend paying agent, and agent for the automatic dividend reinvestment plan.
U.S. Bank, N.A. serves as the Fund’s custodian. The Fund pays the custodian a monthly fee computed at an annual rate of 0.004% of the Fund’s average daily market value, with a minimum annual fee of $4,800.
Fees paid to trustees for their services to the Fund are reflected as Trustees’ fees on the Statement of Operations.
5. Income Taxes
It is the Fund’s intention to continue to qualify as a RIC under Subchapter M of the IRC and distribute all of its taxable income. Accordingly, no provision for federal income taxes is required in its financial statements.
The amount and character of income and capital gain distributions to be paid, if any, are determined in accordance with federal income tax regulations, which may differ from U.S. generally accepted accounting principles. These differences are primarily due to differences in the timing of recognition of gains or losses on investments. Permanent book and tax basis differences resulted in the reclassifications of $2,348,318 to additional paid in capital and $2,348,318 from accumulated net losses.
The following information is provided on a tax basis as of November 30, 2022:
Cost of investments |
|
$ |
190,439,310 |
|
Gross unrealized appreciation |
|
|
31,298,180 |
|
Gross unrealized depreciation |
|
|
(28,772,771 |
) |
Net unrealized appreciation |
|
|
2,525,409 |
|
Undistributed ordinary income |
|
|
— |
|
Undistributed long-term gains |
|
|
— |
|
Other accumulated losses |
|
|
(8,102,866 |
) |
Accumulated net losses |
|
$ |
(5,577,457 |
) |
The Fund utilized $11,859,285 of capital loss carryforward during the fiscal year ended May 31, 2023. As of May 31, 2023, for federal income tax purposes, capital loss carryforward is comprised of short-term capital loss of $2,377,584 and long-term capital loss of $4,793,747.
The Fund recognizes the tax benefits of uncertain tax positions only where the position is “more likely than not” to be sustained assuming examination by tax authorities. Management has analyzed the Fund’s tax positions and has concluded that no liability for unrecognized tax benefits should be recorded related to uncertain tax positions taken on U.S. tax returns and state tax returns filed since inception of the Fund. No income tax returns are currently under examination. All tax years beginning with November 30, 2019 remain subject to examination by the tax authorities in the United States. Due to the nature of the Fund’s investments, the Fund may be required to file income tax returns in several states. The Fund is not aware of any tax positions for which it is reasonably possible that the total amounts of unrecognized tax benefits will change materially in the next 12 months.
6. Fair Value Measurements
Various inputs that are used in determining the fair value of the Fund’s investments are summarized in the three broad levels listed below:
| |
●
|
Level 1 — quoted prices in active markets for identical securities
|
23
| |
●
|
Level 2 — other significant observable inputs (including quoted prices for similar securities, interest rates, prepayment speeds, credit risk, etc.)
|
| |
●
|
Level 3 — significant unobservable inputs (including the Fund’s own assumptions in determining the fair value of investments)
|
The inputs or methodology used for valuing securities are not necessarily an indication of the risk associated with investing in those securities.
These inputs are summarized in the three broad levels listed below.
| |
|
|
|
|
|
Fair Value Measurements at Reporting Date Using |
|
Description |
|
Fair Value as of
May 31,
2023 |
|
|
Quoted Prices in
Active Markets
for Identical
Assets
(Level 1) |
|
|
Significant
Other
Observable
Inputs
(Level 2) |
|
|
Significant
Unobservable
Inputs
(Level 3) |
|
Assets |
|
|
|
|
|
|
|
|
|
|
|
|
|
|
|
|
Equity Securities |
|
|
|
|
|
|
|
|
|
|
|
|
|
|
|
|
Common Stock(a) |
|
$ |
98,029,846 |
|
|
$ |
81,311,313 |
|
|
$ |
16,718,533 |
|
|
$ |
— |
|
Master Limited Partnerships and Related Companies(a) |
|
|
44,942,460 |
|
|
|
44,942,460 |
|
|
|
— |
|
|
|
— |
|
Real Estate Investment Trusts(a) |
|
|
1,284,320 |
|
|
|
— |
|
|
|
1,284,320 |
|
|
|
— |
|
Total Equity Securities |
|
|
144,256,626 |
|
|
|
126,253,773 |
|
|
|
18,002,853 |
|
|
|
— |
|
Notes |
|
|
|
|
|
|
|
|
|
|
|
|
|
|
|
|
Senior Notes(a) |
|
|
9,765,412 |
|
|
|
— |
|
|
|
9,765,412 |
|
|
|
— |
|
Other |
|
|
|
|
|
|
|
|
|
|
|
|
|
|
|
|
Short-Term Investments — Investment Companies(a) |
|
|
1,285,764 |
|
|
|
1,285,764 |
|
|
|
— |
|
|
|
— |
|
Total Assets |
|
$ |
155,307,802 |
|
|
$ |
127,539,537 |
|
|
$ |
27,768,265 |
|
|
$ |
— |
|
|
(a)
|
All other industry classifications are identified in the Schedule of Investments. The Fund did not hold Level 3 investments at any time during the period ended May 31, 2023.
|
7. Investment Transactions
For the period ended May 31, 2023, the Fund purchased (at cost) and sold securities (proceeds) in the amount of $160,448,106 and $167,590,522 (excluding short-term securities), respectively. The Fund sold written options (proceeds) in the amount of $554,109.
8. Common Shares
The Fund had unlimited common shares of beneficial interest authorized and 2,601,714 shares outstanding as of May 31, 2023. Transactions in common shares for the fiscal year ended November 30, 2022 and period ended May 31, 2023 were as follows:
Shares at November 30, 2021 |
|
|
2,601,714 |
|
Shares at November 30, 2022 |
|
|
2,601,714 |
|
Shares at May 31, 2023 |
|
|
2,601,714 |
|
9. Borrowing Facilities
The Fund maintains a margin account arrangement with Scotiabank™. The interest rate charged on margin borrowing is tied to the cost of funds for Scotiabank™ (which is LIBOR plus 1.00%). Proceeds from the margin account arrangement are used to execute the Fund’s investment objective.
The average principal balance and interest rate for the period during which the credit facilities were utilized during the period ended May 31, 2023 was $46,215,000 and 5.71%, respectively. On May 31, 2023, the principal balance outstanding was $33,910,000 and accrued interest expense was $205,042.
24
10. Subsequent Events
Subsequent to May 31, 2023, the Fund declared monthly distributions to common shareholders in the amounts of $0.2700 per share, payable on June 30 and July 31, 2023, to shareholders of record on June 15 and July 18, 2023, respectively.
There were no additional subsequent events through the date the financial statements were issued that would require adjustments to or additional disclosure in these financial statements.
25
NXG NextGen Infrastructure Income Fund
Additional Information (Unaudited)
May 31, 2023 |
Trustee and Executive Officer Compensation
The Fund does not currently compensate any of its trustees who are interested persons or any of its officers. For the period ended May 31, 2023, the aggregate compensation paid by the Fund to the independent trustees was $82,358. The Fund did not pay any special compensation to any of its trustees or officers. The Fund continuously monitors standard industry practices and this policy is subject to change.
Cautionary Note Regarding Forward-Looking Statements
This report contains “forward-looking statements” as defined under the U.S. federal securities laws. Generally, the words “believe,” “expect,” “intend,” “estimate,” “anticipate,” “project,” “will” and similar expressions identify forward-looking statements, which generally are not historical in nature. Forward-looking statements are subject to certain risks and uncertainties that could cause actual results to materially differ from the Fund’s historical experience and its present expectations or projections indicated in any forward-looking statements. These risks include, but are not limited to, changes in economic and political conditions; regulatory and legal changes; energy industry risk; leverage risk; valuation risk; interest rate risk; tax risk; and other risks discussed in the Fund’s filings with the SEC. You should not place undue reliance on forward-looking statements, which speak only as of the date they are made. The Fund undertakes no obligation to update or revise any forward- looking statements made herein. There is no assurance that the Fund’s investment objective will be attained.
Proxy Voting Policies
A description of the policies and procedures that the Fund uses to determine how to vote proxies relating to portfolio securities owned by the Fund and information regarding how the Fund voted proxies relating to the portfolio of securities during the 12-month period ended June 30 are available to shareholders without charge, upon request by calling the Fund toll-free at (800) 236-4424 and on the Fund’s website at www.cushingcef. com. Information regarding how the Fund voted proxies are also available to stockholders without charge on the SEC’s website at www.sec.gov.
Form N-PORT
The Fund files its complete schedule of portfolio holdings for each month of each fiscal year with the SEC on Form N-PORT. The Fund’s Form N-PORT for the third month of each Fund’s fiscal quarter and statement of additional information are available without charge by visiting the SEC’s website at www.sec.gov. In addition, you may review and copy the Fund’s Form N-PORT at the SEC’s Public Reference Room in Washington D.C. You may obtain information on the operation of the Public Reference Room by calling (800) SEC-0330.
Portfolio Turnover
The portfolio turnover rate for the period ended May 31, 2023 was 94.82%. Portfolio turnover may vary greatly from period to period. The Fund does not consider portfolio turnover rate a limiting factor in the Adviser’s execution of investment decisions, and the Fund may utilize investment and trading strategies that may involve high portfolio turnover. A higher portfolio turnover rate results in correspondingly greater brokerage commissions and other transactional expenses that are borne by the Fund.
Certifications
The Fund’s Chief Executive Officer has submitted to the New York Stock Exchange the annual CEO certification as required by Section 303A.12(a) of the NYSE Listed Fund Manual.
The Fund has filed with the SEC the certification of its Chief Executive Officer and Chief Financial Officer required by Section 302 of the Sarbanes-Oxley Act.
26
Distribution and Dividend Reinvestment Plan
How the Plan Works
Unless the registered owner of common shares elects to receive cash by contacting the Plan Agent, all distributions and dividends (collectively referred to in this section as “dividends”) declared for your common shares of the Fund will be automatically reinvested by U.S. Bancorp Fund Services, LLC, d/b/a U.S. Bancorp Global Fund Services (the “Plan Agent”), agent for stockholders in administering the Fund’s Dividend Reinvestment Plan (the “Plan”), in additional common shares of the Fund. The Plan Agent will open an account for each common stockholder under the Plan in the same name in which such common stockholder’s common shares are registered. Whenever the Fund declares a dividend payable in cash, non-participants in the Plan will receive cash and participants in the Plan will receive the equivalent in common shares. The common shares will be acquired by the Plan Agent for the participants’ accounts, depending upon the circumstances described below, either (i) through receipt of additional unissued but authorized common shares from the Fund (“newly-issued common shares”) or (ii) by purchase of outstanding common shares on the open market (“open-market purchases”) on the New York Stock Exchange or elsewhere.
If, on the payment date for any dividend, the market price per common share plus per share fees (which include any brokerage commissions the Plan Agent is required to pay) is greater than the net asset value per common share, the Plan Agent will invest the dividend amount in newly issued common shares, including fractions, on behalf of the participants. The number of newly issued common shares to be credited to each participant’s account will be determined by dividing the dollar amount of the dividend by the net asset value per common share on the payment date; provided that, if the net asset value per common share is less than 95% of the market price per common share on the payment date, the dollar amount of the dividend will be divided by 95% of the market price per common share on the payment date. If, on the payment date for any dividend, the net asset value per common share is greater than the market value per common share plus per share fees, the Plan Agent will invest the dividend amount in common shares acquired on behalf of the participants in open-market purchases.
Participation in the Plan
If a registered owner of common shares elects not to participate in the Plan, you will receive all dividends in cash paid by check mailed directly to you (or, if the shares are held in street or other nominee name, then to such nominee) by the Plan Agent, as dividend disbursing agent. You may elect not to participate in the Plan and to receive all dividends in cash by sending written or telephonic instructions to the Plan Agent, as dividend paying agent. Participation in the Plan is completely voluntary and may be terminated or resumed at any time without penalty by contacting the Plan Agent before the dividend record date; otherwise, such termination or resumption will be effective with respect to any subsequently declared dividend or other distribution. Some brokers may automatically elect to receive cash on your behalf and may reinvest that cash in additional common shares of the Fund for you.
Plan Fees
There will be no per share fees with respect to common shares issued directly by the Fund. However, each participant will pay a pro rata share of brokerage commissions incurred in connection with open-market purchases. There is no direct service charge to participants in the Plan; however, the Fund reserves the right to amend the Plan to include a service charge payable by the participants.
Tax Implications
The automatic reinvestment of dividends will not relieve participants of any federal, state or local income tax that may be payable (or required to be withheld) on such dividends. Accordingly, any taxable dividend received by a participant that is reinvested in additional common shares will be subject to federal (and possibly state and local) income tax even though such participant will not receive a corresponding amount of cash with which to pay such taxes.
27
Contact Information
For more information about the plan, you may contact the Plan Agent in writing at PO Box 708, Milwaukee, WI 53201-0701, by calling the Plan Agent at 1-800-662-7232.
Privacy Policy
In order to conduct its business, the Fund collects and maintains certain nonpublic personal information about its stockholders of record with respect to their transactions in shares of the Fund’s securities. This information includes the stockholder’s address, tax identification or Social Security number, share balances, and dividend elections. We do not collect or maintain personal information about stockholders whose share balances of our securities are held in “street name” by a financial institution such as a bank or broker.
We do not disclose any nonpublic personal information about you, the Fund’s other stockholders or the Fund’s former stockholders to third parties unless necessary to process a transaction, service an account, or as otherwise permitted by law.
To protect your personal information internally, we restrict access to nonpublic personal information about the Fund’s stockholders to those employees who need to know that information to provide services to our stockholders. We also maintain certain other safeguards to protect your nonpublic personal information.
Other Information for Stockholders
Notice is hereby given in accordance with Section 23(c) of the Investment Company Act of 1940, as amended, that the Fund from time to time may purchase its common shares of beneficial interest in the open market.
This report is sent to stockholders of NXG NextGen Infrastructure Income Fund for their information. It is not a prospectus, circular or representation intended for use in the purchase or sale of shares of the Fund or of any securities mentioned in this report.
The Fund does not make available copies of its Statement of Additional Information because the Fund’s shares are not continuously offered, which means that the Statement of Additional Information has not been updated after completion of the Fund’s prior offerings and the information contained in such Statement of Additional Information may have become outdated.
The Fund makes available performance and certain other on its website at www.cushingcef.com. Investors and others are advised to periodically check the website for updated performance information and the release of other material information about the Fund. This reference to the Fund’s website is intended to allow investors public access to information regarding the Fund and does not, and is not intended to, incorporate the Fund’s website in this report.
Annual Shareholder Meeting Results
The annual meeting of shareholders of the Fund was held on May 23, 2023. The matters considered at the meeting, along with the vote tabulations relating to such matters were as follows:
To elect Mr. Brian R. Bruce and Mr. Ronald P. Trout as Class I Trustees of the Fund to hold office for a two-year term expiring at the Fund’s 2025 annual meeting, or until a successor is elected and duly qualified.
| |
For |
Withheld |
Brian R. Bruce |
1,763,567 |
307,812 |
Ronald P. Trout |
1,762,631 |
308,748 |
28
NXG NextGen Infrastructure Income Fund
Board Approval of Investment Management Agreement (Unaudited)
May 31, 2023 |
On May 23, 2023, the Board of Trustees (the “Board,” members of which are referred to collectively as the “Trustees”) of the NXG NextGen Infrastructure Income Fund (the “Fund”) met in person to discuss, among other things, the approval of the Investment Management Agreement (the “Agreement”) between Cushing® Asset Management, LP d/b/a NXG Investment Management (the “Adviser”) and the Fund.
Activities and Composition of the Board
The Board is comprised of four Trustees, three of whom are not “interested persons,” as such term is defined in the Investment Company Act of 1940, as amended (the “1940 Act”) (the “Independent Trustees”). The Trustees are responsible for oversight of the operations of the Fund and perform the various duties imposed by the 1940 Act on the trustees of investment companies. The Independent Trustees have retained independent legal counsel to assist them in connection with their duties. Prior to its consideration of the Agreement, the Trustees received and reviewed information provided by the Adviser. The Trustees also received and reviewed information responsive to requests from independent counsel to assist it in its consideration of the Agreement. Before the Trustees voted on the approval of the Agreement, the Independent Trustees met with independent legal counsel during executive session and discussed the Agreement and related information.
Consideration of Nature, Extent and Quality of the Services
The Board received and considered information regarding the nature, extent and quality of services provided to the Fund under the Agreement, including the Adviser’s Form ADV and other background materials supplied by the Adviser.
The Board reviewed and considered the Adviser’s investment advisory personnel, its history, and the amount of assets currently under management by the Adviser. The Board also reviewed the research and decision-making processes used by the Adviser, including the methods adopted to seek to achieve compliance with the investment objectives, strategies, policies, and restrictions of the Fund.
The Board considered the background and experience of the Adviser’s management in connection with the Fund, including reviewing the qualifications, backgrounds and responsibilities of the management team members primarily responsible for the day-to-day portfolio management of the Fund and the extent of the resources devoted to research and analysis of the Fund’s actual and potential investments.
The Board also reviewed certain of the Adviser’s policies and procedures, including the Adviser’s Code of Ethics.
The Board determined that the nature, extent and quality of services to be rendered by the Adviser under the Agreement were adequate.
Consideration of Advisory Fees and the Cost of the Services
The Board considered the information they received comparing the Fund’s contractual annual advisory fee and overall expenses, to the extent available, with a peer group of competitor closed-end funds determined by FUSE Research Network LLC (“FUSE”). The Board discussed the funds contained in the peer groups and universes and the general methodology used by FUSE in preparing its report. The Board further determined that because the Fund’s advisory fee waiver is a direct reduction of the advisory fee payable by the Fund and not sensitive to other fund operating expenses, the Board would use the Fund’s contractual advisory fee net of its contractual advisory fee waiver for the purposes of evaluating advisory fees and related costs of the services rendered to the Fund.
29
The Board determined that the Fund’s peer group was small, consisting of only eight funds (including the Fund), and that the Fund’s total net expense ratio of 1.94% was in the second most expensive quartile with respect to its peer group, while its contractual advisory fee of 1.25%, as reduced to 1.00% to account for the 0.25% contractual advisory fee waiver, was in the least expensive quartile for its peer group.
Consideration of Investment Performance
The Board noted that it regularly reviews the performance of the Fund throughout the year. The Board reviewed performance information provided by FUSE for periods ending February 28, 2023, comparing the performance of the Fund against its peer group over several time horizons, and using different performance metrics, including but not limited to the comparative performance of the Fund in terms of net asset value (NAV) and market price.
the Trustees noted that the Fund’s peer group was small, consisting of only eight funds (including the Fund) for the one-year period, six funds (including the Fund) for the three-year period, and five funds (including the Fund) for the five-year and ten-year periods. The Trustees determined that, among the funds in the peer group, the Fund’s performance based on NAV was in the second highest performing quartile for the one-year and three-year periods, and equal to the peer group median for the five-year and ten-year periods, and based on market price the Fund was in the second lowest performing quartile over the one-year, three-year, and five-year periods, and equal to the peer group median for the ten-year period.
Consideration of Comparable Accounts
The Board reviewed the other accounts and investment vehicles managed by the Adviser and discussed the similarities and differences between these accounts and the Fund.
The Board determined that, bearing in mind the limitations of comparing different types of managed accounts and the different levels of service typically associated with such accounts, the fee structures applicable to the Adviser’s other clients employing a comparable strategy to the Fund was not indicative of any unreasonableness with respect to the advisory fees proposed to be payable by the Fund.
Consideration of Profitability
The Board received and considered a profitability analysis prepared by the Adviser, using a template developed in consultation with counsel to the Independent Trustees, that set forth the fees payable by the Fund under the Agreement and the expenses incurred by the Adviser in connection with the operation of the Fund. The Board used this analysis to evaluate the fairness of the profits realized and anticipated to be realized by the Adviser with respect to the Fund.
The Board separately considered the profitability of the Adviser with respect to the Fund. The Board noted that the Fund was profitable to the Adviser, both before and after distribution expenses. The Board determined that, with respect to the Fund, the profit to the Adviser was not unreasonable.
Consideration of Economies of Scale
The Board considered whether economies of scale in the provision of services to the Fund had been or would be passed along to the shareholders under the Agreement. The Board determined there were no material economies of scale accruing to the Adviser in connection with its relationship with the Fund.
Consideration of Other Benefits
The Board reviewed and considered any other incidental benefits derived or to be derived by the Adviser from its relationship with the Fund, including but not limited to soft dollar arrangements. The Board determined there were no material incidental benefits accruing to the Adviser in connection with its relationship with the Fund.
30
Conclusion
In approving the Agreement and the fees charged under the Agreement, the Board concluded that no single factor reviewed by the Board was identified by the Board to be determinative as the principal factor in whether to approve the Agreement. The summary set out above describes the most important factors, but not all matters, considered by the Board in coming to its decision regarding the Agreement. On the basis of such information as the Board considered necessary to the exercise of its reasonable business judgment and its evaluation of all of the factors described above, and after much discussion, the Board concluded that each factor they considered, in the context of all of the other factors they considered, favored approval of the Agreement. It was noted that it was the judgment of the Board that approval of the Agreement was consistent with the best interests of the Fund and its shareholders.
31
NXG NextGen Infrastructure Income Fund |
TRUSTEES
Brian R. Bruce
Andrea N. Mullins
Ronald P. Trout
John H. Alban |
EXECUTIVE OFFICERS
Mark Rhodes
Chief Executive Officer and President
Blake R. Nelson
Chief Financial Officer, Treasurer and Secretary
Mathew J. Calabro
Chief Compliance Officer |
INVESTMENT ADVISER
Cushing® Asset Management, LP
d/b/a NXG Investment Management
600 N. Pearl Street, Suite 1205
Dallas, TX 75201 |
ADMINISTRATOR
U.S. Bancorp Fund Services, LLC,
d/b/a U.S. Bancorp Global Fund Services
615 East Michigan Street, 3rd Floor
Milwaukee, WI 53202 |
CUSTODIAN
U.S. Bank, N.A.
1555 N. River Center Drive, Suite 302
Milwaukee, WI 53212 |
TRANSFER AGENT
U.S. Bancorp Fund Services, LLC,
d/b/a U.S. Bancorp Global Fund Services
615 East Michigan Street, 3rd Floor
Milwaukee, WI 53202 |
LEGAL COUNSEL
Skadden, Arps, Slate, Meagher & Flom LLP
155 North Wacker Drive
Chicago, IL 60606 |
INDEPENDENT REGISTERED PUBLIC ACCOUNTING FIRM
Ernst & Young LLP
2323 Victory Avenue, Suite 2000
Dallas, TX 75219 |
NOT FDIC INSURED | NOT BANK GUARANTEED | MAY LOSE VALUE

Item 2. Code of Ethics.
Not applicable for semi-annual reports.
Item 3. Audit Committee Financial Expert.
Not applicable for semi-annual reports.
Item 4. Principal Accountant Fees and Services.
Not applicable for semi-annual reports.
Item 5. Audit Committee of Listed Registrants.
Not applicable for semi-annual reports.
Item 6. Investments.
| (a) | Schedule of Investments is included as part of the report to shareholders filed under Item 1 of this Form. |
Item 7. Disclosure of Proxy Voting Policies and
Procedures for Closed-End Management Investment Companies.
Not applicable for semi-annual reports.
Item 8. Portfolio Managers of Closed-End Management Investment Companies.
Not applicable for semi-annual reports.
Item 9. Purchases of Equity Securities by Closed-End
Management Investment Company and Affiliated Purchasers.
| Period |
(a)
Total Number of Shares (or Units) Purchased |
(b)
Average Price Paid per Share (or Unit) |
(c)
Total Number of Shares (or Units) Purchased as Part of Publicly Announced Plans or Programs |
(d)
Maximum Number (or Approximate Dollar Value) of Shares (or Units) that May Yet Be Purchased Under the Plans or Programs |
| Month #1 12/01/22-12/31/22 |
0 |
0 |
0 |
0 |
| Month #2 01/01/23-01/31/23 |
0 |
0 |
0 |
0 |
| Month #3 02/01/23-02/28/23 |
0 |
0 |
0 |
0 |
| Month #4 03/01/23-03/31/23 |
0 |
0 |
0 |
0 |
| Month #5 04/01/23-04/30/23 |
0 |
0 |
0 |
0 |
| Month #6 05/01/23-05/31/23 |
0 |
0 |
0 |
0 |
| Total |
0 |
0 |
0 |
0 |
Item 10. Submission of Matters to a Vote of Security Holders.
Not applicable.
Item 11. Controls and Procedures.
| (a) | The Registrant’s President/Principal Executive Officer and Principal Financial Officer have reviewed the Registrant's disclosure
controls and procedures (as defined in Rule 30a-3(c) under the Investment Company Act of 1940 (the “Act”)) as of a date
within 90 days of the filing of this report, as required by Rule 30a-3(b) under the Act and Rules 13a-15(b) or 15d-15(b) under
the Securities Exchange Act of 1934. Based on their review, such officers have concluded that the disclosure controls and procedures are
effective in ensuring that information required to be disclosed in this report is appropriately recorded, processed, summarized and reported
and made known to them by others within the Registrant and by the Registrant’s service provider. |
| (b) | There were no changes in the Registrant's internal control over financial reporting (as defined in Rule 30a-3(d) under the Act) that
occurred during the period covered by this report that have materially affected, or are reasonably likely to materially affect, the Registrant's
internal control over financial reporting. |
Item 12. Disclosure of Securities Lending Activities for Closed-End
Management Investment Companies
The registrant did not engage in securities lending activities during the
fiscal period reported on this Form N-CSR.
Item 13. Exhibits.
| (a) | (1) Any code of ethics or amendment thereto, that is the subject of the disclosure required by Item 2, to the extent that
the registrant intends to satisfy Item 2 requirements through filing an exhibit. Not applicable. |
(2) A separate certification for each principal executive officer and principal financial officer pursuant to Section 302 of the Sarbanes-Oxley Act of 2002. Filed herewith.
(3) Any written solicitation to purchase securities under
Rule 23c-1 under the Act sent or given during the period covered by the report by or on behalf of the registrant to 10 or more persons.
None.
| (4) | Change in the registrant’s independent public accountant. There was no change in the registrant’s independent public
accountant for the period covered by this report. |
SIGNATURES
Pursuant to the requirements of the Securities Exchange
Act of 1934 and the Investment Company Act of 1940, the registrant has duly caused this report to be signed on its behalf by the undersigned,
thereunto duly authorized.
| (Registrant) |
NXG NextGen Infrastructure Income Fund
|
|
| |
|
|
| By (Signature and Title)* |
/s/ Mark Rhodes |
|
| |
Mark Rhodes, President & Chief Executive
Officer |
|
| |
|
|
| Date |
8/4/23 |
|
Pursuant to the requirements of the Securities Exchange
Act of 1934 and the Investment Company Act of 1940, this report has been signed below by the following persons on behalf of the registrant
and in the capacities and on the dates indicated.
| By (Signature and Title)* |
/s/ Mark Rhodes |
|
| |
Mark Rhodes, President & Chief Executive
Officer |
|
| |
|
|
| Date |
8/4/23 |
|
| By (Signature and Title)* |
/s/ Blake R. Nelson |
|
| |
Blake R. Nelson, Chief Financial Officer, Treasurer
and Secretary
|
|
| |
|
|
| Date |
8/4/23 |
|
EX.99.CERT
CERTIFICATIONS
I, Mark Rhodes, certify that:
| 1. | I have reviewed this report on Form N-CSR of NXG NextGen Infrastructure Income Fund; |
| 2. | Based on my knowledge, this report does not contain any untrue statement of a material fact or omit to state a material fact necessary
to make the statements made, in light of the circumstances under which such statements were made, not misleading with respect to the period
covered by this report; |
| 3. | Based on my knowledge, the financial statements, and other financial information included in this report, fairly present in all material
respects the financial condition, results of operations, changes in net assets, and cash flows (if the financial statements are required
to include a statement of cash flows) of the registrant as of, and for, the periods presented in this report; |
| 4. | The registrant’s other certifying officer(s) and I are responsible for establishing and maintaining disclosure controls and
procedures (as defined in Rule 30a-3(c) under the Investment Company Act of 1940) and internal control over financial reporting (as defined
in Rule 30a-3(d) under the Investment Company Act of 1940) for the registrant and have: |
| (a) | Designed such disclosure controls and procedures, or caused such disclosure controls and procedures to be designed under our supervision,
to ensure that material information relating to the registrant, including its consolidated subsidiaries, is made known to us by others
within those entities, particularly during the period in which this report is being prepared; |
| (b) | Designed such internal control over financial reporting, or caused such internal control over financial reporting to be designed under
our supervision, to provide reasonable assurance regarding the reliability of financial reporting and the preparation of financial statements
for external purposes in accordance with generally accepted accounting principles; |
| (c) | Evaluated the effectiveness of the registrant's disclosure controls and procedures and presented in this report our conclusions about
the effectiveness of the disclosure controls and procedures, as of a date within 90 days prior to the filing date of this report based
on such evaluation; and |
| (d) | Disclosed in this report any change in the registrant’s internal control over financial reporting that occurred during the period covered by this report that has materially affected, or is reasonably likely to materially affect, the registrant’s
internal control over financial reporting; and |
| 5. | The registrant’s other certifying officer(s) and I have disclosed to the registrant’s auditors and the audit committee
of the registrant’s board of directors (or persons performing the equivalent functions): |
| (a) | All significant deficiencies and material weaknesses in the design or operation of internal control over financial reporting which
are reasonably likely to adversely affect the registrant’s ability to record, process, summarize, and report financial information;
and |
| (b) | Any fraud, whether or not material, that involves management or other employees who have a significant role in the registrant’s
internal control over financial reporting. |
| Date: |
8/4/23 |
|
/s/ Mark Rhodes |
|
| |
|
|
Mark Rhodes |
|
| |
|
|
President & Chief Executive Officer |
|
EX.99.CERT
CERTIFICATIONS
I, Blake R. Nelson, certify that:
| 1. | I have reviewed this report on Form N-CSR of NXG NextGen Infrastructure Income Fund; |
| 2. | Based on my knowledge, this report does not contain any untrue statement of a material fact or omit to state a material fact necessary
to make the statements made, in light of the circumstances under which such statements were made, not misleading with respect to the period
covered by this report; |
| 3. | Based on my knowledge, the financial statements, and other financial information included in this report, fairly present in all material
respects the financial condition, results of operations, changes in net assets, and cash flows (if the financial statements are required
to include a statement of cash flows) of the registrant as of, and for, the periods presented in this report; |
| 4. | The registrant’s other certifying officer(s) and I are responsible for establishing and maintaining disclosure controls and
procedures (as defined in Rule 30a-3(c) under the Investment Company Act of 1940) and internal control over financial reporting (as defined
in Rule 30a-3(d) under the Investment Company Act of 1940) for the registrant and have: |
| (a) | Designed such disclosure controls and procedures, or caused such disclosure controls and procedures to be designed under our supervision,
to ensure that material information relating to the registrant, including its consolidated subsidiaries, is made known to us by others
within those entities, particularly during the period in which this report is being prepared; |
| (b) | Designed such internal control over financial reporting, or caused such internal control over financial reporting to be designed under
our supervision, to provide reasonable assurance regarding the reliability of financial reporting and the preparation of financial statements
for external purposes in accordance with generally accepted accounting principles; |
| (c) | Evaluated the effectiveness of the registrant’s disclosure controls and procedures and presented in this report our conclusions
about the effectiveness of the disclosure controls and procedures, as of a date within 90 days prior to the filing date of this report
based on such evaluation; and |
| (d) | Disclosed in this report any change in the registrant’s internal control over financial reporting that occurred during the period covered by this report that has materially affected, or is reasonably likely to materially affect, the registrant’s
internal control over financial reporting; and |
| 5. | The registrant’s other certifying officer(s) and I have disclosed to the registrant’s auditors and the audit committee
of the registrant’s board of directors (or persons performing the equivalent functions): |
| (a) | All significant deficiencies and material weaknesses in the design or operation of internal control over financial reporting which
are reasonably likely to adversely affect the registrant’s ability to record, process, summarize, and report financial information;
and |
| (b) | Any fraud, whether or not material, that involves management or other employees who have a significant role in the registrant’s
internal control over financial reporting. |
| Date: |
8/4/23 |
|
/s/ Blake R. Nelson |
|
| |
|
|
Blake R. Nelson |
|
| |
|
|
Chief Financial Officer, Treasurer and Secretary |
|
Certification Pursuant to Section 906 of the
Sarbanes-Oxley Act
Pursuant to Section 906 of the Sarbanes-Oxley Act
of 2002, each of the undersigned officers of the NXG NextGen Infrastructure Income Fund, does hereby certify, to such
officer’s knowledge, that the report on Form N-CSR of the NXG NextGen Infrastructure Income Fund for the period ended
May 31, 2023 fully complies with the requirements of Section 13(a) or 15(d) of the Securities Exchange Act of 1934, as
applicable, and that the information contained in the Form N-CSR fairly presents, in all material respects, the financial condition
and results of operations of the NXG NextGen Infrastructure Income Fund for the stated period.
| /s/ Mark Rhodes |
|
/s/ Blake R. Nelson |
|
| Mark Rhodes |
|
Blake R. Nelson |
|
| President & Chief Executive Officer |
|
Chief Financial Officer, Treasurer and Secretary |
|
This statement accompanies this report on Form N-CSR pursuant to Section
906 of the Sarbanes-Oxley Act of 2002 and shall not be deemed as filed by NXG NextGen Infrastructure Income Fund for purposes of Section
18 of the Securities Exchange Act of 1934.
NXG NextGen Infrastructu... (NYSE:NXG)
과거 데이터 주식 차트
부터 4월(4) 2024 으로 5월(5) 2024

NXG NextGen Infrastructu... (NYSE:NXG)
과거 데이터 주식 차트
부터 5월(5) 2023 으로 5월(5) 2024
