MEDICAL PROPERTIES TRUST INC false 0001287865 0001287865 2023-08-08 2023-08-08


UNITED STATES

SECURITIES AND EXCHANGE COMMISSION

WASHINGTON, D.C. 20549


FORM 8-K


CURRENT REPORT

PURSUANT TO SECTION 13 OR 15(d)

OF THE SECURITIES EXCHANGE ACT OF 1934

Date of report (Date of earliest event reported): August 8, 2023


MEDICAL PROPERTIES TRUST, INC.

(Exact Name of Registrant as Specified in Charter)


Commission File Number 001-32559


Maryland   20-0191742

(State or other jurisdiction of

incorporation or organization)


(I.R.S. Employer

Identification No.)


1000 Urban Center Drive, Suite 501

Birmingham, AL

  35242
(Address of principal executive offices)   (Zip Code)

Registrant’s telephone number, including area code

(205) 969-3755


Check the appropriate box below if the Form 8-K filing is intended to simultaneously satisfy the filing obligation of the Registrant under any of the following provisions:


Written communications pursuant to Rule 425 under the Securities Act (17 CFR 230.425)


Soliciting material pursuant to Rule 14a-12 under the Exchange Act (17 CFR 240.14a-12)


Pre-commencement communications pursuant to Rule 14d-2(b) under the Exchange Act (17 CFR 240.14d-2(b))


Pre-commencement communications pursuant to Rule 13e-4(c) under the Exchange Act (17 CFR 240.13e-4(c))

Securities registered pursuant to Section 12(b) of the Act:


Title of each class


Trading

Symbol


Name of each exchange

on which registered

Common Stock, par value $0.001 per share, of Medical Properties Trust, Inc.   MPW   The New York Stock Exchange

Indicate by check mark whether the registrant is an emerging growth company as defined in Rule 405 of the Securities Act of 1933 (§230.405 of this chapter) or Rule 12b-2 of the Securities Exchange Act of 1934 (§240.12b-2 of this chapter).

Emerging growth company  

If an emerging growth company, indicate by check mark if the registrant has elected not to use the extended transition period for complying with any new or revised financial accounting standards provided pursuant to Section 13(a) of the Exchange Act.  ☐


Item 2.02.

Results of Operations and Financial Condition.

On August 8, 2023, Medical Properties Trust, Inc. issued a press release announcing its financial results for the three and six months ended June 30, 2023. A copy of the press release is attached as Exhibit 99.1 to this Current Report on Form 8-K and is incorporated herein by reference. The information in this Current Report on Form 8-K, including the information set forth in Exhibit 99.1 and Exhibit 99.2 attached hereto, shall not be deemed “filed” for purposes of Section 18 of the Securities Exchange Act of 1934, as amended, or otherwise subject to the liability of that section or Sections 11 and 12(a)(2) of the Securities Act of 1933, as amended. In addition, this information shall not be deemed incorporated by reference in any filing of Medical Properties Trust, Inc. with the Securities and Exchange Commission, except as expressly set forth by specific reference in any such filing.


Item 9.01.

Financial Statements and Exhibits.

(d) Exhibits.


Exhibit
Number


Description

99.1    Press release dated August 8, 2023 reporting financial results for the three and six months ended June 30, 2023
99.2    Medical Properties Trust, Inc. 2nd Quarter 2023 Supplemental Information
104    Cover Page Interactive Data File (embedded within the Inline XBRL document)


2


SIGNATURES

Pursuant to the requirements of the Securities Exchange Act of 1934, as amended, the registrant has duly caused this report to be signed on its behalf by the undersigned hereunder duly authorized.


MEDICAL PROPERTIES TRUST, INC.
By:  

/s/ R. Steven Hamner

Name:   R. Steven Hamner
Title:   Executive Vice President and Chief Financial Officer

Date: August 8, 2023


3

Exhibit 99.1


LOGO

Contact: Drew Babin, CFA, CMA

Senior Managing Director of Corporate Communications

Medical Properties Trust, Inc.

(646) 884-9809

dbabin@medicalpropertiestrust.com

MEDICAL PROPERTIES TRUST, INC. REPORTS SECOND QUARTER RESULTS

Per Share Net Loss of ($0.07) and Normalized FFO of $0.48 in Second Quarter

Birmingham, AL – August 8, 2023 – Medical Properties Trust, Inc. (the “Company” or “MPT”) (NYSE: MPW) today announced financial and operating results for the second quarter ended June 30, 2023, as well as certain events occurring subsequent to quarter end.


Net loss of ($0.07) and Normalized Funds from Operations (“NFFO”) of $0.48 for the 2023 second quarter on a per diluted share basis;


Commenced in May rent collections at a newly developed post-acute facility in California leased to Ernest Health at a total cost of approximately $50 million;


Sold in July three general acute hospitals in Kansas and Texas to Prime Healthcare for roughly $100 million;


Elected to participate in August as one of seven unrelated initial lenders in Steward Health Care System’s (“Steward”) syndicated asset-backed credit facility; and


Established a REIT structure within the United Kingdom, reducing future expected income tax expense and expanding strategic flexibility.

Included in the financial tables accompanying this press release is information about the Company’s assets and liabilities, net income, and reconciliations of net income to NFFO and AFFO, including per share amounts, all on a basis comparable to 2022 results.

PORTFOLIO UPDATE

During the third quarter, Steward refinanced its asset-backed credit facility five months ahead of the maturity of its previous agreement. The new facility carries a four-year term and provides significant incremental liquidity to Steward. The leaders of the lending group, experienced private credit funds Sound Point Capital Management and Brigade Capital Management, offered MPT the opportunity to participate. After careful consideration of the terms, pricing and security in the form of government and commercial receivables, MPT elected to invest up to $140 million, an amount not to exceed 25% of the fully syndicated facility.

In early August, one of Pipeline Health System’s (“Pipeline”) Los Angeles-area safety net hospitals, Coast Plaza Hospital, announced the opening of a specialized inpatient behavioral health unit to fill a critical need in underserved communities. The expansion, which MPT agreed to fund last year, was completed ahead of schedule and is expected to be profitable for Pipeline and supportive of the related increase in rental payments to MPT.


1


The Company has total assets of approximately $19.2 billion, including $12.5 billion of general acute facilities, $2.6 billion of behavioral health facilities and $1.7 billion of post-acute facilities. MPT’s portfolio includes 444 properties and approximately 44,000 licensed beds across the United States as well as in the United Kingdom, Switzerland, Germany, Australia, Spain, Finland, Colombia, Italy and Portugal. The properties are leased to or mortgaged by 55 hospital operating companies.

OPERATING RESULTS AND OUTLOOK

Net loss for the second quarter ended June 30, 2023 was ($42 million) (($0.07) per diluted share) compared to net income of $190 million ($0.32 per diluted share) in the year earlier period. Included in 2023 second quarter net loss is the previously disclosed roughly $286 million in accelerated lease intangible amortization related to the early termination of Steward’s leases of five Utah hospitals now leased to CommonSpirit and a related $95 million straight-line rent write-off, partially offset by a roughly $160 million tax benefit related to the Company’s establishment of a U.K REIT, as well as the recognition of $68 million of 2023 previously unrecorded but contractually owed rent and interest revenue from the receipt of equity in PHP Holdings LLC (“PHP”).

NFFO for the second quarter ended June 30, 2023 was $285 million ($0.48 per diluted share) compared to $275 million ($0.46 per diluted share) in the year earlier period. Included in 2023 second quarter NFFO is roughly $68 million ($0.11 per diluted share) from the receipt of equity in PHP in lieu of cash for 2023 previously unrecorded but contractually owed rent and interest revenue from Prospect Medical Holdings, Inc. (“Prospect”). In accordance with accounting requirements, the value of MPT’s investment in PHP was established at roughly $655 million based on estimates from multiple independent third parties and the application of an appropriate marketability discount.

The Company is narrowing its 2023 calendar estimate of per share net income to $0.33 to $0.37 to account for second quarter results and is also narrowing its estimate of per share NFFO to $1.53 to $1.57. The ranges include Prospect-related income from the expected resumption of partial California rental payments, recognition of the PHP equity value received in the second quarter and other amounts. The estimates are based on an existing portfolio which includes the impact of binding disposition and leasing transactions and excludes expected future contributions from development and other capital projects.

These estimates do not include the effects, among others, of unexpected real estate operating costs, modifications to lease terms, changes in accounting pronouncements, litigation costs, debt refinancing costs, acquisition costs, currency exchange rate movements, changes in income tax rates, interest rate hedging activities, write-offs of straight-line rent and in place lease intangibles, other impairments or other non-recurring/unplanned transactions. These estimates may change if the Company acquires or sells assets in amounts that are different from estimates, market interest rates change, debt is refinanced or repurchased, new shares are issued or repurchased, additional debt is incurred, other operating expenses vary, income from equity investments vary from expectations, or existing leases or loans do not perform in accordance with their terms.

CONFERENCE CALL AND WEBCAST

The Company has scheduled a conference call and webcast for Tuesday, August 8, 2023 at 11:00 a.m. Eastern Time to present the Company’s financial and operating results for the quarter ended June 30, 2023. The dial-in numbers for the conference call are 844-481-2836 (U.S.) and 412-317-1856 (International); there is no passcode requirement. Call participants are to ask the operator to be joined to the Medical Properties Trust, Inc. conference call upon dialing in. The conference call will also be available via webcast in the Investor Relations section of the Company’s website, www.medicalpropertiestrust.com.


2


A telephone and webcast replay of the call will be available beginning shortly after the call’s completion. The telephone replay will be available through August 22, 2023 using dial-in numbers 877-344-7529 (U.S.), 855-669-9658 (Canada) and 412-317-0088 (International) along with passcode 3185290. The webcast replay will be available for one year following the call’s completion on the Investor Relations section of the Company’s website.

The Company’s supplemental information package for the current period will also be available on the Company’s website in the Investor Relations section.

The Company uses, and intends to continue to use, the Investor Relations page of its website, which can be found at www.medicalpropertiestrust.com, as a means of disclosing material nonpublic information and of complying with its disclosure obligations under Regulation FD, including, without limitation, through the posting of investor presentations that may include material nonpublic information. Accordingly, investors should monitor the Investor Relations page, in addition to following our press releases, SEC filings, public conference calls, presentations and webcasts. The information contained on, or that may be accessed through, our website is not incorporated by reference into, and is not a part of, this document.

About Medical Properties Trust, Inc.

Medical Properties Trust, Inc. is a self-advised real estate investment trust formed in 2003 to acquire and develop net-leased hospital facilities. From its inception in Birmingham, Alabama, the Company has grown to become one of the world’s largest owners of hospital real estate with 444 facilities and approximately 44,000 licensed beds in ten countries and across four continents. MPT’s financing model facilitates acquisitions and recapitalizations and allows operators of hospitals to unlock the value of their real estate assets to fund facility improvements, technology upgrades and other investments in operations. For more information, please visit the Company’s website at www.medicalpropertiestrust.com.

This press release includes forward-looking statements within the meaning of Section 27A of the Securities Act of 1933, as amended, and Section 21E of the Securities Exchange Act of 1934, as amended. Forward-looking statements can generally be identified by the use of forward-looking words such as “may”, “will”, “would”, “could”, “expect”, “intend”, “plan”, “estimate”, “target”, “anticipate”, “believe”, “objectives”, “outlook”, “guidance” or other similar words, and include statements regarding our strategies, objectives, future expansion and development activities, and expected financial performance. Forward-looking statements involve known and unknown risks and uncertainties that may cause our actual results or future events to differ materially from those expressed in or underlying such forward-looking statements, including, but not limited to: (i) the economic, political and social impact of, and uncertainty relating to, potential impact from health crises (like COVID-19); (ii) the ability of our tenants, operators and borrowers to satisfy their obligations under their respective contractual arrangements with us, especially as a result of the adverse economic impact of the COVID-19 pandemic, and government regulation of hospitals and healthcare providers in connection with same (as further detailed in our Current Report on Form 8-K filed with the SEC on April 8, 2020); (iii) our expectations regarding annual guidance for net income and NFFO per share; (iv) our success in implementing our business strategy and our ability to identify, underwrite, finance, consummate and integrate acquisitions and investments; (v) the nature and extent of our current and future competition; (vi) macroeconomic conditions, such as a disruption of or lack of access to the capital markets or movements in currency exchange rates; (vii) our ability to obtain debt financing on attractive terms or at all, which may adversely impact our ability to pursue acquisition and development opportunities and pay down, refinance, restructure or extend our indebtedness as it becomes due; (viii) increases in our borrowing costs as a result of changes in interest


3


rates and other factors; (ix) international, national and local economic, real estate and other market conditions, which may negatively impact, among other things, the financial condition of our tenants, lenders and institutions that hold our cash balances, and may expose us to increased risks of default by these parties; (x) factors affecting the real estate industry generally or the healthcare real estate industry in particular; (xi) our ability to maintain our status as a REIT for federal and state income tax purposes; (xii) federal and state healthcare and other regulatory requirements, as well as those in the foreign jurisdictions where we own properties; (xiii) the value of our real estate assets, which may limit our ability to dispose of assets at attractive prices or obtain or maintain equity or debt financing secured by our properties or on an unsecured basis; (xiv) the ability of our tenants and operators to operate profitably and generate positive cash flow, comply with applicable laws, rules and regulations in the operation of our properties, to deliver high-quality services, to attract and retain qualified personnel and to attract patients; (xv) potential environmental contingencies and other liabilities; (xvi) the risk that the expected sale of three Connecticut hospitals currently leased to Prospect does not occur; (xvii) the risk that MPT’s expected sale of its remaining Australian portfolio does not occur; (xviii) the risk that MPT is unable to monetize its investment in PHP at full value within a reasonable time period or at all; (xix) the risk that other property sales, loan repayments, and other capital recycling transactions do not occur; and (xx) the risks and uncertainties of litigation.

The risks described above are not exhaustive and additional factors could adversely affect our business and financial performance, including the risk factors discussed under the section captioned “Risk Factors” in our Annual Report on Form 10-K for the year ended December 31, 2022 and as updated in our quarterly reports on Form 10-Q. Forward-looking statements are inherently uncertain and actual performance or outcomes may vary materially from any forward-looking statements and the assumptions on which those statements are based. Readers are cautioned to not place undue reliance on forward-looking statements as predictions of future events. We disclaim any responsibility to update such forward-looking statements, which speak only as of the date on which they were made.

# # #


4


MEDICAL PROPERTIES TRUST, INC. AND SUBSIDIARIES

Consolidated Balance Sheets


(Amounts in thousands, except for per share data)    June 30, 2023     December 31, 2022  
     (Unaudited)     (A)  

Assets


Real estate assets


Land, buildings and improvements, intangible lease assets, and other

   $ 13,133,651     $ 13,862,415  

Investment in financing leases

     1,231,652       1,691,323  

Real estate held for sale

     401,125       —    

Mortgage loans

     299,326       364,101  


Gross investment in real estate assets

     15,065,754       15,917,839  

Accumulated depreciation and amortization

     (1,251,165     (1,193,312


Net investment in real estate assets

     13,814,589       14,724,527  

Cash and cash equivalents

     324,050       235,668  

Interest and rent receivables, net

     177,643       167,035  

Straight-line rent receivables

     779,584       787,166  

Investments in unconsolidated real estate joint ventures

     1,487,118       1,497,903  

Investments in unconsolidated operating entities

     1,812,150       1,444,872  

Other loans

     199,360       227,839  

Other assets

     609,881       572,990  


Total Assets

   $ 19,204,375     $ 19,658,000  


Liabilities and Equity


Liabilities


Debt, net

   $ 10,237,558     $ 10,268,412  

Accounts payable and accrued expenses

     444,926       621,324  

Deferred revenue

     49,766       27,727  

Obligations to tenants and other lease liabilities

     157,411       146,130  


Total Liabilities

     10,889,661       11,063,593  

Equity


Preferred stock, $0.001 par value. Authorized 10,000 shares; no shares outstanding

     —         —    

Common stock, $0.001 par value. Authorized 750,000 shares; issued and outstanding - 598,344 shares at June 30, 2023 and 597,476 shares at December 31, 2022

     598       597  

Additional paid-in capital

     8,547,835       8,535,140  

Retained (deficit) earnings

     (241,301     116,285  

Accumulated other comprehensive income (loss)

     6,680       (59,184


Total Medical Properties Trust, Inc. Stockholders’ Equity

     8,313,812       8,592,838  

Non-controlling interests

     902       1,569  


Total Equity

     8,314,714       8,594,407  


Total Liabilities and Equity

   $ 19,204,375     $ 19,658,000  


(A)

Financials have been derived from the prior year audited financial statements.


MEDICAL PROPERTIES TRUST, INC. AND SUBSIDIARIES

Consolidated Statements of Income

(Unaudited)


(Amounts in thousands, except for per share data)    For the Three Months Ended     For the Six Months Ended  
     June 30, 2023     June 30, 2022     June 30, 2023     June 30, 2022  

Revenues


Rent billed

   $ 247,491     $ 241,209     $ 495,648     $ 504,611  

Straight-line rent

     (39,329     58,518       17,364       119,562  

Income from financing leases

     68,468       51,873       81,663       103,649  

Interest and other income

     60,765       48,626       92,931       82,204  


Total revenues

     337,395       400,226       687,606       810,026  

Expenses


Interest

     104,470       87,730       202,124       178,913  

Real estate depreciation and amortization

     364,403       84,334       448,263       169,650  

Property-related (A)

     24,676       21,135       31,786       29,733  

General and administrative

     35,604       38,858       77,328       80,282  


Total expenses

     529,153       232,057       759,501       458,578  

Other income (expense)


Gain on sale of real estate

     167       16,355       229       467,993  

Real estate and other impairment charges

     —         —         (89,538     (4,875

Earnings from equity interests

     12,224       14,785       23,576       22,123  

Debt refinancing and unutilized financing costs

     (816     (619     (816     (9,435

Other (including fair value adjustments on securities)

     (10,512     2,031       (15,678     16,793  


Total other income (expense)

     1,063       32,552       (82,227     492,599  


(Loss) income before income tax

     (190,695     200,721       (154,122     844,047  

Income tax benefit (expense)

     148,262       (10,657     144,719       (22,036


Net (loss) income

     (42,433     190,064       (9,403     822,011  

Net loss (income) attributable to non-controlling interests

     396       (467     160       (733


Net (loss) income attributable to MPT common stockholders

   $ (42,037   $ 189,597     $ (9,243   $ 821,278  


Earnings per common share - basic and diluted:


Net (loss) income attributable to MPT common stockholders

   $ (0.07   $ 0.32     $ (0.02   $ 1.37  


Weighted average shares outstanding - basic

     598,344       598,827       598,323       598,751  

Weighted average shares outstanding - diluted

     598,344       599,026       598,323       598,979  

Dividends declared per common share

   $ 0.29     $ 0.29     $ 0.58     $ 0.58  


(A)

Includes $21.1 million and $18.3 million of ground lease and other expenses (such as property taxes and insurance) paid directly by us and reimbursed by our tenants for the three months ended June 30, 2023 and 2022, respectively, and $25.3 million and $24.6 million for the six months ended June 30, 2023 and 2022, respectively.


MEDICAL PROPERTIES TRUST, INC. AND SUBSIDIARIES

Reconciliation of Net Income to Funds From Operations

(Unaudited)


(Amounts in thousands, except for per share data)    For the Three Months Ended     For the Six Months Ended  
     June 30, 2023     June 30, 2022     June 30, 2023     June 30, 2022  

FFO information:


Net (loss) income attributable to MPT common stockholders

   $ (42,037   $ 189,597     $ (9,243   $ 821,278  

Participating securities’ share in earnings

     (469     (345     (984     (747


Net (loss) income, less participating securities’ share in earnings

   $ (42,506   $ 189,252     $ (10,227   $ 820,531  

Depreciation and amortization

     382,244       101,976       484,204       201,435  

Gain on sale of real estate

     (167     (16,355     (229     (467,993

Real estate impairment charges

     —         —         52,104       —    


Funds from operations

   $ 339,571     $ 274,873     $ 525,852     $ 553,973  

Write-off (recovery) of unbilled rent and other

     95,642       1,943       135,268       (328

Other impairment charges

     —         —         —         4,875  

Litigation and other

     2,502       —         10,228       —    

Share-based compensation adjustments

     (4,363     (966     (4,363     (966

Non-cash fair value adjustments

     8,374       (943     4,253       (8,966

Tax rate changes and other

     (157,230     (825     (164,535     (825

Debt refinancing and unutilized financing costs

     816       619       816       9,435  


Normalized funds from operations

   $ 285,312     $ 274,701     $ 507,519     $ 557,198  

Share-based compensation

     10,800       11,075       22,629       22,879  

Debt costs amortization

     5,203       4,560       10,324       10,173  

Rent deferral, net

     2,380       (3,327     4,793       (7,043

Straight-line rent revenue from operating and finance leases

     (60,825     (74,757     (123,414     (152,090


Adjusted funds from operations

   $ 242,870     $ 212,252     $ 421,851     $ 431,117  


Per diluted share data:


Net (loss) income, less participating securities’ share in earnings

   $ (0.07   $ 0.32     $ (0.02   $ 1.37  

Depreciation and amortization

     0.64       0.17       0.81       0.33  

Gain on sale of real estate

     —         (0.03     —         (0.78

Real estate impairment charges

     —         —         0.09       —    


Funds from operations

   $ 0.57     $ 0.46     $ 0.88     $ 0.92  

Write-off (recovery) of unbilled rent and other

     0.16       —         0.23       —    

Other impairment charges

     —         —         —         —    

Litigation and other

     —         —         0.01       —    

Share-based compensation adjustments

     —         —         —         —    

Non-cash fair value adjustments

     0.01       —         —         (0.01

Tax rate changes and other

     (0.26     —         (0.27     —    

Debt refinancing and unutilized financing costs

     —         —         —         0.02  


Normalized funds from operations

   $ 0.48     $ 0.46     $ 0.85     $ 0.93  

Share-based compensation

     0.02       0.02       0.04       0.04  

Debt costs amortization

     0.01       0.01       0.02       0.02  

Rent deferral, net

     —         (0.01     —         (0.01

Straight-line rent revenue from operating and finance leases

     (0.10     (0.13     (0.21     (0.26


Adjusted funds from operations

   $ 0.41     $ 0.35     $ 0.70     $ 0.72  


Notes:


(A)

Certain line items above (such as depreciation and amortization) include our share of such income/expense from unconsolidated joint ventures. These amounts are included with all activity of our equity interests in the “Earnings from equity interests” line on the consolidated statements of income.

(B)

Investors and analysts following the real estate industry utilize funds from operations (“FFO”) as a supplemental performance measure. FFO, reflecting the assumption that real estate asset values rise or fall with market conditions, principally adjusts for the effects of GAAP depreciation and amortization of real estate assets, which assumes that the value of real estate diminishes predictably over time. We compute FFO in accordance with the definition provided by the National Association of Real Estate Investment Trusts, or Nareit, which represents net income (loss) (computed in accordance with GAAP), excluding gains (losses) on sales of real estate and impairment charges on real estate assets, plus real estate depreciation and amortization, including amortization related to in-place lease intangibles, and after adjustments for unconsolidated partnerships and joint ventures.

In addition to presenting FFO in accordance with the Nareit definition, we disclose normalized FFO, which adjusts FFO for items that relate to unanticipated or non-core events or activities or accounting changes that, if not noted, would make comparison to prior period results and market expectations less meaningful to investors and analysts. We believe that the use of FFO, combined with the required GAAP presentations, improves the understanding of our operating results among investors and the use of normalized FFO makes comparisons of our operating results with prior periods and other companies more meaningful. While FFO and normalized FFO are relevant and widely used supplemental measures of operating and financial performance of REITs, they should not be viewed as a substitute measure of our operating performance since the measures do not reflect either depreciation and amortization costs or the level of capital expenditures and leasing costs (if any not paid by our tenants) to maintain the operating performance of our properties, which can be significant economic costs that could materially impact our results of operations. FFO and normalized FFO should not be considered an alternative to net income (loss) (computed in accordance with GAAP) as indicators of our results of operations or to cash flow from operating activities (computed in accordance with GAAP) as an indicator of our liquidity.

We calculate adjusted funds from operations, or AFFO, by subtracting from or adding to normalized FFO (i) straight-line rent, (ii) non-cash share-based compensation expense, and (iii) amortization of deferred financing costs. AFFO is an operating measurement that we use to analyze our results of operations based more on the receipt, rather than the accrual, of our rental revenue and on certain other adjustments. We believe that this is an important measurement because our infrastructure-type assets generally require longer term leases with annual contractual escalations of base rents, resulting in the recognition of a significant amount of rental income that is not billable/collected until future periods. Our calculation of AFFO may not be comparable to AFFO or similarly titled measures reported by other REITs. AFFO should not be considered as an alternative to net income (calculated pursuant to GAAP) as an indicator of our results of operations or to cash flow from operating activities (calculated pursuant to GAAP) as an indicator of our liquidity.


MEDICAL PROPERTIES TRUST, INC. AND SUBSIDIARIES

2023 Guidance Reconciliation

(Unaudited)


     2023 Guidance - Per Share(1)  
             Low                     High          

Net income attributable to MPT common stockholders

   $ 0.33     $ 0.37  

Participating securities’ share in earnings

     —         —    


Net income, less participating securities’ share in earnings

   $ 0.33     $ 0.37  

Depreciation and amortization

     1.14       1.14  

Real estate impairment charges

     0.09       0.09  


Funds from operations

   $ 1.56     $ 1.60  

Other adjustments

     (0.03     (0.03


Normalized funds from operations

   $ 1.53     $ 1.57  


(1)

The guidance is based on current expectations and actual results or future events may differ materially from those expressed in this table, which is a forward-looking statement within the meaning of the federal securities laws. Please refer to the forward-looking statement included in this press release and our filings with the Securities and Exchange Commission for a discussion of risk factors that affect our performance.

Exhibit 99.2


LOGO

MPT Medical Properties Trust QUARTERLY SUPPLEMENTAL SECOND QUARTER 2023


LOGO

3 COMPANY OVERVIEW Company Information 3 FINANCIAL INFORMATION 6 Reconciliation of Net Income to Funds from Operations 6 Debt Summary 7 Debt Maturities and Debt Metrics 8 PORTFOLIO INFORMATION Lease and Loan Maturity Schedule 9 9 Total Assets and Revenues by Asset Type, Operator, State and Country 10 Rent Coverage 13 Summary of Investments and Development Projects 15 FINANCIAL STATEMENTS Consolidated Statements of Income 16 16 Consolidated Balance Sheets 17 Investments in Unconsolidated Real Estate Joint Ventures 18 Investments in Unconsolidated Operating Entities 19 Appendix - Non-GAAP Reconciliation 20 FORWARD-LOOKING STATEMENTS Forward-looking statements involve known and unknown risks, uncertainties and other factors that may cause the actual results of the Company or future events to differ materially from those expressed in or underlying such forward-looking statements, including without limitation: Normalized FFO per share; expected payout ratio; the amount and timing of acquisitions or dispositions of healthcare real estate or other investments, if any; Net Debt to EBITDAre; portfolio diversification; capital markets conditions; the repayment of debt arrangements; statements concerning the additional income to the Company as a result of ownership interests in certain hospital operations and the timing of such income; the payment of future dividends, if any; completion of additional debt arrangements and additional investments; national and international economic, business, regulatory, real estate and other market conditions; the competitive environment in which the Company operates; the execution of the Company’s business plan; financing risks; the Company’s ability to maintain its status as a REIT for federal income tax purposes; acquisition and development risks; potential environmental and other liabilities; potential impact from health crises; the risks and uncertainties of litigation; other events beyond the control of our tenants/borrowers and the related impact to us; and other factors affecting the real estate industry generally or healthcare real estate in particular. For further discussion of the factors that could affect outcomes, please refer to the "Risk Factors" section of the Company’s Annual Report on Form 10-K for the year ended December 31, 2022, and as updated by the Company’s subsequently filed Quarterly Reports on Form 10-Q and other SEC filings. Except as otherwise required by the federal securities laws, the Company undertakes no obligation to update the information in this report. Certain information in the supplemental package may be shown adjusted for transactions completed subsequent to period end and the consummation of pending transactions, including the July 2023 repurchase of three hospitals by Prime Healthcare, the expected sale of three Connecticut hospitals currently leased to Prospect Medical Holdings, and the expected sale of the remainder of our Australia portfolio. The adjustments are based upon available information and assumptions that we believe are reasonable. There is no assurance that any pending transactions will occur. On the cover and below: Arizona General Hospital - Mesa, Arizona.


LOGO

COMPANY OVERVIEW MPT Medical Properties Trust, Inc. is a self-advised real estate investment trust formed in 2003 to acquire and develop net-leased hospital facilities. From its inception in Birmingham, Alabama, the Company has grown to become one of the world’s largest owners of hospital real estate. MPT’s financing model facilitates acquisitions and recapitalizations and allows operators of hospitals to unlock the value of their real estate assets to fund facility improvements, technology upgrades and other investments in operations. As of June 30, 2023. 444 properties 55 operators ~44,000 beds 3I U.S. states IO countries MEDICAL PROPERTIES TRUST | SUPPLEMENTAL INFORMATION | Q2 2023 3


LOGO

MPT Officers Edward K. Aldag, Jr. R. Steven Hamner Emmett E. McLean J. Kevin Hanna Rosa H. Hooper Larry H. Portal Charles R. Lambert R. Lucas Savage Chairman, President and Chief Executive Officer Executive Vice President and Chief Financial Officer Executive Vice President, Chief Operating Officer and Secretary Senior Vice President, Controller and Chief Accounting Officer Senior Vice President of Operations & Assistant Secretary Senior Vice President, Senior Advisor to the CEO (not pictured) Vice President, Treasurer and Managing Director of Capital Markets Vice President, Head of Global Acquisitions From the Left: Charles R. Lambert, Emmett E. McLean, R. Lucas Savage, Edward K. Aldag, Jr., R. Steven Hamner, Rosa H. Hooper and J. Kevin Hanna (not pictured: Larry H. Portal). Board of Directors Edward K. Aldag, Jr. G. Steven Dawson R. Steven Hamner Caterina A. Mozingo Emily W. Murphy Elizabeth N. Pitman D. Paul Sparks, Jr. Michael G. Stewart C. Reynolds Thompson, III Corporate Headquarters Medical Properties Trust, Inc. 1000 Urban Center Drive, Suite 501 Birmingham, AL 35242 (205) 969-3755 (205) 969-3756 (fax) www.medicalpropertiestrust.com MEDICAL PROPERTIES TRUST | SUPPLEMENTAL INFORMATION | Q2 2023 4


LOGO

INVESTOR RELATIONS Drew Babin Senior Managing Director of Corporate Communications (646) 884-9809 dbabin@medicalpropertiestrust.com Tim Berryman Managing Director of Investor Relations (205) 397-8589 tberryman@medicalpropertiestrust.com Transfer Agent Equiniti Trust Company, LLC 6201 15th Avenue Brooklyn, NY 11219 https://equiniti.com/us Stock Exchange Listing and Trading Symbol New York Stock Exchange (NYSE): MPW MPW LISTED NYSE Senior Unsecured Debt Ratings Moody’s: Ba1 Standard & Poor’s: BB+ Klinik Heidelberg, Germany, operated by ATOS. MEDICAL PROPERTIES TRUST | SUPPLEMENTAL INFORMATION | Q2 2023 5


LOGO

FINANCIAL INFORMATION RECONCILIATION OF NET INCOME TO FUNDS FROM OPERATIONS (Unaudited) (Amounts in thousands, except per share data) For the Three Months Ended For the Six Months Ended June 30, 2023 June 30, 2022 June 30, 2023 June 30, 2022 FFO INFORMATION: Net (loss) income attributable to MPT common stockholders $(42,037) $189,597 $(9,243) $821,278 Participating securities’ share in earnings (469) (345) (984) (747) Net (loss) income, less participating securities’ share in earnings $(42,506) $189,252 $(10,227) $820,531 Depreciation and amortization 382,244 101,976 484,204 201,435 Gain on sale of real estate (167) (16,355) (229) (467,993) Real estate impairment charges — — 52,104 — Funds from operations $339,571 $274,873 $525,852 $553,973 Write-off (recovery) of unbilled rent and other 95,642 1,943 135,268 (328) Other impairment charges — — —4,875 Litigation and other 2,502 — 10,228 — Share-based compensation adjustments (4,363) (966) (4,363) (966) Non-cash fair value adjustments 8,374 (943) 4,253 (8,966) Tax rate changes and other (157,230) (825) (164,535) (825) Debt refinancing and unutilized financing costs 816 619 816 9,435 Normalized funds from operations $285,312 $274,701 $507,519 $557,198 Share-based compensation 10,800 11,075 22,629 22,879 Debt costs amortization 5,203 4,560 10,324 10,173 Rent deferral, net 2,380 (3,327) 4,793 (7,043) Straight-line rent revenue from operating and finance leases (60,825) (74,757) (123,414) (152,090) Adjusted funds from operations $242,870 $212,252 $421,851 $431,117 PER DILUTED SHARE DATA: Net (loss) income, less participating securities’ share in earnings $(0.07) $0.32 $(0.02) $1.37 Depreciation and amortization 0.64 0.17 0.81 0.33 Gain on sale of real estate — (0.03) — (0.78) Real estate impairment charges — — 0.09 — Funds from operations $ 0.57 $ 0.46 $ 0.88 $ 0.92 Write-off (recovery) of unbilled rent and other 0.16 — 0.23 — Other impairment charges — — — — Litigation and other — — 0.01 — Share-based compensation adjustments — — — — Non-cash fair value adjustments 0.01 — — (0.01) Tax rate changes and other (0.26) — (0.27) — Debt refinancing and unutilized financing costs — — —0.02 Normalized funds from operations $ 0.48 $ 0.46 $ 0.85 $ 0.93 Share-based compensation 0.02 0.02 0.04 0.04 Debt costs amortization 0.01 0.01 0.02 0.02 Rent deferral, net — (0.01) — (0.01) Straight-line rent revenue from operating and finance leases (0.10) (0.13) (0.21) (0.26) Adjusted funds from operations $ 0.41 $ 0.35 $ 0.70 $ 0.72 Notes: (A) Certain line items above (such as depreciation and amortization) include our share of such income/expense from unconsolidated joint ventures. These amounts are included with all activity of our equity interests in the “Earnings from equity interests” line on the consolidated statements of income. (B) Investors and analysts following the real estate industry utilize funds from operations (“FFO”) as a supplemental performance measure. FFO, reflecting the assumption that real estate asset values rise or fall with market conditions, principally adjusts for the effects of GAAP depreciation and amortization of real estate assets, which assumes that the value of real estate diminishes predictably over time. We compute FFO in accordance with the definition provided by the National Association of Real Estate Investment Trusts, or Nareit, which represents net income (loss) (computed in accordance with GAAP), excluding gains (losses) on sales of real estate and impairment charges on real estate assets, plus real estate depreciation and amortization, including amortization related to in-place lease intangibles, and after adjustments for unconsolidated partnerships and joint ventures. In addition to presenting FFO in accordance with the Nareit definition, we disclose normalized FFO, which adjusts FFO for items that relate to unanticipated or non-core events or activities or accounting changes that, if not noted, would make comparison to prior period results and market expectations less meaningful to investors and analysts. We believe that the use of FFO, combined with the required GAAP presentations, improves the understanding of our operating results among investors and the use of normalized FFO makes comparisons of our operating results with prior periods and other companiesmore meaningful. While FFO and normalized FFO are relevant and widely used supplemental measures of operating and financial performance of REITs, they should not be viewed as a substitute measure of our operating performance since the measures do not reflect either depreciation and amortization costs or the level of capital expenditures and leasing costs (if any not paid by our tenants) to maintain the operating performance of our properties, which can be significant economic costs that could materially impact our results of operations. FFO and normalized FFO should not be considered an alternative to net income (loss) (computed in accordance with GAAP) as indicators of our results of operations or to cash flow fromoperating activities (computedin accordancewith GAAP) as an indicator of our liquidity. We calculate adjusted funds from operations, or AFFO, by subtracting from or adding to normalized FFO (i) straight-line rent, (ii) non-cash share-based compensation expense, and (iii) amortization of deferred financing costs. AFFO is an operating measurement that we use to analyze our results of operations based more on the receipt, rather than the accrual, of our rental revenue and on certain other adjustments.We believe that this is an important measurement because our infrastructure-type assets generally require longer term leases with annual contractual escalations of base rents, resulting in the recognition of a significant amount of rental income that is not billable/collected until future periods. Our calculation of AFFO may not be comparable to AFFO or similarly titled measures reported by other REITs. AFFO should not be considered as an alternative to net income (calculated pursuant to GAAP) as an indicator of our results of operations or to cash flow from operating activities (calculated pursuant to GAAP) as an indicator of our liquidity. MEDICAL PROPERTIES TRUST | SUPPLEMENTAL INFORMATION | Q2 2023 6


LOGO

FINANCIAL INFORMATION (As of June 30, 2023) ($ amounts in thousands) DEBT SUMMARY Debt Instrument Rate Type Rate Balance 2026 Credit Facility Revolver(A) Variable 4.855% - 6.760% $ 1,211,708 2027 Term Loan Variable 6.902% 200,000 2.550% Notes Due 2023 (£400M)(A) Fixed 2.550% 508,120 2024 AUD Term Loan (A$470M)(A) Fixed(B) 2.850% 313,208 2024 GBP Term Loan (£105M)(A) Fixed 5.250% 133,191 3.325% Notes Due 2025 (€500M)(A) Fixed 3.325% 545,450 2025 GBP Term Loan (£700M)(A) Fixed(C) 2.349% 889,210 0.993% Notes Due 2026 (€500M)(A) Fixed 0.993% 545,450 5.250% Notes Due 2026 Fixed 5.250% 500,000 2.500% Notes Due 2026 (£500M)(A) Fixed 2.500% 635,150 5.000% Notes Due 2027 Fixed 5.000% 1,400,000 3.692% Notes Due 2028 (£600M)(A) Fixed 3.692% 762,180 4.625% Notes Due 2029 Fixed 4.625% 900,000 3.375% Notes Due 2030 (£350M)(A) Fixed 3.375% 444,605 3.500% Notes Due 2031 Fixed 3.500% 1,300,000 $ 10,288,272 Debt issuance costs and discount (50,714) Weighted average rate 3.930% $ 10,237,558 RATE TYPE AS PERCENTAGE OF TOTAL DEBT Fixed 86% Variable 14% (A) Non-USD denominated debt converted to U.S. dollars at June 30, 2023. (B) We entered into an interest rate swap transaction, effective July 3, 2019, to fix the benchmark variable interest rate of the loan. On March 10, 2023, the rate increased to 2.850%. (C) We entered into an interest rate swap transaction, effective March 6, 2020, to fix the benchmark variable interest rate of the loan. On March 10, 2023, the rate increased to 2.349%. MEDICAL PROPERTIES TRUST | SUPPLEMENTAL INFORMATION | Q2 2023 7


LOGO

FINANCIAL INFORMATION (As of June 30, 2023) ($ amounts in thousands) DEBT MATURITIES Year Senior Unsecured Notes Term Loans/Revolver Total Debt % of Total 2023 $ 508,120 $ — $ 508,120 4.9% 2024 — 446,399 446,399 4.3% 2025 545,450 889,210 1,434,660 14.0% 2026 1,680,600 1,211,708 2,892,308 28.1% 2027 1,400,000 200,000 1,600,000 15.6% 2028 762,180 — 762,180 7.4% 2029 900,000 — 900,000 8.8% 2030 444,605 — 444,605 4.3% 2031 1,300,000 — 1,300,000 12.6% Totals $ 7,540,955 $ 2,747,317 $ 10,288,272 100.0% DEBT BY LOCAL CURRENCY Senior Unsecured Notes Term Loans/Revolver Total Debt % of Total United States $ 4,100,000 $ 930,000 $ 5,030,000 48.9% United Kingdom 2,350,055 1,173,566 3,523,621 34.3% Australia — 313,208 313,208 3.0% Europe 1,090,900 330,543 1,421,443 13.8% Totals $ 7,540,955 $ 2,747,317 $ 10,288,272 100.0% DEBT METRICS For the Three Months Ended June 30, 2023 Adjusted Net Debt to Annualized EBITDAre Ratios: Adjusted Net Debt $ 9,498,140 Adjusted Annualized EBITDAre 1,402,568 Adjusted Net Debt to Adjusted Annualized EBITDAre Ratio 6.8x Adjusted Net Debt $ 9,498,140 Transaction Adjusted Annualized EBITDAre 1,382,344 Adjusted Net Debt to Transaction Adjusted Annualized EBITDAre Ratio 6.9x Leverage Ratio: Unsecured Debt $ 10,155,081 Secured Debt 133,191 Total Debt $ 10,288,272 Total Gross Assets(A) 20,455,540 Financial Leverage 50.3% Interest Coverage Ratios: Interest Expense $ 104,470 Capitalized Interest 2,834 Debt Costs Amortization (4,082) Total Interest $ 103,222 EBITDAre 293,730 Interest Coverage Ratio 2.8x Adjusted EBITDAre $ 350,642 Adjusted Interest Coverage Ratio 3.4x (A) Total Gross Assets equals total assets plus accumulated depreciation and amortization. See appendix for reconciliation of other Non-GAAP financial measures. MEDICAL PROPERTIES TRUST | SUPPLEMENTAL INFORMATION | Q2 2023 8


LOGO

PORTFOLIO INFORMATION LEASE AND LOAN MATURITY SCHEDULE(A) ($ amounts in thousands) Years of Maturities(B) Total Properties(C) Base Rent/Interest(D) Percentage of Total Base Rent/Interest 2023(E) 7 $32,802 2.5% 2024 2 2,731 0.2% 2025 7 19,961 1.5% 2026 4 2,490 0.2% 2027 1 3,476 0.3% 2028 8 19,968 1.5% 2029 5 12,414 0.9% 2030 116,454 0.5% 2031 4 4,746 0.4% 2032 41 68,373 5.2% Thereafter 343 1,142,996 86.8% 433 $1,316,411 100.0% Percentage of total base rent/interest 100% 90% 80% 70% 60% 50% 40% 30% 20% 10% 0% 2.5% 0.2% 1.5% 0.2% 0.3% 1.5% 0.9% 0.5% 0.4% 5.2% 86.8% 2023 2024 2025 2026 2027 2028 2029 2030 2031 2032 Thereafter (A) Schedule includes leases and mortgage loans. (B) Lease/Loan expiration is based on the fixed term of the lease/loan and does not factor in potential renewal or other options provided for in our agreements. (C) Reflects all properties, including those that are part of joint ventures, except vacant properties (approximately 0.2% of total assets), and six facilities that are under development. (D) Represents contractual base rent/interest income on an annualized basis as of period end (including foreign currency exchange rates) but does not include tenant recoveries, additional rents and other lease-related adjustments to revenue (i.e., straight-line rents and deferred revenues). (E) Properties classified as held for sale are shown to mature in current year, including four facilities currently leased to Healthscope and three facilities repurchased by Prime Healthcare in July 2023. MEDICAL PROPERTIES TRUST | SUPPLEMENTAL INFORMATION | Q2 2023 9


LOGO

PORTFOLIO INFORMATION TOTAL ASSETS AND REVENUES BY ASSET TYPE (June 30, 2023) ($ amounts in thousands) Asset Types Properties Total Assets(A) Percentage of Total Assets Q2 2023 Revenues(B) Percentage of Q2 2023 Revenues General Acute Care Hospitals 197 $12,231,004 63.7% $234,917(c) 69.6% Behavioral Health Facilities 70 2,591,314 13.5% 56,378 16.7% Inpatient Rehabilitation Facilities 114 1,457,603 7.6% 31,452 9.3% Long-Term Acute Care Hospitals 20 275,843 1.4% 8,329 2.5% Freestanding ER/Urgent Care Facilities 43 234,044 1.2% 6,319 1.9% Other — 2,414,567(D) 12.6% — — Total 444 $19,204,375 100.0% $337,395 100.0% TOTAL ASSETS BY ASSET TYPE 1% 1% 8% 13%13% 64% General Acute Care Hospitals Behavioral Health Facilities Inpatient Rehabilitation Facilities Long-Term Acute Care Hospitals Freestanding ER/Urgent Care Facilities other TOTAL REVENUES BY ASSET TYPE 2% 2% 9% 17% 70% DOMESTIC ASSETS BY ASSET TYPE 2% 2% 7% 8% 14% 67% General Acute Care Hospitals Behavioral Health Facilities Inpatient Rehabilitation Facilities Long-Term Acute Care Hospitals Freestanding ER/Urgent Care Facilities Other 4% 3% 10% 11% 72% Note: Investments in operating entities are allocated pro rata based on the gross book value of the real estate. Such pro rata allocations are subject to change from period to period. (A) Reflects total assets on our consolidated balance sheets. (B) Reflects actual revenues on our consolidated statements of income. (C) Includes a write-off of approximately $95 million of straight-line rent receivables as part of the Steward Health Care/CommonSpirit Health transaction, which closed on May 1, 2023. (D) Includes our PHP Holdings investment of $654,520. MEDICAL PROPERTIES TRUST | SUPPLEMENTAL INFORMATION | Q2 2023 10


LOGO

PORTFOLIO INFORMATION TOTAL ASSETS - LARGEST INDIVIDUAL FACILITY (June 30, 2023) Operators Steward Health Care Circle Health Priory Group Prospect Medical Holdings Lifepoint Behavioral Health 50 operators Largest Individual Facility as a Percentage of Total Assets(A) 2.0% 1.1% 0.7% 1.0% 0.4% 1.9% Largest Individual Facility Investment is Approximately 2% of MPT Investment Portfolio COMPREHENSIVE PROPERTY-LEVEL UNDERWRITING FRAMEWORK MPT invests in real estate, not the consolidated financial performance of its tenants. Each facility is underwritten for characteristics that make the infrastructure attractive to any experienced, competent operator - not just the current tenant. If we have underwritten these correctly, then coupled with our absolute net master lease structure, our real estate will be attractive to a replacement operator, in the rare event we must transition. Such underwriting characteristics include: Physical Quality Competion Demographics and market Financial TOTAL ASSETS AND REVENUES BY OPERATOR (June 30, 2023) ($ amounts in thousands) Operators Properties Total Assets(A) Percentage of Total Assets Q2 2023 Revenues(B) Percentage of Q2 2023 Revenues Steward Health Care 36 Florida market $ 1,366,453 7.1% $ 37,040 10.9% Texas/Arkansas/Louisiana market 1,050,597 5.5% 23,932 7.1% Massachusetts market 800,998 4.2% 7,291 2.1% Arizona market 308,513 1.6% 11,577 3.4% Ohio/Pennsylvania market 123,491 0.6% 4,737 1.4% Utah market 5,994 0.0% (84,878)(C) -25.0% Circle Health 36 2,141,517 11.2% 48,645 14.4% Priory Group 37 1,401,106 7.3% 26,930 8.0% Prospect Medical Holdings 13 1,045,844 5.5% 68,436 20.3% Lifepoint Behavioral Health(D) 19 799,212 4.2% 19,068 5.7% CommonSpirit Health 5 796,774 4.1% 19,568 5.8% Swiss Medical Network 17 682,069 3.6% 1,345 0.4% MEDIAN 81 671,727 3.4% 7,469 2.2% Ernest Health 29 616,350 3.2% 17,847 5.3% Prime Healthcare 12 567,516 3.0% 18,956 5.6% 45 operators 159 4,411,647 22.9% 109,432 32.4% Other - 2,414,567 12.6% - - Total 444 $ 19,204,375 100.0% $ 337,395 100.0% Note: Investments in operating entities are allocated pro rata based on the gross book value of the real estate. Such pro rata allocations are subject to change from period to period. (A) Reflects total assets on our consolidated balance sheets. (B) Reflects actual revenues on our consolidated statements of income, including revenue from ground lease and other expenses reimbursed to us by tenants. (C) Includes a write-off of approximately $95 million of straight-line rent receivables as part of the Steward Health Care/CommonSpirit Health transaction, which closed on May 1, 2023. (D) Formerly Springstone. MEDICAL PROPERTIES TRUST | SUPPLEMENTAL INFORMATION | Q2 2023 11


LOGO

PORTFOLIO INFORMATION TOTAL ASSETS AND REVENUES BY U.S. STATE AND COUNTRY (June 30, 2023) ($ amounts in thousands) U.S. States and Other Countries Properties Total Assets (A) Percentage of Total Assets Q2 2023 Revenues(B) Percentage of Q2 2023 Revenues Texas 52 $ 1,940,872 10.1% $ 47,444 14.1% Florida 9 1,366,453 7.1% 35,508 10.5% California 19 1,211,932 6.3% 57,367 17.0% Utah 7 834,773 4.4% (64,288)(C) -19.1% Massachusetts 10 805,796 4.2% 6,605 2.0% 26 Other States 122 3,846,670 20.0% 136,538 40.5% Other - 1,699,686 8.9% - - United States 219 $ 11,706,182 61.0% $ 219,174 65.0% United Kingdom 92 $ 4,301,199 22.4% $ 88,275 26.2% Germany 85 746,419 3.9% 9,517 2.8% Switzerland 17 682,069 3.5% 1,345 0.4% Australia 4 301,125 1.6% 8,498 2.5% Spain 9 232,037 1.2% 2,170 0.6% Other Countries 18 520,463 2.7% 8,416 2.5% Other - 714,881 3.7% - - International 225 $ 7,498,193 39.0% $ 118,221 35.0% Total 444 $ 19,204,375 100.0% $ 337,395 100.0% Note: Investments in operating entities are allocated pro rata based on the gross book value of the real estate. Such pro rata allocations are subject to change from period to period. (A) Reflects total assets on our consolidated balance sheets. (B) Reflects actual revenues on our consolidated statements of income. (C) Includes a write-off of approximately $95 million of straight-line rent receivables as part of the Steward Health Care/CommonSpirit Health transaction, which closed on May 1, 2023. TOTAL ASSETS BY COUNTRY 4% 3% 1% 2% 3% 4% 22% 61% United States United Kingdom Germany Switzerland Australia Spain Other Countries Other TOTAL REVENUES BY COUNTRY 1% 1% 2% 3% 2% 26% 65% ASSETS BY U.S. STATE 9% 10% 7% 6% 5% 4% 20% Texas Florida California Utah Massachusetts 26 Other States Other REVENUES BY U.S. STATE 14% 10% 17% -19% 2% 41% MEDICAL PROPERTIES TRUST | SUPPLEMENTAL INFORMATION | Q2 2023 12


LOGO

PORTFOLIO INFORMATION TOTAL PORTFOLIO TTM EBITDARM(A)(B) RENT COVERAGE EXCLUSIVE OF ALL CARES ACT GRANTS YOY AND SEQUENTIAL QUARTER COMPARISONS BY PROPERTY TYPE EBITDARM Rent Covrage 4.00x 3.50x 3.00x 2.50x 2.00x 1.50x 1.00x 0.50x 0.00x 2.8x 2.6x 2.8x General Acute Care Hospitals 1.9x 1.9x 1.8x Inpatient Rehabilitation Facilities 1.8x 1.8x 1.8x Behavioral Health Facilities 2.5x 1.7x 1.5x Long-Term Acute Care Hospitals 2.5x 2.4x 2.4x Total Portfolio Q1 2022 TTM Q4 2022 TTM Q1 2023 TTM Notes: All data presented is on a trailing twelve month basis. For properties acquired in the preceding twelve months, data is for the period between MPT acquisition and March 31, 2023. (A) EBITDARM is facility-level earnings before interest, taxes, depreciation, amortization, rent and management fees. EBITDARM includes normal GAAP expensed maintenance and repair costs. EBITDARM does not give effect for capitalized expenditures that extend the life or improve the facility and equipment in a way to drive more future revenues. The majority of these types of capital expenditures are financed and do not have an immediate cash impact. MPT’s rent is not subordinate to capitalized expenses. In addition, EBITDARM does not represent property net income or cash flows from operations and should not be considered an alternative to those indicators. EBITDARM figures utilized in calculating coverages presented are based on financial information provided by MPT’s tenants. MPT has not independently verified this information, but has no reason to believe this information is inaccurate in any material respect. TTM Coverages are calculated based on actual, unadjusted EBITDARM results as presented in tenant financial reporting and cash rent paid to MPT, except as noted below. - All CARES Act Grants received by tenants have been removed from the tenant’s reported financial results in the above time periods. - Prospect Medical Holdings and Prime Healthcare Q1 2023 EBITDARM for California facilities has been adjusted for amounts expected to be received under the Hospital Quality Assurance Fee (“HQAF”) Program 8. Amounts included are derived from the current model from the California Hospital Association which has not yet been approved by CMS. (B) General Acute Care coverages and Total Portfolio coverages do not include Pipeline Health facilities as Pipeline Health filed Chapter 11 bankruptcy in October 2022, Healthscope facilities due to pending sale, and Prospect Medical Holdings Pennsylvania and Connecticut due to restructuring. MEDICAL PROPERTIES TRUST | SUPPLEMENTAL INFORMATION | Q2 2023 13


LOGO

PORTFOLIO INFORMATION TOTAL PORTFOLIO TTM EBITDARM RENT COVERAGE EXCLUSIVE OF ALL CARES ACT GRANTS EBITDARM RENT COVERAGE: OPERATORS WITH PROPERTY-LEVEL REPORTING Tenant Net Investment (in thousands)(A) Primary Property Type TTM EBITDARM Rent Coverage Steward Health Care $2,434,365 General Acute 2.9x Priory Group 1,179,310 Behavioral 2.2x MEDIAN 591,196 IRF 1.7x Ernest Health 545,038 IRF/LTACH 2.2x Prospect Medical Holdings(B) 512,309 General Acute 1.0x Prime Healthcare(C) 467,515 General Acute 4.0x Aspris Children’s Services 245,958 Behavioral 2.2x Vibra Healthcare 242,751 IRF/LTACH 1.7x Surgery Partners 166,687 General Acute 7.8x Ardent Health Services 87,162 General Acute 6.7x Other Reporting Tenants 635,510 Various 2.6x Total $7,107,801 2.7x Tenant Net Investment (in thousands)(A) Primary Property Type TTM EBITDARM Rent Coverage International Operator 1 $2,089,634 General Acute 2.2x Domestic Operator 1 507,394 General Acute 0.9x Domestic Operator 2 387,346 General Acute/LTACH 1.2x Domestic Operator 3 773,888 Behavioral 1.4x Total $3,758,262 1.7x PROPERTY-LEVEL REPORTING NOT REQUIRED AND/OR NOT AVAILABLE Tenant Net Investment (in thousands)(A) Primary Property Type Comments CommonSpirit Health $796,774 General Acute One of the largest nonprofit health care operators in the U.S.; Investment grade-rated Swiss Medical Network 441,056 General Acute Second largest group of private hospitals in Switzerland Ramsay Health Care UK 407,200 General Acute One of largest health care operators in the world; Parent guaranty; Investment grade-rated Pihlajalinna 220,524 General Acute Finland’s leading provider of social and health services Saint Luke’s - Kansas City 129,110 General Acute Investment grade-rated NHS 89,413 General Acute Single-payor government entity in UK Dignity Health 44,013 General Acute Part of CommonSpirit; Parent guaranty; Investment grade-rated CUF 30,078 General Acute Largest private hospital system in Portugal with 23 facilities and 75+ year operating history NeuroPsychiatric Hospitals 27,106 Behavioral Parent guaranty Community Health Systems 26,652 General Acute U.S. hospital operator with substantial operating history Other Tenants 23,525 General Acute N/A Total $2,235,451 Above data represents approximately 87% of MPT Total Real Estate Investment (D) Notes: All data presented is on a trailing twelve month basis. For properties acquired in the preceding twelve months, data is for the period between MPT acquisition and March 31, 2023. (A) Investment figures exclude equity investments, non-real estate loans, freestanding ER/urgent care facilities, and facilities under development. (B) Prospect Medical Holdings coverage includes California facilities only. (C) Prime Healthcare coverage includes facilities remaining after Prime’s repurchase of three facilities in early July 2023. (D) Healthscope and Prospect Medical Holdings Connecticut are excluded due to pending sale. MEDICAL PROPERTIES TRUST | SUPPLEMENTAL INFORMATION | Q2 2023 14


LOGO

PORTFOLIO INFORMATION SUMMARY OF INVESTMENTS (For the six months ended June 30, 2023) (Amounts in thousands) Operator Location Investment(A) Commencement Date PHP Holdings California $ 50,000 Q1 2023 MEDIAN Germany 77,230 Q2 2023 Priory Group U.K. 57,606 Q2 2023 Prospect Medical Holdings California 25,000 Q2 2023 Capital Additions, Development and Other Funding for Existing Tenants(B) Various 117,749 Various $ 327,585 SUMMARY OF CURRENT DEVELOPMENT PROJECTS AS OF JUNE 30, 2023 (Amounts in thousands) Operator Location Commitment Costs Incurred as of June 30, 2023 Estimated Commencement Date Ernest Health South Carolina $ 22,400 $ 18,077 Q3 2023 IMED Hospitales Spain 46,273 41,109 Q3 2023 Lifepoint Behavioral Health Texas 31,600 11,422 Q1 2024 IMED Hospitales Spain 37,434 10,832 Q3 2024 IMED Hospitales Spain 51,372 14,849 Q1 2025 Steward Health Care Texas 169,408 57,098 Q2 2026 $ 358,487 $ 153,387 (A) Excludes transaction costs, such as real estate transfer and other taxes. Amount assumes exchange rate as of the investment date. (B) Reflects normal capital additions that extend the life or improve existing facilities on which we receive a return equal to the lease rate for the respective facility. This includes over 10 facilities and six different operators. MEDICAL PROPERTIES TRUST | SUPPLEMENTAL INFORMATION | Q2 2023 15


LOGO

FINANCIAL STATEMENTS CONSOLIDATED STATEMENTS OF INCOME (Unaudited) (Amounts in thousands, except per share data) For the Three Months Ended For the Six Months Ended June 30, 2023 June 30, 2022 June 30, 2023 June 30, 2022 REVENUES Rent billed $ 247,491 $ 241,209 $ 495,648 $ 504,611 Straight-line rent (39,329) 58,518 17,364 119,562 Income from financing leases 68,468 51,873 81,663 103,649 Interest and other income 60,765 48,626 92,93182,204 Total revenues 337,395 400,226 687,606 810,026 EXPENSES Interest 104,470 87,730 202,124 178,913 Real estate depreciation and amortization 364,403 84,334 448,263 169,650 Property-related(A) 24,676 21,135 31,786 29,733 General and administrative 35,604 38,858 77,328 80,282 Total expenses 529,153 232,057 759,501 458,578 OTHER INCOME (EXPENSE) Gain on sale of real estate 167 16,355 229 467,993 Real estate and other impairment charges - - (89,538) (4,875) Earnings from equity interests 12,224 14,785 23,576 22,123 Debt refinancing and unutilized financing costs (816) (619) (816) (9,435) Other (including fair value adjustments on securities) (10,512) 2,031 (15,678) 16,793 Total other income (expense) 1,063 32,552 (82,227) 492,599 (Loss) income before income tax (190,695) 200,721 (154,122) 844,047 Income tax benefit (expense) 148,262 (10,657) 144,719 (22,036) Net (loss) income (42,433) 190,064 (9,403) 822,011 Net loss (income) attributable to non-controlling interests 396 (467) 160 (733) Net (loss) income attributable to MPT common stockholders $ (42,037) $ 189,597 $ (9,243) $ 821,278 EARNINGS PER COMMON SHARE - BASIC AND DILUTED Net (loss) income attributable to MPT common stockholders $ (0.07) $ 0.32 $ (0.02) $ 1.37 WEIGHTED AVERAGE SHARES OUTSTANDING – BASIC 598,344 598,827 598,323 598,751 WEIGHTED AVERAGE SHARES OUTSTANDING - DILUTED 598,344 599,026 598,323 598,979 DIVIDENDS DECLARED PER COMMON SHARE $ 0.29 $ 0.29 $ 0.58 $ 0.58 (A) Includes $21.1 million and $18.3 million of ground lease and other expenses (such as property taxes and insurance) paid directly by us and reimbursed by our tenants for the three months ended June 30, 2023 and 2022, respectively, and $25.3 million and $24.6 million for the six months ended June 30, 2023 and 2022, respectively. MEDICAL PROPERTIES TRUST | SUPPLEMENTAL INFORMATION | Q2 2023 16


LOGO

FINANCIAL STATEMENTS CONSOLIDATED BALANCE SHEETS (Amounts in thousands, except per share data) June 30, 2023 December 31, 2022 (Unaudited) (A) ASSETS Real estate assets Land, buildings and improvements, intangible lease assets, and other $ 13,133,651 $ 13,862,415 Investment in financing leases 1,231,652 1,691,323 Real estate held for sale 401,125 -Mortgage loans 299,326 364,101 Gross investment in real estate assets 15,065,754 15,917,839 Accumulated depreciation and amortization (1,251,165) (1,193,312) Net investment in real estate assets 13,814,589 14,724,527 Cash and cash equivalents 324,050 235,668 Interest and rent receivables, net 177,643 167,035 Straight-line rent receivables 779,584 787,166 Investments in unconsolidated real estate joint ventures 1,487,118 1,497,903 Investments in unconsolidated operating entities 1,812,150 1,444,872 Other loans 199,360 227,839 Other assets 609,881 572,990 Total Assets $ 19,204,375 $ 19,658,000 LIABILITIES AND EQUITY Liabilities Debt, net $ 10,237,558 $ 10,268,412 Accounts payable and accrued expenses 444,926 621,324 Deferred revenue 49,766 27,727 Obligations to tenants and other lease liabilities 157,411 146,130 Total Liabilities 10,889,661 11,063,593 Equity Preferred stock, $0.001 par value. Authorized 10,000 shares; no shares outstanding - - Common stock, $0.001 par value. Authorized 750,000 shares; issued and outstanding - 598,344 shares at June 30, 2023 and 597,476 shares at December 31, 2022 598 597 Additional paid-in capital 8,547,835 8,535,140 Retained (deficit) earnings (241,301) 116,285 Accumulated other comprehensive income (loss) 6,680 (59,184) Total Medical Properties Trust, Inc. Stockholders’ Equity 8,313,812 8,592,838 Non-controlling interests 902 1,569 Total Equity 8,314,714 8,594,407 Total Liabilities and Equity $ 19,204,375 $ 19,658,000 (A) Financials have been derived from the prior year audited financial statements. MEDICAL PROPERTIES TRUST | SUPPLEMENTAL INFORMATION | Q2 2023 17


LOGO

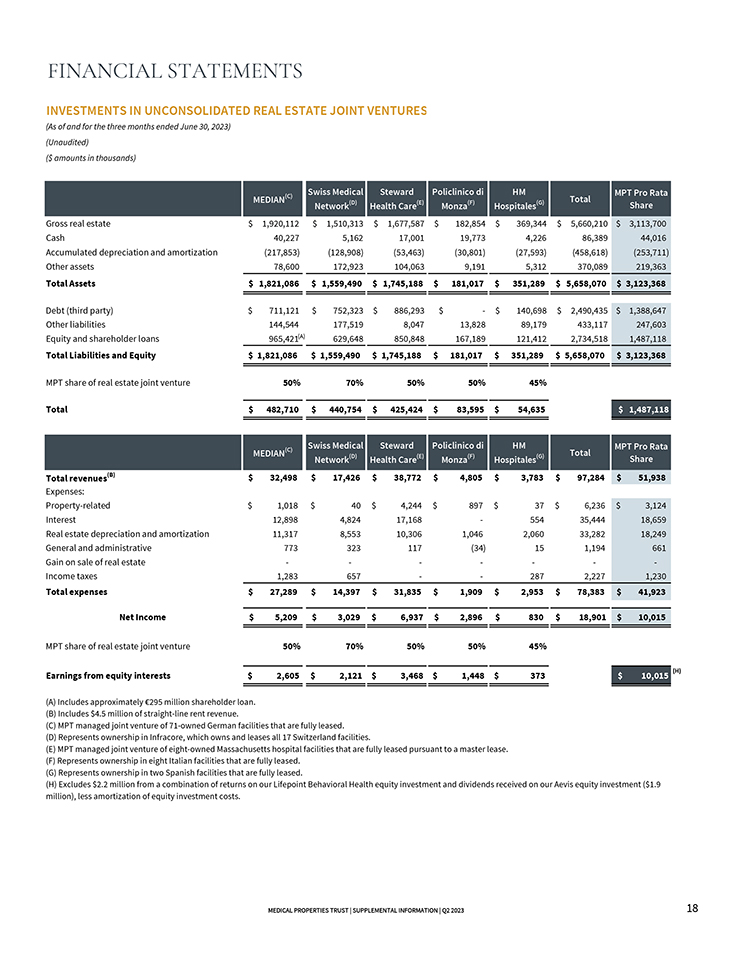
FINANCIAL STATEMENTS INVESTMENTS IN UNCONSOLIDATED REAL ESTATE JOINT VENTURES (As of and for the three months ended June 30, 2023) (Unaudited) ($ amounts in thousands) MEDIAN(C) Swiss Medical Network(D) Steward Health Care(E) Policlinico di Monza(F) HM Hospitales(G) Total MPT Pro Rata Share Gross real estate $ 1,920,112 $ 1,510,313 $ 1,677,587 $ 182,854 $ 369,344 $ 5,660,210 $ 3,113,700 Cash 40,227 5,162 17,001 19,773 4,226 86,389 44,016 Accumulated depreciation and amortization (217,853) (128,908) (53,463) (30,801) (27,593) (458,618) (253,711) Other assets 78,600 172,923 104,063 9,191 5,312 370,089 219,363 Total Assets $ 1,821,086 $ 1,559,490 $ 1,745,188 $ 181,017 $ 351,289 $ 5,658,070 $ 3,123,368 Debt (third party) $ 711,121 $ 752,323 $ 886,293 $ - $ 140,698 $ 2,490,435 $ 1,388,647 Other liabilities 144,544 177,519 8,047 13,828 89,179 433,117 247,603 Equity and shareholder loans 965,421(A) 629,648 850,848 167,189 121,412 2,734,518 1,487,118 Total Liabilities and Equity $ 1,821,086 $ 1,559,490 $ 1,745,188 $ 181,017 $ 351,289 $ 5,658,070 $ 3,123,368 MPT share of real estate joint venture 50% 70% 50% 50% 45% Total $ 482,710 $ 440,754 $ 425,424 $ 83,595 $ 54,635 $ 1,487,118 MEDIAN(C) Swiss Medical Network(D) Steward Health Care(E) Policlinico di Monza(F) HM Hospitales(G) Total MPT Pro Rata Share Total revenues(B) $ 32,498 $ 17,426 $ 38,772 $ 4,805 $ 3,783 $ 97,284 $ 51,938 Expenses: Property-related $ 1,018 $ 40 $ 4,244 $ 897 $ 37 $ 6,236 $ 3,124 Interest 12,898 4,824 17,168 - 554 35,444 18,659 Real estate depreciation and amortization 11,317 8,553 10,306 1,046 2,060 33,282 18,249 General and administrative 773 323 117 (34) 15 1,194 661 Gain on sale of real estate - - - - - - - Income taxes 1,283 657 - 287 2,227 1,230 Total expenses $ 27,289 $ 14,397 $ 31,835 $ 1,909 $ 2,953 $ 78,383 $ 41,923 Net Income $ 5,209 $ 3,029 $ 6,937 $ 2 ,896 $ 830 $ 18,901 $ 10,015 MPT share of real estate joint venture 50% 70% 50% 50% 45% Earnings from equity interests $ 2,605 $ 2,121 $ 3,468 $ 1,448 $ 373 $ 10,015 (H) (A) Includes approximately €295 million shareholder loan. (B) Includes $4.5 million of straight-line rent revenue. (C) MPT managed joint venture of 71-owned German facilities that are fully leased. (D) Represents ownership in Infracore, which owns and leases all 17 Switzerland facilities. (E) MPT managed joint venture of eight-owned Massachusetts hospital facilities that are fully leased pursuant to a master lease. (F) Represents ownership in eight Italian facilities that are fully leased. (G) Represents ownership in two Spanish facilities that are fully leased. (H) Excludes $2.2 million from a combination of returns on our Lifepoint Behavioral Health equity investment and dividends received on our Aevis equity investment ($1.9 million), less amortization of equity investment costs. MEDICAL PROPERTIES TRUST | SUPPLEMENTAL INFORMATION | Q2 2023 18


LOGO

FINANCIAL STATEMENTS INVESTMENTS IN UNCONSOLIDATED OPERATING ENTITIES (Amounts in thousands) OPERATING ENTITY INVESTMENT FRAMEWORK MPT’s hospital expertise and comprehensive underwriting process allows for opportunistic investments in hospital operations. Passive investments typically needed in order to acquire the larger real estate transactions. Cash payments go to previous owner and not to the tenant, with limited exceptions. Operators are vetted as part of our overall underwriting process. Potential for outsized returns and organic growth. Certain of these investments entitle us to customary minority rights and protections. No additional operating loss exposure beyond our investment. Proven track record of successful investments, including Ernest Health and Capella Healthcare. Operator Investment as of June 30, 2023 Ownership Interest Structure PHP Holdings $654,520 49.0% Includes a 49% equity ownership interest in, along with a $586 million loan convertible into PHP Holdings, the managed care business of Prospect. The loan carries an 8% interest rate and is convertible into equity of PHP Holdings. Steward Health Care 362,586 N/A Loan, for which proceeds were paid to Steward’s former private equity sponsor, is secured by the equity of Steward and provides for an initial 4% cash return plus 37% of the increase in the value of Steward over seven years. International Joint Venture 230,153 49.0% Includes our 49% equity ownership interest and a loan made for the purpose of investing in select international hospital operations. The loan carries a 7.5% interest rate and is secured by the remaining equity of the international joint venture and guaranteed by the other equity owner. Priory Group 163,619 9.9% In order to close the 2021 acquisition of 35 facilities, we made a 9.9% passive equity investment and a loan, proceeds of which were paid to the former owner. The loan carries a variable interest rate. Swiss Medical Network 162,194 10.0% Includes our passive equity ownership interest, along with a CHF 45 million loan as part of a syndicated loan facility. Steward Health Care 125,862 9.9% Includes our passive equity ownership interest. Proceeds from our original investment of $150 million were paid directly to Steward’s former private equity sponsor and other shareholders. Aevis 79,121 4.6% Includes our passive equity ownership interest in Aevis, a public healthcare investment company. Our original investment of CHF 47 million is marked-to-market quarterly. Aspris 16,005 9.9% Includes our passive equity ownership interest in Aspris, a spin-off of Priory’s education and children’s services line of business. Lifepoint Behavioral Health 10,767 20.9% In order to close the 2021 acquisition of 18 behavioral facilities, we made an equity investment and a loan, proceeds of which were paid to the former owners. As a result of Lifepoint’s acquisition of a majority interest in Springstone in February 2023, the loan and related interest (of approximately $205 million) was paid in full. We continue to hold our minority equity interest in Lifepoint Behavioral Health. Caremax 7,323 9.9% Includes our passive equity ownership interest in Caremax, a public care delivery system. Our original investment is marked-to-market quarterly. Total $1,812,150 INVESTMENTS IN UNCONSOLIDATED OPERATING ENTITIES AS A PERCENTAGE OF TOTAL ASSETS 9% 91% MEDICAL PROPERTIES TRUST | SUPPLEMENTAL INFORMATION | Q2 2023 19


LOGO

APPENDIX - NON-GAAP RECONCILIATIONS ADJUSTED NET DEBT/ANNUALIZED EBITDAre (Unaudited) (Amounts in thousands) For the Three Months Ended June 30, 2023 ADJUSTED EBITDAre RECONCILIATION Net loss $(42,433) Add back: Interest 104,470 Income tax (148,262) Depreciation and amortization 367,955 Gain on sale of real estate (167) Adjustment to reflect MPT’s share of unlevered EBITDAre from unconsolidated real estate joint ventures(A) 12,167 2Q 2023 EBITDAre $293,730 Share-based compensation 6,437 Write-off of unbilled rent and other 95,642 Litigation and other 2,502 Debt refinancing and unutilized financing costs 816 Non-cash fair value adjustments 8,374 Prospect Medical Holdings adjustment (56,859) Annualized 2Q 2023 Adjusted EBITDAre $350,642 $1,402,568 Adjustments for mid-quarter investment activity(B) (5,056) 2Q 2023 Transaction Adjusted EBITDAre $345,586 $1,382,344 ADJUSTED NET DEBT RECONCILIATION Total debt at June 30, 2023 $10,237,558 Less: Cash at June 30, 2023 (324,050) Less: Cash funded for building improvements in progress and construction in progress at June 30, 2023(C) (415,368) Adjusted Net Debt $9,498,140 Investors and analysts following the real estate industry utilize net debt (debt less cash) to EBITDAre as a measurement of leverage that shows how many years it would take for us to pay back our debt, assuming net debt and EBITDAre are held constant. In our calculation, we start with EBITDAre, as defined by Nareit, which is net income before interest expense, income tax expense, depreciation and amortization, losses/gains on disposition of depreciated property, impairment losses, and adjustments to reflect our share of EBITDAre from unconsolidated real estate joint ventures. We then adjust EBITDAre for non-cash share-based compensation, non-cash fair value adjustments and other items that would make comparison of our operating results with prior periods and other companies more meaningful, to derive Adjusted EBITDAre. We adjust net debt for cash funded for building improvements in progress and construction in progress for which we are not yet receiving rent to derive Adjusted Net Debt. We adjust Adjusted EBITDAre for the effects from investments and capital transactions that were completed during the period, assuming such transactions were consummated/fully funded as of the beginning of the period to derive Transaction Adjusted EBITDAre. Although non-GAAP measures, we believe Adjusted Net Debt, Adjusted EBITDAre, and Transaction Adjusted EBITDAre are useful to investors and analysts as they allow for a more current view of our credit quality and allow for the comparison of our credit strength between periods and to other real estate companies without the effect of items that by their nature are not comparable from period to period. (A) Includes only the unlevered portion of our share of EBITDAre from unconsolidated real estate joint ventures, as we have excluded any net debt from our unconsolidated real estate joint ventures in the Adjusted Net Debt line. We believe this adjustment is needed to appropriately reflect the relationship between EBITDAre and net debt. (B) Reflects a full quarter impact from our mid-quarter investments, disposals, and loan payoffs. (C) Excluded development and capital improvement projects that are in process and not yet generating a cash return but will generate a return once completed. MEDICAL PROPERTIES TRUST | SUPPLEMENTAL INFORMATION | Q2 2023 20


LOGO

MPT Medical Properties Trust 1000 Urban Center Drive, Suite 501 Birmingham, AL 35242 (205) 969-3755 NYSE: MPW www.medicalpropertiestrust.com Contact: Drew Babin, Senior Managing Director of Corporate Communications (646) 884-9809 or dbabin@medicalpropertiestrust.com or Tim Berryman, Managing Director of Investor Relations (205) 397-8589 or tberryman@medicalpropertiestrust.com

v3.23.2
Document and Entity Information
Aug. 08, 2023
Cover [Abstract]  
Entity Registrant Name MEDICAL PROPERTIES TRUST INC
Amendment Flag false
Entity Central Index Key 0001287865
Document Type 8-K
Document Period End Date Aug. 08, 2023
Entity File Number 001-32559
Entity Incorporation State Country Code MD
Entity Tax Identification Number 20-0191742
Entity Address, Address Line One 1000 Urban Center Drive
Entity Address, Address Line Two Suite 501
Entity Address, City or Town Birmingham
Entity Address, State or Province AL
Entity Address, Postal Zip Code 35242
City Area Code (205)
Local Phone Number 969-3755
Written Communications false
Soliciting Material false
Pre Commencement Tender Offer false
Pre Commencement Issuer Tender Offer false
Security 12b Title Common Stock, par value $0.001 per share, of Medical Properties Trust, Inc.
Trading Symbol MPW
Security Exchange Name NYSE
Entity Emerging Growth Company false

Medical Properties (NYSE:MPW)
과거 데이터 주식 차트
부터 4월(4) 2024 으로 5월(5) 2024 Medical Properties 차트를 더 보려면 여기를 클릭.
Medical Properties (NYSE:MPW)
과거 데이터 주식 차트
부터 5월(5) 2023 으로 5월(5) 2024 Medical Properties 차트를 더 보려면 여기를 클릭.