0001600438
false
0001600438
2023-08-31
2023-08-31
iso4217:USD
xbrli:shares
iso4217:USD
xbrli:shares
UNITED STATES
SECURITIES AND
EXCHANGE COMMISSION
Washington,
D.C. 20549
FORM 8-K
CURRENT REPORT
Pursuant to Section 13
or 15(d) of the Securities Exchange Act of 1934
Date of Report (Date of
earliest event reported): August 31,
2023
GMS INC.
(Exact name of
registrant as specified in charter)
| Delaware |
|
001-37784 |
|
46-2931287 |
(State or Other Jurisdiction
of Incorporation) |
|
(Commission
File Number) |
|
(I.R.S. Employer
Identification No.) |
100 Crescent Centre Parkway, Suite 800
Tucker, Georgia |
|
30084 |
| (Address of Principal Executive Offices) |
|
(Zip Code) |
Registrant’s
telephone number, including area code: (800) 392-4619
Check the appropriate box below if
the Form 8-K filing is intended to simultaneously satisfy the filing obligation of the registrant under any of the following
provisions:
| ¨ | Written
communications pursuant to Rule 425 under the Securities Act (17 CFR 230.425) |
| ¨ | Soliciting
material pursuant to Rule 14a-12 under the Exchange Act (17 CFR 240.14a-12) |
| ¨ | Pre-commencement
communications pursuant to Rule 14d-2(b) under the Exchange Act (17 CFR 240.14d-2(b)) |
| ¨ | Pre-commencement
communications pursuant to Rule 13e-4(c) under the Exchange Act (17 CFR 240.13e-4(c)) |
Securities registered pursuant to Section 12(b) of
the Act:
| Title of each class |
|
Trading Symbol(s) |
|
Name of each exchange on which registered |
| Common Stock, par value $0.01 per share |
|
GMS |
|
New York Stock Exchange |
Indicate by check mark whether the
registrant is an emerging growth company as defined in Rule 405 of the Securities Act of 1933 (§230.405 of this chapter)
or Rule 12b-2 of the Securities Exchange Act of 1934 (§240.12b-2 of this chapter).
Emerging
growth company ¨
If
an emerging growth company, indicate by check mark if the registrant has elected not to use the extended transition period for
complying with any new or revised financial accounting standards provided pursuant to Section 13(a) of the Exchange
Act ¨
Item 7.01. Regulation FD Disclosure.
The slide presentation furnished as Exhibit 99.1 hereto, and incorporated
herein by reference, will be presented to certain investors of GMS on August 31, 2023, and may be used by GMS in various other presentations
to investors on or after August 31, 2023.
In accordance with General Instruction B.2 of Form 8-K, the information
in this Item 7.01 of this Current Report on Form 8-K, including Exhibit 99.1 attached hereto, shall not be deemed “filed”
for the purposes of Section 18 of the Securities Exchange Act of 1934, as amended (the “Exchange Act”), or otherwise subject
to the liabilities of that section, nor shall it be deemed incorporated by reference in any filing under the Securities Act of 1933, as
amended, or the Exchange Act, except as shall be expressly set forth by specific reference in such a filing.
Item 9.01. Financial Statements and Exhibits.
(d) Exhibits.
*Furnished herewith
SIGNATURES
Pursuant to the requirements of the Securities
Exchange Act of 1934, the Registrant has duly caused this report to be signed on its behalf by the undersigned hereunto duly authorized.
| |
GMS INC. |
| |
|
|
|
| Date: August 31, 2023 |
By: |
/s/ Scott M. Deakin |
| |
|
Name: |
Scott M. Deakin |
| |
|
Title: |
Chief Financial Officer |
Exhibit 99.1
Q1 2024 Earnings Call August 31, 2023
2 Safe Harbor and B asis of Presentation Forward - Looking Statement Safe Harbor — This presentation includes “forward - looking statements” within the meaning of the Private Securities Litigation Reform Act of 1995. You can generally identify forward - looking statements by the Company’s use of forward - looking terminology such as “anticipate,” “bel ieve,” “confident,” “continue,” “could,” “estimate,” “expect,” “intend,” “may,” “might,” “plan,” “potential,” “predict,” “seek,” or “should,” or the negative thereof or other variations th ere on or comparable terminology. In particular, statements about the markets in which GMS operates and our products, including potential or expected growth in those markets and products, the eco nom y generally, our ability to continue successfully navigating the evolving operating environment and executing our business, strategic initiatives and priorities and growth pot ent ial, future M&A and greenfields, inflation, capital structure, pricing, volumes, net sales, organic sales, gross margins, incremental EBITDA, Adjusted EBITDA, Adjusted EBITDA margin, inter est expense, tax rates, capital expenditures, free cash flow, future financial performance and liquidity, and the ability of the Company to grow stronger contained in this presentat ion may be considered forward - looking statements. Statements about our expectations, beliefs, plans, strategies, objectives, prospects, assumptions or future events or performance may be co nsidered forward - looking statements. The Company has based forward - looking statements on its current expectations, assumptions, estimates and projections. While the Company believes these expectations, assumptions, estimates and projections are reasonable, such forward - looking statements are only predictions and involve known and unknown risks and uncerta inties, many of which are beyond its control, including current public health issues that may affect the Company’s business. Forward - looking statements involve risks and uncertainties, including, but not limited to, those described in the “Risk Factors” section in the Company’s most recent Annual Report on Form 10 - K, and in its other periodic reports filed with the SEC. In addition, the statements in this release are made as of August 31, 2023. The Company undertakes no obligation to update any of the forward - looking statements made herein, whether as a result of new information, future events, changes in expectation or otherwise. These forward - looking statements should not be relied upon as representing the Company’s views as of a ny date subsequent to August 31, 2023. Use of Non - GAAP and Adjusted Financial Information — To supplement GAAP financial information, we use adjusted measures of operating results which are non - GAAP measures. This non - GAAP adjusted financial information is provided as additional information for investors. These adjusted results exclude certain costs, expenses, gains and losses, and we believe their exclusion can enhance an overall understanding of our past financial performance and also our prospects for the fu ture. These adjustments to our GAAP results are made with the intent of providing both management and investors a more complete understanding of our operating performance by excl udi ng non - recurring, infrequent or other non - cash charges that are not believed to be material to the ongoing performance of our business. The presentation of this additional inf ormation is not meant to be considered in isolation or as a substitute for GAAP measures of net income, diluted earnings per share or net cash provided by (used in) operating activities pr epared in accordance with generally accepted accounting principles in the United States. Please see the Appendix to this presentation for a further discussion on these non - GAAP measure s and a reconciliation of these non - GAAP measures to the most directly comparable GAAP measures.
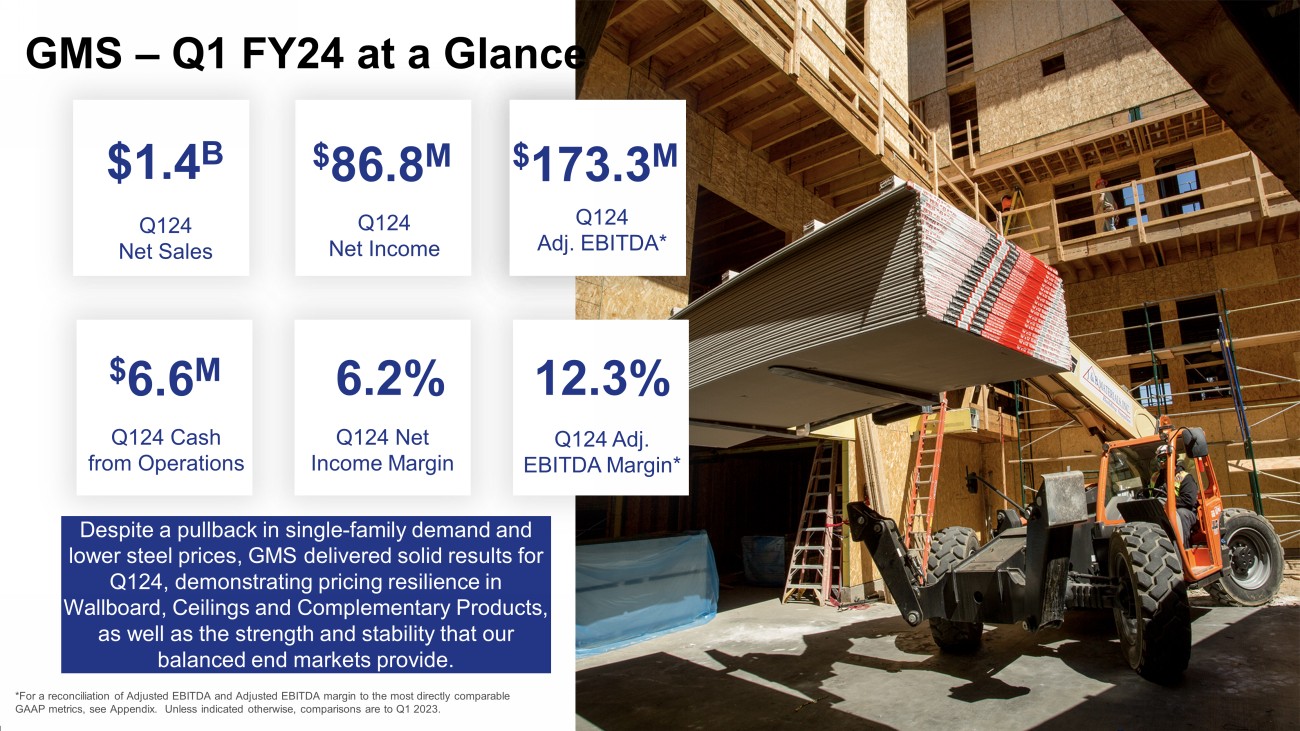
3 Q124 Net Income $ 86.8 M Q124 Cash from Operations GMS – Q1 FY24 at a Glance Q124 Net Income Margin *For a reconciliation of Adjusted EBITDA and Adjusted EBITDA margin to the most directly comparable GAAP metrics, see Appendix. Unless indicated otherwise, comparisons are to Q1 2023. Q124 Adj. EBITDA* $ 173.3 M Q124 Net Sales $1.4 B $ 6.6 M 12.3% Q124 Adj. EBITDA Margin* Despite a pullback in single - family demand and lower steel prices, GMS delivered solid results for Q124, demonstrating pricing resilience in Wallboard, Ceilings and Complementary Products, as well as the strength and stability that our balanced end markets provide. 6.2%
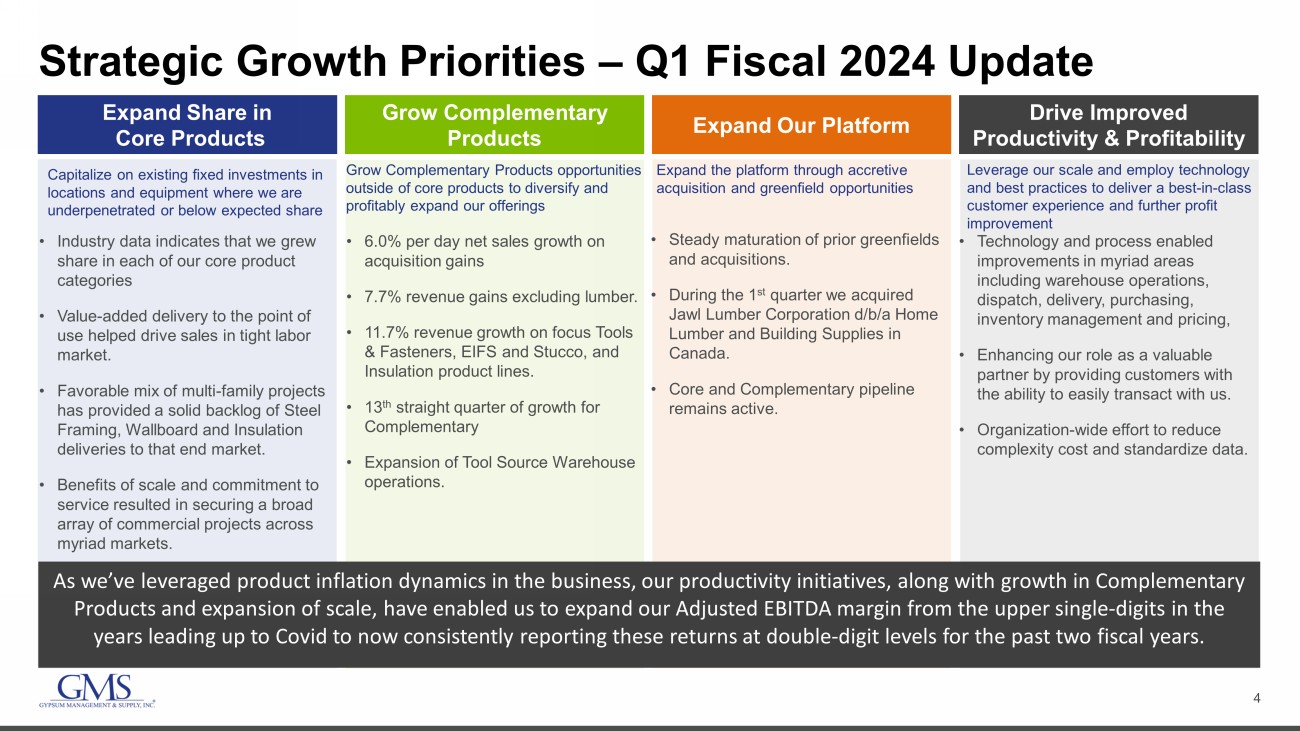
4 Strategic Growth Priorities – Q1 Fiscal 2024 Update Capitalize on existing fixed investments in locations and equipment where we are underpenetrated or below expected share Grow Complementary Products opportunities outside of core products to diversify and profitably expand our offerings Expand the platform through accretive acquisition and greenfield opportunities Leverage our scale and employ technology and best practices to deliver a best - in - class customer experience and further profit improvement • Industry data indicates that we grew share in each of our core product categories • Value - added delivery to the point of use helped drive sales in tight labor market. • Favorable mix of multi - family projects has provided a solid backlog of Steel Framing, Wallboard and Insulation deliveries to that end market. • Benefits of scale and commitment to service resulted in securing a broad array of commercial projects across myriad markets. • 6.0% per day net sales growth on acquisition gains • 7.7% revenue gains excluding lumber. • 11.7% revenue growth on focus Tools & Fasteners, EIFS and Stucco, and Insulation product lines. • 13 th straight quarter of growth for Complementary • Expansion of Tool Source Warehouse operations. • Steady maturation of prior greenfields and acquisitions. • During the 1 st quarter we acquired Jawl Lumber Corporation d/b/a Home Lumber and Building Supplies in Canada. • Core and Complementary pipeline remains active. • Technology and process enabled improvements in myriad areas including warehouse operations, dispatch, delivery, purchasing, inventory management and pricing, • Enhancing our role as a valuable partner by providing customers with the ability to easily transact with us. • Organization - wide effort to reduce complexity cost and standardize data. Expand Share in Core Products Grow Complementary Products Expand Our Platform Drive Improved Productivity & Profitability As we’ve leveraged product inflation dynamics in the business, our productivity initiatives, along with growth in Complementa ry Products and expansion of scale, have enabled us to expand our Adjusted EBITDA margin from the upper single - digits in the years leading up to Covid to now consistently reporting these returns at double - digit levels for the past two fiscal years.
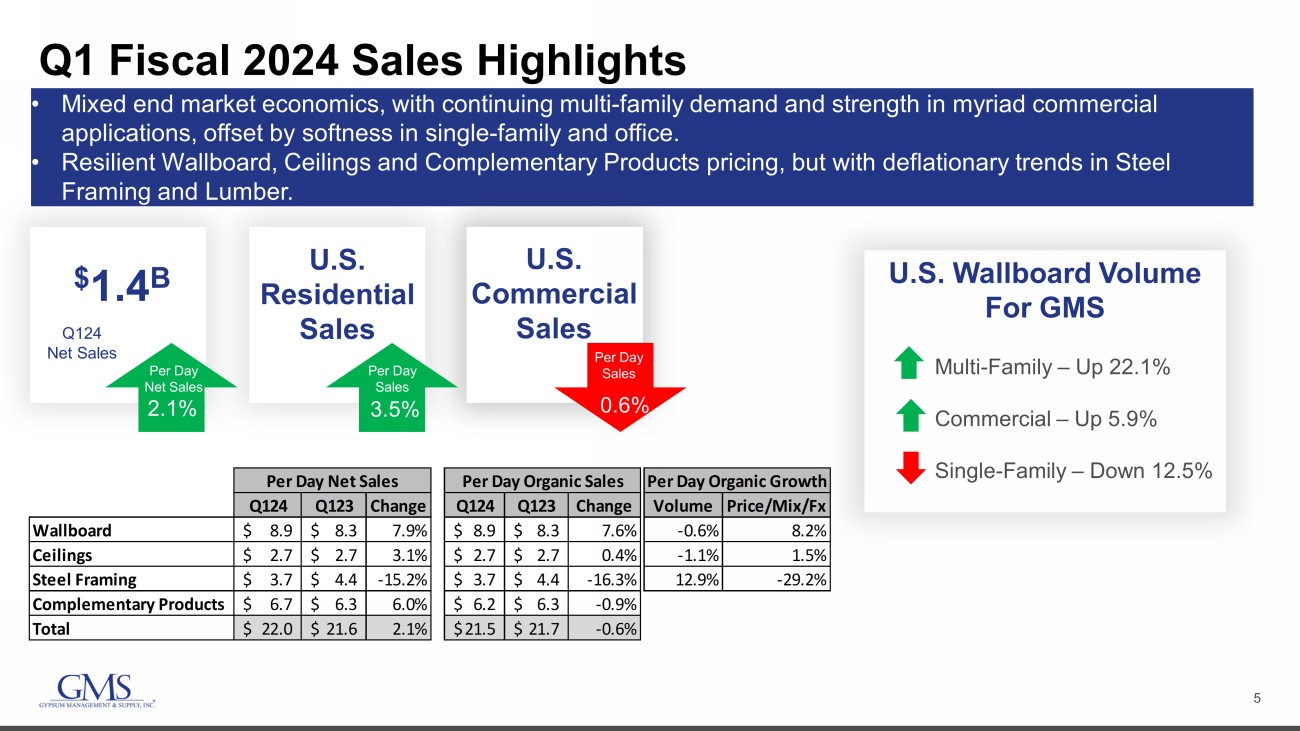
5 Q1 Fiscal 2024 Sales Highlights • Mixed end market economics, with continuing multi - family demand and strength in myriad commercial applications, offset by softness in single - family and office. • Resilient Wallboard, Ceilings and Complementary Products pricing, but with deflationary trends in Steel Framing and Lumber. U.S. Residential Sales Q124 Net Sales $ 1.4 B Per Day Net Sales 2.1% 3.5% U.S. Commercial Sales 0.6% U.S. Wallboard Volume For GMS Multi - Family – Up 22.1% Commercial – Up 5.9% Single - Family – Down 12.5% Per Day Sales Per Day Sales Q124 Q123 Change Q124 Q123 Change Volume Price/Mix/Fx Wallboard 8.9$ 8.3$ 7.9% 8.9$ 8.3$ 7.6% -0.6% 8.2% Ceilings 2.7$ 2.7$ 3.1% 2.7$ 2.7$ 0.4% -1.1% 1.5% Steel Framing 3.7$ 4.4$ -15.2% 3.7$ 4.4$ -16.3% 12.9% -29.2% Complementary Products 6.7$ 6.3$ 6.0% 6.2$ 6.3$ -0.9% Total 22.0$ 21.6$ 2.1% 21.5$ 21.7$ -0.6% Per Day Net Sales Per Day Organic Sales Per Day Organic Growth
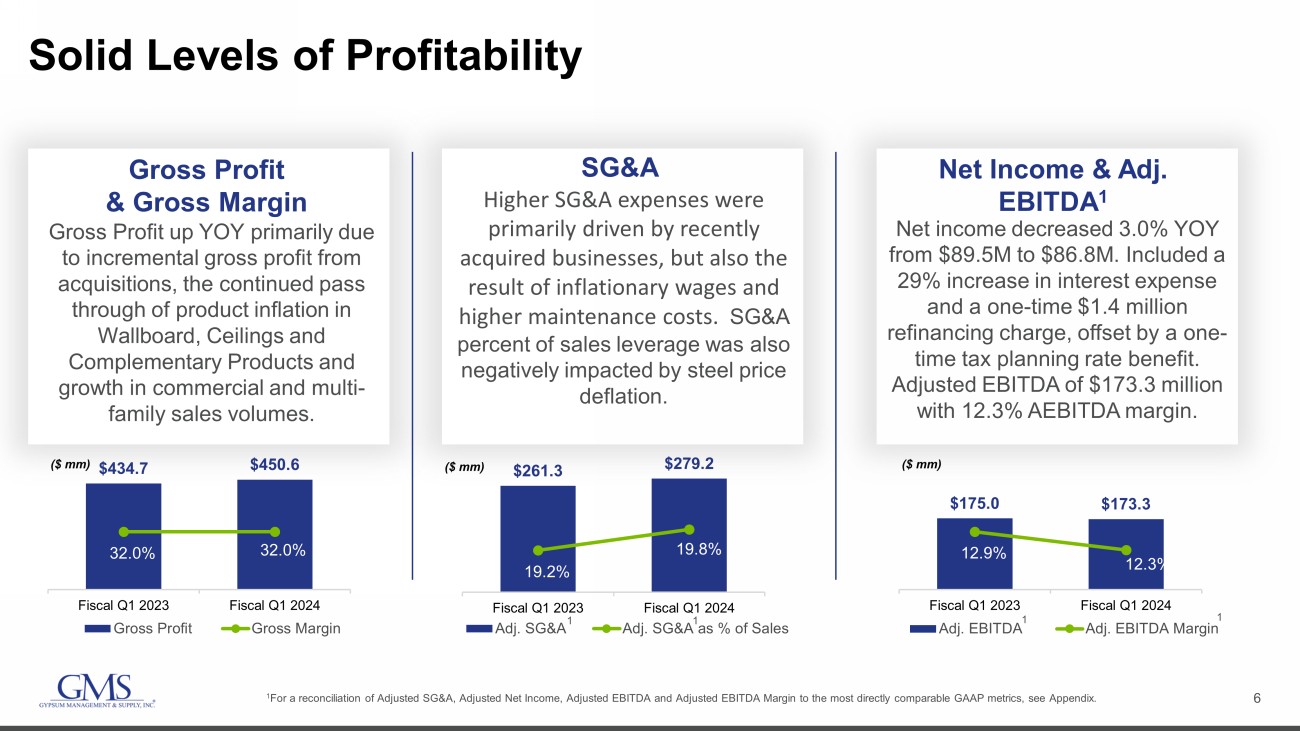
6 $434.7 $450.6 32.0% 32.0% 31.1% 31.6% 32.1% 32.6% $0 $50 $100 $150 $200 $250 $300 $350 $400 $450 $500 Fiscal Q1 2023 Fiscal Q1 2024 Gross Profit Gross Margin ($ mm) Solid Levels of Profitability 1 For a reconciliation of Adjusted SG&A, Adjusted Net Income, Adjusted EBITDA and Adjusted EBITDA Margin to the most directly c omp arable GAAP metrics, see Appendix. 1 1 1 $261.3 $279.2 19.2% 19.8% 18.0% 18.5% 19.0% 19.5% 20.0% 20.5% 21.0% 21.5% $0 $50 $100 $150 $200 $250 $300 Fiscal Q1 2023 Fiscal Q1 2024 Adj. SG&A Adj. SG&A as % of Sales ($ mm) 1 $175.0 $173.3 12.9% 12.3% 11.0% 11.5% 12.0% 12.5% 13.0% 13.5% 14.0% 14.5% 15.0% $0 $50 $100 $150 $200 $250 $300 Fiscal Q1 2023 Fiscal Q1 2024 Adj. EBITDA Adj. EBITDA Margin ($ mm) Gross Profit & Gross Margin Gross Profit up YOY primarily due to incremental gross profit from acquisitions, the continued pass through of product inflation in Wallboard, Ceilings and Complementary Products and growth in commercial and multi - family sales volumes. SG&A Higher SG&A expenses were primarily driven by recently acquired businesses, but also the result of inflationary wages and higher maintenance costs. SG&A percent of sales leverage was also negatively impacted by steel price deflation. Net Income & Adj. EBITDA 1 Net income decreased 3.0% YOY from $89.5M to $86.8M. Included a 29% increase in interest expense and a one - time $1.4 million refinancing charge, offset by a one - time tax planning rate benefit. Adjusted EBITDA of $173.3 million with 12.3% AEBITDA margin.
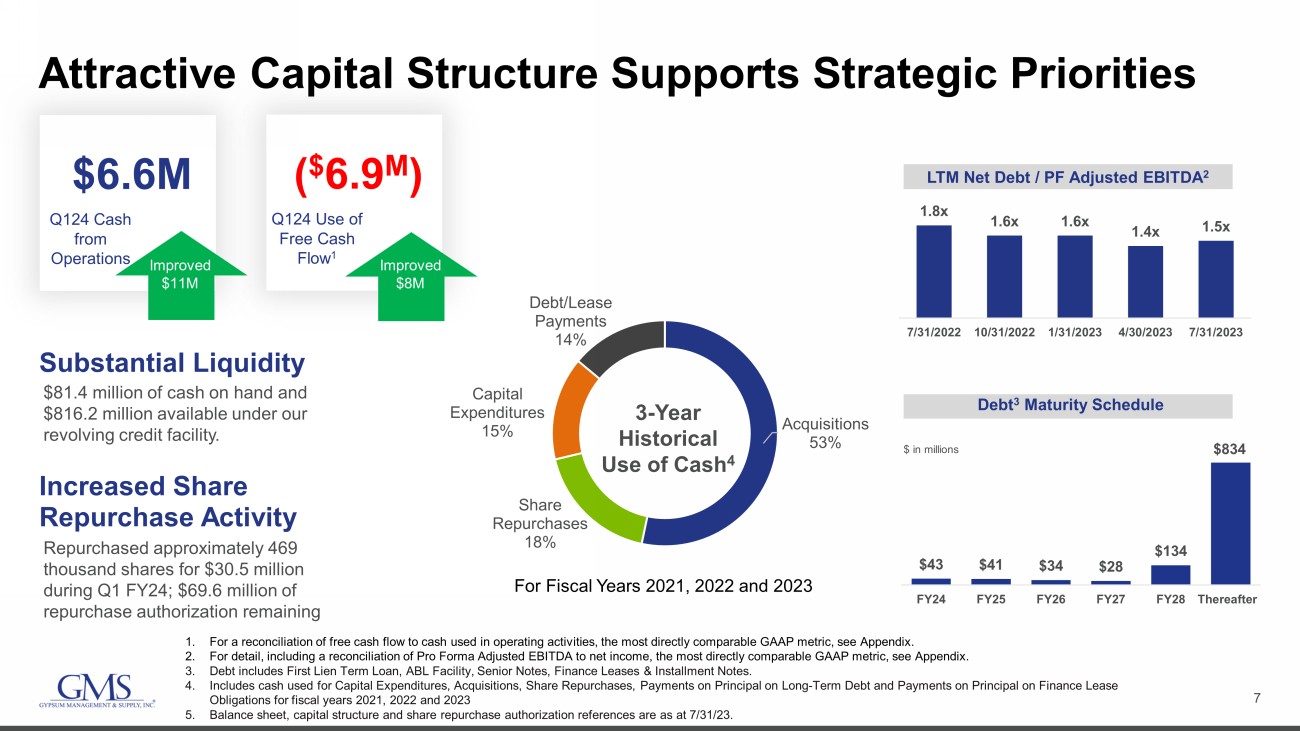
7 Attractive Capital Structure Supports Strategic Priorities Repurchased approximately 469 thousand shares for $30.5 million during Q1 FY24; $69.6 million of repurchase authorization remaining 1.8x 1.6x 1.6x 1.4x 1.5x 7/31/2022 10/31/2022 1/31/2023 4/30/2023 7/31/2023 $43 $41 $34 $28 $134 $834 FY24 FY25 FY26 FY27 FY28 Thereafter LTM Net Debt / PF Adjusted EBITDA 2 Debt 3 Maturity Schedule $ in millions 1. For a reconciliation of free cash flow to cash used in operating activities, the most directly comparable GAAP metric, see Ap pen dix. 2. For detail, including a reconciliation of Pro Forma Adjusted EBITDA to net income, the most directly comparable GAAP metric, see Appendix. 3. Debt includes First Lien Term Loan, ABL Facility, Senior Notes, Finance Leases & Installment Notes. 4. Includes cash used for Capital Expenditures, Acquisitions, Share Repurchases, Payments on Principal on Long - Term Debt and Paymen ts on Principal on Finance Lease Obligations for fiscal years 2021, 2022 and 2023 5. Balance sheet, capital structure and share repurchase authorization references are as at 7/31/23. Increased Share Repurchase Activity Q124 Cash from Operations $6.6M Improved $11M Q124 Use of Free Cash Flow 1 ( $ 6.9 M ) Substantial Liquidity $81.4 million of cash on hand and $816.2 million available under our revolving credit facility. Acquisitions 53% Share Repurchases 18% Capital Expenditures 15% Debt/Lease Payments 14% 3 - Year Historical Use of Cash 4 For Fiscal Years 2021, 2022 and 2023 Improved $8M

8 End Market & Product - Level Expectations for Q2 FY2024 Product Category Q2 FY24 YOY Volume Expectations Q2 FY24 YOY Price/Mix Expectations Wallboard • Multi - family: Up high single - digits • Single - family: Down low double - digits • Commercial: Up low single - digits • Total Wallboard: Down single - digits Down low single - digits Ceilings Up low single - digits Down low single - digits Steel Framing Up high single - digits Down ~25% Complementary Products Up* Up* *Sales growth in Complementary Products, including the benefits of recent acquisitions, is expected to be up mid single - digits.
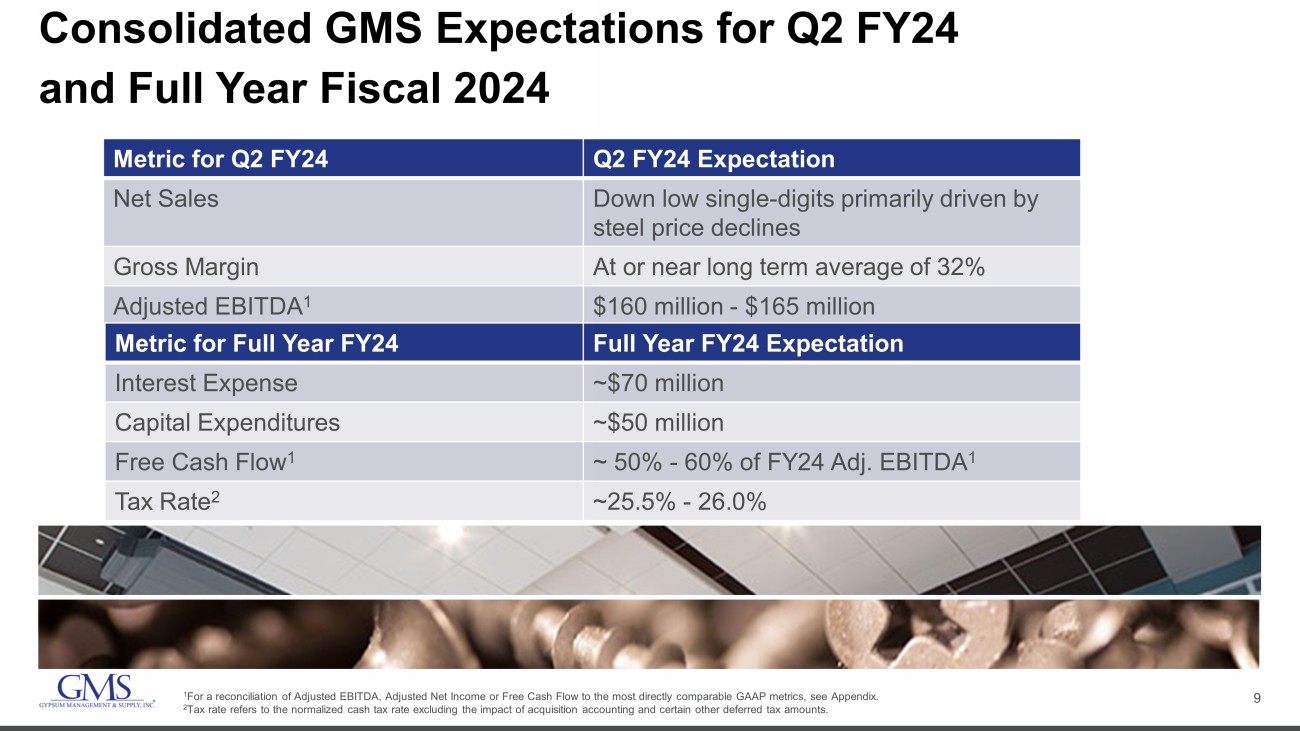
9 Consolidated GMS Expectations for Q2 FY24 and Full Year Fiscal 2024 Metric for Q2 FY24 Q2 FY24 Expectation Net Sales Down low single - digits primarily driven by steel price declines Gross Margin At or near long term average of 32% Adjusted EBITDA 1 $160 million - $165 million Metric for Full Year FY24 Full Year FY24 Expectation Interest Expense ~$70 million Capital Expenditures ~$50 million Free Cash Flow 1 ~ 50% - 60% of FY24 Adj. EBITDA 1 Tax Rate ~25.5% - 26.0% 1 For a reconciliation of Adjusted EBITDA, Adjusted Net Income or Free Cash Flow to the most directly comparable GAAP metrics, see Appendix.
10 Appendix
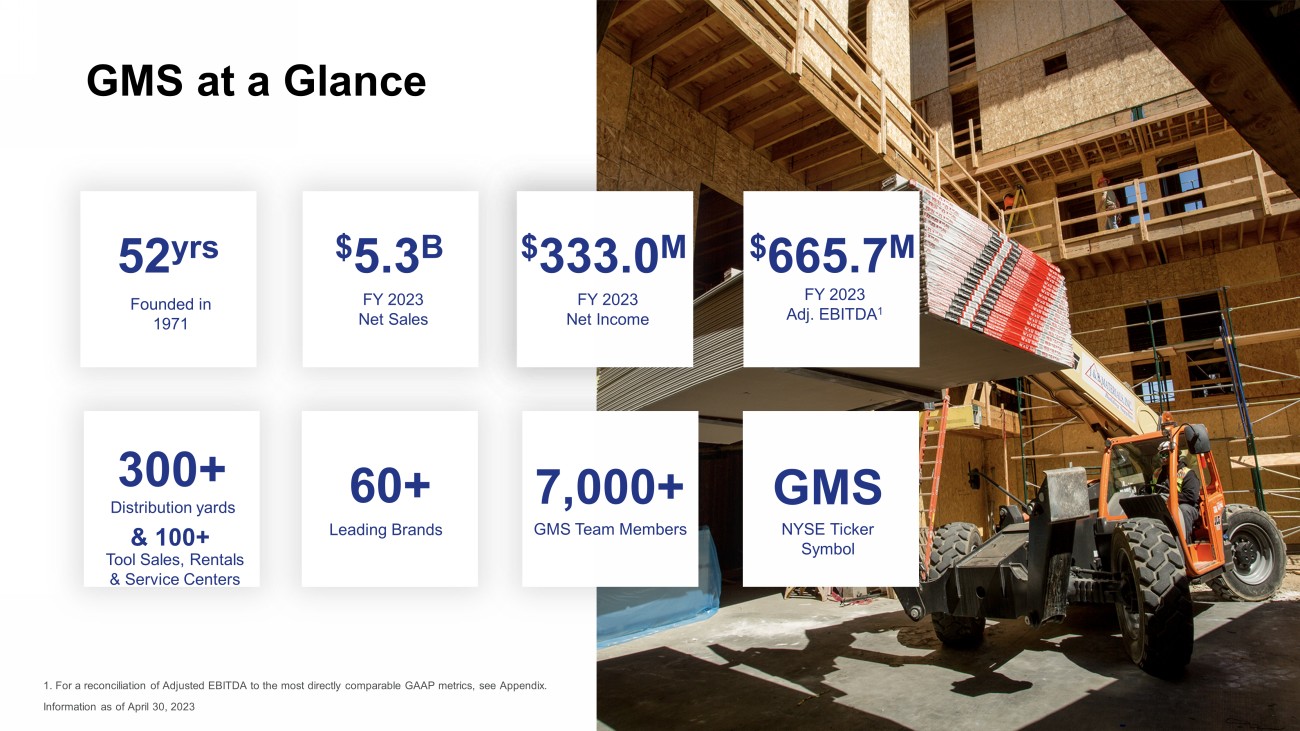
11 Fiscal 2022 Net Sales 52 yrs FY 2023 Net Sales $ 5.3 B 300+ Distribution yards GMS at a Glance 7,000+ GMS Team Members NYSE Ticker Symbol GMS & 100+ Tool Sales, Rentals & Service Centers 1. For a reconciliation of Adjusted EBITDA to the most directly comparable GAAP metrics, see Appendix. Information as of April 30, 2023 FY 2023 Net Income $ 333.0 M Founded in 1971 Leading Brands 60+ FY 2023 Adj. EBITDA 1 $ 665.7 M
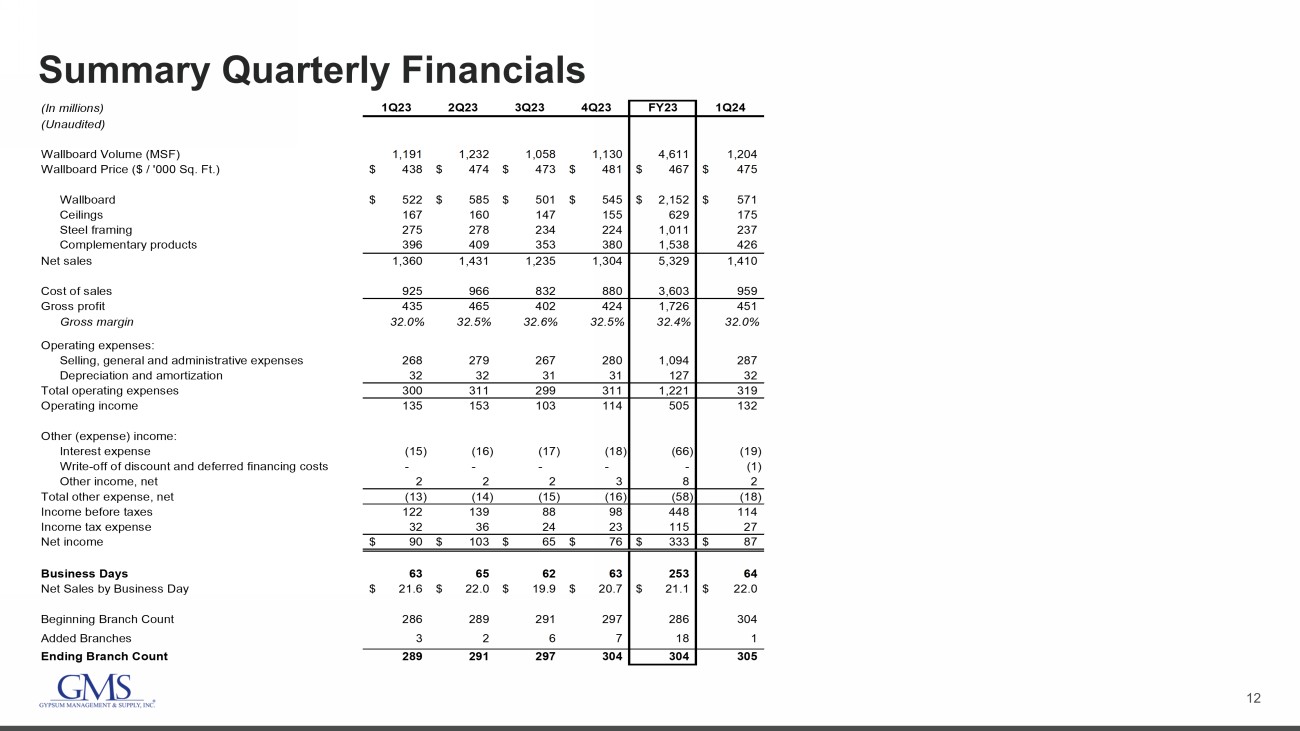
12 Summary Quarterly Financials (In millions) 1Q23 2Q23 3Q23 4Q23 FY23 1Q24 (Unaudited) Wallboard Volume (MSF) 1,191 1,232 1,058 1,130 4,611 1,204 Wallboard Price ($ / '000 Sq. Ft.) 438$ 474$ 473$ 481$ 467$ 475$ Wallboard 522$ 585$ 501$ 545$ 2,152$ 571$ Ceilings 167 160 147 155 629 175 Steel framing 275 278 234 224 1,011 237 Complementary products 396 409 353 380 1,538 426 Net sales 1,360 1,431 1,235 1,304 5,329 1,410 Cost of sales 925 966 832 880 3,603 959 Gross profit 435 465 402 424 1,726 451 Gross margin 32.0% 32.5% 32.6% 32.5% 32.4% 32.0% Operating expenses: Selling, general and administrative expenses 268 279 267 280 1,094 287 Depreciation and amortization 32 32 31 31 127 32 Total operating expenses 300 311 299 311 1,221 319 Operating income 135 153 103 114 505 132 Other (expense) income: Interest expense (15) (16) (17) (18) (66) (19) Write-off of discount and deferred financing costs - - - - - (1) Other income, net 2 2 2 3 8 2 Total other expense, net (13) (14) (15) (16) (58) (18) Income before taxes 122 139 88 98 448 114 Income tax expense 32 36 24 23 115 27 Net income 90$ 103$ 65$ 76$ 333$ 87$ Business Days 63 65 62 63 253 64 Net Sales by Business Day 21.6$ 22.0$ 19.9$ 20.7$ 21.1$ 22.0$ Beginning Branch Count 286 289 291 297 286 304 Added Branches 3 2 6 7 18 1 Ending Branch Count 289 291 297 304 304 305
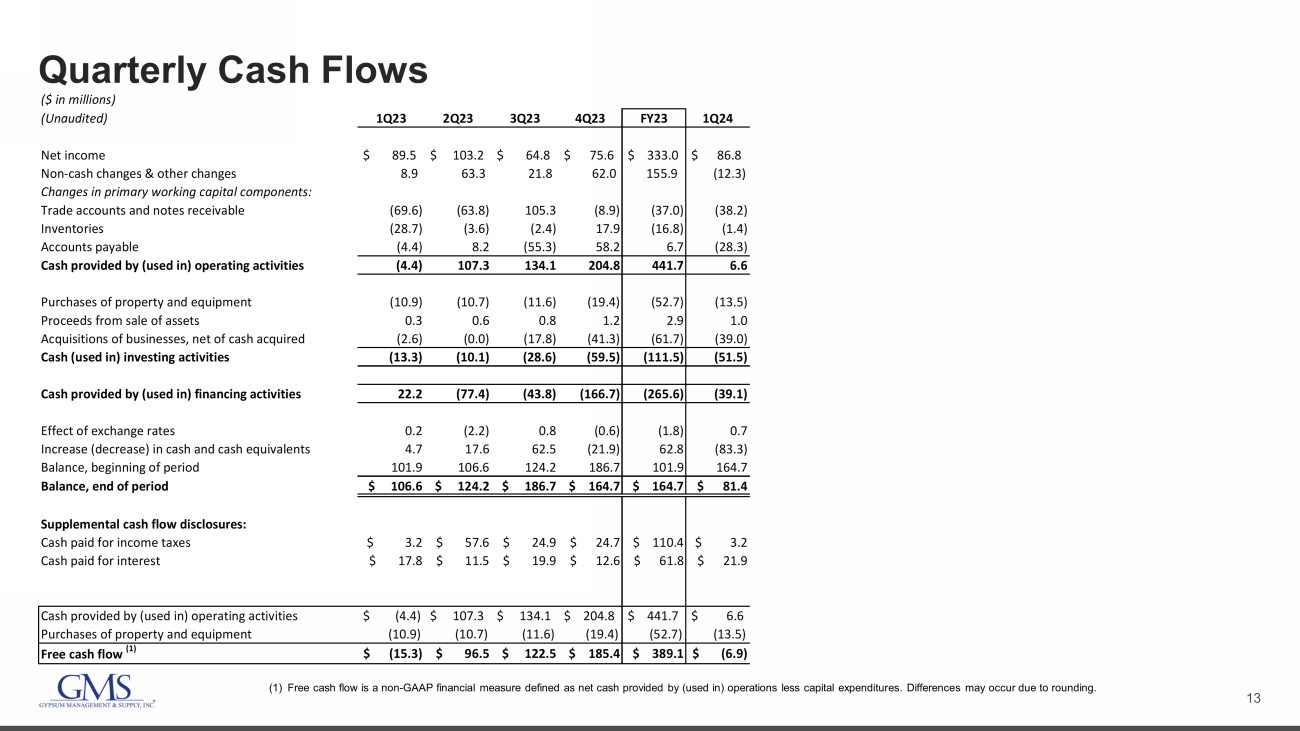
13 Quarterly Cash Flows (1) Free cash flow is a non - GAAP financial measure defined as net cash provided by (used in) operations less capital expenditures. D ifferences may occur due to rounding. ($ in millions) (Unaudited) 1Q23 2Q23 3Q23 4Q23 FY23 1Q24 Net income $ 89.5 $ 103.2 $ 64.8 $ 75.6 $ 333.0 $ 86.8 Non-cash changes & other changes 8.9 63.3 21.8 62.0 155.9 (12.3) Changes in primary working capital components: Trade accounts and notes receivable (69.6) (63.8) 105.3 (8.9) (37.0) (38.2) Inventories (28.7) (3.6) (2.4) 17.9 (16.8) (1.4) Accounts payable (4.4) 8.2 (55.3) 58.2 6.7 (28.3) Cash provided by (used in) operating activities (4.4) 107.3 134.1 204.8 441.7 6.6 Purchases of property and equipment (10.9) (10.7) (11.6) (19.4) (52.7) (13.5) Proceeds from sale of assets 0.3 0.6 0.8 1.2 2.9 1.0 Acquisitions of businesses, net of cash acquired (2.6) (0.0) (17.8) (41.3) (61.7) (39.0) Cash (used in) investing activities (13.3) (10.1) (28.6) (59.5) (111.5) (51.5) Cash provided by (used in) financing activities 22.2 (77.4) (43.8) (166.7) (265.6) (39.1) Effect of exchange rates 0.2 (2.2) 0.8 (0.6) (1.8) 0.7 Increase (decrease) in cash and cash equivalents 4.7 17.6 62.5 (21.9) 62.8 (83.3) Balance, beginning of period 101.9 106.6 124.2 186.7 101.9 164.7 Balance, end of period $ 106.6 $ 124.2 $ 186.7 $ 164.7 $ 164.7 $ 81.4 Supplemental cash flow disclosures: Cash paid for income taxes $ 3.2 $ 57.6 $ 24.9 $ 24.7 $ 110.4 $ 3.2 Cash paid for interest $ 17.8 $ 11.5 $ 19.9 $ 12.6 $ 61.8 $ 21.9 Cash provided by (used in) operating activities $ (4.4) $ 107.3 $ 134.1 $ 204.8 $ 441.7 $ 6.6 Purchases of property and equipment (10.9) (10.7) (11.6) (19.4) (52.7) (13.5) Free cash flow (1) $ (15.3) $ 96.5 $ 122.5 $ 185.4 $ 389.1 $ (6.9)
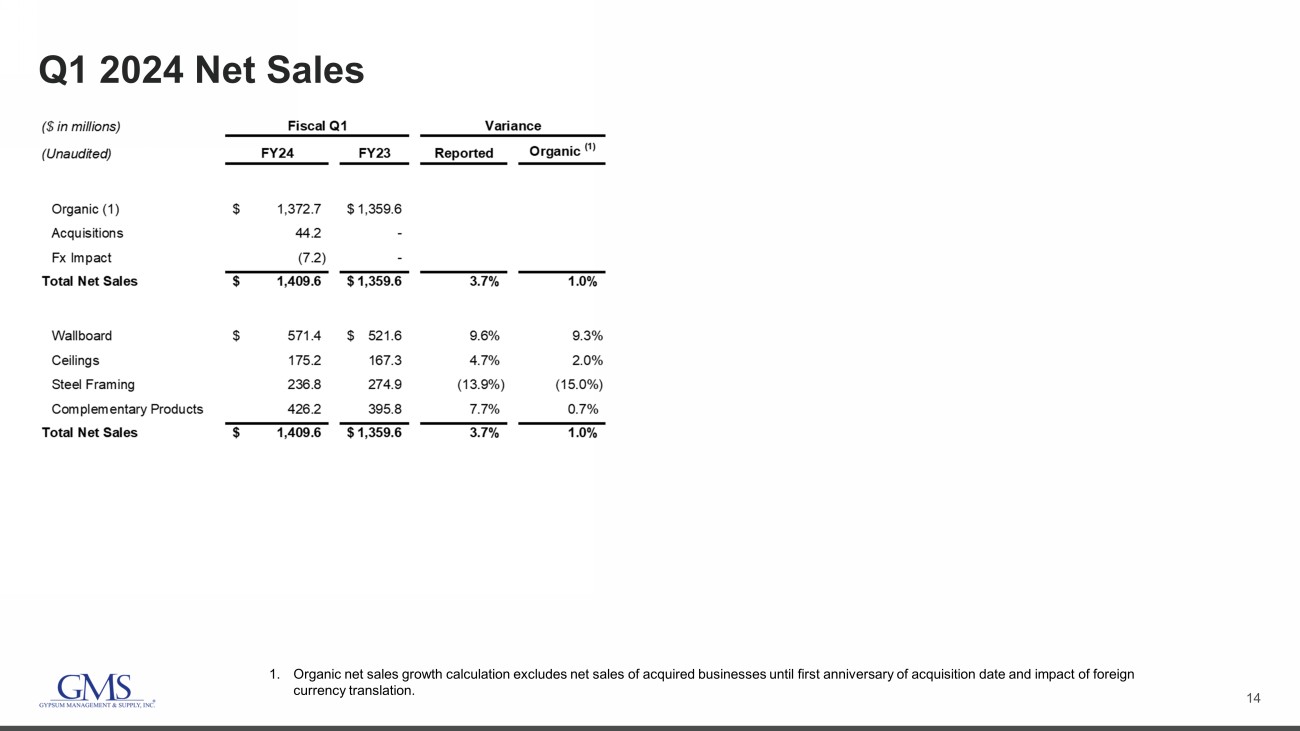
14 Q1 2024 Net Sales 1. Organic net sales growth calculation excludes net sales of acquired businesses until first anniversary of acquisition date an d i mpact of foreign currency translation.
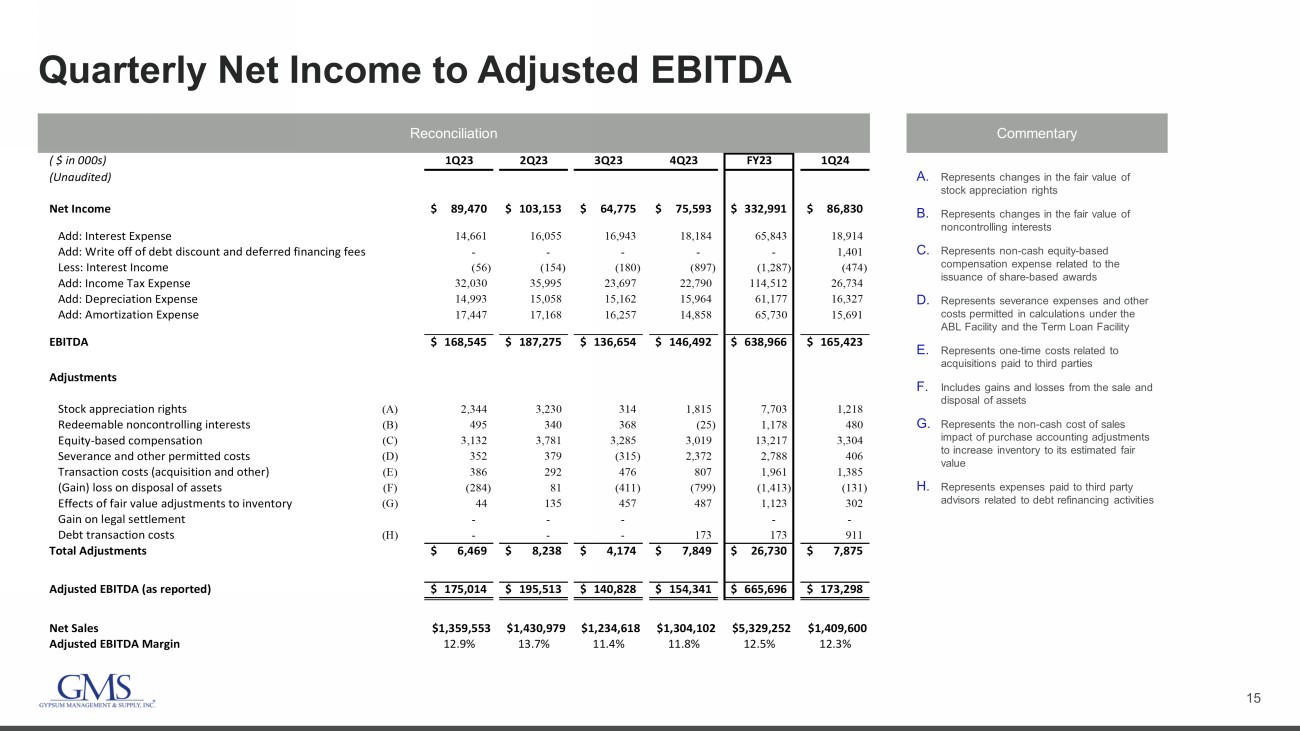
15 Quarterly Net Income to Adjusted EBITDA Reconciliation Commentary A. Represents changes in the fair value of stock appreciation rights B. Represents changes in the fair value of noncontrolling interests C. Represents non - cash equity - based compensation expense related to the issuance of share - based awards D. Represents severance expenses and other costs permitted in calculations under the ABL Facility and the Term Loan Facility E. Represents one - time costs related to acquisitions paid to third parties F. Includes gains and losses from the sale and disposal of assets G. Represents the non - cash cost of sales impact of purchase accounting adjustments to increase inventory to its estimated fair value H. Represents expenses paid to third party advisors related to debt refinancing activities ( $ in 000s) 1Q23 2Q23 3Q23 4Q23 FY23 1Q24 (Unaudited) Net Income 89,470$ 103,153$ 64,775$ 75,593$ 332,991$ 86,830$ Add: Interest Expense 14,661 16,055 16,943 18,184 65,843 18,914 Add: Write off of debt discount and deferred financing fees - - - - - 1,401 Less: Interest Income (56) (154) (180) (897) (1,287) (474) Add: Income Tax Expense 32,030 35,995 23,697 22,790 114,512 26,734 Add: Depreciation Expense 14,993 15,058 15,162 15,964 61,177 16,327 Add: Amortization Expense 17,447 17,168 16,257 14,858 65,730 15,691 EBITDA 168,545$ 187,275$ 136,654$ 146,492$ 638,966$ 165,423$ Adjustments Stock appreciation rights (A) 2,344 3,230 314 1,815 7,703 1,218 Redeemable noncontrolling interests (B) 495 340 368 (25) 1,178 480 Equity-based compensation (C) 3,132 3,781 3,285 3,019 13,217 3,304 Severance and other permitted costs (D) 352 379 (315) 2,372 2,788 406 Transaction costs (acquisition and other) (E) 386 292 476 807 1,961 1,385 (Gain) loss on disposal of assets (F) (284) 81 (411) (799) (1,413) (131) Effects of fair value adjustments to inventory (G) 44 135 457 487 1,123 302 Gain on legal settlement - - - - - Debt transaction costs (H) - - - 173 173 911 Total Adjustments 6,469$ 8,238$ 4,174$ 7,849$ 26,730$ 7,875$ Adjusted EBITDA (as reported) 175,014$ 195,513$ 140,828$ 154,341$ 665,696$ 173,298$ Net Sales $1,359,553 $1,430,979 $1,234,618 $1,304,102 $5,329,252 $1,409,600 Adjusted EBITDA Margin 12.9% 13.7% 11.4% 11.8% 12.5% 12.3%
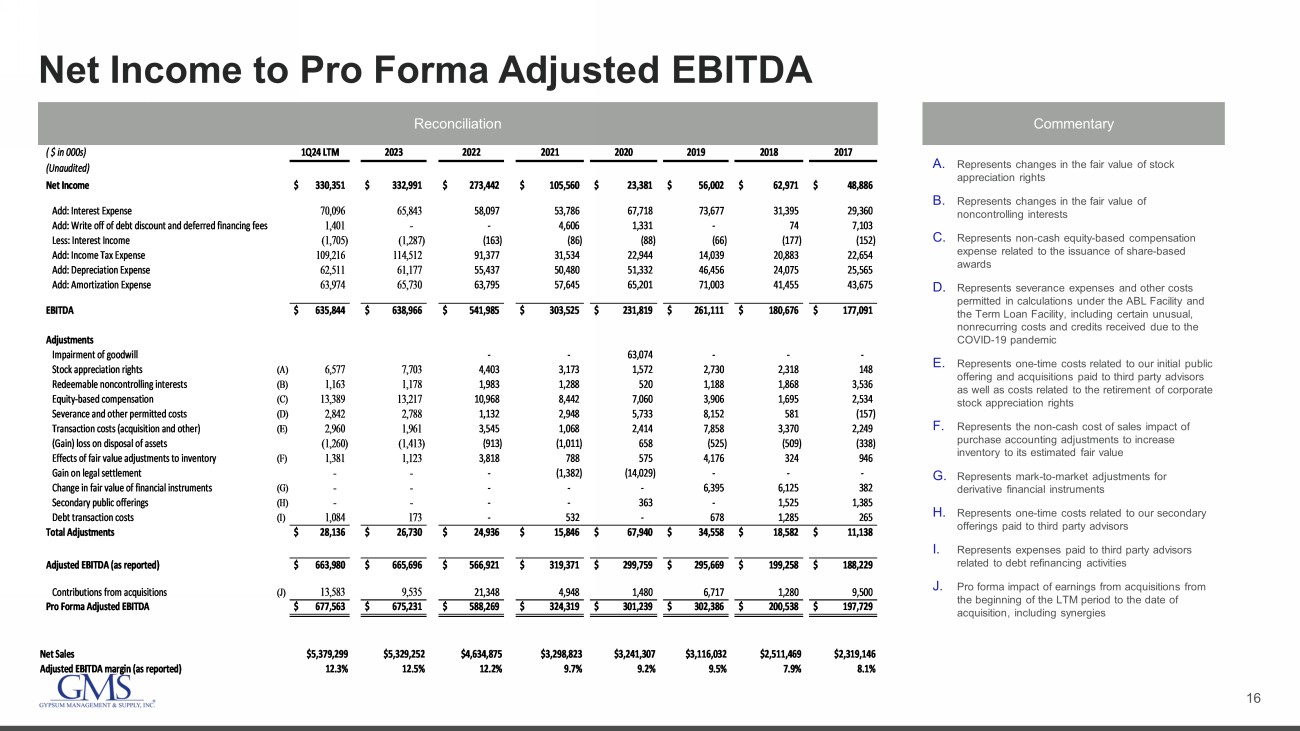
16 Net Income to Pro Forma Adjusted EBITDA Reconciliation Commentary A. Represents changes in the fair value of stock appreciation rights B. Represents changes in the fair value of noncontrolling interests C. Represents non - cash equity - based compensation expense related to the issuance of share - based awards D. Represents severance expenses and other costs permitted in calculations under the ABL Facility and the Term Loan Facility, including certain unusual, nonrecurring costs and credits received due to the COVID - 19 pandemic E. Represents one - time costs related to our initial public offering and acquisitions paid to third party advisors as well as costs related to the retirement of corporate stock appreciation rights F. Represents the non - cash cost of sales impact of purchase accounting adjustments to increase inventory to its estimated fair value G. Represents mark - to - market adjustments for derivative financial instruments H. Represents one - time costs related to our secondary offerings paid to third party advisors I. Represents expenses paid to third party advisors related to debt refinancing activities J. Pro forma impact of earnings from acquisitions from the beginning of the LTM period to the date of acquisition, including synergies ( $ in 000s) 1Q24 LTM 2023 2022 2021 2020 2019 2018 2017 (Unaudited) Net Income 330,351$ 332,991$ 273,442$ 105,560$ 23,381$ 56,002$ 62,971$ 48,886$ Add: Interest Expense 70,096 65,843 58,097 53,786 67,718 73,677 31,395 29,360 Add: Write off of debt discount and deferred financing fees 1,401 - - 4,606 1,331 - 74 7,103 Less: Interest Income (1,705) (1,287) (163) (86) (88) (66) (177) (152) Add: Income Tax Expense 109,216 114,512 91,377 31,534 22,944 14,039 20,883 22,654 Add: Depreciation Expense 62,511 61,177 55,437 50,480 51,332 46,456 24,075 25,565 Add: Amortization Expense 63,974 65,730 63,795 57,645 65,201 71,003 41,455 43,675 EBITDA 635,844$ 638,966$ 541,985$ 303,525$ 231,819$ 261,111$ 180,676$ 177,091$ Adjustments Impairment of goodwill - - 63,074 - - - Stock appreciation rights (A) 6,577 7,703 4,403 3,173 1,572 2,730 2,318 148 Redeemable noncontrolling interests (B) 1,163 1,178 1,983 1,288 520 1,188 1,868 3,536 Equity-based compensation (C) 13,389 13,217 10,968 8,442 7,060 3,906 1,695 2,534 Severance and other permitted costs (D) 2,842 2,788 1,132 2,948 5,733 8,152 581 (157) Transaction costs (acquisition and other) (E) 2,960 1,961 3,545 1,068 2,414 7,858 3,370 2,249 (Gain) loss on disposal of assets (1,260) (1,413) (913) (1,011) 658 (525) (509) (338) Effects of fair value adjustments to inventory (F) 1,381 1,123 3,818 788 575 4,176 324 946 Gain on legal settlement - - - (1,382) (14,029) - - - Change in fair value of financial instruments (G) - - - - - 6,395 6,125 382 Secondary public offerings (H) - - - - 363 - 1,525 1,385 Debt transaction costs (I) 1,084 173 - 532 - 678 1,285 265 Total Adjustments 28,136$ 26,730$ 24,936$ 15,846$ 67,940$ 34,558$ 18,582$ 11,138$ Adjusted EBITDA (as reported) 663,980$ 665,696$ 566,921$ 319,371$ 299,759$ 295,669$ 199,258$ 188,229$ Contributions from acquisitions (J) 13,583 9,535 21,348 4,948 1,480 6,717 1,280 9,500 Pro Forma Adjusted EBITDA 677,563$ 675,231$ 588,269$ 324,319$ 301,239$ 302,386$ 200,538$ 197,729$ Net Sales $5,379,299 $5,329,252 $4,634,875 $3,298,823 $3,241,307 $3,116,032 $2,511,469 $2,319,146 Adjusted EBITDA margin (as reported) 12.3% 12.5% 12.2% 9.7% 9.2% 9.5% 7.9% 8.1%
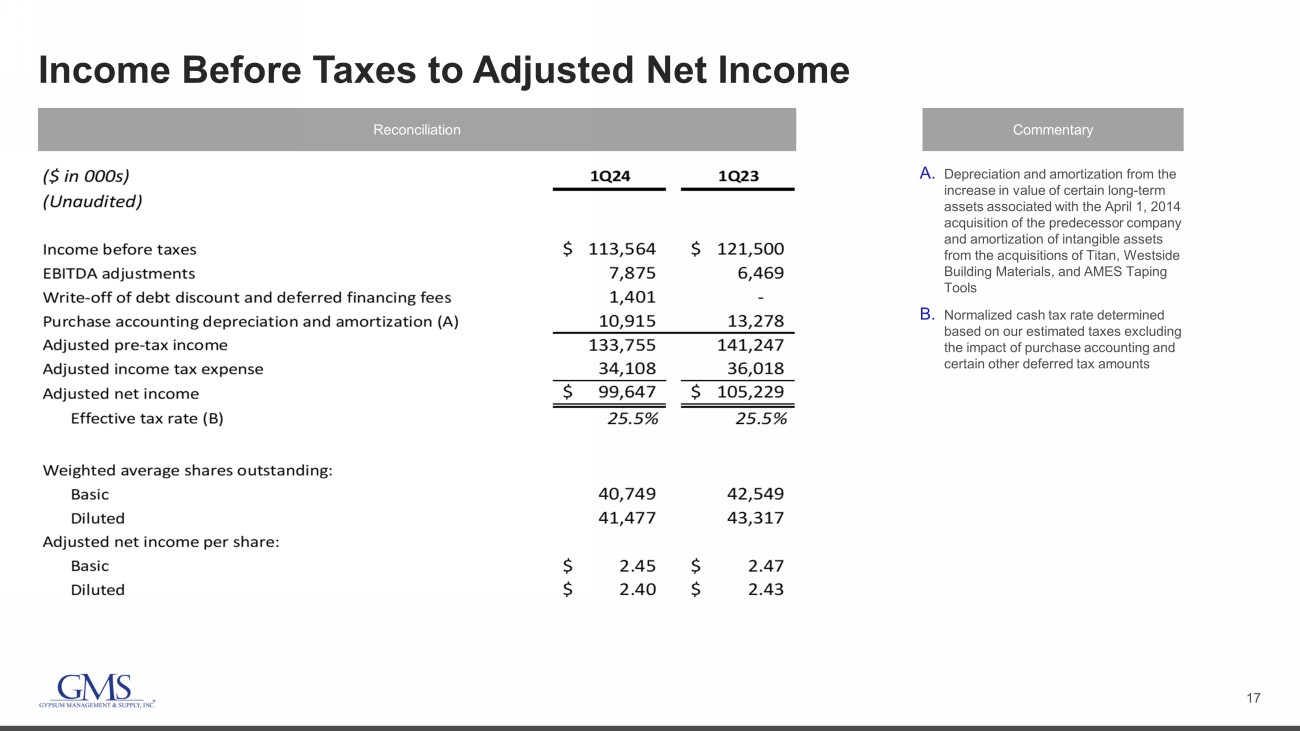
17 Income Before Taxes to Adjusted Net Income Reconciliation Commentary A. Depreciation and amortization from the increase in value of certain long - term assets associated with the April 1, 2014 acquisition of the predecessor company and amortization of intangible assets from the acquisitions of Titan, Westside Building Materials, and AMES Taping Tools B. Normalized cash tax rate determined based on our estimated taxes excluding the impact of purchase accounting and certain other deferred tax amounts
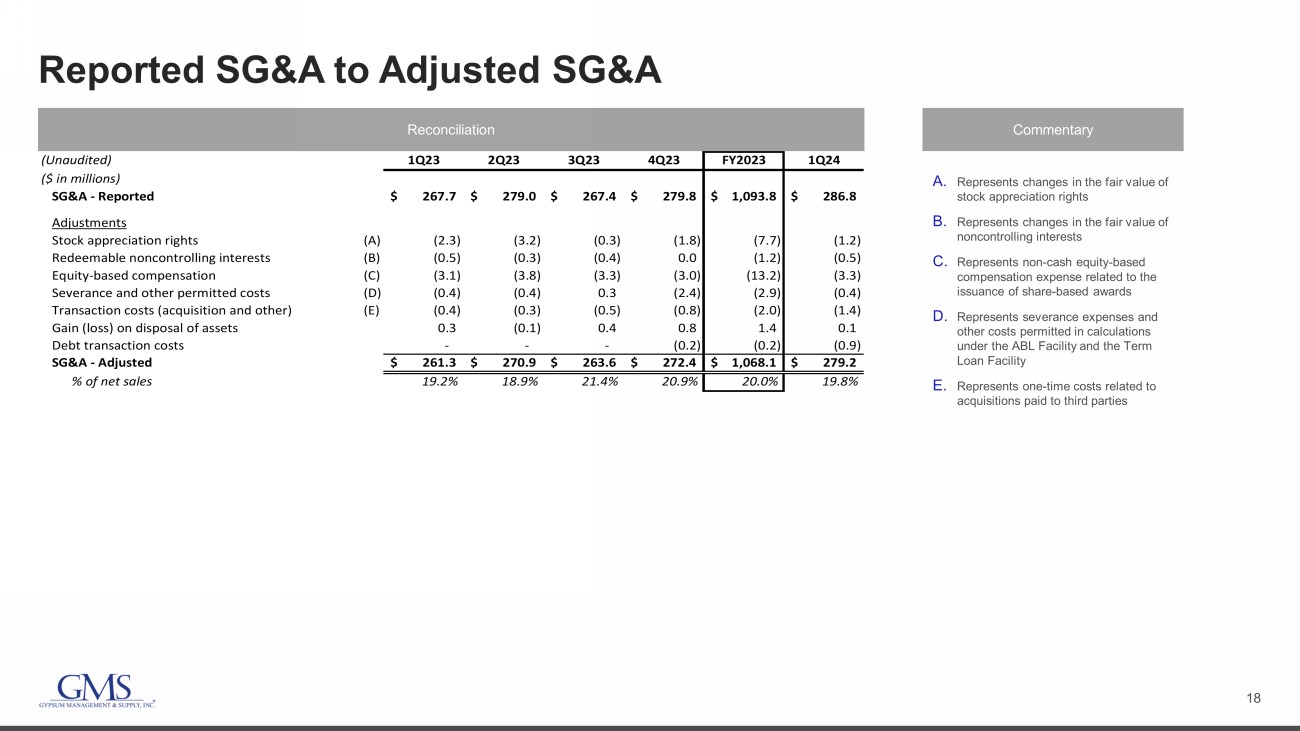
18 Reported SG&A to Adjusted SG&A Reconciliation Commentary A. Represents changes in the fair value of stock appreciation rights B. Represents changes in the fair value of noncontrolling interests C. Represents non - cash equity - based compensation expense related to the issuance of share - based awards D. Represents severance expenses and other costs permitted in calculations under the ABL Facility and the Term Loan Facility E. Represents one - time costs related to acquisitions paid to third parties (Unaudited) 1Q23 2Q23 3Q23 4Q23 FY2023 1Q24 ($ in millions) SG&A - Reported 267.7$ 279.0$ 267.4$ 279.8$ 1,093.8$ 286.8$ Adjustments Stock appreciation rights (A) (2.3) (3.2) (0.3) (1.8) (7.7) (1.2) Redeemable noncontrolling interests (B) (0.5) (0.3) (0.4) 0.0 (1.2) (0.5) Equity-based compensation (C) (3.1) (3.8) (3.3) (3.0) (13.2) (3.3) Severance and other permitted costs (D) (0.4) (0.4) 0.3 (2.4) (2.9) (0.4) Transaction costs (acquisition and other) (E) (0.4) (0.3) (0.5) (0.8) (2.0) (1.4) Gain (loss) on disposal of assets 0.3 (0.1) 0.4 0.8 1.4 0.1 Debt transaction costs - - - (0.2) (0.2) (0.9) SG&A - Adjusted 261.3$ 270.9$ 263.6$ 272.4$ 1,068.1$ 279.2$ % of net sales 19.2% 18.9% 21.4% 20.9% 20.0% 19.8%
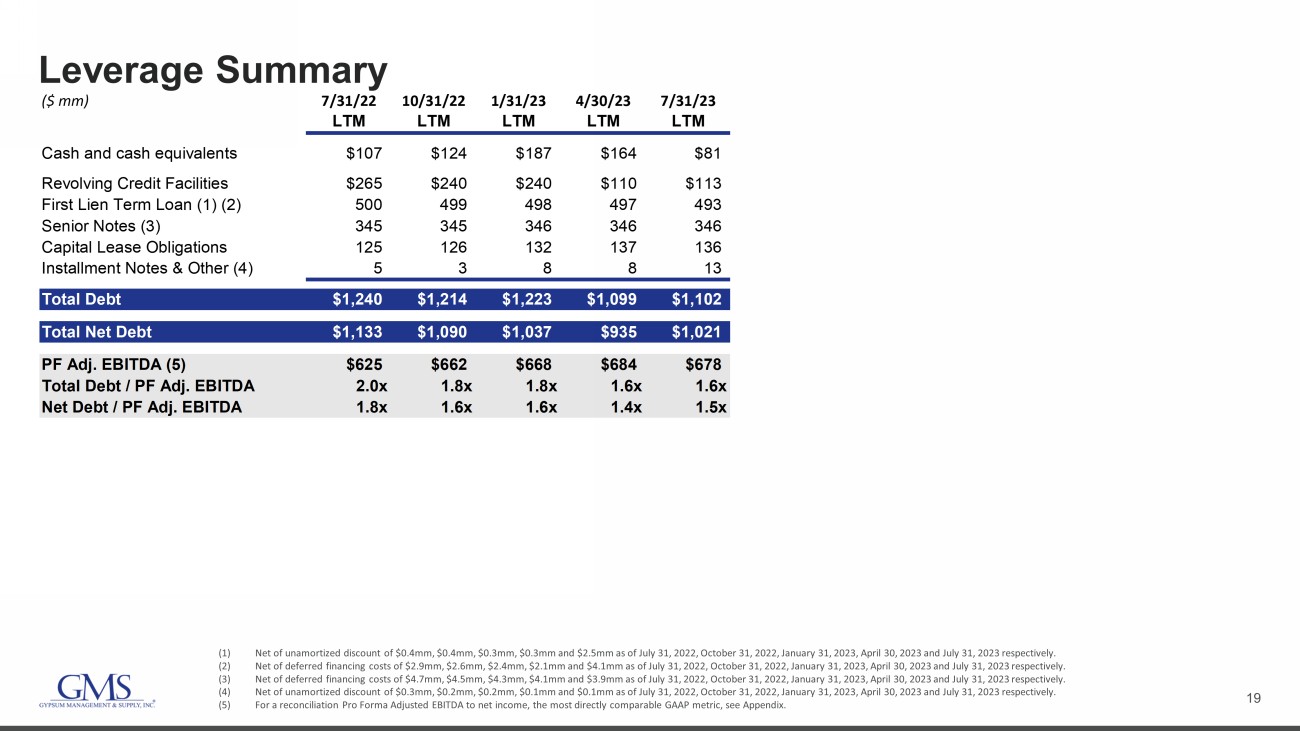
19 Leverage Summary (1) Net of unamortized discount of $0.4mm, $0.4mm, $0.3mm, $0.3mm and $2.5mm as of July 31, 2022, October 31, 2022, January 31, 2 023 , April 30, 2023 and July 31, 2023 respectively. (2) Net of deferred financing costs of $2.9mm, $2.6mm, $2.4mm, $2.1mm and $4.1mm as of July 31, 2022, October 31, 2022, January 3 1, 2023 , April 30, 2023 and July 31, 2023 respectively. (3) Net of deferred financing costs of $4.7mm, $4.5mm, $4.3mm, $4.1mm and $3.9mm as of July 31, 2022, October 31, 2022, January 3 1, 2023 , April 30, 2023 and July 31, 2023 respectively. (4) Net of unamortized discount of $0.3mm, $0.2mm, $0.2mm, $0.1mm and $0.1mm as of July 31, 2022, October 31, 2022, January 31, 2 023 , April 30, 2023 and July 31, 2023 respectively. (5) For a reconciliation Pro Forma Adjusted EBITDA to net income, the most directly comparable GAAP metric, see Appendix. ($ mm) 7/31/22 10/31/22 1/31/23 4/30/23 7/31/23 LTM LTM LTM LTM LTM Cash and cash equivalents $107 $124 $187 $164 $81 Revolving Credit Facilities $265 $240 $240 $110 $113 First Lien Term Loan (1) (2) 500 499 498 497 493 Senior Notes (3) 345 345 346 346 346 Capital Lease Obligations 125 126 132 137 136 Installment Notes & Other (4) 5 3 8 8 13 Total Debt $1,240 $1,214 $1,223 $1,099 $1,102 Total Net Debt $1,133 $1,090 $1,037 $935 $1,021 PF Adj. EBITDA (5) $625 $662 $668 $684 $678 Total Debt / PF Adj. EBITDA 2.0x 1.8x 1.8x 1.6x 1.6x Net Debt / PF Adj. EBITDA 1.8x 1.6x 1.6x 1.4x 1.5x
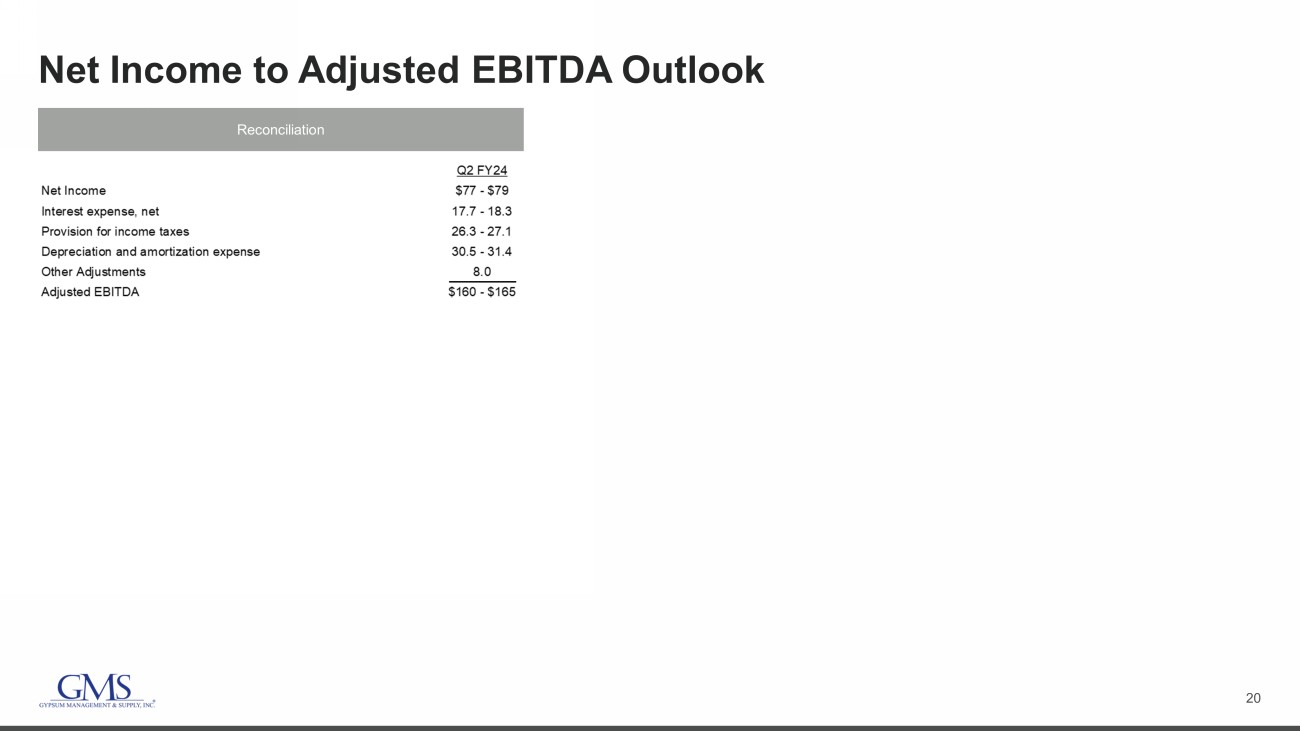
20 Net Income to Adjusted EBITDA Outlook Reconciliation
v3.23.2
| X |
- DefinitionBoolean flag that is true when the XBRL content amends previously-filed or accepted submission.
| Name: |
dei_AmendmentFlag |
| Namespace Prefix: |
dei_ |
| Data Type: |
xbrli:booleanItemType |
| Balance Type: |
na |
| Period Type: |
duration |
|
| X |
- DefinitionFor the EDGAR submission types of Form 8-K: the date of the report, the date of the earliest event reported; for the EDGAR submission types of Form N-1A: the filing date; for all other submission types: the end of the reporting or transition period. The format of the date is YYYY-MM-DD.
| Name: |
dei_DocumentPeriodEndDate |
| Namespace Prefix: |
dei_ |
| Data Type: |
xbrli:dateItemType |
| Balance Type: |
na |
| Period Type: |
duration |
|
| X |
- DefinitionThe type of document being provided (such as 10-K, 10-Q, 485BPOS, etc). The document type is limited to the same value as the supporting SEC submission type, or the word 'Other'.
| Name: |
dei_DocumentType |
| Namespace Prefix: |
dei_ |
| Data Type: |
dei:submissionTypeItemType |
| Balance Type: |
na |
| Period Type: |
duration |
|
| X |
- DefinitionAddress Line 1 such as Attn, Building Name, Street Name
| Name: |
dei_EntityAddressAddressLine1 |
| Namespace Prefix: |
dei_ |
| Data Type: |
xbrli:normalizedStringItemType |
| Balance Type: |
na |
| Period Type: |
duration |
|
| X |
- DefinitionAddress Line 2 such as Street or Suite number
| Name: |
dei_EntityAddressAddressLine2 |
| Namespace Prefix: |
dei_ |
| Data Type: |
xbrli:normalizedStringItemType |
| Balance Type: |
na |
| Period Type: |
duration |
|
| X |
- Definition
+ References
+ Details
| Name: |
dei_EntityAddressCityOrTown |
| Namespace Prefix: |
dei_ |
| Data Type: |
xbrli:normalizedStringItemType |
| Balance Type: |
na |
| Period Type: |
duration |
|
| X |
- DefinitionCode for the postal or zip code
| Name: |
dei_EntityAddressPostalZipCode |
| Namespace Prefix: |
dei_ |
| Data Type: |
xbrli:normalizedStringItemType |
| Balance Type: |
na |
| Period Type: |
duration |
|
| X |
- DefinitionName of the state or province.
| Name: |
dei_EntityAddressStateOrProvince |
| Namespace Prefix: |
dei_ |
| Data Type: |
dei:stateOrProvinceItemType |
| Balance Type: |
na |
| Period Type: |
duration |
|
| X |
- DefinitionA unique 10-digit SEC-issued value to identify entities that have filed disclosures with the SEC. It is commonly abbreviated as CIK. Reference 1: http://www.xbrl.org/2003/role/presentationRef
-Publisher SEC
-Name Exchange Act
-Number 240
-Section 12
-Subsection b-2
| Name: |
dei_EntityCentralIndexKey |
| Namespace Prefix: |
dei_ |
| Data Type: |
dei:centralIndexKeyItemType |
| Balance Type: |
na |
| Period Type: |
duration |
|
| X |
- DefinitionIndicate if registrant meets the emerging growth company criteria. Reference 1: http://www.xbrl.org/2003/role/presentationRef
-Publisher SEC
-Name Exchange Act
-Number 240
-Section 12
-Subsection b-2
| Name: |
dei_EntityEmergingGrowthCompany |
| Namespace Prefix: |
dei_ |
| Data Type: |
xbrli:booleanItemType |
| Balance Type: |
na |
| Period Type: |
duration |
|
| X |
- DefinitionCommission file number. The field allows up to 17 characters. The prefix may contain 1-3 digits, the sequence number may contain 1-8 digits, the optional suffix may contain 1-4 characters, and the fields are separated with a hyphen.
| Name: |
dei_EntityFileNumber |
| Namespace Prefix: |
dei_ |
| Data Type: |
dei:fileNumberItemType |
| Balance Type: |
na |
| Period Type: |
duration |
|
| X |
- DefinitionTwo-character EDGAR code representing the state or country of incorporation.
| Name: |
dei_EntityIncorporationStateCountryCode |
| Namespace Prefix: |
dei_ |
| Data Type: |
dei:edgarStateCountryItemType |
| Balance Type: |
na |
| Period Type: |
duration |
|
| X |
- DefinitionThe exact name of the entity filing the report as specified in its charter, which is required by forms filed with the SEC. Reference 1: http://www.xbrl.org/2003/role/presentationRef
-Publisher SEC
-Name Exchange Act
-Number 240
-Section 12
-Subsection b-2
| Name: |
dei_EntityRegistrantName |
| Namespace Prefix: |
dei_ |
| Data Type: |
xbrli:normalizedStringItemType |
| Balance Type: |
na |
| Period Type: |
duration |
|
| X |
- DefinitionThe Tax Identification Number (TIN), also known as an Employer Identification Number (EIN), is a unique 9-digit value assigned by the IRS. Reference 1: http://www.xbrl.org/2003/role/presentationRef
-Publisher SEC
-Name Exchange Act
-Number 240
-Section 12
-Subsection b-2
| Name: |
dei_EntityTaxIdentificationNumber |
| Namespace Prefix: |
dei_ |
| Data Type: |
dei:employerIdItemType |
| Balance Type: |
na |
| Period Type: |
duration |
|
| X |
- DefinitionLocal phone number for entity.
| Name: |
dei_LocalPhoneNumber |
| Namespace Prefix: |
dei_ |
| Data Type: |
xbrli:normalizedStringItemType |
| Balance Type: |
na |
| Period Type: |
duration |
|
| X |
- DefinitionBoolean flag that is true when the Form 8-K filing is intended to satisfy the filing obligation of the registrant as pre-commencement communications pursuant to Rule 13e-4(c) under the Exchange Act. Reference 1: http://www.xbrl.org/2003/role/presentationRef
-Publisher SEC
-Name Exchange Act
-Number 240
-Section 13e
-Subsection 4c
| Name: |
dei_PreCommencementIssuerTenderOffer |
| Namespace Prefix: |
dei_ |
| Data Type: |
xbrli:booleanItemType |
| Balance Type: |
na |
| Period Type: |
duration |
|
| X |
- DefinitionBoolean flag that is true when the Form 8-K filing is intended to satisfy the filing obligation of the registrant as pre-commencement communications pursuant to Rule 14d-2(b) under the Exchange Act. Reference 1: http://www.xbrl.org/2003/role/presentationRef
-Publisher SEC
-Name Exchange Act
-Number 240
-Section 14d
-Subsection 2b
| Name: |
dei_PreCommencementTenderOffer |
| Namespace Prefix: |
dei_ |
| Data Type: |
xbrli:booleanItemType |
| Balance Type: |
na |
| Period Type: |
duration |
|
| X |
- DefinitionTitle of a 12(b) registered security. Reference 1: http://www.xbrl.org/2003/role/presentationRef
-Publisher SEC
-Name Exchange Act
-Number 240
-Section 12
-Subsection b
| Name: |
dei_Security12bTitle |
| Namespace Prefix: |
dei_ |
| Data Type: |
dei:securityTitleItemType |
| Balance Type: |
na |
| Period Type: |
duration |
|
| X |
- DefinitionName of the Exchange on which a security is registered. Reference 1: http://www.xbrl.org/2003/role/presentationRef
-Publisher SEC
-Name Exchange Act
-Number 240
-Section 12
-Subsection d1-1
| Name: |
dei_SecurityExchangeName |
| Namespace Prefix: |
dei_ |
| Data Type: |
dei:edgarExchangeCodeItemType |
| Balance Type: |
na |
| Period Type: |
duration |
|
| X |
- DefinitionBoolean flag that is true when the Form 8-K filing is intended to satisfy the filing obligation of the registrant as soliciting material pursuant to Rule 14a-12 under the Exchange Act. Reference 1: http://www.xbrl.org/2003/role/presentationRef
-Publisher SEC
-Name Exchange Act
-Section 14a
-Number 240
-Subsection 12
| Name: |
dei_SolicitingMaterial |
| Namespace Prefix: |
dei_ |
| Data Type: |
xbrli:booleanItemType |
| Balance Type: |
na |
| Period Type: |
duration |
|
| X |
- DefinitionTrading symbol of an instrument as listed on an exchange.
| Name: |
dei_TradingSymbol |
| Namespace Prefix: |
dei_ |
| Data Type: |
dei:tradingSymbolItemType |
| Balance Type: |
na |
| Period Type: |
duration |
|
| X |
- DefinitionBoolean flag that is true when the Form 8-K filing is intended to satisfy the filing obligation of the registrant as written communications pursuant to Rule 425 under the Securities Act. Reference 1: http://www.xbrl.org/2003/role/presentationRef
-Publisher SEC
-Name Securities Act
-Number 230
-Section 425
| Name: |
dei_WrittenCommunications |
| Namespace Prefix: |
dei_ |
| Data Type: |
xbrli:booleanItemType |
| Balance Type: |
na |
| Period Type: |
duration |
|
GMS (NYSE:GMS)
과거 데이터 주식 차트
부터 4월(4) 2024 으로 5월(5) 2024

GMS (NYSE:GMS)
과거 데이터 주식 차트
부터 5월(5) 2023 으로 5월(5) 2024
