The
information in this preliminary pricing supplement is not complete and may be changed. A registration statement relating to these
notes has been filed with the Securities and Exchange Commission. This preliminary pricing supplement and the accompanying product
supplement, underlying supplement, prospectus supplement and prospectus are not an offer to sell these notes, nor are they soliciting
an offer to buy these notes, in any state where the offer or sale is not permitted.
SUBJECT
TO COMPLETION, DATED FEBRUARY 13, 2025 |
| Citigroup Global Markets Holdings Inc. |
February
, 2025
Medium-Term
Senior Notes, Series N
Pricing
Supplement No. 2025-USNCH25883
Filed
Pursuant to Rule 424(b)(2)
Registration
Statement Nos. 333-270327 and 333-270327-01 |
Autocallable Market-Linked Notes Linked to the S&P
500 Futures 35% Edge Volatility 6% Decrement Index (USD) ER Due March 5, 2035
Overview
| ▪ | The notes offered by this pricing supplement are unsecured senior debt securities issued by Citigroup Global Markets Holdings Inc.
and guaranteed by Citigroup Inc. Unlike conventional debt securities, the notes do not pay interest. Instead, the notes offer
the potential for automatic early redemption at a premium on a periodic basis on the terms described below. Your return on the notes will
depend on the performance of the S&P 500 Futures 35% Edge Volatility 6% Decrement Index (USD) ER (the “underlying”) specified
below. |
| ▪ | The notes offer the potential for automatic early redemption at a premium following the first valuation date (other than the final
valuation date) on which the closing value of the underlying is greater than or equal to the initial underlying value. If the notes are
not automatically redeemed prior to maturity, the notes will provide for repayment of the stated principal amount plus a premium
at maturity if the final underlying value is greater than or equal to the final premium threshold value. However, if the notes are
not automatically redeemed prior to maturity and the final underlying value is less than the final premium threshold value, you will be
repaid the stated principal amount of your notes at maturity but will not receive any return on your investment. You will not receive
dividends with respect to the underlying or participate in any appreciation of the underlying. |
| ▪ | The notes are designed for investors who are willing to forgo interest on the notes and accept the risk of not receiving any return
on the notes in exchange for the possibility of automatic early redemption at a premium or, if the notes are not automatically redeemed
prior to maturity, a premium at maturity, based in each case on the performance of the underlying. Investors should understand that there
is no guarantee that they will receive a positive return on their investment in the notes and that even if they do receive a positive
return, there is no assurance that their total return at maturity on the notes will compensate them for the effects of inflation or be
as great as the yield they could have achieved on a conventional debt security of ours of comparable maturity. |
| ▪ | The underlying is highly risky because it may reflect highly leveraged exposure to any decline in the S&P 500 Futures Excess
Return Index. The S&P 500 Futures Excess Return Index tracks futures contracts on the S&P 500® Index and is likely
to underperform the S&P 500® Index because of an implicit financing cost. In addition, the underlying is subject to
a decrement of 6% per annum, which will be a significant drag on its performance. You should carefully review the section “Summary
Risk Factors—Risks relating to the S&P 500 Futures 35% Edge Volatility 6% Decrement Index (USD) ER” in this pricing supplement. |
| ▪ | Investors in the notes must be willing to accept (i) an investment that may have limited or no liquidity and (ii) the risk of not
receiving any payments due under the notes if we and Citigroup Inc. default on our obligations. All payments on the notes are subject
to the credit risk of Citigroup Global Markets Holdings Inc. and Citigroup Inc. |
| KEY TERMS |
| Issuer: |
Citigroup Global Markets Holdings Inc., a wholly owned subsidiary of Citigroup Inc. |
| Guarantee: |
All payments due on the notes are fully and unconditionally guaranteed by Citigroup
Inc. |
| Underlying: |
The S&P 500 Futures 35% Edge Volatility 6% Decrement Index (USD) ER |
| Stated principal amount: |
$1,000 per note |
| Pricing date: |
February 26, 2025 |
| Issue date: |
February 28, 2025 |
| Maturity date: |
Unless earlier redeemed, March 5, 2035 |
| Automatic early redemption: |
If, on any valuation date prior to the final valuation date, the closing value of the
underlying is greater than or equal to the initial underlying value, the notes will be automatically redeemed on the third business
day immediately following that valuation date for an amount in cash per note equal to $1,000 plus the premium applicable to that
valuation date. If the notes are automatically redeemed following any valuation date prior to the final valuation date, they will
cease to be outstanding and you will no longer have the opportunity to receive the premium applicable to any later valuation date. |
| Payment at maturity: |
If the notes are not automatically
redeemed prior to maturity, you will receive at maturity for each note you then hold:
§
If
the final underlying value is greater than or equal to the final premium threshold value:
$1,000 + the premium applicable
to the final valuation date
§
If
the final underlying value is less than the final premium threshold value:
$1,000 |
| Initial underlying value: |
, the closing value of the underlying
on the pricing date |
| Final underlying value: |
The closing value of the underlying on the final valuation date |
| Final premium threshold value: |
, 60% of the initial underlying
value |
| Listing: |
The notes will not be listed on any securities exchange |
| Underwriter: |
Citigroup Global Markets Inc. (“CGMI”), an affiliate of the issuer,
acting as principal |
| Underwriting fee and issue price: |
Issue price(1) |
Underwriting fee(2) |
Proceeds to issuer |
| Per note: |
$1,000.00 |
$50.00 |
$950.00 |
| Total: |
$ |
$ |
$ |
(Key Terms continued
on next page)
(1) Citigroup Global Markets Holdings
Inc. currently expects that the estimated value of the notes on the pricing date will be at least $850.00 per note, which will be less
than the issue price. The estimated value of the notes is based on CGMI’s proprietary pricing models and our internal funding rate.
It is not an indication of actual profit to CGMI or other of our affiliates, nor is it an indication of the price, if any, at which CGMI
or any other person may be willing to buy the notes from you at any time after issuance. See “Valuation of the Notes” in
this pricing supplement.
(2) For more information on the distribution
of the notes, see “Supplemental Plan of Distribution” in this pricing supplement. In addition to the underwriting fee, CGMI
and its affiliates may profit from expected hedging activity related to this offering, even if the value of the notes declines. See “Use
of Proceeds and Hedging” in the accompanying prospectus.
Concurrent with this offering of the notes,
the issuer is offering other notes that are similar to the notes but that have economic terms that differ from those provided by the
notes. The differences in the economic terms reflect differences in costs to the issuer in connection with the distribution of the notes
and such other notes.
Investing in the notes involves risks
not associated with an investment in conventional debt securities. See “Summary Risk Factors” beginning on page PS-9.
Neither the Securities
and Exchange Commission (the “SEC”) nor any state securities commission has approved or disapproved of the notes or determined
that this pricing supplement and the accompanying product supplement, underlying supplement, prospectus supplement and prospectus are
truthful or complete. Any representation to the contrary is a criminal offense.
You should read
this pricing supplement together with the accompanying product supplement, underlying supplement, prospectus supplement and prospectus,
which can be accessed via the hyperlinks below:
Prospectus
Supplement and Prospectus each dated March 7, 2023
The notes are not
bank deposits and are not insured or guaranteed by the Federal Deposit Insurance Corporation or any other governmental agency, nor are
they obligations of, or guaranteed by, a bank.
| Citigroup Global Markets Holdings Inc. |
| |
| KEY TERMS (continued) |
| Valuation dates and premiums: |
The premium applicable to each valuation
date is the percentage of the stated principal amount set forth below. The premium may be significantly less than the appreciation
of the underlying from the pricing date to the applicable valuation date.
|
| |
Valuation date* |
Premium |
| |
March 1, 2027 |
20.0000% of the stated principal amount |
| |
March 29, 2027 |
20.8333% of the stated principal amount |
| |
April 28, 2027 |
21.6667% of the stated principal amount |
| |
May 28, 2027 |
22.5000% of the stated principal amount |
| |
June 28, 2027 |
23.3333% of the stated principal amount |
| |
July 28, 2027 |
24.1667% of the stated principal amount |
| |
August 30, 2027 |
25.0000% of the stated principal amount |
| |
September 28, 2027 |
25.8333% of the stated principal amount |
| |
October 28, 2027 |
26.6667% of the stated principal amount |
| |
November 29, 2027 |
27.5000% of the stated principal amount |
| |
December 28, 2027 |
28.3333% of the stated principal amount |
| |
January 28, 2028 |
29.1667% of the stated principal amount |
| |
February 28, 2028 |
30.0000% of the stated principal amount |
| |
March 28, 2028 |
30.8333% of the stated principal amount |
| |
April 28, 2028 |
31.6667% of the stated principal amount |
| |
May 30, 2028 |
32.5000% of the stated principal amount |
| |
June 28, 2028 |
33.3333% of the stated principal amount |
| |
July 28, 2028 |
34.1667% of the stated principal amount |
| |
August 28, 2028 |
35.0000% of the stated principal amount |
| |
September 28, 2028 |
35.8333% of the stated principal amount |
| |
October 30, 2028 |
36.6667% of the stated principal amount |
| |
November 28, 2028 |
37.5000% of the stated principal amount |
| |
December 28, 2028 |
38.3333% of the stated principal amount |
| |
January 29, 2029 |
39.1667% of the stated principal amount |
| |
February 28, 2029 |
40.0000% of the stated principal amount |
| |
March 28, 2029 |
40.8333% of the stated principal amount |
| |
April 30, 2029 |
41.6667% of the stated principal amount |
| |
May 29, 2029 |
42.5000% of the stated principal amount |
| |
June 28, 2029 |
43.3333% of the stated principal amount |
| |
July 30, 2029 |
44.1667% of the stated principal amount |
| |
August 28, 2029 |
45.0000% of the stated principal amount |
| |
September 28, 2029 |
45.8333% of the stated principal amount |
| |
October 29, 2029 |
46.6667% of the stated principal amount |
| |
November 28, 2029 |
47.5000% of the stated principal amount |
| |
December 28, 2029 |
48.3333% of the stated principal amount |
| |
January 28, 2030 |
49.1667% of the stated principal amount |
| |
February 28, 2030 |
50.0000% of the stated principal amount |
| |
March 28, 2030 |
50.8333% of the stated principal amount |
| |
April 29, 2030 |
51.6667% of the stated principal amount |
| |
May 28, 2030 |
52.5000% of the stated principal amount |
| |
June 28, 2030 |
53.3333% of the stated principal amount |
| |
July 29, 2030 |
54.1667% of the stated principal amount |
| |
August 28, 2030 |
55.0000% of the stated principal amount |
| |
September 30, 2030 |
55.8333% of the stated principal amount |
| |
October 28, 2030 |
56.6667% of the stated principal amount |
| |
November 29, 2030 |
57.5000% of the stated principal amount |
| |
December 30, 2030 |
58.3333% of the stated principal amount |
| |
January 28, 2031 |
59.1667% of the stated principal amount |
| |
February 28, 2031 |
60.0000% of the stated principal amount |
| |
March 28, 2031 |
60.8333% of the stated principal amount |
| |
April 28, 2031 |
61.6667% of the stated principal amount |
| |
May 28, 2031 |
62.5000% of the stated principal amount |
| |
June 30, 2031 |
63.3333% of the stated principal amount |
| |
July 28, 2031 |
64.1667% of the stated principal amount |
| |
August 28, 2031 |
65.0000% of the stated principal amount |
| |
September 29, 2031 |
65.8333% of the stated principal amount |
| |
October 28, 2031 |
66.6667% of the stated principal amount |
| |
November 28, 2031 |
67.5000% of the stated principal amount |
| |
December 29, 2031 |
68.3333% of the stated principal amount |
| |
January 28, 2032 |
69.1667% of the stated principal amount |
| |
March 1, 2032 |
70.0000% of the stated principal amount |
| |
March 29, 2032 |
70.8333% of the stated principal amount |
| |
April 28, 2032 |
71.6667% of the stated principal amount |
| |
May 28, 2032 |
72.5000% of the stated principal amount |
| |
June 28, 2032 |
73.3333% of the stated principal amount |
| |
July 28, 2032 |
74.1667% of the stated principal amount |
| |
August 30, 2032 |
75.0000% of the stated principal amount |
| |
September 28, 2032 |
75.8333% of the stated principal amount |
| |
October 28, 2032 |
76.6667% of the stated principal amount |
| Citigroup Global Markets Holdings Inc. |
| |
| |
November 29, 2032 |
77.5000% of the stated principal amount |
| |
December 28, 2032 |
78.3333% of the stated principal amount |
| |
January 28, 2033 |
79.1667% of the stated principal amount |
| |
February 28, 2033 |
80.0000% of the stated principal amount |
| |
March 28, 2033 |
80.8333% of the stated principal amount |
| |
April 28, 2033 |
81.6667% of the stated principal amount |
| |
May 31, 2033 |
82.5000% of the stated principal amount |
| |
June 28, 2033 |
83.3333% of the stated principal amount |
| |
July 28, 2033 |
84.1667% of the stated principal amount |
| |
August 29, 2033 |
85.0000% of the stated principal amount |
| |
September 28, 2033 |
85.8333% of the stated principal amount |
| |
October 28, 2033 |
86.6667% of the stated principal amount |
| |
November 28, 2033 |
87.5000% of the stated principal amount |
| |
December 28, 2033 |
88.3333% of the stated principal amount |
| |
January 30, 2034 |
89.1667% of the stated principal amount |
| |
February 28, 2034 |
90.0000% of the stated principal amount |
| |
March 28, 2034 |
90.8333% of the stated principal amount |
| |
April 28, 2034 |
91.6667% of the stated principal amount |
| |
May 30, 2034 |
92.5000% of the stated principal amount |
| |
June 28, 2034 |
93.3333% of the stated principal amount |
| |
July 28, 2034 |
94.1667% of the stated principal amount |
| |
August 28, 2034 |
95.0000% of the stated principal amount |
| |
September 28, 2034 |
95.8333% of the stated principal amount |
| |
October 30, 2034 |
96.6667% of the stated principal amount |
| |
November 28, 2034 |
97.5000% of the stated principal amount |
| |
December 28, 2034 |
98.3333% of the stated principal amount |
| |
January 29, 2035 |
99.1667% of the stated principal amount |
| |
February 28, 2035 (the “final valuation date”) |
100.0000% of the stated principal amount |
| |
*Each valuation date is subject to
postponement if such date is not a scheduled trading day or certain market disruption events occur
|
| CUSIP / ISIN: |
17333HVC5 / US17333HVC59 |
| Citigroup Global Markets Holdings Inc. |
| |
Additional Information
General. The terms of the notes are set forth in the accompanying
product supplement, prospectus supplement and prospectus, as supplemented by this pricing supplement. The accompanying product supplement,
prospectus supplement and prospectus contain important disclosures that are not repeated in this pricing supplement. For example, the
accompanying product supplement contains important information about how the closing value of the underlying will be determined and about
adjustments that may be made to the terms of the notes upon the occurrence of market disruption events and other specified events with
respect to the underlying. The accompanying underlying supplement contains important disclosures regarding the S&P 500® Index,
on which the S&P 500 Futures 35% Edge Volatility 6% Decrement Index (USD) ER is ultimately based. It is important that you read the
accompanying product supplement, underlying supplement, prospectus supplement and prospectus together with this pricing supplement in
deciding whether to invest in the notes. Certain terms used but not defined in this pricing supplement are defined in the accompanying
product supplement.
Closing value. The closing value of the underlying is its closing
level, as described in the accompanying product supplement.
| Citigroup Global Markets Holdings Inc. |
| |
Hypothetical Payment Upon Automatic Early Redemption
The following table illustrates how the amount payable per note upon
automatic early redemption will be calculated if the closing value of the underlying on any valuation date prior to the final valuation
date is greater than or equal to the initial underlying value.
| If the first valuation date on which the closing value of the underlying is greater than or equal to the initial underlying value is... |
...then you will receive the following payment per note upon automatic early redemption: |
| 1st valuation date |
$1,000 + applicable premium = $1,000 + $200.000 = $1,200.000 |
| 2nd valuation date |
$1,000 + applicable premium = $1,000 + $208.333 = $1,208.333 |
| 3rd valuation date |
$1,000 + applicable premium = $1,000 + $216.667 = $1,216.667 |
| 4th valuation date |
$1,000 + applicable premium = $1,000 + $225.000 = $1,225.000 |
| 5th valuation date |
$1,000 + applicable premium = $1,000 + $233.333 = $1,233.333 |
| 6th valuation date |
$1,000 + applicable premium = $1,000 + $241.667 = $1,241.667 |
| 7th valuation date |
$1,000 + applicable premium = $1,000 + $250.000 = $1,250.000 |
| 8th valuation date |
$1,000 + applicable premium = $1,000 + $258.333 = $1,258.333 |
| 9th valuation date |
$1,000 + applicable premium = $1,000 + $266.667 = $1,266.667 |
| 10th valuation date |
$1,000 + applicable premium = $1,000 + $275.000 = $1,275.000 |
| 11th valuation date |
$1,000 + applicable premium = $1,000 + $283.333 = $1,283.333 |
| 12th valuation date |
$1,000 + applicable premium = $1,000 + $291.667 = $1,291.667 |
| 13th valuation date |
$1,000 + applicable premium = $1,000 + $300.000 = $1,300.000 |
| 14th valuation date |
$1,000 + applicable premium = $1,000 + $308.333 = $1,308.333 |
| 15th valuation date |
$1,000 + applicable premium = $1,000 + $316.667 = $1,316.667 |
| 16th valuation date |
$1,000 + applicable premium = $1,000 + $325.000 = $1,325.000 |
| 17th valuation date |
$1,000 + applicable premium = $1,000 + $333.333 = $1,333.333 |
| 18th valuation date |
$1,000 + applicable premium = $1,000 + $341.667 = $1,341.667 |
| 19th valuation date |
$1,000 + applicable premium = $1,000 + $350.000 = $1,350.000 |
| 20th valuation date |
$1,000 + applicable premium = $1,000 + $358.333 = $1,358.333 |
| 21st valuation date |
$1,000 + applicable premium = $1,000 + $366.667 = $1,366.667 |
| 22nd valuation date |
$1,000 + applicable premium = $1,000 + $375.000 = $1,375.000 |
| 23rd valuation date |
$1,000 + applicable premium = $1,000 + $383.333 = $1,383.333 |
| 24th valuation date |
$1,000 + applicable premium = $1,000 + $391.667 = $1,391.667 |
| 25th valuation date |
$1,000 + applicable premium = $1,000 + $400.000 = $1,400.000 |
| 26th valuation date |
$1,000 + applicable premium = $1,000 + $408.333 = $1,408.333 |
| 27th valuation date |
$1,000 + applicable premium = $1,000 + $416.667 = $1,416.667 |
| 28th valuation date |
$1,000 + applicable premium = $1,000 + $425.000 = $1,425.000 |
| 29th valuation date |
$1,000 + applicable premium = $1,000 + $433.333 = $1,433.333 |
| 30th valuation date |
$1,000 + applicable premium = $1,000 + $441.667 = $1,441.667 |
| 31st valuation date |
$1,000 + applicable premium = $1,000 + $450.000 = $1,450.000 |
| 32nd valuation date |
$1,000 + applicable premium = $1,000 + $458.333 = $1,458.333 |
| 33rd valuation date |
$1,000 + applicable premium = $1,000 + $466.667 = $1,466.667 |
| 34th valuation date |
$1,000 + applicable premium = $1,000 + $475.000 = $1,475.000 |
| 35th valuation date |
$1,000 + applicable premium = $1,000 + $483.333 = $1,483.333 |
| 36th valuation date |
$1,000 + applicable premium = $1,000 + $491.667 = $1,491.667 |
| 37th valuation date |
$1,000 + applicable premium = $1,000 + $500.000 = $1,500.000 |
| 38th valuation date |
$1,000 + applicable premium = $1,000 + $508.333 = $1,508.333 |
| 39th valuation date |
$1,000 + applicable premium = $1,000 + $516.667 = $1,516.667 |
| 40th valuation date |
$1,000 + applicable premium = $1,000 + $525.000 = $1,525.000 |
| 41st valuation date |
$1,000 + applicable premium = $1,000 + $533.333 = $1,533.333 |
| 42nd valuation date |
$1,000 + applicable premium = $1,000 + $541.667 = $1,541.667 |
| 43rd valuation date |
$1,000 + applicable premium = $1,000 + $550.000 = $1,550.000 |
| 44th valuation date |
$1,000 + applicable premium = $1,000 + $558.333 = $1,558.333 |
| 45th valuation date |
$1,000 + applicable premium = $1,000 + $566.667 = $1,566.667 |
| 46th valuation date |
$1,000 + applicable premium = $1,000 + $575.000 = $1,575.000 |
| 47th valuation date |
$1,000 + applicable premium = $1,000 + $583.333 = $1,583.333 |
| 48th valuation date |
$1,000 + applicable premium = $1,000 + $591.667 = $1,591.667 |
| 49th valuation date |
$1,000 + applicable premium = $1,000 + $600.000 = $1,600.000 |
| Citigroup Global Markets Holdings Inc. |
| |
| 50th valuation date |
$1,000 + applicable premium = $1,000 + $608.333 = $1,608.333 |
| 51st valuation date |
$1,000 + applicable premium = $1,000 + $616.667 = $1,616.667 |
| 52nd valuation date |
$1,000 + applicable premium = $1,000 + $625.000 = $1,625.000 |
| 53rd valuation date |
$1,000 + applicable premium = $1,000 + $633.333 = $1,633.333 |
| 54th valuation date |
$1,000 + applicable premium = $1,000 + $641.667 = $1,641.667 |
| 55th valuation date |
$1,000 + applicable premium = $1,000 + $650.000 = $1,650.000 |
| 56th valuation date |
$1,000 + applicable premium = $1,000 + $658.333 = $1,658.333 |
| 57th valuation date |
$1,000 + applicable premium = $1,000 + $666.667 = $1,666.667 |
| 58th valuation date |
$1,000 + applicable premium = $1,000 + $675.000 = $1,675.000 |
| 59th valuation date |
$1,000 + applicable premium = $1,000 + $683.333 = $1,683.333 |
| 60th valuation date |
$1,000 + applicable premium = $1,000 + $691.667 = $1,691.667 |
| 61st valuation date |
$1,000 + applicable premium = $1,000 + $700.000 = $1,700.000 |
| 62nd valuation date |
$1,000 + applicable premium = $1,000 + $708.333 = $1,708.333 |
| 63rd valuation date |
$1,000 + applicable premium = $1,000 + $716.667 = $1,716.667 |
| 64th valuation date |
$1,000 + applicable premium = $1,000 + $725.000 = $1,725.000 |
| 65th valuation date |
$1,000 + applicable premium = $1,000 + $733.333 = $1,733.333 |
| 66th valuation date |
$1,000 + applicable premium = $1,000 + $741.667 = $1,741.667 |
| 67th valuation date |
$1,000 + applicable premium = $1,000 + $750.000 = $1,750.000 |
| 68th valuation date |
$1,000 + applicable premium = $1,000 + $758.333 = $1,758.333 |
| 69th valuation date |
$1,000 + applicable premium = $1,000 + $766.667 = $1,766.667 |
| 70th valuation date |
$1,000 + applicable premium = $1,000 + $775.000 = $1,775.000 |
| 71st valuation date |
$1,000 + applicable premium = $1,000 + $783.333 = $1,783.333 |
| 72nd valuation date |
$1,000 + applicable premium = $1,000 + $791.667 = $1,791.667 |
| 73rd valuation date |
$1,000 + applicable premium = $1,000 + $800.000 = $1,800.000 |
| 74th valuation date |
$1,000 + applicable premium = $1,000 + $808.333 = $1,808.333 |
| 75th valuation date |
$1,000 + applicable premium = $1,000 + $816.667 = $1,816.667 |
| 76th valuation date |
$1,000 + applicable premium = $1,000 + $825.000 = $1,825.000 |
| 77th valuation date |
$1,000 + applicable premium = $1,000 + $833.333 = $1,833.333 |
| 78th valuation date |
$1,000 + applicable premium = $1,000 + $841.667 = $1,841.667 |
| 79th valuation date |
$1,000 + applicable premium = $1,000 + $850.000 = $1,850.000 |
| 80th valuation date |
$1,000 + applicable premium = $1,000 + $858.333 = $1,858.333 |
| 81st valuation date |
$1,000 + applicable premium = $1,000 + $866.667 = $1,866.667 |
| 82nd valuation date |
$1,000 + applicable premium = $1,000 + $875.000 = $1,875.000 |
| 83rd valuation date |
$1,000 + applicable premium = $1,000 + $883.333 = $1,883.333 |
| 84th valuation date |
$1,000 + applicable premium = $1,000 + $891.667 = $1,891.667 |
| 85th valuation date |
$1,000 + applicable premium = $1,000 + $900.000 = $1,900.000 |
| 86th valuation date |
$1,000 + applicable premium = $1,000 + $908.333 = $1,908.333 |
| 87th valuation date |
$1,000 + applicable premium = $1,000 + $916.667 = $1,916.667 |
| 88th valuation date |
$1,000 + applicable premium = $1,000 + $925.000 = $1,925.000 |
| 89th valuation date |
$1,000 + applicable premium = $1,000 + $933.333 = $1,933.333 |
| 90th valuation date |
$1,000 + applicable premium = $1,000 + $941.667 = $1,941.667 |
| 91st valuation date |
$1,000 + applicable premium = $1,000 + $950.000 = $1,950.000 |
| 92nd valuation date |
$1,000 + applicable premium = $1,000 + $958.333 = $1,958.333 |
| 93rd valuation date |
$1,000 + applicable premium = $1,000 + $966.667 = $1,966.667 |
| 94th valuation date |
$1,000 + applicable premium = $1,000 + $975.000 = $1,975.000 |
| 95th valuation date |
$1,000 + applicable premium = $1,000 + $983.333 = $1,983.333 |
| 96th valuation date |
$1,000 + applicable premium = $1,000 + $991.667 = $1,991.667 |
If, on any valuation date prior to the final valuation date, the
closing value of the underlying is less than the initial underlying value, you will not receive the premium indicated above following
that valuation date. In order to receive the premium indicated above, the closing value of the underlying on the applicable valuation
date must be greater than or equal to the initial underlying value.
| Citigroup Global Markets Holdings Inc. |
| |
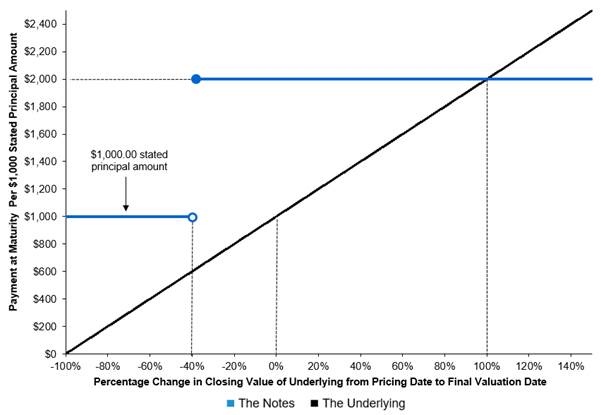
Payment at Maturity Diagram
The diagram below illustrates your payment at maturity of the notes,
assuming the notes have not previously been automatically redeemed, for a range of hypothetical underlying performance.
Investors in the notes will not receive any dividends with respect
to the underlying. The diagram and examples below do not show any effect of lost dividend yield over the term of the notes. See “Summary
Risk Factors—You will not receive dividends or have any other rights with respect to the underlying” below.
Market-Linked Notes
Payment at Maturity Diagram |
 |
| Citigroup Global Markets Holdings Inc. |
| |
Hypothetical Examples of the Payment at Maturity
The examples below are intended to illustrate how, if the notes are
not automatically redeemed prior to maturity, your payment at maturity will depend on the final underlying value. Your actual payment
at maturity per note, if the notes are not automatically redeemed prior to maturity, will depend on the actual final underlying value.
The examples are solely for illustrative purposes, do not show all possible outcomes and are not a prediction of any payment that may
be made on the notes.
The examples below are based on a hypothetical initial underlying value
of 100 and a hypothetical final premium threshold value of 60 and do not reflect the actual initial underlying value or final premium
threshold value. For the actual initial underlying value and final premium threshold value, see the cover page of this pricing supplement.
We have used this hypothetical value, rather than the actual value, to simplify the calculations and aid understanding of how the notes
work. However, you should understand that the actual payment at maturity on the notes will be calculated based on the actual initial underlying
value and final premium threshold value and not the hypothetical values. For ease of analysis, figures below have been rounded.
Example 1—Upside Scenario A. The final underlying value
is 110.00 (a 10% increase from the initial underlying value), which is greater than or equal to the final premium threshold value.
Payment at maturity per note = $1,000 + the premium applicable to the
final valuation date
= $1,000 + $1,000.00
= $2,000.00
In this scenario, because the final underlying value is greater than
or equal to the final premium threshold value, you would be repaid the stated principal amount of your notes at maturity plus the
premium applicable to the final valuation date.
Example 2—Upside Scenario B. The final underlying value
is 80.00 (a 20% decrease from the initial underlying value), which is greater than or equal to the final premium threshold value.
Payment at maturity per note = $1,000 + the premium applicable to the
final valuation date
= $1,000 + $1,000.00
= $2,000.00
In this scenario, because the final underlying value is greater than
or equal to the final premium threshold value, you would be repaid the stated principal amount of your notes at maturity plus the
premium applicable to the final valuation date.
Example 2—Par Scenario. The final underlying value is 50.00
(a 50% decrease from the initial underlying value), which is less than the final premium threshold value.
Payment at maturity per note = $1,000
In this scenario, because the underlying has depreciated from the initial
underlying value to the final underlying value and is less than the final premium threshold value, you would be repaid the stated principal
amount of your notes at maturity but you would not receive any positive return on your investment.
| Citigroup Global Markets Holdings Inc. |
| |
Summary Risk Factors
An investment in the notes is significantly riskier than an investment
in conventional debt securities. The notes are subject to all of the risks associated with an investment in our conventional debt securities
(guaranteed by Citigroup Inc.), including the risk that we and Citigroup Inc. may default on our obligations under the notes, and are
also subject to risks associated with the underlying. Accordingly, the notes are suitable only for investors who are capable of understanding
the complexities and risks of the notes. You should consult your own financial, tax and legal advisors as to the risks of an investment
in the notes and the suitability of the notes in light of your particular circumstances.
The following is a summary of certain key risk factors for investors
in the notes. You should read this summary together with the more detailed description of risks relating to an investment in the notes
contained in the section “Risk Factors Relating to the Notes” beginning on page EA-6 in the accompanying product supplement.
You should also carefully read the risk factors included in the accompanying prospectus supplement and in the documents incorporated by
reference in the accompanying prospectus, including Citigroup Inc.’s most recent Annual Report on Form 10-K and any subsequent Quarterly
Reports on Form 10-Q, which describe risks relating to the business of Citigroup Inc. more generally.
Risks relating to the notes
| § | You may not receive any return on your investment in the notes. If, on each valuation date prior to the final valuation date,
the closing value of the underlying is not greater than or equal to the initial underlying value, then the notes will not be automatically
redeemed at a premium. In that event, you will receive a positive return on your investment in the notes only if the final
underlying value is greater than or equal to the final premium threshold value. If the final underlying value is less than the final premium
threshold value, you will receive only the stated principal amount of $1,000 for each note you hold at maturity. |
| § | The notes are riskier than notes with a shorter term. The notes are relatively long-dated. Because the
notes are relatively long-dated, many of the risks of the notes are heightened as compared to notes with a shorter term, because you will
be subject to those risks for a longer period of time. In addition, the value of a longer-dated note is typically less than
the value of an otherwise comparable note with a shorter term. |
| § | The notes do not pay interest. Unlike conventional debt securities, the notes do not pay interest prior to maturity. You should
not invest in the notes if you seek current income during the term of the notes. |
| § | Your potential return on the notes is limited. Your potential return on the notes is limited to the applicable premium payable
upon automatic early redemption or at maturity, as described on the cover page of this pricing supplement. If the closing value of the
underlying on one of the valuation dates prior to the final valuation date is greater than or equal to the initial underlying value, or
if the final underlying value is greater than or equal to the final premium threshold value, you will be repaid the stated principal amount
of your notes and will receive the fixed premium applicable to that valuation date, regardless of how significantly the closing value
of the underlying on that valuation date may exceed the initial underlying value. Accordingly, any premium may result in a return on the
notes that is significantly less than the return you could have achieved on a direct investment in the underlying. |
| § | The notes may be automatically redeemed prior to maturity, limiting the term of the notes. If the closing value of the underlying
on any valuation date prior to the final valuation date is greater than or equal to the initial underlying value, the notes will be automatically
redeemed. If the notes are automatically redeemed following any valuation date prior to the final valuation date, they will cease to be
outstanding and you will not receive the premium applicable to any later valuation date. Moreover, you may not be able to reinvest your
funds in another investment that provides a similar yield with a similar level of risk. |
| § | Although the notes provide for the repayment of the stated principal amount at maturity, you may nevertheless suffer a loss on
your investment in real value terms. This is because inflation may cause the real value of the stated principal amount to be less
at maturity than it is at the time you invest, and because an investment in the notes represents a forgone opportunity to invest in an
alternative asset that does generate a positive real return. This potential loss in real value terms is significant given the term of
the notes. You should carefully consider whether an investment that may not provide for any return on your investment, or may provide
a return that is lower than the return on alternative investments, is appropriate for you. |
| § | The performance of the notes will depend on the closing values of the underlying solely on the valuation dates, which makes the
notes particularly sensitive to volatility in the closing values of the underlying on or near the valuation dates. Whether the notes
will be automatically redeemed prior to maturity will depend on the closing values of the underlying solely on the valuation dates (other
than the final valuation date), regardless of the closing values of the underlying on other days during the term of the notes. If the
notes are not automatically redeemed prior to maturity, what you receive at maturity will depend solely on the closing value of the underlying
on the final valuation date, and not on any other day during the term of the notes. Because the performance of the notes depends on the
closing values of the underlying on a limited number of dates, the notes will be particularly sensitive to volatility in the closing values
of the underlying on or near the valuation dates. You should understand that the closing value of the underlying has historically been
highly volatile. |
| § | The notes are subject to the credit risk of Citigroup Global Markets Holdings Inc. and Citigroup Inc. If we default on our
obligations under the notes and Citigroup Inc. defaults on its guarantee obligations, you may not receive anything owed to you under the
notes. |
| § | The notes will not be listed on any securities exchange and you may not be able to sell them prior to maturity. The notes will
not be listed on any securities exchange. Therefore, there may be little or no secondary market for the notes. CGMI currently intends
to make a secondary market in relation to the notes and to provide an indicative bid price for the notes on a daily basis. Any indicative
bid price for the notes provided by CGMI will be determined in CGMI’s sole discretion, taking into account prevailing market conditions
and other relevant factors, and will not be a representation by CGMI that the notes can be sold at that price, or at all. CGMI may suspend
or terminate making a market and providing indicative bid prices without notice, at any time and for any reason. If CGMI suspends or |
| Citigroup Global Markets Holdings Inc. |
| |
terminates making a market, there may be
no secondary market at all for the notes because it is likely that CGMI will be the only broker-dealer that is willing to buy your notes
prior to maturity. Accordingly, an investor must be prepared to hold the notes until maturity.
| § | Sale of the notes prior to maturity may result in a loss of principal. You will be entitled to receive at least the full stated
principal amount of your notes, subject to the credit risk of Citigroup Global Markets Holdings Inc. and Citigroup Inc., only if you hold
the notes to maturity. The value of the notes may fluctuate during the term of the notes, and if you are able to sell your notes prior
to maturity, you may receive less than the full stated principal amount of your notes. |
| § | The estimated value of the notes on the pricing date, based on CGMI’s proprietary pricing models and our internal funding
rate, is less than the issue price. The difference is attributable to certain costs associated with selling, structuring and hedging
the notes that are included in the issue price. These costs include (i) any selling concessions or other fees paid in connection with
the offering of the notes, (ii) hedging and other costs incurred by us and our affiliates in connection with the offering of the notes
and (iii) the expected profit (which may be more or less than actual profit) to CGMI or other of our affiliates in connection with hedging
our obligations under the notes. These costs adversely affect the economic terms of the notes because, if they were lower, the economic
terms of the notes would be more favorable to you. The economic terms of the notes are also likely to be adversely affected by the use
of our internal funding rate, rather than our secondary market rate, to price the notes. See “The estimated value of the notes would
be lower if it were calculated based on our secondary market rate” below. |
| § | The estimated value of the notes was determined for us by our affiliate using proprietary pricing models. CGMI derived the
estimated value disclosed on the cover page of this pricing supplement from its proprietary pricing models. In doing so, it may have made
discretionary judgments about the inputs to its models, such as the volatility of the closing value of the underlying, dividend yields
on the stocks that constitute the underlying and interest rates. CGMI’s views on these inputs may differ from your or others’
views, and as an underwriter in this offering, CGMI’s interests may conflict with yours. Both the models and the inputs to the models
may prove to be wrong and therefore not an accurate reflection of the value of the notes. Moreover, the estimated value of the notes set
forth on the cover page of this pricing supplement may differ from the value that we or our affiliates may determine for the notes for
other purposes, including for accounting purposes. You should not invest in the notes because of the estimated value of the notes. Instead,
you should be willing to hold the notes to maturity irrespective of the initial estimated value. |
| § | The estimated value of the notes would be lower if it were calculated based on our secondary market rate. The estimated value
of the notes included in this pricing supplement is calculated based on our internal funding rate, which is the rate at which we are willing
to borrow funds through the issuance of the notes. Our internal funding rate is generally lower than our secondary market rate, which
is the rate that CGMI will use in determining the value of the notes for purposes of any purchases of the notes from you in the secondary
market. If the estimated value included in this pricing supplement were based on our secondary market rate, rather than our internal funding
rate, it would likely be lower. We determine our internal funding rate based on factors such as the costs associated with the notes, which
are generally higher than the costs associated with conventional debt securities, and our liquidity needs and preferences. Our internal
funding rate is not an interest rate that we will pay to investors in the notes, which do not bear interest. |
Because there is not an active market for traded instruments
referencing our outstanding debt obligations, CGMI determines our secondary market rate based on the market price of traded instruments
referencing the debt obligations of Citigroup Inc., our parent company and the guarantor of all payments due on the notes, but subject
to adjustments that CGMI makes in its sole discretion. As a result, our secondary market rate is not a market-determined measure of our
creditworthiness, but rather reflects the market’s perception of our parent company’s creditworthiness as adjusted for discretionary
factors such as CGMI’s preferences with respect to purchasing the notes prior to maturity.
| § | The estimated value of the notes is not an indication of the price, if any, at which CGMI or any other person may be willing to
buy the notes from you in the secondary market. Any such secondary market price will fluctuate over the term of the notes based on
the market and other factors described in the next risk factor. Moreover, unlike the estimated value included in this pricing supplement,
any value of the notes determined for purposes of a secondary market transaction will be based on our secondary market rate, which will
likely result in a lower value for the notes than if our internal funding rate were used. In addition, any secondary market price for
the notes will be reduced by a bid-ask spread, which may vary depending on the aggregate stated principal amount of the notes to be purchased
in the secondary market transaction, and the expected cost of unwinding related hedging transactions. As a result, it is likely that any
secondary market price for the notes will be less than the issue price. |
| § | The value of the notes prior to maturity will fluctuate based on many unpredictable factors. The value of your notes prior
to maturity will fluctuate based on the closing value of the underlying, the volatility of the closing value of the underlying, dividend
yields on the stocks that constitute the underlying, interest rates generally, the time remaining to maturity and our and Citigroup Inc.’s
creditworthiness, as reflected in our secondary market rate, among other factors described under “Risk Factors Relating to the Notes—Risk
Factors Relating to All Notes—The value of your notes prior to maturity will fluctuate based on many unpredictable factors”
in the accompanying product supplement. Changes in the closing value of the underlying may not result in a comparable change in the value
of your notes. You should understand that the value of your notes at any time prior to maturity may be significantly less than the issue
price. |
| § | Immediately following issuance, any secondary market bid price provided by CGMI, and the value that will be indicated on any brokerage
account statements prepared by CGMI or its affiliates, will reflect a temporary upward adjustment. The amount of this temporary upward
adjustment will steadily decline to zero over the temporary adjustment period. See “Valuation of the Notes” in this pricing
supplement. |
| § | Our offering of the notes is not a recommendation of the underlying. The fact that we are offering the notes does not mean
that we believe that investing in an instrument linked to the underlying is likely to achieve favorable returns. In fact, as we are part
of a global financial institution, our affiliates may have positions (including short positions) in the stocks that constitute the underlying
or in instruments related to the underlying or such stocks, and may publish research or express opinions, that in each case are inconsistent |
| Citigroup Global Markets Holdings Inc. |
| |
with an investment linked to the underlying.
These and other activities of our affiliates may affect the closing value of the underlying in a way that negatively affects the value
of and your return on the notes.
| § | The closing value of the underlying may be adversely affected by our or our affiliates’ hedging and other trading activities.
We expect to hedge our obligations under the notes through CGMI or other of our affiliates, who may take positions in the underlying or
in financial instruments related to the underlying and may adjust such positions during the term of the notes. Our affiliates also take
positions in the underlying or in financial instruments related to the underlying on a regular basis (taking long or short positions or
both), for their accounts, for other accounts under their management or to facilitate transactions on behalf of customers. These activities
could affect the closing value of the underlying in a way that negatively affects the value of and your return on the notes. They could
also result in substantial returns for us or our affiliates while the value of the notes declines. |
| § | We and our affiliates may have economic interests that are adverse to yours as a result of our affiliates’ business activities.
Our affiliates engage in business activities with a wide range of companies. These activities include extending loans, making and facilitating
investments, underwriting securities offerings and providing advisory services. These activities could involve or affect the underlying
in a way that negatively affects the value of and your return on the notes. They could also result in substantial returns for us or our
affiliates while the value of the notes declines. In addition, in the course of this business, we or our affiliates may acquire non-public
information, which will not be disclosed to you. |
| § | The calculation agent, which is an affiliate of ours, will make important determinations with respect to the notes. If certain
events occur during the term of the notes, such as market disruption events and other events with respect to the underlying, CGMI, as
calculation agent, will be required to make discretionary judgments that could significantly affect your return on the notes. In making
these judgments, the calculation agent’s interests as an affiliate of ours could be adverse to your interests as a holder of the
notes. See “Risk Factors Relating to the Notes—Risk Factors Relating to All Notes—The calculation agent, which is an
affiliate of ours, will make important determinations with respect to the notes” in the accompanying product supplement. |
Risks relating to the S&P 500
Futures 35% Edge Volatility 6% Decrement Index (USD) ER
The following discussion of risks relating
to the S&P 500 Futures 35% Edge Volatility 6% Decrement Index (USD) ER, which we refer to in this section as the “Index”,
should be read together with the description of the Index in Annex A to this pricing supplement, which defines and further describes a
number of the terms and concepts referred to in this section.
| § | The Index is highly risky because it may reflect highly leveraged exposure to the Underlying Futures Index and may therefore experience
a decline that is many multiples of any decline in the Underlying Futures Index. The Index tracks exposure to the S&P
500 Futures Excess Return Index (which we refer to as the “Underlying Futures Index”) on a volatility targeted basis,
less a decrement of 6% per annum. The Index has a volatility target of 35%, which it attempts to achieve by applying leverage
to its exposure to the Underlying Futures Index (up to a maximum of 500%) when the implied volatility of the S&P 500®
Index is less than the volatility target, and by reducing its exposure to the Underlying Futures Index below 100% when the implied volatility
of the S&P 500® Index is greater than the volatility target. It is expected that the implied volatility
of the S&P 500® Index will frequently be less than the volatility target, and therefore it is expected that the Index
will frequently have leveraged (more than 100%) exposure to the Underlying Futures Index. If the Underlying Futures Index declines
at a time when the Index has leveraged exposure to it, the decline in the Index will be equal to the decline in the Underlying Futures
Index multiplied by the leverage (subject to further reduction as a result of the decrement). For example, if the Underlying
Futures Index declines by 5% at a time when the Index has 500% leveraged exposure to the Underlying Futures Index, the Index will decline
by 25% over that time (subject to further reduction as a result of the decrement). This potential for losses on a highly leveraged
basis makes the Index highly risky. |
| § | The Index may realize significant losses if it is not consistently successful in increasing exposure to the Underlying Futures
Index in advance of increases in the Underlying Futures Index and reducing exposure to the Underlying Futures Index in advance of declines
in the Underlying Futures Index. The Index methodology is premised on the following key assumptions: (1) that there will
be an inverse relationship between performance and volatility, so that the Underlying Futures Index will tend to increase in times of
lower volatility and decline in times of higher volatility; (2) that the implied volatility of the S&P 500® Index,
as derived from the market prices of exchange-traded options on the S&P 500® Index on each weekly rebalancing date,
will be an effective predictor of future volatility of the Underlying Futures Index over the next week; and (3) that 35% will be an effective
level of volatility at which to draw the line between leveraged exposure and deleveraged exposure to the Underlying Futures Index. There
is no guarantee that these assumptions will be proven correct over any given time period. If any of these assumptions does
not prove to be consistently correct, then the Index may perform poorly as a result of having highly leveraged exposure to the Underlying
Futures Index at a time of declines and/or having reduced exposure to the Underlying Futures Index at a time of increases. |
| § | The Index may be adversely affected by a time lag in its volatility targeting mechanism. The Index resets the leveraged
exposure of each sub-index to the Underlying Futures Index on a weekly basis. If the implied volatility of the S&P 500®
Index at the rebalancing time on the rebalancing date for a given sub-index is relatively low, that sub-index will retain relatively high
leveraged exposure to the Underlying Futures Index for the next week even if the volatility of the S&P 500® Index spikes
and the Underlying Futures Index declines significantly in value immediately after the rebalancing time on that rebalancing date. That
sub-index may consequently have highly leveraged exposure to a week’s worth of declines in the value of the Underlying Futures Index
before it has a chance to reset its leverage. In the case of a sudden increase in volatility and a sudden decline in value,
multiple sub-indexes may have highly leveraged exposure to declines over multiple days, and the Index may experience poor performance
as a result. Conversely, if significant appreciation in the Underlying Futures Index follows closely on a period of high S&P
500® Index volatility, the time lag may cause the Index to have low exposure to the Underlying Futures Index when that
appreciation occurs. Taken together, these factors may cause the Index to perform particularly poorly in a temporary market
crash – a sudden significant decline that is quickly reversed. In that scenario, the Index would participate on a highly
leveraged basis in the decline and then fail to participate fully in the recovery. |
| Citigroup Global Markets Holdings Inc. |
| |
| § | The Index may be adversely affected by a “decay” effect. If the Index is not consistently successful
in increasing exposure to the Underlying Futures Index in advance of increases in the Underlying Futures Index and reducing exposure to
the Underlying Futures Index in advance of declines in the Underlying Futures Index, then the Index is also expected to be subject to
a “decay” effect, which will exacerbate the decline that results from having highly leveraged exposure to declines in the
Underlying Futures Index. The decay effect would result from the fact that each sub-index of the Index resets its leveraged
exposure to the Underlying Futures Index on a weekly basis, and would manifest any time the Underlying Futures Index moves in one direction
one week and another direction the next. The decay effect would result because resetting leverage after an increase but in
advance of a decline would cause the Index to have increased exposure to that decline, and resetting leverage following a decline but
in advance of an increase would cause the Index to have decreased exposure to that increase. The more this fact pattern repeats,
the lower the performance of the Index would be relative to the performance of the Underlying Futures Index. |
| § | The Underlying Futures Index is expected to underperform the S&P 500® Index because of an implicit financing
cost. The Underlying Futures Index is a futures-based index. As a futures-based index, it is expected to reflect
not only the performance of its reference index (the S&P 500® Index), but also the implicit cost of a financed position
in that reference index. The cost of this financed position will adversely affect the value of the Underlying Futures Index. Any
increase in market interest rates will be expected to further increase this implicit financing cost and will increase the negative effect
on the performance of the Underlying Futures Index. Because of this implicit financing cost, the Underlying Futures Index is
expected to underperform the total return performance of the S&P 500® Index. |
| § | The performance of the Index will be reduced by a decrement of 6% per annum. The Index is a decrement index, which
means that the value of each sub-index of the Index will be reduced at a rate of 6% per annum. The decrement will be a significant
drag on the performance of the Index, potentially offsetting positive returns that would otherwise result from the Index methodology,
exacerbating negative returns of the Index methodology and causing the level of the Index to decline steadily if the return of the Index
methodology would otherwise be relatively flat. The Index will not appreciate unless the return of the Index methodology is
sufficient to offset the negative effects of the decrement, and then only to the extent that the return of the Index methodology is greater
than the decrement. As a result of the decrement, the level of the Index may decline even if the return of the Index methodology
would otherwise have been positive. |
| § | The Index may not fully participate in any appreciation of the Underlying Futures Index. At any time when the implied
volatility of the S&P 500® Index is greater than the volatility target, the Index will have less than 100% exposure
to the Underlying Futures Index and therefore will not fully participate in any appreciation of the Underlying Futures Index. For
example, if the Index has 50% exposure to the Underlying Futures Index at a time when the Underlying Futures Index appreciates by 5%,
the Index would appreciate by only 2.5% (before giving effect to the decrement). The decrement is deducted daily at a rate of 6% per annum
even when the Index has less than 100% exposure to the Underlying Futures Index. |
| § | The Index may perform less favorably than it would if its volatility targeting mechanism were based on an alternative volatility
measure, such as actual realized volatility, rather than implied volatility. The Index attempts to achieve its volatility
target by adjusting its exposure to the Underlying Futures Index based on the implied volatility of the S&P 500® Index. Implied
volatility represents market expectations of future volatility as derived from the price of exchange-traded options on the S&P 500®
Index. Market expectations of future volatility may not accurately forecast future volatility. Accordingly, relying
on implied volatility may cause the Index to be less successful in maintaining its volatility target than it would have been if it had
relied instead on an alternative measure of volatility, such as actual realized volatility. As a result, the Index may have
lower participation in Underlying Futures Index increases, and greater participation in Underlying Futures Index declines, resulting in
less favorable overall Index performance, than it would have had if another measure of volatility had been used. |
| § | The Index may significantly underperform the S&P 500® Index. It is important to understand that
the Index provides exposure to the S&P 500® Index that: (1) may be leveraged up to 500%, or alternatively may reflect
less than 100% participation; (2) is reduced by an implicit financing cost; (3) may be subject to a decay effect; and (4) is reduced by
a decrement of 6% per annum. As a result of these features, the Index may significantly underperform the S&P 500®
Index. The Index is likely to significantly underperform the S&P 500® Index if it is not consistently successful
in increasing exposure to the Underlying Futures Index in advance of increases in the Underlying Futures Index and reducing exposure to
the Underlying Futures Index in advance of declines in the Underlying Futures Index. The Index may significantly underperform
the S&P 500® Index even if it is consistently successful in these respects because of the implicit financing cost and
the decrement, or because the reduced exposure the Index has to the Underlying Futures Index at a time of a decline may nevertheless reflect
significantly greater than 100% participation in the decline of the Underlying Futures Index. |
| § | The Index has limited actual performance information. The Index launched on May 10, 2024. Accordingly,
the Index has limited actual performance data. Because the Index is of recent origin with limited performance history, an investment
linked to the Index may involve a greater risk than an investment linked to one or more indices with an established record of performance. A
longer history of actual performance may have provided more reliable information on which to assess the validity of the Index’s
methodology. However, any historical performance of the Index is not an indication of how the Index will perform in the future. |
| § | Hypothetical back-tested Index performance information is subject to significant limitations. All information regarding
the performance of the Index prior to May 10, 2024 is hypothetical and back-tested, as the Index did not exist prior to that time. It
is important to understand that hypothetical back-tested Index performance information is subject to significant limitations, in addition
to the fact that past performance is never a guarantee of future performance. In particular: |
| o | The sponsor of the Index developed the rules of the Index with the benefit of hindsight—that is, with the benefit of being able
to evaluate how the Index rules would have caused the Index to perform had it existed during the hypothetical back-tested period. The
fact that the Index generally appreciated over any portion of the hypothetical back-tested period may not therefore be an accurate or
reliable indication of any fundamental aspect of the Index methodology. |
| Citigroup Global Markets Holdings Inc. |
| |
| o | The hypothetical back-tested performance of the Index might look different if it covered a different historical period. The
market conditions that existed during the historical period covered by the hypothetical back-tested Index performance information are
not necessarily representative of the market conditions that will exist in the future. |
| o | SPXW options were not published as frequently prior to May 11, 2022 as they are now, and as a result the calculation of the hypothetical
back-tested values of the Index prior to that date differs from the calculation of the Index today. The hypothetical back-tested
performance of the Index prior to May 11, 2022 may therefore differ from how the Index would have performed if SPXW options had been available
with expirations on every weekday, as they are now. |
It is impossible to predict whether the
Index will rise or fall. The actual future performance of the Index may bear no relation to the historical or hypothetical back-tested
levels of the Index.
| § | An affiliate of ours participated in the development of the Index. CGMI worked with the sponsor of the Index in
developing the guidelines and policies governing the composition and calculation of the Index, and in that role made judgments and determinations
about the Index methodology. Although CGMI no longer has a role in making any judgments and determinations relating to the
Index, the judgments and determinations previously made by CGMI could continue to have an impact, positive or negative, on the level of
the Index and the value of your notes. CGMI was under no obligation to consider your interests as an investor in the notes
in its role in developing the guidelines and policies governing the Index. |
| § | Changes that affect the Index may affect the value of your notes. The sponsor of the Index may at any time make
methodological changes or other changes in the manner in which it operates that could affect the value of the Index. We are
not affiliated with the Index sponsor and, accordingly, we have no control over any changes such sponsor may make. Such changes
could adversely affect the performance of the Index and the value of and your return on the notes. |
| Citigroup Global Markets Holdings Inc. |
| |
Additional Terms of the Notes
Market disruption events. For purposes of determining whether
a market disruption event occurs with respect to the S&P 500 Futures 35% Edge Volatility 6% Decrement Index (USD) ER, each reference
to the “Underlying Index” in the section “Description of the Notes—Certain Additional Terms for Notes Linked to
an Underlying Index—Consequences of a Market Disruption Event; Postponement of a Valuation Date” in the accompanying product
supplement shall be deemed replaced with a reference to the “Underlying Index, the S&P 500 Futures Excess Return Index or the
S&P 500® Index”. References in the section “Description of the Notes—Certain Additional
Terms for Notes Linked to an Underlying Index—Consequences of a Market Disruption Event; Postponement of a Valuation Date”
in the accompanying product supplement to the securities comprising an Underlying Index shall be deemed to include futures contracts comprising
an Underlying Index.
| Citigroup Global Markets Holdings Inc. |
| |
Information About the S&P 500 Futures 35% Edge Volatility
6% Decrement Index (USD) ER
For information about the S&P 500 Futures 35% Edge Volatility 6%
Decrement Index (USD) ER, see Annex A to this pricing supplement.
Hypothetical Back-tested and Historical Performance Information
This section contains hypothetical back-tested performance information
for the S&P 500 Futures 35% Edge Volatility 6% Decrement Index (USD) ER calculated by S&P Dow Jones Indices LLC. All
S&P 500 Futures 35% Edge Volatility 6% Decrement Index (USD) ER performance information prior to May 10, 2024 is hypothetical and
back-tested, as the S&P 500 Futures 35% Edge Volatility 6% Decrement Index (USD) ER did not exist prior to that date. Hypothetical
back-tested performance information is subject to significant limitations. The sponsor of the S&P 500 Futures 35% Edge
Volatility 6% Decrement Index (USD) ER developed the rules of the index with the benefit of hindsight—that is, with the benefit
of being able to evaluate how the rules would have caused the S&P 500 Futures 35% Edge Volatility 6% Decrement Index (USD) ER to perform
had it existed during the hypothetical back-tested period. The fact that the S&P 500 Futures 35% Edge Volatility 6% Decrement
Index (USD) ER appreciated at any time during the hypothetical back-tested period may not therefore be an accurate or reliable indication
of any fundamental aspect of the index methodology. Furthermore, the hypothetical back-tested performance of the S&P 500
Futures 35% Edge Volatility 6% Decrement Index (USD) ER might look different if it covered a different historical period. The
market conditions that existed during the hypothetical back-tested period may not be representative of market conditions that will exist
in the future.
In addition, the SPXW options used by the S&P 500 Futures 35% Edge
Volatility 6% Decrement Index (USD) ER to determine the implied volatility of the S&P 500® Index have traded with expirations
on every weekday only since May 11, 2022. When SPXW options were first launched in 2005, only Friday expirations were available. Wednesday
expirations were added on February 23, 2016; Monday expirations were added on August 15, 2016; Tuesday expirations were added on April
18, 2022; and Thursday expirations were added on May 11, 2022. For purposes of calculating the hypothetical back-tested performance
of the Index, the implied volatility for the one-week period ending on a weekday for which no SPXW option was then traded was calculated
by interpolating between the SPXW options expiring immediately before and immediately after that weekday. In addition, on September
30, 2016, due to data availability, the closing level of the S&P 500 Futures Excess Return Index on that day was used in lieu of its
time-weighted average value. For these reasons, the hypothetical back-tested performance of the S&P 500 Futures 35% Edge
Volatility 6% Decrement Index (USD) ER prior to May 11, 2022 may differ from how the S&P 500 Futures 35% Edge Volatility 6% Decrement
Index (USD) ER would have performed if SPXW options had been available with expirations on every weekday, as they are now, and if the
time-weighted average value of the S&P 500 Futures Excess Return Index had been available on September 30, 2016.
It is impossible to predict whether the S&P 500 Futures 35% Edge
Volatility 6% Decrement Index (USD) ER will rise or fall. By providing the hypothetical back-tested and historical performance
information below, we are not representing that the S&P 500 Futures 35% Edge Volatility 6% Decrement Index (USD) ER is likely to achieve
gains or losses similar to those shown. In fact, there are frequently sharp differences between hypothetical performance results
and the actual results subsequently achieved by any particular investment. One of the limitations of hypothetical performance
information is that it did not involve financial risk and cannot account for all factors that would affect actual performance. The
actual future performance of the S&P 500 Futures 35% Edge Volatility 6% Decrement Index (USD) ER may bear no relation to its hypothetical
back-tested or historical performance.
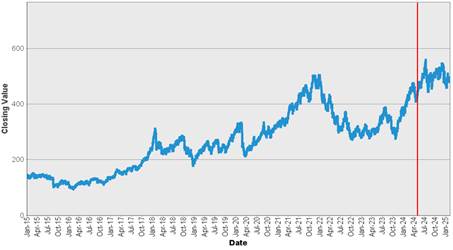
Historical Information
The closing value of the S&P 500 Futures 35% Edge Volatility 6%
Decrement Index (USD) ER on February 11, 2025 was 492.4821. The graph below shows the hypothetical back-tested closing values of the S&P
500 Futures 35% Edge Volatility 6% Decrement Index (USD) ER for the period from January 2, 2015 to May 9, 2024, and historical closing
values of the S&P 500 Futures 35% Edge Volatility 6% Decrement Index (USD) ER for the period from May 10, 2024 to February 11, 2025. All
data to the left of the vertical red line in the graph below are hypothetical and back-tested. We obtained the closing values
from Bloomberg L.P., without independent verification. You should not take the hypothetical back-tested and historical values
of the S&P 500 Futures 35% Edge Volatility 6% Decrement Index (USD) ER as an indication of future performance.
S&P 500 Futures 35% Edge Volatility 6% Decrement Index (USD) ER – Hypothetical Back-Tested and Historical Closing Values
January 2, 2015 to February 11, 2025 |
 |
| Citigroup Global Markets Holdings Inc. |
| |
United States Federal Tax Considerations
In the opinion of our counsel, Davis Polk & Wardwell LLP, which
is based on current market conditions, the notes should be treated as “contingent payment debt instruments” for U.S. federal
income tax purposes, as described in the section of the accompanying product supplement called “United States Federal Tax Considerations—Tax
Consequences to U.S. Holders—Notes Treated as Contingent Payment Debt Instruments,” and the remaining discussion is based
on this treatment.
If you are a U.S. Holder (as defined in the accompanying product supplement),
you will be required to recognize interest income during the term of the notes at the “comparable yield,” which generally
is the yield at which we could issue a fixed-rate debt instrument with terms similar to those of the notes, including the level of subordination,
term, timing of payments and general market conditions, but excluding any adjustments for the riskiness of the contingencies or the liquidity
of the notes. Although it is not clear how the comparable yield should be determined for notes that may be automatically redeemed
before maturity, our determination of the comparable yield is based on the maturity date. We are required to construct a “projected
payment schedule” in respect of the notes representing a payment the amount and timing of which would produce a yield to maturity
on the notes equal to the comparable yield. Assuming you hold the notes until their maturity, the amount of interest you include
in income based on the comparable yield in the taxable year in which the notes mature will be adjusted upward or downward to reflect the
difference, if any, between the actual and projected payment on the notes at maturity as determined under the projected payment schedule.
Upon the sale, exchange or retirement of the notes prior to maturity,
you generally will recognize gain or loss equal to the difference between the proceeds received and your adjusted tax basis in the notes. Your
adjusted tax basis will equal your purchase price for the notes, increased by interest previously included in income on the notes. Any
gain generally will be treated as ordinary income, and any loss generally will be treated as ordinary loss to the extent of prior interest
inclusions on the note and as capital loss thereafter.
We have determined that the comparable yield for a note is a rate of %,
compounded semi-annually, and that the projected payment schedule with respect to a note consists of a single payment of $ at
maturity.
Neither the comparable yield nor the projected payment schedule constitutes
a representation by us regarding the actual amount that we will pay on the notes.
Non-U.S. Holders. Subject to the discussions below regarding
Section 871(m) and in “United States Federal Tax Considerations—Tax Consequences to Non-U.S. Holders” and “—FATCA”
in the accompanying product supplement, if you are a Non-U.S. Holder (as defined in the accompanying product supplement) of the notes,
under current law you generally will not be subject to U.S. federal withholding or income tax in respect of any payment on or any amount
received on the sale, exchange or retirement of the notes, provided that (i) income in respect of the notes is not effectively connected
with your conduct of a trade or business in the United States, and (ii) you comply with the applicable certification requirements. See
“United States Federal Tax Considerations—Tax Consequences to Non-U.S. Holders” in the accompanying product supplement
for a more detailed discussion of the rules applicable to Non-U.S. Holders of the notes.
As discussed under “United States Federal Tax Considerations—Tax
Consequences to Non-U.S. Holders—Dividend Equivalents Under Section 871(m) of the Code” in the accompanying product supplement,
Section 871(m) of the Internal Revenue Code of 1986, as amended, and Treasury regulations promulgated thereunder (“Section 871(m)”)
generally impose a 30% withholding tax on dividend equivalents paid or deemed paid to Non-U.S. Holders with respect to certain financial
instruments linked to U.S. equities (“Underlying Securities”) or indices that include Underlying Securities. Section
871(m) generally applies to instruments that substantially replicate the economic performance of one or more Underlying Securities, as
determined based on tests set forth in the applicable Treasury regulations. However, the regulations, as modified by an Internal Revenue
Service (“IRS”) notice, exempt financial instruments issued prior to January 1, 2027 that do not have a “delta”
of one. Based on the terms of the notes and representations provided by us as of the date of this preliminary pricing supplement,
our counsel is of the opinion that the notes should not be treated as transactions that have a “delta” of one within the meaning
of the regulations with respect to any Underlying Security and, therefore, should not be subject to withholding tax under Section 871(m). However,
the final determination regarding the treatment of the notes under Section 871(m) will be made as of the pricing date for the notes, and
it is possible that the notes will be subject to withholding under Section 871(m) based on the circumstances as of that date.
A determination that the notes are not subject to Section 871(m) is
not binding on the IRS, and the IRS may disagree with this treatment. Moreover, Section 871(m) is complex and its application
may depend on your particular circumstances, including your other transactions. You should consult your tax adviser regarding the potential
application of Section 871(m) to the notes.
If withholding tax applies to the notes, we will not be required to
pay any additional amounts with respect to amounts withheld.
You should read the section entitled “United States Federal
Tax Considerations” in the accompanying product supplement. The preceding discussion, when read in combination with that
section, constitutes the full opinion of Davis Polk & Wardwell LLP regarding the material U.S. federal tax consequences of owning
and disposing of the notes.
You should also consult your tax adviser regarding all aspects of
the U.S. federal tax consequences of an investment in the notes and any tax consequences arising under the laws of any state, local or
non-U.S. taxing jurisdiction.
| Citigroup Global Markets Holdings Inc. |
| |
Supplemental Plan of Distribution
CGMI, an affiliate of Citigroup Global Markets Holdings Inc. and the
underwriter of the sale of the notes, is acting as principal and will receive an underwriting fee of $50.00 for each note sold in this
offering. From this underwriting fee, CGMI will pay selected dealers not affiliated with CGMI a fixed selling concession of $50.00 for
each note they sell. For the avoidance of doubt, any fees or selling concessions described in this pricing supplement will not be rebated
if the notes are automatically redeemed prior to maturity.
See “Plan of Distribution; Conflicts of Interest” in the
accompanying product supplement and “Plan of Distribution” in each of the accompanying prospectus supplement and prospectus
for additional information.
Valuation of the Notes
CGMI calculated the estimated value of the notes set forth on the cover
page of this pricing supplement based on proprietary pricing models. CGMI’s proprietary pricing models generated an estimated value
for the notes by estimating the value of a hypothetical package of financial instruments that would replicate the payout on the notes,
which consists of a fixed-income bond (the “bond component”) and one or more derivative instruments underlying the economic
terms of the notes (the “derivative component”). CGMI calculated the estimated value of the bond component using a discount
rate based on our internal funding rate. CGMI calculated the estimated value of the derivative component based on a proprietary derivative-pricing
model, which generated a theoretical price for the instruments that constitute the derivative component based on various inputs, including
the factors described under “Summary Risk Factors—The value of the notes prior to maturity will fluctuate based on many unpredictable
factors” in this pricing supplement, but not including our or Citigroup Inc.’s creditworthiness. These inputs may be market-observable
or may be based on assumptions made by CGMI in its discretionary judgment.
The estimated value of the notes is a function of the terms of the notes
and the inputs to CGMI’s proprietary pricing models. As of the date of this preliminary pricing supplement, it is uncertain
what the estimated value of the notes will be on the pricing date because it is uncertain what the values of the inputs to CGMI’s
proprietary pricing models will be on the pricing date.
For a period of approximately twelve months following issuance of the
notes, the price, if any, at which CGMI would be willing to buy the notes from investors, and the value that will be indicated for the
notes on any brokerage account statements prepared by CGMI or its affiliates (which value CGMI may also publish through one or more financial
information vendors), will reflect a temporary upward adjustment from the price or value that would otherwise be determined. This temporary
upward adjustment represents a portion of the hedging profit expected to be realized by CGMI or its affiliates over the term of the notes.
The amount of this temporary upward adjustment will decline to zero on a straight-line basis over the twelve-month temporary adjustment
period. However, CGMI is not obligated to buy the notes from investors at any time. See “Summary Risk Factors—The
notes will not be listed on any securities exchange and you may not be able to sell them prior to maturity.”
Contact
Clients may contact their local brokerage representative. Third-party
distributors may contact Citi Structured Investment Sales at (212) 723-7005.
© 2025 Citigroup Global Markets Inc. All rights reserved. Citi
and Citi and Arc Design are trademarks and service marks of Citigroup Inc. or its affiliates and are used and registered throughout the
world.
| Citigroup Global Markets Holdings Inc. |
| |
Annex A
Description of the S&P 500 Futures 35% Edge Volatility 6% Decrement Index (USD) ER
Overview
The S&P 500 Futures 35% Edge Volatility 6% Decrement Index (USD)
ER, which we refer to in this Annex as the “Index”, is calculated, maintained and published by S&P Dow Jones Indices
LLC. All information contained in this pricing supplement regarding the Index has been derived from information provided by
S&P Dow Jones Indices LLC. This information reflects the policies of, and is subject to change by, S&P Dow Jones Indices
LLC. S&P Dow Jones Indices LLC has no obligation to continue to publish, and may discontinue publication of, the Index. The
notes represent obligations of Citigroup Global Markets Holdings Inc. (guaranteed by Citigroup Inc.) only. S&P Dow Jones
Indices LLC is not involved in any way in this offering and has no obligation relating to the notes or to holders of the notes. The
Index was first published on May 10, 2024, and therefore has a limited performance history.
The Index tracks exposure to the S&P 500 Futures Excess Return Index
(which we refer to as the “Underlying Futures Index”) on a volatility targeted basis, less a decrement of 6%
per annum. The Index has a volatility target of 35%, which it attempts to achieve by applying leverage to its exposure to the
Underlying Futures Index (up to a maximum of 500%) when the implied volatility of the S&P 500® Index is less than the
volatility target, and by reducing its exposure to the Underlying Futures Index below 100% when the implied volatility of the S&P
500® Index is greater than the volatility target.
The Underlying Futures Index tracks the performance of a hypothetical
investment, rolled quarterly, in futures contracts on the S&P 500® Index, and accordingly is expected to reflect the
performance of the S&P 500® Index less an implicit financing cost, as described in more detail in Annex B to
this pricing supplement. The S&P 500® Index consists of the common
stocks of 500 issuers selected to provide a performance benchmark for the large capitalization segment of the U.S. equity market. For
more information about the S&P 500® Index, see “Equity Index Descriptions—The S&P U.S. Indices”
in the accompanying underlying supplement.
The Index methodology is premised
on the following key assumptions: (1) that there will be an inverse relationship between performance and volatility, so that the Underlying
Futures Index will tend to increase in times of lower volatility and decline in times of higher volatility; (2) that the implied volatility
of the S&P 500® Index, as derived from the market prices of exchange-traded options on the S&P 500®
Index on each weekly rebalancing date, will be an effective predictor of future volatility of the Underlying Futures Index over the next
week; and (3) that 35% will be an effective level of volatility at which to draw the line between leveraged exposure and deleveraged exposure
to the Underlying Futures Index. If these assumptions prove to be consistently correct, then the Index has the potential to
outperform the Underlying Futures Index by participating in increases on a leveraged basis and declines on a deleveraged basis. There
is no guarantee, however, that these assumptions will be proven correct over any given time period. If any of these assumptions
does not prove to be consistently correct, then the Index may perform poorly as a result of having highly leveraged exposure to the Underlying
Futures Index at a time of declines and/or having reduced exposure to the Underlying Futures Index at a time of increases.
If the Index is not consistently
successful in increasing exposure to the Underlying Futures Index in advance of increases in the Underlying Futures Index and reducing
exposure to the Underlying Futures Index in advance of declines in the Underlying Futures Index, then the Index is also expected to be
subject to a “decay” effect, which will exacerbate the decline in the Index that results from having highly leveraged exposure
to declines in the Underlying Futures Index. The decay effect would result from the fact that each sub-index of the Index resets
its leveraged exposure to the Underlying Futures Index on a weekly basis (as described in more detail below), and would manifest any time
the Underlying Futures Index moves in one direction one week and another direction the next. The decay effect would result
because resetting leverage after an increase but in advance of a decline would cause the Index to have increased exposure to that decline,
and resetting leverage following a decline but in advance of an increase would cause the Index to have decreased exposure to that increase. The
more this fact pattern repeats, the lower the performance of the Index would be relative to the performance of the Underlying Futures
Index.
It is important to understand
that the Index provides exposure to the S&P 500® Index that:
| 1. | may be leveraged up to 500%, or alternatively may reflect less than 100% participation; |
| 2. | is reduced by an implicit financing cost; |
| 3. | may be subject to a decay effect; and |
| 4. | is reduced by a decrement of 6% per annum. |
As a result of these features, the Index may significantly underperform
the S&P 500® Index. The Index is likely to significantly underperform the S&P 500® Index
if it is not consistently successful in increasing exposure to the Underlying Futures Index in advance
of increases in the Underlying Futures Index and reducing exposure to the Underlying Futures Index in advance of declines in the Underlying
Futures Index. The Index may significantly underperform the S&P 500® Index even if it is consistently successful
in these respects because of the implicit financing cost and the decrement, or because the reduced exposure the Index has to the Underlying
Futures Index at a time of a decline may nevertheless reflect significantly greater than 100% participation in the decline of the Underlying
Futures Index.
Certain features of the Index
– including the fact that it references the Underlying Futures Index, and not the S&P 500® Index directly, and
the decrement of 6% per annum – are designed to reduce the cost to us and our affiliates of hedging transactions that we intend
to enter into in connection with the notes as compared to an otherwise comparable index without these features. These features
will reduce the performance of the Index as compared to an otherwise comparable index without these features. The reduced cost
of hedging may make it possible for certain terms of the notes to be more favorable to you than would otherwise be the case. However,
there can be no assurance that these more favorable terms will offset the negative effects of these features on the performance of the
Index, and your return on the notes may ultimately be less favorable than it would have been without these more favorable terms but with
an index that does not contain these features.
The Index is reported by Bloomberg L.P. under the ticker symbol “SPXF3EV6.”
| Citigroup Global Markets Holdings Inc. |
| |
There are no actual assets to which any investor is entitled by virtue
of an investment linked to the Index. The Index is merely a mathematical calculation that is performed in accordance with the
methodology described in this section.
This description of the Index is only a summary of the rules by which
the Index is calculated. You should understand that this summary is more general than the precise mathematical formulations
used to calculate the Index. The mathematical calculation of the Index is described in the Index rules, which are maintained
and subject to change by S&P Dow Jones Indices LLC. The Index will be governed by and calculated in accordance with the
mathematical and other terms set forth in the Index rules, and not this description of the Index. If this description of the
Index conflicts with the Index rules, the Index rules control.
Citigroup Global Markets Inc.
(“CGMI”) worked with the sponsor of the Index in developing the guidelines and policies governing the composition and
calculation of the Index, and in that role made judgments and determinations about the Index methodology. Although CGMI no
longer has a role in making any judgments and determinations relating to the Index, the judgments and determinations previously made by
CGMI could continue to have an impact, positive or negative, on the level of the Index and the value of your notes. CGMI was
under no obligation to consider your interests as an investor in the notes in its role in developing the guidelines and policies governing
the Index.
Volatility Targeting
The Index seeks to reflect exposure to the Underlying Futures Index
while maintaining an Index volatility at its volatility target of 35%. The Index divides its exposure to the Underlying Futures
Index into five sub-indexes, each corresponding to a weekday. There is one sub-index for Monday, one for Tuesday, and so on. Each
sub-index is set to represent 20% of the Index value on the weekday corresponding to that sub-index, which we refer to as the “rebalancing
date” for that sub-index. The Index value on any given day is the weighted sum of the five sub-index values on that
day.
On each weekday, the Index resets the leverage of the sub-index for
that weekday with respect to the performance of the Underlying Futures Index over the next week. We refer to the degree of
exposure that a given sub-index has to the Underlying Futures Index from one rebalancing date for that sub-index to the next as the “leverage”
of that sub-index. The leverage of each sub-index that is set on each rebalancing date for that sub-index will be equal to
(a) the Index’s volatility target of 35% divided by (b) the implied volatility of the S&P 500® Index as
observed on that rebalancing date, subject to a maximum of 500%.
For example, if the implied volatility of the S&P 500®
Index on the rebalancing date for a sub-index were 17.50%, that sub-index would reflect 200% leverage with respect to the performance
of the Underlying Futures Index from that rebalancing date to the next rebalancing date for that sub-index (calculated as the volatility
target of 35% divided by the implied volatility of 17.50%). If a sub-index were to have 200% leverage with respect to
the performance of the Underlying Futures Index from one rebalancing date to the next, that would mean that the change in value of that
sub-index would be 200% of the return of the Underlying Futures Index over that period, whether positive or negative, before giving effect
to the decrement. Accordingly, if the return of the Underlying Futures Index were -5% over that period, the change in value
of that sub-index would be -10% over that same period, before giving effect to the decrement.
As an alternative example, if the implied volatility of the S&P
500® Index on the rebalancing date for a sub-index were 43.75%, that sub-index would reflect 80% leverage with respect
to the performance of the Underlying Futures Index from that rebalancing date to the next rebalancing date for that sub-index (calculated
as the volatility target of 35% divided by the implied volatility of 43.75%). In this circumstance, the change in value
of that sub-index from the applicable rebalancing date to the next would be 80% of the return of the Underlying Futures Index over that
period, whether positive or negative, before giving effect to the decrement. Accordingly, if the return of the Underlying Futures
Index were 5% over that period, the change in value of that sub-index would be 4% over that same period, before giving effect to the decrement. At
any time when any sub-index has less than 100% leverage with respect to the Underlying Futures Index, a portion of the sub-index corresponding
to the difference may be thought of as effectively uninvested, and no interest or other return will accrue on that portion.
The leveraged exposure of a sub-index to the Underlying Futures Index
is reset intraday on each rebalancing date for that sub-index based on:
| · | the average of the implied volatility of the S&P 500® Index calculated every minute during a calculation window
from 11:30 a.m. to 11:35 a.m., Eastern time, on that rebalancing date; |
| · | the value of the Index and the applicable sub-index at 11:35 a.m., Eastern time, on that rebalancing date; and |
| · | the time-weighted average value (an average of snapshots of the value throughout the applicable window) of the Underlying Futures
Index during the window (the “rebalancing window”) from 12:50 p.m. to 1:00 p.m., Eastern time, on that rebalancing
date. |
We refer to 1:00 p.m., Eastern time, on the rebalancing date for a sub-index
as the “rebalancing time” on that rebalancing date.
The closing value of a sub-index on any day after the most recent rebalancing
time for that sub-index, including on the rebalancing date on which the rebalancing time occurs, will reflect the performance of the Underlying
Futures Index from its time-weighted average value at that rebalancing time to its closing value on such day multiplied by the
leverage for that sub-index that was reset at that rebalancing time, less the decrement.
The value of each sub-index between rebalancing times is floored at
25% of the time-weighted average value of the sub-index at the immediately preceding rebalancing time (determined during the rebalancing
window). As a result, the maximum amount by which the value of any sub-index may decline from one rebalancing time to the next
is 75%.
| Citigroup Global Markets Holdings Inc. |
| |
If a rebalancing date for any sub-index is a holiday, that rebalancing
date will be postponed to the next weekday that is not a holiday. In addition, for scheduled or unscheduled full-day market
closures or intraday closures (where the term “closure” is deemed to include a lack of data availability), the applicable
sub-index will rebalance on the next business day when all necessary data is available.
Implied Volatility
The Index resets the leverage of each sub-index with respect to the
Underlying Futures Index on each rebalancing date for that sub-index based on a measure of the implied volatility of the S&P 500®
Index over the next week as observed on that rebalancing date. Volatility is a measure of the magnitude and frequency of changes
in the value of an asset measured at specified intervals over a given time period. The greater the magnitude and frequency
of changes in value, the greater the volatility. Implied volatility is a measure of the expected future volatility of an asset
that is derived from the price of options on that asset. The theoretical value of an option is determined to a significant
degree by the volatility of the underlying asset. Accordingly, if one makes assumptions about the other inputs to the theoretical
value of an option, one can derive the volatility of the underlying asset that is implied by the market price of that option.
The Index derives the implied volatility of the S&P 500®
Index from the prices of S&P 500 Weeklys (SPXW) options traded on the Cboe options exchange. SPXW options are options on
the S&P 500® Index with expiration dates (and a PM expiration time of 4:00 p.m.) on each weekday, except for market
holidays. The Index determines the implied volatility of the S&P 500® Index on a rebalancing date for a
sub-index based on the market prices of SPXW options expiring on the next rebalancing date for that sub-index.
The Index uses the following inputs to the Black theoretical option
pricing model to derive implied volatility:
| · | a risk-free interest rate based on US Treasury yield curve rates (captured from the US Department of the Treasury website around 6:00
p.m., New York time, every day and used for the following business day) to which linear interpolation is applied to derive the yield to
the next rebalancing date; |
| · | a forward price for the S&P 500® Index calculated at each minute from 11:30 a.m. to 11:35 a.m., Eastern time, based
on the difference between the mid-price (the average of bid and ask prices) of at-the-money call and put options on the S&P 500®
Index, where the at-the-money call and put options are the options with a strike price where the difference between the call and put mid-prices
is the smallest; and |
| · | a time to expiration equal to the amount of time from the rebalancing time on the current rebalancing date to the PM expiration time
of SPXW options on the next rebalancing date. |
The Index uses these inputs and the Black theoretical option pricing
model to derive implied volatility from the prices of SPXW call options that are at-the-money or have strike prices that are out-of-the-money
(i.e., are above the at-the-money strike) and SPXW put options that are at-the-money or have strike prices that are out-of-the-money (i.e.,
are below the at-the-money strike). (The Index excludes options with a “delta” of less than 1%, where “delta”
is a measurement of how sensitive the change in the value of the option is to changes in the value of the S&P 500®
Index.) The Index calculates an implied volatility from these prices at the end of every minute during a calculation window
from 11:30 a.m. to 11:35 a.m., Eastern time. The average of those implied volatilities on a given rebalancing date is the implied
volatility of the S&P 500® Index that the Index uses to reset the leverage of the applicable sub-index on that rebalancing
date.
The implied volatility measured by the Index is a one-week implied volatility
(subject to the following paragraph), in that it reflects market expectations of volatility over the one-week period from one rebalancing
date to the next, but is expressed in annualized terms.
If a given weekday is a holiday, then the sub-index that would normally
rebalance on that weekday will instead be rebalanced on the next weekday that is not a holiday. For example, if a Monday is
a holiday, then the Monday sub-index would rebalance instead on the following Tuesday. In that event, the Index would rebalance
two sub-indexes on that Tuesday – the Monday sub-index and the Tuesday sub-index. The Monday sub-index would be rebalanced
based on the implied volatility determined on that Tuesday for the period from that Tuesday to the next Monday (assuming the next Monday
is not a holiday), and the Tuesday sub-index would be rebalanced based on the implied volatility determined on that Tuesday for the period
from that Tuesday to the next Tuesday.
Decrement
The Index is a decrement index, which means that the value of each sub-index
of the Index will be reduced at a rate of 6% per annum. The 6% decrement is calculated between rebalancing dates on the time-weighted
average value of the applicable sub-index at the most recent rebalancing time.
The decrement will be a significant drag on the performance of the Index.
Comparison of Hypothetical Back-Tested and Historical S&P 500
Futures 35% Edge Volatility 6% Decrement Index (USD) ER Performance Against Historical S&P 500® Index Performance
The following graphs set forth a comparison of the hypothetical back-tested
and historical performance of the S&P 500 Futures 35% Edge Volatility 6% Decrement Index (USD) ER against the historical performance
of the S&P 500® Index. The first graph shows comparative performance data for the period from January 2,
2015 through February 11, 2025, each normalized to have a closing value of 100.00 on January 2, 2015 to facilitate a comparison. The
second graph shows comparative performance data for the period from January 3, 2022 through February 11, 2025, each normalized to have
a closing value of 100.00 on January 3, 2022 to facilitate a comparison. The performance of the S&P 500®
| Citigroup Global Markets Holdings Inc. |
| |
Index shown below is its price return performance – i.e., its
performance without reflecting dividends. The total return performance of the S&P 500® Index (i.e., its performance
reflecting dividends) would be greater than the price return performance shown below.
All S&P 500 Futures 35% Edge Volatility 6% Decrement Index (USD)
ER performance information prior to May 10, 2024 is hypothetical and back-tested, as the S&P 500 Futures 35% Edge Volatility 6% Decrement
Index (USD) ER did not exist prior to that date. Hypothetical back-tested performance information is subject to the significant
limitations described above under “Information About the S&P 500 Futures 35% Edge Volatility 6% Decrement Index (USD) ER”.
In the graphs below, references to “SPXF3EV6” are to the
S&P 500 Futures 35% Edge Volatility 6% Decrement Index (USD) ER and references to “SPX” are to the S&P 500®
Index.
January 2, 2015 to February 11, 2025
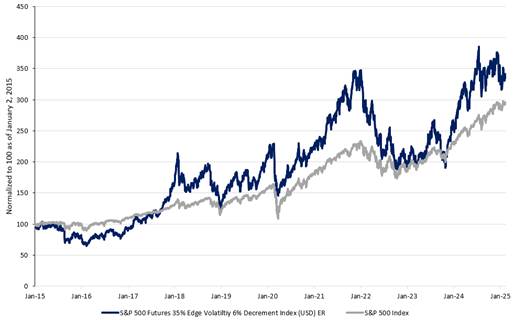
January 3, 2022 to February 11, 2025
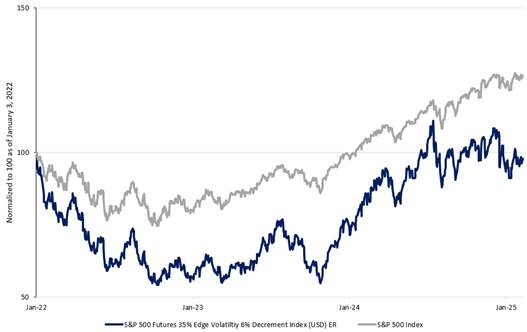
| Citigroup Global Markets Holdings Inc. |
| |
PAST PERFORMANCE OF THE S&P 500 FUTURES
35% EDGE VOLATILITY 6% DECREMENT INDEX (USD) ER AND RELATIVE PERFORMANCE BETWEEN THE S&P 500 FUTURES 35% EDGE VOLATILITY 6% DECREMENT
INDEX (USD) ER AND THE S&P 500 INDEX ARE NOT INDICATIVE OF FUTURE PERFORMANCE
Using the historical performance information from the graphs above,
the table below shows the annualized (annually compounded) performance of the S&P 500 Futures 35% Edge Volatility 6% Decrement Index
(USD) ER as compared to the S&P 500® Index for the last year, the last three years and the last five years, each as
of February 11, 2025.
| |
S&P 500 Futures 35% Edge Volatility 6% Decrement Index (USD) ER |
S&P 500® Index |
| Last 1 Year |
13.84% |
20.54% |
| Last 3 Years |
6.56% |
11.14% |
| Last 5 Years |
8.65% |
12.55% |
License Agreement
S&P Dow Jones Indices LLC (“S&P Dow Jones”) and
Citigroup Global Markets Inc. have entered into an exclusive license agreement providing for the license to Citigroup Inc. and its affiliates,
in exchange for a fee, of the right to use indices owned and published by S&P Dow Jones in connection with certain financial products,
including the notes. “Standard & Poor’s” and “S&P” are trademarks of Standard & Poor’s
Financial Services LLC (“S&P”). “Dow Jones” is a registered trademark of Dow Jones Trademark Holdings, LLC
(“Dow Jones”). Trademarks have been licensed to S&P Dow Jones and have been licensed for use by Citigroup Inc. and its
affiliates.
The license agreement between S&P Dow Jones and Citigroup Global
Markets Inc. provides that the following language must be stated in this pricing supplement:
“The notes are not sponsored, endorsed, sold or promoted by S&P
Dow Jones, Dow Jones, S&P or their respective affiliates (collectively, “S&P Dow Jones Indices”). S&P Dow Jones
Indices make no representation or warranty, express or implied, to the holders of the notes or any member of the public regarding the
advisability of investing in notes generally or in the notes particularly. S&P Dow Jones Indices’ only relationship to Citigroup
Inc. and its affiliates (other than transactions entered into in the ordinary course of business) is the licensing of certain trademarks,
trade names and service marks of S&P Dow Jones Indices and of the Index, which is determined, composed and calculated by S&P Dow
Jones Indices without regard to Citigroup Inc., its affiliates or the notes. S&P Dow Jones Indices have no obligation to take the
needs of Citigroup Inc., its affiliates or the holders of the notes into consideration in determining, composing or calculating the Index. S&P
Dow Jones Indices are not responsible for and have not participated in the determination of the timing of, prices at or quantities of
the notes to be issued or in the determination or calculation of the equation by which the notes are to be converted into cash. S&P
Dow Jones Indices have no obligation or liability in connection with the administration, marketing or trading of the notes.
S&P DOW JONES INDICES DO NOT GUARANTEE THE ACCURACY AND/OR THE COMPLETENESS
OF THE INDEX OR ANY DATA INCLUDED THEREIN AND S&P DOW JONES INDICES SHALL HAVE NO LIABILITY FOR ANY ERRORS, OMISSIONS, OR INTERRUPTIONS
THEREIN. S&P DOW JONES INDICES MAKE NO WARRANTY, EXPRESS OR IMPLIED, AS TO RESULTS TO BE OBTAINED BY CITIGROUP INC., HOLDERS OF THE
NOTES, OR ANY OTHER PERSON OR ENTITY FROM THE USE OF THE INDEX OR ANY DATA INCLUDED THEREIN. S&P DOW JONES INDICES MAKE
NO EXPRESS OR IMPLIED WARRANTIES, AND EXPRESSLY DISCLAIM ALL WARRANTIES, OF MERCHANTABILITY OR FITNESS FOR A PARTICULAR PURPOSE OR USE
WITH RESPECT TO THE INDEX OR ANY DATA INCLUDED THEREIN. WITHOUT LIMITING ANY OF THE FOREGOING, IN NO EVENT SHALL S&P DOW
JONES INDICES HAVE ANY LIABILITY FOR ANY LOST PROFITS OR INDIRECT, PUNITIVE, SPECIAL OR CONSEQUENTIAL DAMAGES, EVEN IF NOTIFIED OF THE
POSSIBILITY THEREOF. THERE ARE NO THIRD PARTY BENEFICIARIES OF ANY AGREEMENTS OR ARRANGEMENTS BETWEEN S&P DOW JONES INDICES
AND CITIGROUP INC.”
| Citigroup Global Markets Holdings Inc. |
| |
Annex B
Description of the S&P 500 Futures Excess Return Index
We have derived all information contained in this pricing supplement
regarding the S&P 500 Futures Excess Return Index, including, without limitation, its make-up, method of calculation and changes in
its components, from publicly available information. We have not independently verified such information. Such information reflects the
policies of, and is subject to change by, S&P Dow Jones Indices LLC. The S&P 500 Futures Excess Return Index was developed by
Standard & Poor’s Financial Services LLC (“S&P”) and is calculated, maintained and published by S&P Dow
Jones Indices LLC. S&P Dow Jones Indices LLC has no obligation to continue to publish, and may discontinue the publication
of, the S&P 500 Futures Excess Return Index.
The S&P 500 Futures Excess Return Index tracks futures contracts
on the S&P 500® Index. The S&P 500® Index is reported by Bloomberg L.P. under the ticker
symbol “SPX.” The S&P 500® Index consists of the common stocks of 500 issuers selected to provide
a performance benchmark for the large capitalization segment of the U.S. equity market. For more information about the S&P
500® Index, see “Equity Index Descriptions—The S&P U.S. Indices” in the accompanying underlying supplement. We
refer to the S&P 500® Index as the “reference index” for the S&P 500 Futures Excess Return Index.
The S&P 500 Futures Excess Return Index is a futures-based index. As
a futures-based index, it is expected to reflect not only the performance of its reference index (the S&P 500® Index),
but also the implicit cost of a financed position in that reference index. The cost of this financed position will adversely
affect the value of the S&P 500 Futures Excess Return Index. Any increase in market interest rates will be expected to
further increase this implicit financing cost and will increase the negative effect on the performance of the S&P 500 Futures Excess
Return Index. Because of this implicit financing cost, the S&P 500 Futures Excess Return Index is expected to underperform
the total return performance of the S&P 500® Index.
The S&P 500 Futures Excess Return Index launch date was August 2,
2010, and it is reported by Bloomberg L.P. under the ticker symbol “SPXFP.”
Index Calculation
The S&P 500 Futures Excess Return Index tracks the performance of
a hypothetical position, rolled quarterly, in the nearest-to-expiration E-mini S&P 500 futures contract. Constructed from
E-mini S&P 500 futures contracts, the S&P 500 Futures Excess Return Index includes provisions for the replacement of the current
E-mini S&P 500 futures contract in the S&P 500 Futures Excess Return Index as such futures contract approaches expiration (also
referred to as “rolling”). This replacement occurs over a one-day rolling period every quarter, which is five days
prior to the last trade date of the futures contract.
The S&P 500 Futures Excess Return Index is calculated from the price
change of the underlying E-mini S&P 500 futures contract. On any trading date, t, the value of the S&P 500 Futures Excess Return
Index is calculated as follows:

Where:
|

|
= |
The value of the S&P 500 Futures Excess Return Index on the current day, t |
|

|
= |
The value of the S&P 500 Futures Excess Return Index on the preceding day on which the S&P 500 Futures Excess Return Index was calculated, t-1 |
|

|
= |
The Contract Daily Return from day t-1 to day t,
defined as:

|
|

|
= |
The daily contract reference price of the futures contract, which is the official closing price, as designated by the exchange |
Market disruptions are situations where the exchange has failed to open
so that no trading is possible due to unforeseen events, such as computer or electric power failures, weather conditions or other events. If
any such event happens on the roll date, the roll will take place on the next business day on which no market disruptions exist.
The S&P 500 Futures Excess Return Index is an excess return index,
which in this context means that its performance will be based solely on changes in the settlement price of its underlying futures contract. An
excess return index is distinct from a total return index, which, in addition to changes in the settlement price of the underlying futures
contract, would reflect interest on a hypothetical cash position collateralizing that futures contract.
E-mini S&P 500 futures contracts
E-mini S&P 500 futures contracts were introduced in 1997 and are
traded on the Chicago Mercantile Exchange under the ticker symbol “ES.” The Chicago Mercantile Exchange trades
E-mini S&P 500 futures contracts with expiration dates in March, June, September and December of each year.
| Citigroup Global Markets Holdings Inc. |
| |
E-mini S&P 500 futures contracts differ from the futures contracts
described below under “—Futures Contracts Generally” in that E-mini S&P 500 futures contracts are cash settled only,
meaning that the 500 stocks composing the S&P 500® Index are not actually delivered upon settlement of the futures
contract. Therefore, the E-mini S&P 500 futures contracts are not contracts to actually buy and sell the stocks in the
S&P 500® Index. In all other relevant respects, however – including daily “mark to market”
and realization of gains or losses based on the difference between the current settlement price and the initial futures price –
the E-mini S&P 500 futures contracts are similar to those described below under “—Futures Contracts Generally.”
Futures Contracts Generally
Generally speaking, a futures contract is an agreement to buy or sell
an underlying asset on a future expiration date at a price that is agreed upon today. If the underlying asset is worth more
on the expiration date than the price specified in the futures contract, then the purchaser of that contract will achieve a gain on that
contract, and if it is worth less, the purchaser will incur a loss.
For example, suppose that a futures contract entered into in January
calls for the purchaser to buy the underlying asset in April at a price of $1,000. If the underlying asset is worth $1,200 in April, then
upon settlement of the futures contract in April the purchaser will buy for $1,000 an underlying asset worth $1,200, achieving a $200
gain. Conversely, if the underlying asset is worth $800 in April, then upon settlement of the futures contract in April the
purchaser will buy for $1,000 an underlying asset worth only $800, incurring a $200 loss.
The gain or loss to the purchaser of this futures contract is different
from the gain or loss that could have been achieved by the direct purchase of the underlying asset in January and the sale of that underlying
asset in April. This is because a futures contract is a “leveraged” way to invest in the underlying asset. In
other words, purchasing a futures contract is similar to borrowing money to buy the underlying asset, in that (i) it enables an investor
to gain exposure to the underlying asset without having to pay the full cost of it up front and (ii) it entails a financing cost.
This financing cost is implicit in the difference between the spot price
of the underlying asset and the futures price. A “futures price” is the price at which market participants may
agree today to buy or sell the underlying asset in the future, and the “spot price” is the current price of the underlying
asset for immediate delivery. The futures price is determined by market supply and demand and is independent of the spot price,
but it is nevertheless generally expected that the futures price will be related to the spot price in a way that reflects a financing
cost (because if it did not do so there would be an opportunity for traders to make sure profits, known as “arbitrage”). For
example, if January’s futures price is $1,000, January’s spot price may be $975. If the underlying asset is worth $1,200 in
April, the gain on the futures contract would be $200 ($1,200 minus $1,000), while the gain on a direct investment made at the January
spot price would have been $225 ($1,200 minus $975). The lower return on the futures contract as compared to the direct investment
reflects this implicit financing cost. Because of this financing cost, it is possible for a purchaser to incur a loss on a
futures contract even if the spot price of the underlying asset increases over the term of the futures contract. The amount
of this financing cost is expected to increase as general market interest rates increase.
Futures contracts are standardized instruments that are traded on an
exchange. On each trading day, the exchange determines a settlement price (which may also be referred to as a closing price)
for that futures contract based on the futures prices at which market participants entered into that futures contract on that day. Open
positions in futures contracts are “marked to market” and margin is required to be posted on each trading day. This
means that, on each trading day, the current settlement price for a futures contract is compared to the futures price at which the purchaser
entered into that futures contract. If the current settlement price has decreased from the initial futures price, then the purchaser will
be required to deposit the decrease in value of that futures contract into an account. Conversely, if the current settlement
price has increased, the purchaser will receive that cash value in its account. Accordingly, gains or losses on a futures contract
are effectively realized on a daily basis up until the point when the position in that futures contract is closed out.
Because futures contracts have expiration dates, one futures contract
must be rolled into another if there is a desire to maintain a continuous position in futures contracts on (rather than take delivery
of) a particular underlying asset. This is typically achieved by closing out the position in the existing futures contract
as its expiration date approaches and simultaneously entering into a new futures contract (at a new futures price based on the futures
price then prevailing) with a later expiration date.
Comparison of Historical S&P 500 Futures Excess Return Index
Performance Against Historical S&P 500® Index Performance
The following graph sets forth a comparison of the historical performance
of the S&P 500 Futures Excess Return Index against the historical performance of the S&P 500® Index from January
2, 2015 through February 11, 2025, each normalized to have a closing value of 100.00 on January 2, 2015 to facilitate a comparison. The
performance of the S&P 500® Index shown below is its price return performance – i.e., its performance without
reflecting dividends. The total return performance of the S&P 500® Index (i.e., its performance reflecting
dividends) would be greater than the price return performance shown below.
In the graph below, references to “SPXFP” are to the S&P
500 Futures Excess Return Index and references to “SPX” are to the S&P 500® Index.
| Citigroup Global Markets Holdings Inc. |
| |
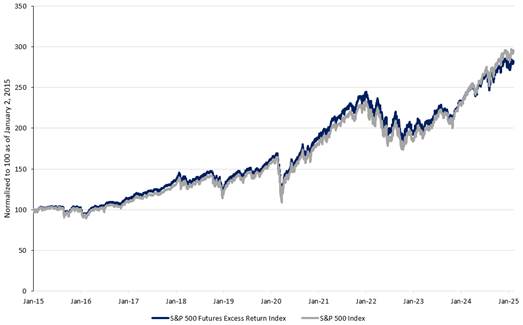
PAST PERFORMANCE OF THE S&P 500 FUTURES
EXCESS RETURN INDEX AND RELATIVE PERFORMANCE BETWEEN THE S&P 500 FUTURES EXCESS RETURN INDEX AND THE S&P 500 INDEX ARE NOT INDICATIVE
OF FUTURE PERFORMANCE
Using the historical performance information from the graph above, the
table below shows the annualized (annually compounded) performance of the S&P 500 Futures Excess Return Index as compared to the S&P
500® Index for the last year, the last three years and the last five years, each as of February 11, 2025.
| |
S&P 500 Futures Excess Return Index |
S&P 500® Index |
| Last 1 Year |
15.16% |
20.54% |
| Last 3 Years |
7.76% |
11.14% |
| Last 5 Years |
10.91% |
12.55% |
Citigroup (NYSE:C)
과거 데이터 주식 차트
부터 1월(1) 2025 으로 2월(2) 2025

Citigroup (NYSE:C)
과거 데이터 주식 차트
부터 2월(2) 2024 으로 2월(2) 2025

