UNITED STATES
SECURITIES AND EXCHANGE COMMISSION
Washington, D.C. 20549
FORM N-CSR
CERTIFIED SHAREHOLDER REPORT OF REGISTERED
MANAGEMENT INVESTMENT COMPANIES
Investment Company Act File
Number: 811-21326
Cohen & Steers REIT and Preferred and Income Fund, Inc.
(Exact name of registrant as specified
in charter)
280 Park Avenue, New York, NY 10017
(Address of principal executive
offices) (Zip code)
Dana A. DeVivo
Cohen & Steers Capital Management, Inc.
280 Park Avenue
New York, New York
10017
(Name and address of agent
for service)
Registrant’s telephone number, including area code: (212)
832-3232
Date of fiscal year
end: December 31
Date of reporting period: June 30,
2023
Item 1. Reports to Stockholders.
COHEN
& STEERS REIT AND
PREFERRED AND INCOME FUND, INC.
To Our Shareholders:
We would like to share with you our report for the six months ended June 30, 2023. The total returns for Cohen & Steers REIT and Preferred and Income Fund, Inc. (the Fund) and its comparative benchmarks were:
|
|
|
|
|
| |
|
Six Months Ended
June 30, 2023 |
|
| Cohen & Steers REIT and Preferred and Income Fund at Net Asset Value(a) |
|
|
3.55 |
% |
| Cohen & Steers REIT and Preferred and Income Fund at Market Value(a) |
|
|
–2.93 |
% |
| FTSE Nareit All Equity REITs
Index(b) |
|
|
2.97 |
% |
| ICE BofA Fixed Rate Preferred Securities Index(b) |
|
|
4.60 |
% |
| Blended Benchmark—50% FTSE Nareit All Equity REITs
Index/50% ICE BofA Fixed Rate Preferred Securities Index |
|
|
3.84 |
% |
| S&P 500
Index(b) |
|
|
16.89 |
% |
The performance data quoted represent past performance. Past performance is no guarantee of
future results. The investment return and the principal value of an investment will fluctuate and shares, if sold, may be worth more or less than their original cost. Current performance may be lower or higher than the performance data quoted.
Performance results reflect the effects of leverage, resulting from borrowings under a credit agreement. Current total returns of the Fund can be obtained by visiting our website at cohenandsteers.com. The Fund’s returns assume the reinvestment
of all dividends and distributions at prices obtained under the Fund’s dividend reinvestment plan. Index performance does not reflect the deduction of any fees, taxes or expenses. An investor cannot invest directly in an index. Performance
figures for periods shorter than one year are not annualized.
Managed Distribution Policy
The Fund, acting in accordance with an exemptive order received from the U.S. Securities and Exchange Commission (SEC) and with
approval of its Board of Directors (the Board), adopted a managed distribution policy under which the Fund intends to include long-term capital gains, where applicable, as part of the regular monthly cash distributions to its shareholders (the
Plan). The Plan gives the Fund greater flexibility to realize long-term capital gains and to distribute those gains on a regular monthly basis. In accordance with the Plan, the Fund currently distributes $0.136 per share on a monthly basis.
| (a) |
As a closed-end investment company, the price of the Fund’s exchange-traded shares will be set
by market forces and can deviate from the net asset value (NAV) per share of the Fund. |
| (b) |
The FTSE Nareit All Equity REITs Index contains all tax-qualified REITs with more than 50% of total
assets in qualifying real estate assets other than mortgages secured by real property that also meet minimum size and liquidity criteria. The ICE BofA Fixed Rate Preferred Securities Index tracks the performance of fixed-rate U.S. dollar-denominated
preferred securities issued in the U.S. domestic market. The S&P 500 Index is an unmanaged index of 500 large-capitalization stocks that is frequently used as a general measure of U.S. stock market performance. Benchmark returns are shown for
comparative purposes only and may not be representative of the Fund’s portfolio. |
1
COHEN
& STEERS REIT AND
PREFERRED AND INCOME FUND, INC.
The Fund may pay distributions in excess of the Fund’s investment company taxable income and net realized gains. This excess
would be a return of capital distributed from the Fund’s assets. Distributions of capital decrease the Fund’s total assets and, therefore, could have the effect of increasing the Fund’s expense ratio. In addition, in order to make
these distributions, the Fund may have to sell portfolio securities at a less than opportune time.
Shareholders should
not draw any conclusions about the Fund’s investment performance from the amount of these distributions or from the terms of the Fund’s Plan. The Fund’s total return based on NAV is presented in the table above as well as in the
Consolidated Financial Highlights table.
The Plan provides that the Board may amend or terminate the Plan at any time
without prior notice to Fund shareholders; however, at this time, there are no reasonably foreseeable circumstances that might cause the termination. The termination of the Plan could have the effect of creating a trading discount (if the
Fund’s stock is trading at or above NAV) or widening an existing trading discount.
Market Review
U.S. real estate securities modestly advanced in the six-month period ended June 30,
2023, although the group trailed broader equities by a wide margin. Notably, however, equity markets rose on the strength of just a few sectors, led by technology (which rallied sharply on optimism surrounding advancements in artificial
intelligence).
The U.S. economy decelerated in the first half of the year, although growth remained positive, and
worries about an impending recession receded. Major central banks continued to aggressively raise short-term lending rates to rein in inflation—in the steepest rate-hiking cycle in more than 40 years. However, with U.S. consumer prices trending
lower, the Federal Reserve appeared to be nearing a pause with its rate hikes.
Fund Performance
The Fund had a positive total return in the period based on NAV (it declined based on market price), but underperformed its blended
benchmark.
While REITs gained as a group in the period, there was a wide range of returns by property type. Health care
landlords outperformed broader REITs, with strength in certain senior housing companies. Senior housing employment showed signs of growth in the period, suggesting an optimistic outlook for staffing, which could lead to more moderate expense growth.
Stock selection in health care contributed positively to the Fund’s performance, led by an overweight in Welltower, which rallied amid a recovery in senior living occupancies.
Data center operators were a positive standout, benefiting from continued strength in cloud demand and the early innings of an
expected multiyear tailwind from artificial intelligence (AI). The Fund maintained an overweight in the data center sector during the period, which had a positive impact on relative performance.
Residential companies generally performed well, led by single-family homes landlords, which were supported by solid demand and
limited inventory. Apartment REITs gained on improving fundamentals as well as signs of early demand recovery on the West Coast. The manufactured home sector trailed as
2
COHEN
& STEERS REIT AND
PREFERRED AND INCOME FUND, INC.
home sales and transient revenues came in weaker than expected. The Fund’s overweight in single-family homes helped performance, although the
effect was countered by relatively unfavorable stock selection in the apartment and manufactured homes sectors.
Office
companies had a sizable decline, continuing to struggle with weak fundamentals and deteriorating access to capital. The Fund’s underweight in offices aided performance, as did stock selection in the sector.
In the infrastructure sector, which fell in the period, cell tower owners were hindered on a belief that wireless carrier capital
expenditure budgets likely peaked in 2022 and as lower forward earnings growth became more fully digested by the market. Our underweight in infrastructure REITs helped performance.
The self storage sector performed well, led by Life Storage, which received competing takeover bids. In April the company agreed to
be acquired by Extra Space Storage. Stock selection in the sector detracted from relative performance, as the Fund did not invest in Life Storage. Elsewhere of note, our underweight in timber REITs hindered performance, as they outperformed on
encouraging housing starts data, while stock selection in the industrials sector helped performance.
Preferred
securities had a gain in the period as measured by the preferreds component of the Fund’s blended benchmark, although they experienced significant volatility. In the U.S., the sudden collapse of Silicon Valley Bank (SVB) and Signature Bank in
March raised concerns about contagion risk.
Financial regulators took swift action to mitigate contagion risk within
the U.S. banking industry, including the Fed’s establishment of an emergency loan program, accepting as collateral U.S. Treasuries and certain other high-quality securities at their par value. In Europe, struggling Credit Suisse was acquired by
rival UBS in March. However, Credit Suisse was an outlier among European banks; other European banks do not face the same vulnerabilities as Credit Suisse. Security selection in banking detracted from the Fund’s performance, due in part to
having out-of-benchmark allocations to certain issues from Silicon Valley Bank and Credit Suisse that declined.
The insurance sector performed well during the period. Property & casualty insurance companies experienced significant
premium growth due to the recovering economy, while life insurers benefited from the declining impact of the Covid pandemic. The Fund’s security selection in insurance detracted from relative performance.
Utilities, a capital-intensive sector, benefited from declining long-term interest rates, strong earnings results, and increased
investor focus on balance sheet quality. Real estate also responded favorably to lower rates, as well as the improved economic outlook. The Fund’s security selection in utilities and real estate preferreds hindered relative performance.
Impact of Leverage on Fund Performance
The Fund employs leverage as part of a yield-enhancement strategy. Leverage, which can increase total return in rising markets
(just as it can have the opposite effect in declining markets), contributed significantly to the Fund’s performance for the six-month period ended June 30, 2023.
3
COHEN
& STEERS REIT AND
PREFERRED AND INCOME FUND, INC.
Impact of Derivatives on Fund Performance
The Fund used derivatives in the form of forward foreign currency exchange contracts for managing currency risk on certain Fund
positions denominated in foreign currencies. These instruments did not have a material effect on the Fund’s total return for the six-month period ended June 30, 2023.
The Fund used total return swaps with the intention of managing credit risk. These swaps did not have a material effect on the
Fund’s total return for the six-month period ended June 30, 2023.
The
Fund invested in European equity index options with the intention of managing volatility in certain European holdings. The equity index options did not have a material effect on the Fund’s total return for the six months ended June 30,
2023. The Fund also engaged in the buying and selling of single stock options with the intention of enhancing total returns and reducing overall volatility. These contracts did not have a material effect on the Fund’s total return for the
six-month period ended June 30, 2023.
In connection with its use of leverage, the Fund pays interest on a portion
of its borrowings based on a floating rate under the terms of its credit agreement. To reduce the impact that an increase in interest rates could have on the performance of the Fund with respect to these borrowings, the Fund used interest rate swaps
to exchange a portion of the floating rate for a fixed rate. The Fund’s use of these swaps contributed to the Fund’s total return for the six-month period ended June 30, 2023.
Sincerely,
|
|
|

|
|

|
|
|
| WILLIAM F. SCAPELL |
|
JASON YABLON |
| Portfolio Manager |
|
Portfolio Manager |
|
|

|
|

|
| ELAINE ZAHARIS-NIKAS
Portfolio Manager |
|
MATHEW KIRSCHNER
Portfolio Manager |

JERRY DOROST
Portfolio Manager
4
COHEN
& STEERS REIT AND
PREFERRED AND INCOME FUND, INC.
The views and opinions in the preceding commentary are subject to change without notice and are as of the date of the report.
There is no guarantee that any market forecast set forth in the commentary will be realized. This material represents an assessment of the market environment at a specific point in time, should not be relied upon as investment advice and is not
intended to predict or depict performance of any investment.
Visit Cohen & Steers online at cohenandsteers.com
For more information about the Cohen & Steers family of mutual funds, visit cohenandsteers.com. Here you will
find fund net asset values, fund fact sheets and portfolio highlights, as well as educational resources and timely market updates.
Our website also provides comprehensive information about Cohen & Steers, including our
most recent press releases, profiles of our senior investment professionals and their investment approach to each asset class. The Cohen & Steers family of mutual funds specializes in liquid real assets, including real estate securities, listed
infrastructure and natural resource equities, as well as preferred securities and other income solutions.
5
COHEN
& STEERS REIT AND
PREFERRED AND INCOME FUND, INC.
Performance Review (Unaudited)
Average Annual Total Returns—For Periods Ended June 30, 2023
|
|
|
|
|
|
|
|
|
|
|
|
|
|
|
|
|
| |
|
1 Year |
|
|
5 Years |
|
|
10 Years |
|
|
Since
Inception(a) |
|
|
Fund at NAV |
|
|
–1.36 |
% |
|
|
6.46 |
% |
|
|
8.79 |
% |
|
|
8.83 |
% |
|
Fund at Market Value |
|
|
1.00 |
% |
|
|
7.79 |
% |
|
|
9.07 |
% |
|
|
8.31 |
% |
The performance data quoted represent past performance. Past performance is no guarantee of future results. The
investment return will vary and the principal value of an investment will fluctuate and shares, if sold, may be worth more or less than their original cost. Current performance may be lower or higher than the performance data quoted. Performance
results reflect the effect of leverage from utilization of borrowings under a credit agreement. Current total returns of the Fund can be obtained by visiting our website at cohenandsteers.com. The Fund’s returns assume the reinvestment of all
dividends and distributions at prices obtained under the Fund’s dividend reinvestment plan. The performance table does not reflect the deduction of taxes that a shareholder would pay on Fund distributions or the sale of Fund shares.
| (a) |
Commencement of investment operations is June 27, 2003. |
6
COHEN
& STEERS REIT AND
PREFERRED AND INCOME FUND, INC.
Our Leverage Strategy
(Unaudited)
Our current leverage strategy utilizes borrowings up to the maximum
permitted by the Investment Company Act of 1940 to provide additional capital for the Fund, with an objective of increasing net income available for shareholders. As of June 30, 2023, leverage represented 32% of the Fund’s managed assets.
Through a combination of variable and fixed rate financing, the Fund has locked in interest rates on a
significant portion of this additional capital through 2027 (where we effectively reduce our variable rate obligation and lock in our fixed rate obligation over various terms). Locking in a significant portion of our leveraging costs is designed to
protect the dividend-paying ability of the Fund. The use of leverage increases the volatility of the Fund’s NAV in both up and down markets. However, we believe that locking in portions of the Fund’s leveraging costs for the various terms
partially protects the Fund’s expenses from an increase in short-term interest rates.
Leverage Facts(a)(b)
|
|
|
| Leverage (as a % of managed assets) |
|
32% |
| % Variable Rate Financing |
|
19% |
| Variable Rate |
|
6.0% |
| % Fixed Rate
Financing(c) |
|
81% |
| Weighted Average Rate on Fixed Financing |
|
1.8% |
| Weighted Average Term on Fixed Financing |
|
3.1 years |
The Fund seeks to enhance its dividend yield through leverage. The use of leverage
is a speculative technique and there are special risks and costs associated with leverage. The NAV of the Fund’s shares may be reduced by the issuance and ongoing costs of leverage. So long as the Fund is able to invest in securities that
produce an investment yield that is greater than the total cost of leverage, the leverage strategy will produce higher current net investment income for shareholders. On the other hand, to the extent that the total cost of leverage exceeds the
incremental income gained from employing such leverage, shareholders would realize lower net investment income. In addition to the impact on net income, the use of leverage will have an effect of magnifying capital appreciation or depreciation for
shareholders. Specifically, in an up market, leverage will typically generate greater capital appreciation than if the Fund were not employing leverage. Conversely, in down markets, the use of leverage will generally result in greater capital
depreciation than if the Fund had been unlevered. To the extent that the Fund is required or elects to reduce its leverage, the Fund may need to liquidate investments, including under adverse economic conditions which may result in capital losses
potentially reducing returns to shareholders. There can be no assurance that a leveraging strategy will be successful during any period in which it is employed.
| (a) |
Data as of June 30, 2023. Information is subject to change. |
| (b) |
See Note 9 in Notes to Consolidated Financial Statements. |
| (c) |
Represents fixed payer interest rate swap contracts on variable rate borrowing.
|
7
COHEN
& STEERS REIT AND
PREFERRED AND INCOME FUND, INC.
June 30, 2023
Top Ten Holdings(a)
(Unaudited)
|
|
|
|
|
|
|
|
|
| Security |
|
Value |
|
|
% of
Managed
Assets |
|
|
|
|
| Prologis, Inc. |
|
$ |
74,705,583 |
|
|
|
5.3 |
|
| American Tower Corp. |
|
|
55,842,890 |
|
|
|
4.0 |
|
| Welltower, Inc. |
|
|
52,296,841 |
|
|
|
3.7 |
|
| Invitation Homes, Inc. |
|
|
43,427,626 |
|
|
|
3.1 |
|
| Digital Realty Trust, Inc. |
|
|
42,845,865 |
|
|
|
3.1 |
|
| Realty Income Corp. |
|
|
42,812,032 |
|
|
|
3.0 |
|
| Simon Property Group, Inc. |
|
|
38,766,405 |
|
|
|
2.8 |
|
| Equinix, Inc. |
|
|
31,525,363 |
|
|
|
2.2 |
|
| Mid-America Apartment Communities,
Inc. |
|
|
29,150,286 |
|
|
|
2.1 |
|
| Crown Castle, Inc. |
|
|
27,261,056 |
|
|
|
1.9 |
|
| (a) |
Top ten holdings (excluding short-term investments and derivative instruments) are determined on
the basis of the value of individual securities held. The Fund may also hold positions in other securities issued by the companies listed above. See the Consolidated Schedule of Investments for additional details on such other positions.
|
Sector Breakdown(b)
(Based on Managed Assets)
(Unaudited)
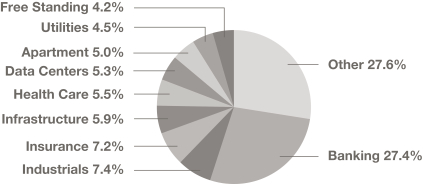
| (b) |
Excludes derivative instruments. |
8
COHEN
& STEERS REIT AND
PREFERRED AND INCOME FUND, INC.
CONSOLIDATED SCHEDULE OF INVESTMENTS
June 30, 2023 (Unaudited)
|
|
|
|
|
|
|
|
|
|
|
|
|
| |
|
|
|
|
Shares |
|
|
Value |
|
| COMMON STOCK—REAL
ESTATE |
|
|
70.2% |
|
|
|
|
|
|
|
|
|
| APARTMENT |
|
|
7.3% |
|
|
|
|
|
|
|
|
|
| Apartment Income REIT
Corp.(a)(b) |
|
|
|
157,962 |
|
|
$ |
5,700,848 |
|
| Camden Property
Trust(a)(b) |
|
|
|
129,141 |
|
|
|
14,059,581 |
|
| Mid-America Apartment Communities, Inc.(a)(b) |
|
|
|
191,955 |
|
|
|
29,150,286 |
|
| UDR,
Inc.(a)(b) |
|
|
|
481,228 |
|
|
|
20,673,555 |
|
|
|
|
|
|
|
|
|
|
|
|
|
|
|
|
|
|
69,584,270 |
|
|
|
|
|
|
|
| DATA CENTERS |
|
|
7.8% |
|
|
|
|
|
|
|
|
|
| Digital Realty Trust,
Inc.(a)(b) |
|
|
|
376,270 |
|
|
|
42,845,865 |
|
| Equinix,
Inc.(a)(b) |
|
|
|
40,214 |
|
|
|
31,525,363 |
|
|
|
|
|
|
|
|
|
|
|
|
|
|
|
|
|
|
74,371,228 |
|
|
|
|
|
|
|
| DIVERSIFIED |
|
|
0.7% |
|
|
|
|
|
|
|
|
|
| WP Carey, Inc. |
|
|
|
95,817 |
|
|
|
6,473,397 |
|
|
|
|
|
|
|
| FREE STANDING |
|
|
6.2% |
|
|
|
|
|
|
|
|
|
| NETSTREIT
Corp.(a)(b) |
|
|
|
249,581 |
|
|
|
4,460,012 |
|
| Realty Income
Corp.(a)(b) |
|
|
|
716,040 |
|
|
|
42,812,032 |
|
| Spirit Realty Capital,
Inc.(a)(b)(c) |
|
|
|
295,869 |
|
|
|
11,651,321 |
|
|
|
|
|
|
|
|
|
|
|
|
|
|
|
|
|
|
58,923,365 |
|
|
|
|
|
|
|
| HEALTH CARE |
|
|
8.1% |
|
|
|
|
|
|
|
|
|
| Healthcare Realty Trust, Inc., Class A(a)(b) |
|
|
|
1,098,232 |
|
|
|
20,712,656 |
|
| Medical Properties Trust, Inc. |
|
|
|
454,767 |
|
|
|
4,211,142 |
|
| Welltower,
Inc.(b) |
|
|
|
646,518 |
|
|
|
52,296,841 |
|
|
|
|
|
|
|
|
|
|
|
|
|
|
|
|
|
|
77,220,639 |
|
|
|
|
|
|
|
| HOTEL |
|
|
1.1% |
|
|
|
|
|
|
|
|
|
| Host Hotels & Resorts, Inc.(a)(b) |
|
|
|
600,246 |
|
|
|
10,102,140 |
|
|
|
|
|
|
|
| INDUSTRIALS |
|
|
10.5% |
|
|
|
|
|
|
|
|
|
| Americold Realty Trust,
Inc.(a)(b) |
|
|
|
583,096 |
|
|
|
18,834,001 |
|
| BG LLH, LLC (Lineage Logistics)(d)(k) |
|
|
|
61,115 |
|
|
|
6,553,919 |
|
| Prologis,
Inc.(b) |
|
|
|
609,195 |
|
|
|
74,705,583 |
|
|
|
|
|
|
|
|
|
|
|
|
|
|
|
|
|
|
100,093,503 |
|
|
|
|
|
|
|
| INFRASTRUCTURE |
|
|
8.7% |
|
|
|
|
|
|
|
|
|
| American Tower
Corp.(a)(b) |
|
|
|
|
|
|
287,939 |
|
|
|
55,842,890 |
|
| Crown Castle,
Inc.(a)(b) |
|
|
|
239,258 |
|
|
|
27,261,056 |
|
|
|
|
|
|
|
|
|
|
|
|
|
|
|
|
|
|
83,103,946 |
|
|
|
|
|
|
|
See accompanying notes to the consolidated financial statements.
9
COHEN
& STEERS REIT AND
PREFERRED AND INCOME FUND, INC.
CONSOLIDATED SCHEDULE OF INVESTMENTS—(Continued)
June 30, 2023 (Unaudited)
|
|
|
|
|
|
|
|
|
|
|
|
|
| |
|
|
|
|
Shares |
|
|
Value |
|
| MANUFACTURED HOME |
|
|
2.1% |
|
|
|
|
|
|
|
|
|
| Sun Communities,
Inc.(a)(b) |
|
|
|
156,647 |
|
|
$
|
20,436,168 |
|
|
|
|
|
|
|
|
|
|
|
|
|
|
| OFFICE |
|
|
0.9% |
|
|
|
|
|
|
|
|
|
| Cousins Properties, Inc. |
|
|
|
|
|
|
201,339 |
|
|
|
4,590,529 |
|
| Highwoods Properties,
Inc.(b) |
|
|
|
|
|
|
188,322 |
|
|
|
4,502,779 |
|
|
|
|
|
|
|
|
|
|
|
|
|
|
|
|
|
|
9,093,308 |
|
|
|
|
|
|
|
|
|
|
|
|
|
|
| REGIONAL MALL |
|
|
4.1% |
|
|
|
|
|
|
|
|
|
| Simon Property Group,
Inc.(a)(b)(c) |
|
|
|
335,698 |
|
|
|
38,766,405 |
|
|
|
|
|
|
|
|
|
|
|
|
|
|
| SELF STORAGE |
|
|
3.6% |
|
|
|
|
|
|
|
|
|
| Extra Space Storage,
Inc.(b) |
|
|
|
148,133 |
|
|
|
22,049,597 |
|
| Public Storage |
|
|
|
43,148 |
|
|
|
12,594,038 |
|
|
|
|
|
|
|
|
|
|
|
|
|
|
|
|
|
|
|
|
|
|
|
|
|
34,643,635 |
|
|
|
|
|
|
|
|
|
|
|
|
|
|
| SHOPPING CENTERS |
|
|
1.9% |
|
|
|
|
|
|
|
|
|
| Kimco Realty
Corp.(b) |
|
|
|
904,912 |
|
|
|
17,844,865 |
|
|
|
|
|
|
|
|
|
|
|
|
|
|
| SINGLE FAMILY HOMES |
|
|
5.4% |
|
|
|
|
|
|
|
|
|
| American Homes 4 Rent, Class A |
|
|
|
227,301 |
|
|
|
8,057,821 |
|
| Invitation Homes,
Inc.(a)(b)(c) |
|
|
|
1,262,431 |
|
|
|
43,427,626 |
|
|
|
|
|
|
|
|
|
|
|
|
|
|
|
|
|
|
|
|
|
|
|
|
|
51,485,447 |
|
|
|
|
|
|
|
|
|
|
|
|
|
|
| SPECIALTY |
|
|
1.4% |
|
|
|
|
|
|
|
|
|
| Iron Mountain, Inc. |
|
|
|
64,327 |
|
|
|
3,655,060 |
|
| Lamar Advertising Co., Class A |
|
|
|
33,466 |
|
|
|
3,321,501 |
|
| VICI Properties, Inc., Class A(a)(b) |
|
|
|
195,637 |
|
|
|
6,148,871 |
|
|
|
|
|
|
|
|
|
|
|
|
|
|
|
|
|
|
|
|
|
|
|
|
|
13,125,432 |
|
|
|
|
|
|
|
|
|
|
|
|
|
|
| TIMBER |
|
|
0.4% |
|
|
|
|
|
|
|
|
|
| Weyerhaeuser
Co.(a)(b) |
|
|
|
117,855 |
|
|
|
3,949,321 |
|
|
|
|
|
|
|
|
|
|
|
|
|
|
| TOTAL COMMON
STOCK
(Identified cost—$528,217,702) |
|
|
|
|
|
|
|
669,217,069 |
|
|
|
|
|
|
|
|
|
|
|
|
|
|
| EXCHANGE-TRADED
FUNDS—PREFERRED |
|
|
0.2% |
|
|
|
|
|
|
|
|
|
| iShares Preferred & Income Securities ETF(b) |
|
|
|
68,892 |
|
|
|
2,130,830 |
|
|
|
|
|
|
|
|
|
|
|
|
|
|
| TOTAL EXCHANGE-TRADED
FUNDS
(Identified cost—$2,046,595) |
|
|
|
|
|
|
|
2,130,830 |
|
|
|
|
|
|
|
|
|
|
|
|
|
|
| PREFERRED
SECURITIES—EXCHANGE-TRADED |
|
|
12.2% |
|
|
|
|
|
|
|
|
|
| BANKING |
|
|
3.6% |
|
|
|
|
|
|
|
|
|
| Bank of America Corp., 6.00%, Series GG(b)(e) |
|
|
|
137,567 |
|
|
|
3,436,424 |
|
See accompanying notes to the consolidated financial statements.
10
COHEN
& STEERS REIT AND
PREFERRED AND INCOME FUND, INC.
CONSOLIDATED SCHEDULE OF INVESTMENTS—(Continued)
June 30, 2023 (Unaudited)
|
|
|
|
|
|
|
|
|
|
|
|
|
| |
|
|
|
|
Shares |
|
|
Value |
|
| Bank of America Corp., 5.875%, Series HH(e) |
|
|
|
141,663 |
|
|
$
|
3,494,826 |
|
| Bank of America Corp., 5.00%, Series LL(a)(b)(e) |
|
|
|
81,745 |
|
|
|
1,781,224 |
|
| Bank of America Corp., 4.25%, Series QQ(e) |
|
|
|
183,210 |
|
|
|
3,426,027 |
|
| Bank of America Corp., 4.75%, Series SS(e) |
|
|
|
16,348 |
|
|
|
336,278 |
|
| Dime Community Bancshares, Inc., 5.50%(e) |
|
|
|
38,941 |
|
|
|
637,075 |
|
| Federal Agricultural Mortgage Corp., 4.875%, Series G(b)(e) |
|
|
|
93,596 |
|
|
|
1,914,974 |
|
| KeyCorp., 6.20% to
12/15/27(b)(e)(f) |
|
|
|
43,521 |
|
|
|
830,381 |
|
| Regions Financial Corp., 6.375% to 9/15/24, Series B(b)(e)(f) |
|
|
|
1,146 |
|
|
|
26,163 |
|
| Regions Financial Corp., 5.70% to 5/15/29, Series C(b)(e)(f) |
|
|
|
72,265 |
|
|
|
1,477,819 |
|
| Texas Capital Bancshares, Inc., 5.75%, Series B(e) |
|
|
|
125,235 |
|
|
|
2,388,232 |
|
| Washington Federal, Inc., 4.875%, Series A(b)(e) |
|
|
|
48,643 |
|
|
|
724,781 |
|
| Wells Fargo & Co., 4.70%, Series AA(b)(e) |
|
|
|
139,460 |
|
|
|
2,571,642 |
|
| Wells Fargo & Co., 4.375%, Series CC(e) |
|
|
|
234,250 |
|
|
|
4,090,005 |
|
| Wells Fargo & Co., 4.25%, Series DD(b)(e) |
|
|
|
170,853 |
|
|
|
2,914,752 |
|
| Wells Fargo & Co., 5.85%, Series Q(b)(e)(g) |
|
|
|
30,000 |
|
|
|
750,300 |
|
| Wells Fargo & Co., 5.625%, Series Y(a)(b)(e) |
|
|
|
93,061 |
|
|
|
2,151,570 |
|
| Wells Fargo & Co., 4.75%, Series Z(a)(b)(e) |
|
|
|
72,101 |
|
|
|
1,372,803 |
|
|
|
|
|
|
|
|
|
|
|
|
|
|
|
|
|
|
|
|
|
|
|
|
|
34,325,276 |
|
|
|
|
|
|
|
|
|
|
|
|
|
|
| BROKERAGE |
|
|
1.7% |
|
|
|
|
|
|
|
|
|
| Morgan Stanley, 6.875% to 1/15/24, Series F(a)(b)(e) |
|
|
|
25,704 |
|
|
|
650,825 |
|
| Morgan Stanley, 6.375% to 10/15/24, Series I(a)(b)(e) |
|
|
|
245,702 |
|
|
|
6,029,527 |
|
| Morgan Stanley, 5.85% to 4/15/27, Series K(b)(e) |
|
|
|
59,056 |
|
|
|
1,388,406 |
|
| Morgan Stanley, 4.25%, Series O(b)(e) |
|
|
|
259,556 |
|
|
|
4,827,742 |
|
| Morgan Stanley, 6.50%, Series P(b)(e) |
|
|
|
112,980 |
|
|
|
2,932,961 |
|
|
|
|
|
|
|
|
|
|
|
|
|
|
|
|
|
|
|
|
|
|
|
|
|
15,829,461 |
|
|
|
|
|
|
|
|
|
|
|
|
|
|
| CONSUMER STAPLE PRODUCTS |
|
|
0.6% |
|
|
|
|
|
|
|
|
|
| CHS, Inc., 7.10% to 3/31/24, Series 2(b)(e)(f) |
|
|
|
110,595 |
|
|
|
2,801,372 |
|
| CHS, Inc., 6.75% to 9/30/24, Series 3(e)(f) |
|
|
|
102,892 |
|
|
|
2,598,023 |
|
| CHS, Inc., 7.50%, Series
4(b)(e) |
|
|
|
28,801 |
|
|
|
757,178 |
|
|
|
|
|
|
|
|
|
|
|
|
|
|
|
|
|
|
|
|
|
|
|
|
|
6,156,573 |
|
|
|
|
|
|
|
|
|
|
|
|
|
|
| FINANCE |
|
|
0.1% |
|
|
|
|
|
|
|
|
|
| Brookfield Finance, Inc., 4.625%, due 10/16/80, Series 50 (Canada)(b) |
|
|
|
88,400 |
|
|
|
1,449,760 |
|
|
|
|
|
|
|
|
|
|
|
|
|
|
See accompanying notes to the consolidated financial statements.
11
COHEN
& STEERS REIT AND
PREFERRED AND INCOME FUND, INC.
CONSOLIDATED SCHEDULE OF INVESTMENTS—(Continued)
June 30, 2023 (Unaudited)
|
|
|
|
|
|
|
|
|
|
|
|
|
| |
|
|
|
|
Shares |
|
|
Value |
|
| HOTEL |
|
|
0.2% |
|
|
|
|
|
|
|
|
|
| Pebblebrook Hotel Trust, 6.375%, Series G(b)(e) |
|
|
|
81,600 |
|
|
$
|
1,525,920 |
|
|
|
|
|
|
|
|
|
|
|
|
|
|
| INDUSTRIALS |
|
|
0.4% |
|
|
|
|
|
|
|
|
|
| LXP Industrial Trust, 6.50%, Series C ($50 Par Value)(b)(e) |
|
|
|
76,536 |
|
|
|
3,798,482 |
|
|
|
|
|
|
|
|
|
|
|
|
|
|
| INSURANCE |
|
|
2.6% |
|
|
|
|
|
|
|
|
|
| Allstate Corp./The, 7.375%, Series J(e) |
|
|
|
108,105 |
|
|
|
2,889,646 |
|
| Arch Capital Group Ltd., 4.55%, Series G(b)(e) |
|
|
|
67,650 |
|
|
|
1,289,409 |
|
| Assurant, Inc., 5.25%, due 1/15/61(b) |
|
|
|
31,954 |
|
|
|
602,652 |
|
| Athene Holding Ltd., 6.35% to 6/30/29, Series A(b)(e)(f) |
|
|
|
85,720 |
|
|
|
1,800,120 |
|
| Athene Holding Ltd., 5.625%, Series B(a)(b)(e) |
|
|
|
33,926 |
|
|
|
656,129 |
|
| Athene Holding Ltd., 4.875%, Series D(b)(e) |
|
|
|
85,266 |
|
|
|
1,389,836 |
|
| Athene Holding Ltd., 7.75% to 12/30/27, Series E(b)(e)(f) |
|
|
|
87,918 |
|
|
|
2,101,240 |
|
| Brighthouse Financial, Inc., 5.375%, Series C(b)(e) |
|
|
|
72,272 |
|
|
|
1,205,497 |
|
| Enstar Group Ltd., 7.00% to 9/1/28, Series D(b)(e)(f) |
|
|
|
63,422 |
|
|
|
1,446,656 |
|
| Equitable Holdings, Inc., 5.25%, Series A(b)(e) |
|
|
|
51,202 |
|
|
|
1,023,528 |
|
| Kemper Corp., 5.875% to 3/15/27, due 3/15/62(b)(f) |
|
|
|
35,230 |
|
|
|
616,525 |
|
| Lincoln National Corp., 9.00%, Series D(e) |
|
|
|
98,733 |
|
|
|
2,653,943 |
|
| MetLife, Inc., 5.625%, Series E(e) |
|
|
|
9,379 |
|
|
|
231,849 |
|
| MetLife, Inc., 4.75%, Series F(b)(e) |
|
|
|
67,121 |
|
|
|
1,422,965 |
|
| Prudential Financial, Inc., 5.95%, due 9/1/62(b) |
|
|
|
46,257 |
|
|
|
1,161,976 |
|
| Reinsurance Group of America, Inc., 7.125% to 10/15/27, due 10/15/52(b)(f) |
|
|
|
137,357 |
|
|
|
3,497,109 |
|
| RenaissanceRe Holdings Ltd., 4.20%, Series G (Bermuda)(a)(b)(e) |
|
|
|
39,843 |
|
|
|
713,190 |
|
|
|
|
|
|
|
|
|
|
|
|
|
|
|
|
|
|
|
|
|
|
|
|
|
24,702,270 |
|
|
|
|
|
|
|
|
|
|
|
|
|
|
| PIPELINES |
|
|
0.7% |
|
|
|
|
|
|
|
|
|
| Energy Transfer LP, 7.625% to 8/15/23, Series D(b)(e)(f) |
|
|
|
135,000 |
|
|
|
3,410,100 |
|
| Energy Transfer LP, 7.60% to 5/15/24, Series E(e)(f) |
|
|
|
119,381 |
|
|
|
2,910,509 |
|
|
|
|
|
|
|
|
|
|
|
|
|
|
|
|
|
|
|
|
|
|
|
|
|
6,320,609 |
|
|
|
|
|
|
|
|
|
|
|
|
|
|
| REGIONAL MALL |
|
|
0.3% |
|
|
|
|
|
|
|
|
|
| Brookfield Property Partners LP, 5.75%, Series A(b)(e) |
|
|
|
104,400 |
|
|
|
1,435,500 |
|
| Brookfield Property Partners LP, 6.375%, Series A2(b)(e) |
|
|
|
92,000 |
|
|
|
1,252,120 |
|
|
|
|
|
|
|
|
|
|
|
|
|
|
|
|
|
|
|
|
|
|
|
|
|
2,687,620 |
|
|
|
|
|
|
|
|
|
|
|
|
|
|
| TELECOMMUNICATION SERVICES |
|
|
0.8% |
|
|
|
|
|
|
|
|
|
| AT&T, Inc., 5.35%, due 11/1/66(b) |
|
|
|
29,063 |
|
|
|
697,512 |
|
See accompanying notes to the consolidated financial statements.
12
COHEN
& STEERS REIT AND
PREFERRED AND INCOME FUND, INC.
CONSOLIDATED SCHEDULE OF INVESTMENTS—(Continued)
June 30, 2023 (Unaudited)
|
|
|
|
|
|
|
|
|
|
|
|
|
| |
|
|
|
|
Shares |
|
|
Value |
|
| Telephone and Data Systems, Inc., 6.625%, Series UU(b)(e) |
|
|
|
41,584 |
|
|
$
|
627,918 |
|
| Telephone and Data Systems, Inc., 6.00%, Series VV(a)(b)(e) |
|
|
|
128,791 |
|
|
|
1,769,588 |
|
| United States Cellular Corp., 5.50%, due 3/1/70(b) |
|
|
|
127,486 |
|
|
|
1,861,296 |
|
| United States Cellular Corp., 5.50%, due 6/1/70(b) |
|
|
|
71,578 |
|
|
|
1,037,881 |
|
| United States Cellular Corp., 6.25%, due 9/1/69, Class C(a)(b) |
|
|
|
119,322 |
|
|
|
1,998,644 |
|
|
|
|
|
|
|
|
|
|
|
|
|
|
|
|
|
|
|
|
|
|
|
|
|
7,992,839 |
|
|
|
|
|
|
|
|
|
|
|
|
|
|
| UTILITIES |
|
|
1.2% |
|
|
|
|
|
|
|
|
|
| Algonquin Power & Utilities Corp., 6.875% to 10/17/23, due 10/17/78
(Canada)(b)(f) |
|
|
|
74,199 |
|
|
|
1,886,139 |
|
| Algonquin Power & Utilities Corp., 6.20% to 7/1/24, due 7/1/79, Series
19-A (Canada)(b)(f) |
|
|
|
136,356 |
|
|
|
3,254,818 |
|
| BIP Bermuda Holdings I Ltd., 5.125% (Canada)(b)(e) |
|
|
|
14,141 |
|
|
|
246,053 |
|
| Brookfield BRP Holdings Canada, Inc., 4.625% (Canada)(b)(e) |
|
|
|
78,000 |
|
|
|
1,215,240 |
|
| Brookfield BRP Holdings Canada, Inc., 4.875% (Canada)(b)(e) |
|
|
|
60,941 |
|
|
|
1,020,152 |
|
| Brookfield Infrastructure Finance ULC, 5.00%, due 5/24/81 (Canada)(b) |
|
|
|
81,825 |
|
|
|
1,517,035 |
|
| Brookfield Infrastructure Partners LP, 5.125%, Series 13 (Canada)(b)(e) |
|
|
|
93,591 |
|
|
|
1,780,101 |
|
| NiSource, Inc., 6.50% to 3/15/24, Series B(b)(e)(f) |
|
|
|
26,433 |
|
|
|
665,847 |
|
|
|
|
|
|
|
|
|
|
|
|
|
|
|
|
|
|
|
|
|
|
|
|
|
11,585,385 |
|
|
|
|
|
|
|
|
|
|
|
|
|
|
| TOTAL PREFERRED
SECURITIES—EXCHANGE-TRADED
(Identified cost—$130,580,031) |
|
|
|
|
|
|
|
116,374,195 |
|
|
|
|
|
|
|
|
|
|
|
|
|
|
|
|
|
|
| |
|
|
|
|
Principal
Amount |
|
|
|
|
| PREFERRED
SECURITIES—OVER-THE-COUNTER |
|
|
59.4% |
|
|
|
|
|
|
|
|
|
| BANKING |
|
|
36.7% |
|
|
|
|
|
|
|
|
|
| Abanca Corp. Bancaria SA, 6.00% to 1/20/26 (Spain)(e)(f)(h)(i) |
|
|
$ |
1,800,000 |
|
|
|
1,701,356 |
|
| AIB Group PLC, 6.25% to 6/23/25 (Ireland)(e)(f)(h)(i) |
|
|
|
2,000,000 |
|
|
|
2,066,343 |
|
| Ally Financial, Inc., 4.70% to 5/15/28, Series C(b)(e)(f) |
|
|
|
3,437,000 |
|
|
|
2,225,458 |
|
| Banco Bilbao Vizcaya Argentaria SA, 6.50% to 3/5/25, Series 9
(Spain)(a)(b)(e)(f)(i) |
|
|
|
3,000,000 |
|
|
|
2,820,600 |
|
See accompanying notes to the consolidated financial statements.
13
COHEN
& STEERS REIT AND
PREFERRED AND INCOME FUND, INC.
CONSOLIDATED SCHEDULE OF INVESTMENTS—(Continued)
June 30, 2023 (Unaudited)
|
|
|
|
|
|
|
|
|
|
|
| |
|
|
|
Principal
Amount |
|
|
Value |
|
| Banco BPM SpA, 7.00% to 4/12/27 (Italy)(e)(f)(h)(i) |
|
$
|
800,000 |
|
|
$
|
790,587 |
|
| Banco de Sabadell SA, 5.75% to 3/15/26 (Spain)(e)(f)(h)(i) |
|
|
800,000 |
|
|
|
736,888 |
|
| Banco de Sabadell SA, 9.375% to 7/18/28 (Spain)(e)(f)(h)(i) |
|
|
2,000,000 |
|
|
|
2,123,264 |
|
| Banco Mercantil del Norte SA/Grand Cayman, 6.625% to 1/24/32
(Mexico)(b)(e)(f)(i)(j) |
|
|
1,600,000 |
|
|
|
1,238,400 |
|
| Banco Santander SA, 4.75% to 11/12/26 (Spain)(b)(e)(f)(i) |
|
|
1,000,000 |
|
|
|
767,729 |
|
| Bank of America Corp., 5.875% to 3/15/28, Series FF(b)(e)(f) |
|
|
2,916,000 |
|
|
|
2,675,430 |
|
| Bank of America Corp., 6.10% to 3/17/25, Series AA(b)(e)(f) |
|
|
4,750,000 |
|
|
|
4,721,500 |
|
| Bank of America Corp., 6.125% to 4/27/27, Series TT(e)(f) |
|
|
3,760,000 |
|
|
|
3,683,484 |
|
| Bank of America Corp., 6.25% to 9/5/24, Series X(b)(e)(f) |
|
|
6,868,000 |
|
|
|
6,799,320 |
|
| Bank of America Corp., 6.30% to 3/10/26, Series DD(b)(e)(f) |
|
|
1,821,000 |
|
|
|
1,825,097 |
|
| Bank of America Corp., 6.50% to 10/23/24, Series Z(a)(b)(e)(f) |
|
|
5,363,000 |
|
|
|
5,361,498 |
|
| Bank of Ireland Group PLC, 6.00% to 9/1/25 (Ireland)(e)(f)(h)(i) |
|
|
1,600,000 |
|
|
|
1,656,512 |
|
| Bank of Ireland Group PLC, 7.50% to 5/19/25 (Ireland)(e)(f)(h)(i) |
|
|
3,800,000 |
|
|
|
4,074,805 |
|
| Bank of Nova Scotia/The, 4.90% to 6/4/25 (Canada)(b)(e)(f) |
|
|
2,040,000 |
|
|
|
1,931,003 |
|
| Bank of Nova Scotia/The, 8.625% to 10/27/27, due 10/27/82 (Canada)(f) |
|
|
3,000,000 |
|
|
|
3,126,415 |
|
| Barclays Bank PLC, 6.278% to 12/15/34, Series 1 (United Kingdom)(b)(e)(f) |
|
|
2,450,000 |
|
|
|
2,384,562 |
|
| Barclays PLC, 6.125% to 12/15/25 (United Kingdom)(b)(e)(f)(i) |
|
|
5,000,000 |
|
|
|
4,388,750 |
|
| Barclays PLC, 7.125% to 6/15/25 (United Kingdom)(e)(f)(i) |
|
|
1,100,000 |
|
|
|
1,270,501 |
|
| Barclays PLC, 8.00% to 6/15/24 (United Kingdom)(a)(b)(e)(f)(i) |
|
|
3,600,000 |
|
|
|
3,410,640 |
|
| Barclays PLC, 8.00% to 3/15/29 (United Kingdom)(e)(f)(i) |
|
|
7,800,000 |
|
|
|
6,988,020 |
|
| Barclays PLC, 8.875% to 9/15/27 (United Kingdom)(e)(f)(h)(i) |
|
|
3,500,000 |
|
|
|
4,102,644 |
|
| Barclays PLC, 9.25% to 9/15/28 (United Kingdom)(e)(f)(i) |
|
|
400,000 |
|
|
|
460,139 |
|
| BNP Paribas SA, 4.625% to 1/12/27 (France)(b)(e)(f)(i)(j) |
|
|
2,000,000 |
|
|
|
1,583,801 |
|
| BNP Paribas SA, 6.625% to 3/25/24 (France)(b)(e)(f)(i)(j) |
|
|
1,074,000 |
|
|
|
1,035,471 |
|
| BNP Paribas SA, 7.00% to 8/16/28 (France)(b)(e)(f)(i)(j) |
|
|
1,400,000 |
|
|
|
1,256,733 |
|
See accompanying notes to the consolidated financial statements.
14
COHEN
& STEERS REIT AND
PREFERRED AND INCOME FUND, INC.
CONSOLIDATED SCHEDULE OF INVESTMENTS—(Continued)
June 30, 2023 (Unaudited)
|
|
|
|
|
|
|
|
|
|
|
| |
|
|
|
Principal
Amount |
|
|
Value |
|
| BNP Paribas SA, 7.375% to 8/19/25 (France)(b)(e)(f)(i)(j) |
|
$
|
1,700,000 |
|
|
$
|
1,652,524 |
|
| BNP Paribas SA, 7.375% to 6/11/30 (France)(e)(f)(h)(i) |
|
|
600,000 |
|
|
|
636,329 |
|
| BNP Paribas SA, 7.75% to 8/16/29 (France)(b)(e)(f)(i)(j) |
|
|
7,800,000 |
|
|
|
7,569,120 |
|
| BNP Paribas SA, 9.25% to 11/17/27 (France)(e)(f)(i)(j) |
|
|
4,400,000 |
|
|
|
4,545,696 |
|
| CaixaBank SA, 5.875% to 10/9/27 (Spain)(e)(f)(h)(i) |
|
|
600,000 |
|
|
|
587,429 |
|
| CaixaBank SA, 8.25% to 3/13/29 (Spain)(e)(f)(h)(i) |
|
|
2,600,000 |
|
|
|
2,743,141 |
|
| CaixaBank SA, 6.75% to 6/13/24 (Spain)(e)(f)(h)(i) |
|
|
600,000 |
|
|
|
635,531 |
|
| Charles Schwab Corp./The, 4.00% to 12/1/30, Series H(b)(e)(f) |
|
|
6,571,000 |
|
|
|
4,803,401 |
|
| Charles Schwab Corp./The, 4.00% to 6/1/26, Series I(a)(b)(e)(f) |
|
|
14,512,000 |
|
|
|
11,812,768 |
|
| Charles Schwab Corp./The, 5.375% to 6/1/25, Series G(b)(e)(f) |
|
|
5,483,000 |
|
|
|
5,267,628 |
|
| Citigroup Capital III, 7.625%, due 12/1/36 (TruPS)(b) |
|
|
4,700,000 |
|
|
|
4,885,499 |
|
| Citigroup, Inc., 3.875% to 2/18/26, Series X(a)(b)(e)(f) |
|
|
7,820,000 |
|
|
|
6,568,800 |
|
| Citigroup, Inc., 4.00% to 12/10/25, Series W(b)(e)(f) |
|
|
1,720,000 |
|
|
|
1,472,750 |
|
| Citigroup, Inc., 4.15% to 11/15/26, Series Y(b)(e)(f) |
|
|
1,256,000 |
|
|
|
1,013,592 |
|
| Citigroup, Inc., 5.00% to 9/12/24, Series U(b)(e)(f) |
|
|
3,324,000 |
|
|
|
3,111,065 |
|
| Citigroup, Inc., 5.95% to 5/15/25, Series P(a)(b)(e)(f) |
|
|
7,100,000 |
|
|
|
6,817,974 |
|
| Citigroup, Inc., 6.25% to 8/15/26, Series T(b)(e)(f) |
|
|
4,935,000 |
|
|
|
4,868,526 |
|
| Citigroup, Inc., 7.375% to 5/15/28, Series Z(e)(f) |
|
|
3,417,000 |
|
|
|
3,400,446 |
|
| Citizens Financial Group, Inc., 5.65% to 10/6/25, Series F(b)(e)(f) |
|
|
3,750,000 |
|
|
|
3,299,282 |
|
| CoBank ACB, 6.25% to 10/1/26, Series I(e)(f) |
|
|
4,334,000 |
|
|
|
4,072,270 |
|
| CoBank ACB, 6.45% to 10/1/27, Series K(e)(f) |
|
|
2,740,000 |
|
|
|
2,541,350 |
|
| Commerzbank AG, 7.00% to 4/9/25 (Germany)(e)(f)(h)(i) |
|
|
2,000,000 |
|
|
|
1,829,254 |
|
| Credit Agricole SA, 4.75% to 3/23/29 (France)(b)(e)(f)(i)(j) |
|
|
2,600,000 |
|
|
|
2,073,500 |
|
| Credit Agricole SA, 6.875% to 9/23/24 (France)(b)(e)(f)(i)(j) |
|
|
3,000,000 |
|
|
|
2,898,480 |
|
| Credit Agricole SA, 7.25% to 9/23/28, Series EMTN (France)(e)(f)(h)(i) |
|
|
1,300,000 |
|
|
|
1,413,638 |
|
| Credit Agricole SA, 8.125% to 12/23/25 (France)(b)(e)(f)(i)(j) |
|
|
2,500,000 |
|
|
|
2,514,062 |
|
| Credit Suisse Group AG, 5.25% to 2/11/27, Claim (Switzerland)(e)(f)(i)(j)(k)(l) |
|
|
1,200,000 |
|
|
|
50,796 |
|
| Credit Suisse Group AG, 6.375% to 8/21/26, Claim (Switzerland)(e)(f)(i)(j)(k)(l) |
|
|
1,200,000 |
|
|
|
50,796 |
|
| Credit Suisse Group AG, 7.25% to 9/12/25, Claim (Switzerland)(e)(f)(i)(j)(k)(l) |
|
|
1,600,000 |
|
|
|
67,728 |
|
See accompanying notes to the consolidated financial statements.
15
COHEN
& STEERS REIT AND
PREFERRED AND INCOME FUND, INC.
CONSOLIDATED SCHEDULE OF INVESTMENTS—(Continued)
June 30, 2023 (Unaudited)
|
|
|
|
|
|
|
|
|
|
|
| |
|
|
|
Principal
Amount |
|
|
Value |
|
| Credit Suisse Group AG, 7.50% to 7/17/23, Claim (Switzerland)(e)(f)(i)(j)(k)(l) |
|
$
|
3,000,000 |
|
|
$
|
126,989 |
|
| Danske Bank A/S, 7.00% to 6/26/25 (Denmark)(e)(f)(h)(i) |
|
|
1,600,000 |
|
|
|
1,510,472 |
|
| Deutsche Bank AG/New York, 6.00% to 10/30/25, Series 2020 (Germany)(e)(f)(i) |
|
|
3,800,000 |
|
|
|
3,051,020 |
|
| Deutsche Bank AG/New York, 7.079% to 11/10/32, due 2/10/34 (Germany)(f) |
|
|
800,000 |
|
|
|
740,365 |
|
| Deutsche Bank AG/New York, 7.50% to 4/30/25 (Germany)(e)(f)(i) |
|
|
3,400,000 |
|
|
|
3,017,160 |
|
| Deutsche Bank AG/New York, 10.00% to 12/1/27 (Germany)(e)(f)(h)(i) |
|
|
2,800,000 |
|
|
|
3,036,283 |
|
| Discover Financial Services, 6.125% to 6/23/25, Series D(e)(f) |
|
|
790,000 |
|
|
|
754,795 |
|
| Dresdner Funding Trust I, 8.151%, due 6/30/31 (TruPS)(b)(j) |
|
|
1,235,906 |
|
|
|
1,321,956 |
|
| Farm Credit Bank of Texas, 5.70% to 9/15/25, Series 4(e)(f)(j) |
|
|
2,875,000 |
|
|
|
2,688,125 |
|
| Farm Credit Bank of Texas, 6.75% to 9/15/23(b)(e)(f)(j) |
|
|
18,000 |
† |
|
|
1,788,750 |
|
| First Horizon Bank, 6.061% (3 Month US LIBOR + 0.85%, Floor 3.75%)(b)(e)(g)(j) |
|
|
2,800 |
† |
|
|
1,791,104 |
|
| Goldman Sachs Group, Inc./The, 3.65% to 8/10/26, Series U(e)(f) |
|
|
3,544,000 |
|
|
|
2,748,372 |
|
| HSBC Capital Funding Dollar 1 LP, 10.176% to 6/30/30, Series 2 (United
Kingdom)(e)(f)(j) |
|
|
3,432,000 |
|
|
|
4,252,711 |
|
| HSBC Holdings PLC, 4.60% to 12/17/30 (United Kingdom)(e)(f)(i) |
|
|
600,000 |
|
|
|
458,250 |
|
| HSBC Holdings PLC, 6.375% to 3/30/25 (United Kingdom)(e)(f)(i) |
|
|
800,000 |
|
|
|
767,220 |
|
| HSBC Holdings PLC, 6.50% to 3/23/28 (United Kingdom)(a)(b)(e)(f)(i) |
|
|
1,700,000 |
|
|
|
1,535,503 |
|
| HSBC Holdings PLC, 8.00% to 3/7/28 (United Kingdom)(e)(f)(i) |
|
|
3,600,000 |
|
|
|
3,582,918 |
|
| HSBC Holdings PLC, 6.547% to 6/20/33, due 6/20/34 (United Kingdom)(f) |
|
|
1,400,000 |
|
|
|
1,395,423 |
|
| Huntington Bancshares, Inc./OH., 4.45% to 10/15/27, Series G(e)(f) |
|
|
3,543,000 |
|
|
|
2,886,287 |
|
| Huntington Bancshares, Inc./OH., 5.625% to 7/15/30, Series F(e)(f) |
|
|
4,061,000 |
|
|
|
3,649,263 |
|
See accompanying notes to the consolidated financial statements.
16
COHEN
& STEERS REIT AND
PREFERRED AND INCOME FUND, INC.
CONSOLIDATED SCHEDULE OF INVESTMENTS—(Continued)
June 30, 2023 (Unaudited)
|
|
|
|
|
|
|
|
|
|
|
| |
|
|
|
Principal
Amount |
|
|
Value |
|
| ING Groep N.V., 4.25% to 5/16/31, Series NC10 (Netherlands)(b)(e)(f)(i) |
|
$
|
2,000,000 |
|
|
$
|
1,335,604 |
|
| ING Groep N.V., 4.875% to 5/16/29 (Netherlands)(e)(f)(h)(i) |
|
|
2,230,000 |
|
|
|
1,733,138 |
|
| ING Groep N.V., 5.75% to 11/16/26 (Netherlands)(b)(e)(f)(i) |
|
|
5,800,000 |
|
|
|
5,127,087 |
|
| ING Groep N.V., 6.50% to 4/16/25 (Netherlands)(b)(e)(f)(i) |
|
|
2,400,000 |
|
|
|
2,241,840 |
|
| ING Groep N.V., 7.50% to 5/16/28 (Netherlands)(e)(f)(h)(i) |
|
|
3,000,000 |
|
|
|
2,761,725 |
|
| Intesa Sanpaolo SpA, 5.875% to 9/1/31, Series EMTN (Italy)(e)(f)(h)(i) |
|
|
750,000 |
|
|
|
653,223 |
|
| Intesa Sanpaolo SpA, 7.70% to 9/17/25 (Italy)(b)(e)(f)(i)(j) |
|
|
4,400,000 |
|
|
|
4,141,500 |
|
| JPMorgan Chase & Co., 3.65% to 6/1/26, Series KK(e)(f) |
|
|
2,330,000 |
|
|
|
2,056,575 |
|
| JPMorgan Chase & Co., 4.60% to 2/1/25, Series HH(e)(f) |
|
|
377,000 |
|
|
|
352,495 |
|
| JPMorgan Chase & Co., 5.00% to 8/1/24, Series FF(b)(e)(f) |
|
|
1,204,000 |
|
|
|
1,176,910 |
|
| JPMorgan Chase & Co., 6.10% to 10/1/24, Series X(e)(f) |
|
|
5,330,000 |
|
|
|
5,321,072 |
|
| JPMorgan Chase & Co., 6.125% to 4/30/24, Series U(b)(e)(f) |
|
|
1,059,000 |
|
|
|
1,056,886 |
|
| JPMorgan Chase & Co., 6.75% to 2/1/24, Series S(a)(b)(e)(f) |
|
|
6,572,000 |
|
|
|
6,593,195 |
|
| Julius Baer Group Ltd., 6.875% to 6/9/27 (Switzerland)(e)(f)(h)(i) |
|
|
2,000,000 |
|
|
|
1,760,676 |
|
| Lloyds Banking Group PLC, 6.75% to 6/27/26 (United Kingdom)(b)(e)(f)(i) |
|
|
600,000 |
|
|
|
549,628 |
|
| Lloyds Banking Group PLC, 7.50% to 6/27/24 (United Kingdom)(a)(b)(e)(f)(i) |
|
|
3,666,000 |
|
|
|
3,505,246 |
|
| Lloyds Banking Group PLC, 7.50% to 9/27/25 (United Kingdom)(e)(f)(i) |
|
|
3,600,000 |
|
|
|
3,375,540 |
|
| Lloyds Banking Group PLC, 8.00% to 9/27/29 (United Kingdom)(e)(f)(i) |
|
|
4,500,000 |
|
|
|
4,122,675 |
|
| M&T Bank Corp., 5.125% to 11/1/26, Series F(b)(e)(f) |
|
|
1,682,000 |
|
|
|
1,334,006 |
|
| Nationwide Building Society, 5.75% to 6/20/27 (United Kingdom)(e)(f)(h)(i) |
|
|
1,000,000 |
|
|
|
1,090,612 |
|
| Natwest Group PLC, 4.60% to 6/28/31 (United Kingdom)(b)(e)(f)(i) |
|
|
1,000,000 |
|
|
|
695,000 |
|
| Natwest Group PLC, 6.00% to 12/29/25 (United Kingdom)(b)(e)(f)(i) |
|
|
5,800,000 |
|
|
|
5,379,500 |
|
| Natwest Group PLC, 8.00% to 8/10/25 (United Kingdom)(b)(e)(f)(i) |
|
|
4,700,000 |
|
|
|
4,579,351 |
|
| Nordea Bank Abp, 6.625% to 3/26/26 (Finland)(b)(e)(f)(i)(j) |
|
|
2,070,000 |
|
|
|
1,961,925 |
|
See accompanying notes to the consolidated financial statements.
17
COHEN
& STEERS REIT AND
PREFERRED AND INCOME FUND, INC.
CONSOLIDATED SCHEDULE OF INVESTMENTS—(Continued)
June 30, 2023 (Unaudited)
|
|
|
|
|
|
|
|
|
|
|
| |
|
|
|
Principal
Amount |
|
|
Value |
|
| PNC Financial Services Group, Inc./The, 3.40% to 9/15/26, Series T(e)(f) |
|
$
|
742,000 |
|
|
$
|
549,080 |
|
| PNC Financial Services Group, Inc./The, 6.00% to 5/15/27, Series U(b)(e)(f) |
|
|
4,401,000 |
|
|
|
3,971,902 |
|
| PNC Financial Services Group, Inc./The, 6.20% to 9/15/27, Series V(b)(e)(f) |
|
|
3,973,000 |
|
|
|
3,713,364 |
|
| PNC Financial Services Group, Inc./The, 6.25% to 3/15/30, Series W(e)(f) |
|
|
3,840,000 |
|
|
|
3,456,960 |
|
| PNC Financial Services Group, Inc./The, 8.977% (3 Month US LIBOR + 3.678%)(b)(e)(g) |
|
|
1,973,000 |
|
|
|
1,977,386 |
|
| Regions Financial Corp., 5.75% to 6/15/25, Series D(e)(f) |
|
|
1,472,000 |
|
|
|
1,397,000 |
|
| Skandinaviska Enskilda Banken AB, 6.875% to 6/30/27 (Sweden)(e)(f)(h)(i) |
|
|
1,400,000 |
|
|
|
1,321,250 |
|
| Societe Generale SA, 5.375% to 11/18/30 (France)(b)(e)(f)(i)(j) |
|
|
3,400,000 |
|
|
|
2,531,229 |
|
| Societe Generale SA, 6.75% to 4/6/28 (France)(e)(f)(i)(j) |
|
|
3,600,000 |
|
|
|
2,926,281 |
|
| Societe Generale SA, 7.875% to 1/18/29, Series EMTN (France)(e)(f)(h)(i) |
|
|
1,300,000 |
|
|
|
1,360,577 |
|
| Societe Generale SA, 8.00% to 9/29/25 (France)(b)(e)(f)(i)(j) |
|
|
2,600,000 |
|
|
|
2,442,335 |
|
| Societe Generale SA, 9.375% to 11/22/27 (France)(e)(f)(i)(j) |
|
|
5,200,000 |
|
|
|
5,096,000 |
|
| Standard Chartered PLC, 7.75% to 8/15/27 (United Kingdom)(e)(f)(i)(j) |
|
|
1,000,000 |
|
|
|
992,760 |
|
| Toronto-Dominion Bank/The, 8.125% to 10/31/27, due 10/31/82 (Canada)(f) |
|
|
4,600,000 |
|
|
|
4,684,548 |
|
| Truist Financial Corp., 4.95% to 9/1/25, Series P(b)(e)(f) |
|
|
1,898,000 |
|
|
|
1,760,395 |
|
| Truist Financial Corp., 5.10% to 3/1/30, Series Q(b)(e)(f) |
|
|
3,030,000 |
|
|
|
2,636,100 |
|
| Truist Financial Corp., 5.125% to 12/15/27, Series M(a)(b)(e)(f) |
|
|
2,460,000 |
|
|
|
1,888,665 |
|
| UBS Group AG, 5.125% to 7/29/26 (Switzerland)(e)(f)(h)(i) |
|
|
1,800,000 |
|
|
|
1,572,280 |
|
| UBS Group AG, 6.875% to 8/7/25 (Switzerland)(e)(f)(h)(i) |
|
|
3,800,000 |
|
|
|
3,488,518 |
|
| UBS Group AG, 7.00% to 2/19/25 (Switzerland)(e)(f)(h)(i) |
|
|
1,000,000 |
|
|
|
954,153 |
|
| UBS Group AG, 4.375% to 2/10/31 (Switzerland)(e)(f)(i)(j) |
|
|
1,600,000 |
|
|
|
1,131,104 |
|
| UniCredit SpA, 8.00% to 6/3/24 (Italy)(e)(f)(h)(i) |
|
|
2,600,000 |
|
|
|
2,550,314 |
|
| US Bancorp, 3.70% to 1/15/27, Series N(b)(e)(f) |
|
|
2,305,000 |
|
|
|
1,715,842 |
|
| US Bancorp, 5.30% to 4/15/27, Series J(b)(e)(f) |
|
|
1,535,000 |
|
|
|
1,251,025 |
|
| Virgin Money UK PLC, 8.25% to 6/17/27 (United Kingdom)(e)(f)(h)(i) |
|
|
600,000 |
|
|
|
643,784 |
|
See accompanying notes to the consolidated financial statements.
18
COHEN
& STEERS REIT AND
PREFERRED AND INCOME FUND, INC.
CONSOLIDATED SCHEDULE OF INVESTMENTS—(Continued)
June 30, 2023 (Unaudited)
|
|
|
|
|
|
|
|
|
|
|
|
|
| |
|
|
|
|
Principal
Amount |
|
|
Value |
|
| Wells Fargo & Co., 3.90% to 3/15/26, Series BB(b)(e)(f) |
|
|
$
|
13,740,000 |
|
|
$
|
12,105,283 |
|
| Wells Fargo & Co., 5.875% to 6/15/25, Series U(b)(e)(g) |
|
|
|
4,026,000 |
|
|
|
3,955,135 |
|
| Wells Fargo & Co., 5.95%, due 12/15/36(a)(b) |
|
|
|
3,700,000 |
|
|
|
3,660,490 |
|
|
|
|
|
|
|
|
|
|
|
|
|
|
|
|
|
|
|
|
|
|
|
|
|
350,152,460 |
|
|
|
|
|
|
|
|
|
|
|
|
|
|
| BROKERAGE |
|
|
0.5% |
|
|
|
|
|
|
|
|
|
| Goldman Sachs Capital I, 6.345%, due 2/15/34 (TruPS) |
|
|
|
3,042,000 |
|
|
|
3,050,837 |
|
| Goldman Sachs Group, Inc./The, 5.50% to 8/10/24, Series Q(b)(e)(f) |
|
|
|
2,184,000 |
|
|
|
2,134,707 |
|
|
|
|
|
|
|
|
|
|
|
|
|
|
|
|
|
|
|
|
|
|
|
|
|
5,185,544 |
|
|
|
|
|
|
|
|
|
|
|
|
|
|
| CONSUMER STAPLE PRODUCTS |
|
|
1.0% |
|
|
|
|
|
|
|
|
|
| Dairy Farmers of America, Inc., 7.875%(b)(e)(j) |
|
|
|
82,000 |
† |
|
|
7,585,000 |
|
| Land O’ Lakes, Inc., 7.00%(b)(e)(j) |
|
|
|
1,650,000 |
|
|
|
1,356,745 |
|
| Land O’ Lakes, Inc., 7.25%(b)(e)(j) |
|
|
|
945,000 |
|
|
|
765,450 |
|
|
|
|
|
|
|
|
|
|
|
|
|
|
|
|
|
|
|
|
|
|
|
|
|
9,707,195 |
|
|
|
|
|
|
|
|
|
|
|
|
|
|
| ENERGY |
|
|
1.2% |
|
|
|
|
|
|
|
|
|
| BP Capital Markets PLC, 4.375% to 6/22/25 (United Kingdom)(b)(e)(f) |
|
|
|
2,000,000 |
|
|
|
1,923,500 |
|
| BP Capital Markets PLC, 4.875% to 3/22/30 (United Kingdom)(b)(e)(f) |
|
|
|
9,950,000 |
|
|
|
9,075,644 |
|
|
|
|
|
|
|
|
|
|
|
|
|
|
|
|
|
|
|
|
|
|
|
|
|
10,999,144 |
|
|
|
|
|
|
|
|
|
|
|
|
|
|
| FINANCE |
|
|
0.5% |
|
|
|
|
|
|
|
|
|
| American Express Co., 3.55% to 9/15/26(b)(e)(f) |
|
|
|
1,895,000 |
|
|
|
1,577,588 |
|
| Apollo Management Holdings LP, 4.95% to 12/17/24, due 1/14/50(a)(b)(f)(j) |
|
|
|
1,424,000 |
|
|
|
1,193,217 |
|
| Ares Finance Co. III LLC, 4.125% to 6/30/26, due 6/30/51(b)(f)(j) |
|
|
|
2,365,000 |
|
|
|
1,729,524 |
|
|
|
|
|
|
|
|
|
|
|
|
|
|
|
|
|
|
|
|
|
|
|
|
|
4,500,329 |
|
|
|
|
|
|
|
|
|
|
|
|
|
|
| INSURANCE |
|
|
8.0% |
|
|
|
|
|
|
|
|
|
| Aegon NV, 5.50% to 4/11/28, due 4/11/48 (Netherlands)(b)(f) |
|
|
|
1,600,000 |
|
|
|
1,523,296 |
|
| Allianz SE, 3.50% to 11/17/25 (Germany)(b)(e)(f)(i)(j) |
|
|
|
1,400,000 |
|
|
|
1,159,165 |
|
| Allianz SE, 5.824%, due 7/25/53 (Germany)(f)(h) |
|
|
|
600,000 |
|
|
|
673,474 |
|
| Assurant, Inc., 7.00% to 3/27/28, due 3/27/48(b)(f) |
|
|
|
2,900,000 |
|
|
|
2,789,565 |
|
| Athora Netherlands NV, 7.00% to 6/19/25 (Netherlands)(e)(f)(h)(i) |
|
|
|
1,600,000 |
|
|
|
1,652,228 |
|
See accompanying notes to the consolidated financial statements.
19
COHEN
& STEERS REIT AND
PREFERRED AND INCOME FUND, INC.
CONSOLIDATED SCHEDULE OF INVESTMENTS—(Continued)
June 30, 2023 (Unaudited)
|
|
|
|
|
|
|
|
|
|
|
| |
|
|
|
Principal
Amount |
|
|
Value |
|
| AXIS Specialty Finance LLC, 4.90% to 1/15/30, due 1/15/40(b)(f) |
|
$
|
1,475,000 |
|
|
$
|
1,178,449 |
|
| CNP Assurances, 5.25% to 1/18/33, due 7/18/53, Series EMTN (France)(f)(h) |
|
|
1,500,000 |
|
|
|
1,570,865 |
|
| Corebridge Financial, Inc., 6.875% to 9/15/27, due 12/15/52(f) |
|
|
4,070,000 |
|
|
|
3,908,251 |
|
| Enstar Finance LLC, 5.50% to 1/15/27, due 1/15/42(b)(f) |
|
|
2,975,000 |
|
|
|
2,224,884 |
|
| Enstar Finance LLC, 5.75% to 9/1/25, due 9/1/40(a)(b)(f) |
|
|
2,484,000 |
|
|
|
2,147,231 |
|
| Equitable Holdings, Inc., 4.95% to 9/15/25, Series B(e)(f) |
|
|
2,965,000 |
|
|
|
2,761,011 |
|
| Global Atlantic Fin Co., 4.70% to 7/15/26, due 10/15/51(f)(j) |
|
|
3,582,000 |
|
|
|
2,546,161 |
|
| Hartford Financial Services Group, Inc./The, 7.446% (3 Month US LIBOR
+ 2.125%), due 2/12/47, Series ICON(b)(g)(j) |
|
|
2,200,000 |
|
|
|
1,831,621 |
|
| ILFC E-Capital Trust I, 7.064% (30 Year CMT + 1.55%), due
12/21/65
(TruPS)(b)(g)(j) |
|
|
3,009,000 |
|
|
|
2,029,857 |
|
| La Mondiale SAM, 5.875% to 1/26/27, due 1/26/47 (France)(f)(h) |
|
|
1,415,000 |
|
|
|
1,360,769 |
|
| Lancashire Holdings Ltd., 5.625% to 3/18/31, due 9/18/41 (United Kingdom)(f)(h) |
|
|
2,400,000 |
|
|
|
1,996,824 |
|
| Liberty Mutual Group, Inc., 4.125% to 9/15/26, due 12/15/51(b)(f)(j) |
|
|
2,346,000 |
|
|
|
1,848,050 |
|
| Lincoln National Corp., 9.25% to 12/1/27, Series C(b)(e)(f) |
|
|
1,095,000 |
|
|
|
1,152,538 |
|
| Markel Group, Inc., 6.00% to 6/1/25(b)(e)(f) |
|
|
1,195,000 |
|
|
|
1,154,638 |
|
| MetLife Capital Trust IV, 7.875%, due 12/15/37 (TruPS)(a)(b)(j) |
|
|
3,181,000 |
|
|
|
3,337,629 |
|
| MetLife, Inc., 9.25%, due 4/8/38(a)(b)(j) |
|
|
7,665,000 |
|
|
|
8,896,678 |
|
| MetLife, Inc., 10.75%, due 8/1/39(a)(b) |
|
|
3,592,000 |
|
|
|
4,645,406 |
|
| Phoenix Group Holdings PLC, 5.625% to 1/29/25 (United Kingdom)(e)(f)(h)(i) |
|
|
1,200,000 |
|
|
|
1,060,685 |
|
| Prudential Financial, Inc., 5.125% to 11/28/31, due 3/1/52(b)(f) |
|
|
2,536,000 |
|
|
|
2,296,500 |
|
| Prudential Financial, Inc., 5.20% to 3/15/24, due 3/15/44(a)(b)(f) |
|
|
1,200,000 |
|
|
|
1,188,096 |
|
| Prudential Financial, Inc., 6.00% to 6/1/32, due 9/1/52(b)(f) |
|
|
3,790,000 |
|
|
|
3,610,500 |
|
| Prudential Financial, Inc., 6.75% to 12/1/32, due 3/1/53(b)(f) |
|
|
1,520,000 |
|
|
|
1,533,178 |
|
See accompanying notes to the consolidated financial statements.
20
COHEN
& STEERS REIT AND
PREFERRED AND INCOME FUND, INC.
CONSOLIDATED SCHEDULE OF INVESTMENTS—(Continued)
June 30, 2023 (Unaudited)
|
|
|
|
|
|
|
|
|
|
|
|
|
| |
|
|
|
|
Principal
Amount |
|
|
Value |
|
| QBE Insurance Group Ltd., 5.875% to 6/17/26, due 6/17/46, Series EMTN
(Australia)(f)(h) |
|
|
$
|
3,000,000 |
|
|
$
|
2,862,926 |
|
| QBE Insurance Group Ltd., 5.875% to 5/12/25 (Australia)(b)(e)(f)(j) |
|
|
|
4,200,000 |
|
|
|
4,007,670 |
|
| Rothesay Life PLC, 4.875% to 4/13/27, Series NC6 (United Kingdom)(e)(f)(h)(i) |
|
|
|
2,300,000 |
|
|
|
1,717,215 |
|
| SBL Holdings, Inc., 6.50% to 11/13/26(b)(e)(f)(j) |
|
|
|
3,120,000 |
|
|
|
1,701,495 |
|
| SBL Holdings, Inc., 7.00% to 5/13/25(b)(e)(f)(j) |
|
|
|
2,100,000 |
|
|
|
1,271,626 |
|
| Zurich Finance Ireland Designated Activity Co., 3.00% to 1/19/31, due
4/19/51, Series EMTN (Switzerland)(f)(h) |
|
|
|
3,500,000 |
|
|
|
2,743,545 |
|
|
|
|
|
|
|
|
|
|
|
|
|
|
|
|
|
|
|
|
|
|
|
|
|
76,382,026 |
|
|
|
|
|
|
|
|
|
|
|
|
|
|
| PIPELINES |
|
|
4.4% |
|
|
|
|
|
|
|
|
|
| Enbridge, Inc., 5.50% to 7/15/27, due 7/15/77, Series 2017-A (Canada)(f) |
|
|
|
780,000 |
|
|
|
695,640 |
|
| Enbridge, Inc., 5.75% to 4/15/30, due 7/15/80, Series 20-A (Canada)(b)(f) |
|
|
|
4,620,000 |
|
|
|
4,177,839 |
|
| Enbridge, Inc., 6.00% to 1/15/27, due 1/15/77, Series 16-A (Canada)(b)(f) |
|
|
|
4,012,000 |
|
|
|
3,728,487 |
|
| Enbridge, Inc., 6.25% to 3/1/28, due 3/1/78 (Canada)(b)(f) |
|
|
|
5,330,000 |
|
|
|
4,913,616 |
|
| Enbridge, Inc., 7.375% to 10/15/27, due 1/15/83 (Canada)(b)(f) |
|
|
|
1,914,000 |
|
|
|
1,881,669 |
|
| Enbridge, Inc., 7.625% to 10/15/32, due 1/15/83 (Canada)(f) |
|
|
|
4,056,000 |
|
|
|
4,085,897 |
|
| Energy Transfer LP, 6.50% to 11/15/26, Series H(b)(e)(f) |
|
|
|
2,520,000 |
|
|
|
2,295,266 |
|
| Energy Transfer LP, 7.125% to 5/15/30, Series G(e)(f) |
|
|
|
4,800,000 |
|
|
|
4,082,024 |
|
| Transcanada Trust, 5.50% to 9/15/29, due 9/15/79 (Canada)(a)(b)(f) |
|
|
|
9,014,000 |
|
|
|
7,765,561 |
|
| Transcanada Trust, 5.60% to 12/7/31, due 3/7/82 (Canada)(b)(f) |
|
|
|
2,592,000 |
|
|
|
2,187,492 |
|
| Transcanada Trust, 5.875% to 8/15/26, due 8/15/76,
Series 16-A
(Canada)(a)(b)(f) |
|
|
|
6,302,000 |
|
|
|
5,960,117 |
|
|
|
|
|
|
|
|
|
|
|
|
|
|
|
|
|
|
|
|
|
|
|
|
|
41,773,608 |
|
|
|
|
|
|
|
|
|
|
|
|
|
|
| SHOPPING CENTER |
|
|
1.0% |
|
|
|
|
|
|
|
|
|
| Scentre Group Trust 2, 4.75% to 6/24/26, due 9/24/80 (Australia)(b)(f)(j) |
|
|
|
6,500,000 |
|
|
|
5,827,250 |
|
| Scentre Group Trust 2, 5.125% to 6/24/30, due 9/24/80 (Australia)(b)(f)(j) |
|
|
|
4,000,000 |
|
|
|
3,380,889 |
|
|
|
|
|
|
|
|
|
|
|
|
|
|
|
|
|
|
|
|
|
|
|
|
|
9,208,139 |
|
|
|
|
|
|
|
|
|
|
|
|
|
|
See accompanying notes to the consolidated financial statements.
21
COHEN
& STEERS REIT AND
PREFERRED AND INCOME FUND, INC.
CONSOLIDATED SCHEDULE OF INVESTMENTS—(Continued)
June 30, 2023 (Unaudited)
|
|
|
|
|
|
|
|
|
|
|
|
|
| |
|
|
|
|
Principal
Amount |
|
|
Value |
|
| TELECOMMUNICATION SERVICES |
|
|
0.7% |
|
|
|
|
|
|
|
|
|
| Telefonica Europe BV, 6.135% to 2/3/30 (Spain)(e)(f)(h) |
|
|
$
|
1,200,000 |
|
|
$
|
1,266,467 |
|
| Vodafone Group PLC, 4.125% to 3/4/31, due 6/4/81 (United Kingdom)(f) |
|
|
|
4,290,000 |
|
|
|
3,408,191 |
|
| Vodafone Group PLC, 6.25% to 7/3/24, due 10/3/78 (United Kingdom)(f)(h) |
|
|
|
1,109,000 |
|
|
|
1,098,886 |
|
| Vodafone Group PLC, 7.00% to 1/4/29, due 4/4/79 (United Kingdom)(b)(f) |
|
|
|
1,030,000 |
|
|
|
1,057,995 |
|
|
|
|
|
|
|
|
|
|
|
|
|
|
|
|
|
|
|
|
|
|
|
|
|
6,831,539 |
|
|
|
|
|
|
|
|
|
|
|
|
|
|
| UTILITIES |
|
|
5.4% |
|
|
|
|
|
|
|
|
|
| Algonquin Power & Utilities Corp., 4.75% to 1/18/27, due
1/18/82
(Canada)(b)(f) |
|
|
|
4,368,000 |
|
|
|
3,478,501 |
|
| American Electric Power Co., Inc., 3.875% to 11/15/26, due 2/15/62(b)(f) |
|
|
|
2,670,000 |
|
|
|
2,133,944 |
|
| CMS Energy Corp., 4.75% to 3/1/30, due 6/1/50(b)(f) |
|
|
|
1,600,000 |
|
|
|
1,379,568 |
|
| Dominion Energy, Inc., 4.35% to 1/15/27, Series C(e)(f) |
|
|
|
4,987,000 |
|
|
|
4,214,621 |
|
| Edison International, 5.00% to 12/15/26, Series B(b)(e)(f) |
|
|
|
4,497,000 |
|
|
|
3,896,201 |
|
| Edison International, 5.375% to 3/15/26, Series A(b)(e)(f) |
|
|
|
3,860,000 |
|
|
|
3,382,904 |
|
| Electricite de France SA, 7.50% to 9/6/28, Series EMTN (France)(e)(f)(h) |
|
|
|
1,800,000 |
|
|
|
1,999,657 |
|
| Electricite de France SA, 9.125% to 3/15/33 (France)(e)(f)(j) |
|
|
|
1,800,000 |
|
|
|
1,850,364 |
|
| Emera, Inc., 6.75% to 6/15/26, due 6/15/76, Series 16-A (Canada)(a)(b)(f) |
|
|
|
11,667,000 |
|
|
|
11,325,507 |
|
| Enel SpA, 6.375% to 4/16/28, Series EMTN (Italy)(e)(f)(h) |
|
|
|
700,000 |
|
|
|
770,791 |
|
| Enel SpA, 6.625% to 4/16/31, Series EMTN (Italy)(e)(f)(h) |
|
|
|
1,000,000 |
|
|
|
1,100,154 |
|
| NextEra Energy Capital Holdings, Inc., 3.80% to 3/15/27, due 3/15/82(b)(f) |
|
|
|
1,382,000 |
|
|
|
1,167,139 |
|
| NextEra Energy Capital Holdings, Inc., 5.65% to 5/1/29, due 5/1/79(a)(b)(f) |
|
|
|
2,407,000 |
|
|
|
2,238,444 |
|
| Sempra, 4.125% to 1/1/27, due 4/1/52(b)(f) |
|
|
|
3,360,000 |
|
|
|
2,722,595 |
|
| Sempra, 4.875% to
10/15/25(a)(b)(e)(f) |
|
|
|
6,430,000 |
|
|
|
5,996,414 |
|
| Southern California Edison Co., 9.498% (3 Month US LIBOR + 4.199%), Series
E(b)(e)(g) |
|
|
|
1,400,000 |
|
|
|
1,399,090 |
|
| Southern Co./The, 3.75% to 6/15/26, due 9/15/51, Series 21-A(f) |
|
|
|
3,236,000 |
|
|
|
2,761,926 |
|
|
|
|
|
|
|
|
|
|
|
|
|
|
|
|
|
|
|
|
|
|
51,817,820 |
|
|
|
|
|
|
|
|
|
|
|
|
|
|
| TOTAL PREFERRED
SECURITIES—OVER-THE-COUNTER (Identified cost—$618,224,466) |
|
|
|
|
|
|
|
566,557,804 |
|
|
|
|
|
|
|
|
|
|
|
|
|
|
See accompanying notes to the consolidated financial statements.
22
COHEN
& STEERS REIT AND
PREFERRED AND INCOME FUND, INC.
CONSOLIDATED SCHEDULE OF INVESTMENTS—(Continued)
June 30, 2023 (Unaudited)
|
|
|
|
|
|
|
|
|
|
|
|
|
| |
|
|
|
|
Ownership %* |
|
|
Value |
|
| PRIVATE REAL
ESTATE—OFFICE |
|
|
1.6% |
|
|
|
|
|
|
|
|
|
| Legacy Gateway JV LLC, Plano, TX(m) |
|
|
|
33.6% |
|
|
$
|
14,951,266 |
|
|
|
|
|
|
|
|
|
|
|
|
|
|
| TOTAL PRIVATE REAL
ESTATE
(Identified cost—$14,071,976) |
|
|
|
|
|
|
|
14,951,266 |
|
|
|
|
|
|
|
|
|
|
|
|
|
|
|
|
|
|
| |
|
|
|
|
Shares |
|
|
|
|
| SHORT-TERM INVESTMENTS |
|
|
2.0% |
|
|
|
|
|
|
|
|
|
| MONEY MARKET FUNDS |
|
|
|
|
|
|
|
|
|
|
|
|
| State Street Institutional Treasury Plus Money Market Fund, Premier Class,
5.02%(n) |
|
|
|
8,834,694 |
|
|
|
8,834,694 |
|
| State Street Institutional U.S. Government Money Market Fund, Premier
Class, 5.03%(n) |
|
|
|
10,521,000 |
|
|
|
10,521,000 |
|
|
|
|
|
|
|
|
|
|
|
|
|
|
| TOTAL SHORT-TERM
INVESTMENTS
(Identified cost—$19,355,694) |
|
|
|
|
|
|
|
19,355,694 |
|
|
|
|
|
|
|
|
|
|
|
|
|
|
| PURCHASED OPTION CONTRACTS
(Premiums
paid—$74,274) |
|
|
0.0% |
|
|
|
|
|
|
|
301,350 |
|
|
|
|
|
|
|
|
|
|
|
|
|
|
| TOTAL INVESTMENTS IN
SECURITIES
(Identified cost—$1,312,570,738) |
|
|
145.6% |
|
|
|
|
|
|
|
1,388,888,208 |
|
| WRITTEN OPTION CONTRACTS
(Premiums
received—$265,236) |
|
|
(0.1) |
|
|
|
|
|
|
|
(525,019 |
) |
| LIABILITIES IN EXCESS OF
OTHER ASSETS |
|
|
(45.5) |
|
|
|
|
|
|
|
(434,178,264 |
) |
| SERIES A CUMULATIVE PREFERRED
STOCK, AT LIQUIDATION VALUE |
|
|
(0.0) |
|
|
|
|
|
|
|
(125,000 |
) |
|
|
|
|
|
|
|
|
|
|
|
|
|
| NET ASSETS (Equivalent to $19.98 per share based
on
47,759,789 shares of common stock outstanding) |
|
|
100.0% |
|
|
|
|
|
|
$ |
954,059,925 |
|
|
|
|
|
|
|
|
|
|
|
|
|
|
Exchange-Traded Option Contracts
Purchased Options
|
|
|
|
|
|
|
|
|
|
|
|
|
|
|
|
|
|
|
|
|
|
|
|
|
| |
|
|
|
|
|
|
| Description |
|
Exercise
Price |
|
|
Expiration
Date |
|
|
Number of
Contracts |
|
|
Notional
Amount(o) |
|
|
Premiums
Paid |
|
|
Value |
|
| Call—Digital Realty Trust, Inc. |
|
$ |
100.00 |
|
|
|
7/21/23 |
|
|
|
191 |
|
|
$ |
2,174,917 |
|
|
$ |
46,113 |
|
|
$ |
255,940 |
|
| Call—American Tower Corp. |
|
|
200.00 |
|
|
|
8/18/23 |
|
|
|
95 |
|
|
|
1,842,430 |
|
|
|
28,161 |
|
|
|
45,410 |
|
| |
|
|
|
|
|
|
|
|
|
|
|
|
286 |
|
|
$ |
4,017,347 |
|
|
$ |
74,274 |
|
|
$ |
301,350 |
|
| |
|
See accompanying notes to the consolidated financial statements.
23
COHEN
& STEERS REIT AND
PREFERRED AND INCOME FUND, INC.
CONSOLIDATED SCHEDULE OF INVESTMENTS—(Continued)
June 30, 2023 (Unaudited)
Written Options
|
|
|
|
|
|
|
|
|
|
|
|
|
|
|
|
|
|
|
|
|
|
|
|
|
| |
|
|
|
|
|
|
| Description |
|
Exercise
Price |
|
|
Expiration
Date |
|
|
Number of
Contracts |
|
|
Notional
Amount(o) |
|
|
Premiums
Received |
|
|
Value |
|
| Call—Digital Realty Trust, Inc. |
|
$ |
105.00 |
|
|
|
7/21/23 |
|
|
|
(382 |
) |
|
$ |
(4,349,834 |
) |
|
$ |
(45,294 |
) |
|
$ |
(336,160 |
) |
| Call—Invitation Homes, Inc. |
|
|
37.50 |
|
|
|
7/21/23 |
|
|
|
(512 |
) |
|
|
(1,761,280 |
) |
|
|
(19,748 |
) |
|
|
(2,560 |
) |
| Call—Welltower, Inc. |
|
|
82.50 |
|
|
|
7/21/23 |
|
|
|
(215 |
) |
|
|
(1,739,135 |
) |
|
|
(19,670 |
) |
|
|
(10,750 |
) |
| Call—American Tower Corp. |
|
|
210.00 |
|
|
|
8/18/23 |
|
|
|
(190 |
) |
|
|
(3,684,860 |
) |
|
|
(19,203 |
) |
|
|
(35,150 |
) |
| Call—Digital Realty Trust, Inc. |
|
|
115.00 |
|
|
|
8/18/23 |
|
|
|
(211 |
) |
|
|
(2,402,657 |
) |
|
|
(42,774 |
) |
|
|
(90,308 |
) |
| Put—Crown Castle, Inc. |
|
|
100.00 |
|
|
|
7/21/23 |
|
|
|
(61 |
) |
|
|
(695,034 |
) |
|
|
(8,392 |
) |
|
|
(1,220 |
) |
| Put—Digital Realty Trust, Inc. |
|
|
70.00 |
|
|
|
7/21/23 |
|
|
|
(191 |
) |
|
|
(2,174,917 |
) |
|
|
(14,052 |
) |
|
|
(955 |
) |
| Put—Medical Properties Trust, Inc. |
|
|
8.00 |
|
|
|
7/21/23 |
|
|
|
(1,871 |
) |
|
|
(1,732,546 |
) |
|
|
(45,843 |
) |
|
|
(13,097 |
) |
| Put—WP Carey, Inc. |
|
|
65.00 |
|
|
|
7/21/23 |
|
|
|
(241 |
) |
|
|
(1,628,196 |
) |
|
|
(17,730 |
) |
|
|
(9,399 |
) |
| Put—American Tower Corp. |
|
|
165.00 |
|
|
|
8/18/23 |
|
|
|
(95 |
) |
|
|
(1,842,430 |
) |
|
|
(11,264 |
) |
|
|
(8,550 |
) |
| Put—Sun Communities, Inc. |
|
|
120.00 |
|
|
|
8/18/23 |
|
|
|
(144 |
) |
|
|
(1,878,624 |
) |
|
|
(21,266 |
) |
|
|
(16,870 |
) |
| |
|
|
|
|
|
|
|
|
|
|
|
|
(4,113 |
) |
|
$ |
(23,889,513 |
) |
|
$ |
(265,236 |
) |
|
$ |
(525,019 |
) |
| |
|
Centrally Cleared Interest Rate Swap Contracts
|
|
|
|
|
|
|
|
|
|
|
|
|
|
|
|
|
|
|
|
|
|
|
|
|
|
|
|
|
| |
|
|
|
|
|
|
|
|
Notional
Amount |
|
|
Fixed
Rate
Payable |
|
|
Fixed
Payment
Frequency |
|
Floating Rate
Receivable
(resets monthly) |
|
Floating
Payment
Frequency |
|
|
Maturity
Date |
|
Value |
|
|
Upfront
Receipts
(Payments) |
|
|
Unrealized
Appreciation
(Depreciation) |
|
| |
$105,000,000 |
|
|
|
1.237 |
% |
|
Monthly |
|
5.193%(p) |
|
|
Monthly |
|
|
7/15/23 |
|
$ |
368,372 |
|
|
$ |
— |
|
|
$ |
368,372 |
|
| |
105,000,000 |
|
|
|
0.670 |
% |
|
Monthly |
|
5.193%(p) |
|
|
Monthly |
|
|
7/15/23 |
|
|
421,213 |
|
|
|
— |
|
|
|
421,213 |
|
| |
65,000,000 |
|
|
|
0.762 |
% |
|
Monthly |
|
5.193%(p) |
|
|
Monthly |
|
|
7/15/23 |
|
|
255,447 |
|
|
|
— |
|
|
|
255,447 |
|
| |
87,500,000 |
|
|
|
1.240 |
% |
|
Monthly |
|
5.204%(p) |
|
|
Monthly |
|
|
8/3/23 |
|
|
469,457 |
|
|
|
— |
|
|
|
469,457 |
|
| |
105,000,000 |
|
|
|
0.670 |
% |
|
Monthly |
|
USD-SOFR-OIS(q) |
|
|
Monthly |
|
|
9/15/25 |
|
|
8,830,117 |
|
|
|
21,798 |
|
|
|
8,851,915 |
|
| |
87,500,000 |
|
|
|
1.240 |
% |
|
Monthly |
|
USD-SOFR-OIS(q) |
|
|
Monthly |
|
|
2/3/26 |
|
|
6,896,031 |
|
|
|
3,200 |
|
|
|
6,899,231 |
|
| |
65,000,000 |
|
|
|
0.762 |
% |
|
Monthly |
|
USD-SOFR-OIS(q) |
|
|
Monthly |
|
|
9/15/26 |
|
|
6,939,704 |
|
|
|
14,917 |
|
|
|
6,954,621 |
|
| |
105,000,000 |
|
|
|
1.237 |
% |
|
Monthly |
|
USD-SOFR-OIS(q) |
|
|
Monthly |
|
|
9/15/27 |
|
|
11,528,861 |
|
|
|
23,767 |
|
|
|
11,552,628 |
|
|
|
|
|
|
|
|
|
|
|
|
|
|
|
|
|
|
|
$ |
35,709,202 |
|
|
$ |
63,682 |
|
|
$ |
35,772,884 |
|
| |
|
|
See accompanying notes to the consolidated financial statements.
24
COHEN
& STEERS REIT AND
PREFERRED AND INCOME FUND, INC.
CONSOLIDATED SCHEDULE OF INVESTMENTS—(Continued)
June 30, 2023 (Unaudited)
Over-the-Counter Total Return Swap Contracts
|
|
|
|
|
|
|
|
|
|
|
|
|
|
|
|
|
|
|
|
|
|
|
|
|
|
|
|
|
|
|
|
|
|
|
| |
|
|
|
|
|
|
|
|
|
| Counterparty |
|
Notional
Amount |
|
|
Fixed
Payable
Rate |
|
Fixed
Payment
Frequency |
|
|
Underlying
Reference
Entity |
|
Position |
|
|
Maturity
Date |
|
|
Value |
|
|
Premiums
Paid |
|
|
Unrealized
Appreciation
(Depreciation) |
|
| BNP Paribas |
|
$ |
|
|
5,927,541 |
|
|
0.25% |
|
|
Monthly |
|
|
BNPXCHY5
Index(r) |
|
|
Short |
|
|
|
5/15/24 |
|
|
$ |
44,351 |
|
|
$ |
— |
|
|
$ |
44,351 |
|
| BNP Paribas |
|
EUR |
|
|
5,409,460 |
|
|
0.30% |
|
|
Monthly |
|
|
BNPXCEX5
Index(s) |
|
|
Short |
|
|
|
5/15/24 |
|
|
|
28,313 |
|
|
|
— |
|
|
|
28,313 |
|
|
|
|
$ |
72,664 |
|
|
$ |
— |
|
|
$ |
72,664 |
|
| |
|
Forward Foreign Currency Exchange Contracts
|
|
|
|
|
|
|
|
|
|
|
|
|
|
|
|
|
|
|
|
|
| |
|
|
|
|
| Counterparty |
|
Contracts to
Deliver |
|
|
In Exchange
For |
|
|
Settlement
Date |
|
|
Unrealized
Appreciation
(Depreciation) |
|
| Brown Brothers Harriman |
|
EUR |
|
|
30,990,971 |
|
|
USD |
|
|
33,098,357 |
|
|
|
7/5/23 |
|
|
$ |
(719,001 |
) |
| Brown Brothers Harriman |
|
GBP |
|
|
6,874,728 |
|
|
USD |
|
|
8,525,419 |
|
|
|
7/5/23 |
|
|
|
(205,481 |
) |
| Brown Brothers Harriman |
|
USD |
|
|
33,840,901 |
|
|
EUR |
|
|
30,990,971 |
|
|
|
7/5/23 |
|
|
|
(23,543 |
) |
| Brown Brothers Harriman |
|
USD |
|
|
770,183 |
|
|
GBP |
|
|
600,000 |
|
|
|
7/5/23 |
|
|
|
(8,183 |
) |
| Brown Brothers Harriman |
|
USD |
|
|
7,974,426 |
|
|
GBP |
|
|
6,274,728 |
|
|
|
7/5/23 |
|
|
|
(5,526 |
) |
| Brown Brothers Harriman |
|
EUR |
|
|
30,873,469 |
|
|
USD |
|
|
33,756,125 |
|
|
|
8/2/23 |
|
|
|
20,838 |
|
| Brown Brothers Harriman |
|
GBP |
|
|
5,957,808 |
|
|
USD |
|
|
7,572,553 |
|
|
|
8/2/23 |
|
|
|
4,624 |
|
|
|
|
|
|
|
|
|
|
|
|
|
|
|
|
|
|
|
$ |
(936,272 |
) |
| |
|
See accompanying notes to the consolidated financial statements.
25
COHEN
& STEERS REIT AND
PREFERRED AND INCOME FUND, INC.
CONSOLIDATED SCHEDULE OF INVESTMENTS—(Continued)
June 30, 2023 (Unaudited)
Glossary of Portfolio Abbreviations
|
|
|
| CMT |
|
Constant Maturity Treasury |
| EMTN |
|
Euro Medium Term Note |
| ETF |
|
Exchange-Traded Fund |
| EUR |
|
Euro Currency |
| FRN |
|
Floating Rate Note |
| GBP |
|
Great British Pound |
| LIBOR |
|
London Interbank Offered Rate |
| OIS |
|
Overnight Indexed Swap |
| REIT |
|
Real Estate Investment Trust |
| SOFR |
|
Secured Overnight Financing Rate |
| TruPS |
|
Trust Preferred Securities |
| USD |
|
United States Dollar |
See accompanying notes
to the consolidated financial statements.
26
COHEN
& STEERS REIT AND
PREFERRED AND INCOME FUND, INC.
CONSOLIDATED SCHEDULE OF INVESTMENTS—(Continued)
June 30, 2023 (Unaudited)
Note: Percentages indicated are
based on the net assets of the Fund.
| * |
Legacy Gateway JV LLC, owns a Class A office building located at 6860 N. Dallas Parkway,
Plano, Texas 75024. |
| (a) |
A portion of the security has been rehypothecated in connection with the Fund’s revolving
credit agreement. $415,193,682 in aggregate has been rehypothecated. |
| (b) |
All or a portion of the security is pledged as collateral in connection with the Fund’s
revolving credit agreement. $957,197,284 in aggregate has been pledged as collateral. |
| (c) |
All or a portion of the security is pledged in connection with written option contracts.
$39,813,677 in aggregate has been pledged as collateral. |
| (d) |
Restricted security. Aggregate holdings equal 0.7% of the net assets of the Fund. This security was
acquired on August 3, 2020, at a cost of $3,755,469. Security value is determined based on significant unobservable inputs (Level 3). |
| (e) |
Perpetual security. Perpetual securities have no stated maturity date, but they may be
called/redeemed by the issuer. |
| (f) |
Security converts to floating rate after the indicated fixed-rate coupon period.
|
| (g) |
Variable rate. Rate shown is in effect at June 30, 2023. |
| (h) |
Securities exempt from registration under Regulation S of the Securities Act of 1933. These
securities are subject to resale restrictions. Aggregate holdings amounted to $71,409,212 which represents 7.5% of the net assets of the Fund, of which 0.0% are illiquid. |
| (i) |
Contingent Capital security (CoCo). CoCos are debt or preferred securities with loss absorption
characteristics built into the terms of the security for the benefit of the issuer. Aggregate holdings amounted to $166,441,170 which represents 17.4% of the net assets of the Fund (11.9% of the managed assets of the Fund).
|
| (j) |
Securities exempt from registration under Rule 144A of the Securities Act of 1933. These securities
may only be resold to qualified institutional buyers. Aggregate holdings amounted to $112,048,267 which represents 11.7% of the net assets of the Fund, of which 0.0% are illiquid. |
| (k) |
Non-income producing security. |
| (l) |
Security is in default. |
| (m) |
Security value is determined based on significant unobservable inputs (Level 3).
|
| (n) |
Rate quoted represents the annualized seven-day yield. |
| (o) |
Amount represents number of contracts multiplied by notional contract size multiplied by the
underlying price. |
| (p) |
Based on 1-Month LIBOR. Represents rates in effect at June 30, 2023.
|
| (q) |
Represents forward-starting interest rate swap contracts with interest receipts and payments
commencing between July 15, 2023 and August 3, 2023 (effective dates). |
| (r) |
The index intends to track the performance of the CDX.NA HY. |
| (s) |
The index intends to track the performance of the iTraxx Crossover CDS.
|
See accompanying notes to the
consolidated financial statements.
27
COHEN
& STEERS REIT AND
PREFERRED AND INCOME FUND, INC.
CONSOLIDATED STATEMENT OF ASSETS AND LIABILITIES
June 30, 2023 (Unaudited)
|
|
|
|
|
| ASSETS: |
|
|
|
|
| Investments in securities, at
value(a) (Identified cost—$1,312,570,738) |
|
$ |
1,388,888,208 |
|
| Cash |
|
|
666,734 |
|
| Cash collateral pledged for interest rate swap contracts |
|
|
8,503,539 |
|
| Foreign currency, at value (Identified cost—$576,999) |
|
|
574,947 |
|
| Receivable for: |
|
|
|
|
| Dividends and interest |
|
|
9,974,191 |
|
| Investment securities sold |
|
|
1,942,964 |
|
| Total return swap contracts, at value |
|
|
72,664 |
|
| Unrealized appreciation on forward foreign currency exchange contracts |
|
|
25,462 |
|
| Other assets |
|
|
40,715 |
|
|
|
|
|
|
| Total Assets |
|
|
1,410,689,424 |
|
|
|
|
|
|
| LIABILITIES: |
|
|
|
|
| Written option contracts, at value (Premiums received—$265,236) |
|
|
525,019 |
|
| Unrealized depreciation on forward foreign currency exchange contracts |
|
|
961,734 |
|
| Payable for: |
|
|
|
|
| Credit agreement |
|
|
450,000,000 |
|
| Interest expense |
|
|
2,233,875 |
|
| Investment securities purchased |
|
|
1,176,976 |
|
| Investment management fees |
|
|
740,842 |
|
| Dividends and distributions declared |
|
|
252,096 |
|
| Administration fees |
|
|
68,385 |
|
| Variation margin on interest rate swap contracts |
|
|
37,492 |
|
| Other liabilities |
|
|
508,080 |
|
|
|
|
|
|
| Total Liabilities |
|
|
456,504,499 |
|
|
|
|
|
|
| Series A Cumulative Preferred Stock (125 shares authorized and issued at $1,000 per
share) (Note 7) |
|
|
125,000 |
|
|
|
|
|
|
| TOTAL NET ASSETS APPLICABLE TO COMMON SHARES |
|
$ |
954,059,925 |
|
|
|
|
|
|
| NET ASSETS Applicable to Common Shareholders consist of: |
|
|
|
|
| Paid-in capital |
|
$ |
812,750,739 |
|
| Total distributable earnings/(accumulated loss) |
|
|
141,309,186 |
|
|
|
|
|
|
|
|
$ |
954,059,925 |
|
|
|
|
|
|
| NET ASSET VALUE PER COMMON SHARE: |
|
|
|
|
| ($954,059,925 ÷ 47,759,789 common shares outstanding) |
|
$ |
19.98 |
|
|
|
|
|
|
| MARKET PRICE PER COMMON SHARE |
|
$ |
18.99 |
|
|
|
|
|
|
| MARKET PRICE PREMIUM (DISCOUNT) TO NET ASSET VALUE PER
COMMON SHARE |
|
|
(4.96 |
)% |
|
|
|
|
|
| (a) |
Includes $957,805,314 pledged, of which $415,263,564 has been rehypothecated, in connection with
the Fund’s credit agreement, as described in Note 9. |
See accompanying notes to the consolidated financial statements.
28
COHEN
& STEERS REIT AND
PREFERRED AND INCOME FUND, INC.
CONSOLIDATED STATEMENT OF OPERATIONS
For the Six Months Ended June 30, 2023 (Unaudited)
|
|
|
|
|
| Investment Income: |
|
|
|
|
| Interest income |
|
$ |
17,367,799 |
|
| Dividend income (net of $12,937 of foreign withholding tax) |
|
|
16,380,579 |
|
| Rehypothecation income |
|
|
307,501 |
|
|
|
|
|
|
| Total Investment Income |
|
|
34,055,879 |
|
|
|
|
|
|
| Expenses: |
|
|
|
|
| Interest expense |
|
|
12,727,750 |
|
| Investment management fees |
|
|
4,559,309 |
|
| Administration fees |
|
|
487,794 |
|
| Shareholder reporting expenses |
|
|
260,547 |
|
| Professional fees |
|
|
119,149 |
|
| Custodian fees and expenses |
|
|
71,378 |
|
| Directors’ fees and expenses |
|
|
20,299 |
|
| Transfer agent fees and expenses |
|
|
14,748 |
|
| Miscellaneous |
|
|
22,622 |
|
|
|
|
|
|
| Total Expenses |
|
|
18,283,596 |
|
|
|
|
|
|
| Net Investment Income (Loss) |
|
|
15,772,283 |
|
|
|
|
|
|
| Net Realized and Unrealized Gain (Loss): |
|
| Net realized gain (loss) on: |
|
| Investments in securities |
|
|
(17,127,218 |
) |
| Written option contracts |
|
|
258,533 |
|
| Interest rate swap contracts |
|
|
6,640,766 |
|
| Total return swap contracts |
|
|
(115,678 |
) |
| Forward foreign currency exchange contracts |
|
|
(447,616 |
) |
| Foreign currency transactions |
|
|
73,271 |
|
|
|
|
|
|
| Net realized gain (loss) |
|
|
(10,717,942 |
) |
|
|
|
|
|
| Net change in unrealized appreciation (depreciation) on: |
|
| Investments in securities |
|
|
28,668,965 |
|
| Written option contracts |
|
|
(402,830 |
) |
| Interest rate swap contracts |
|
|
(304,067 |
) |
| Total return swap contracts |
|
|
72,664 |
|
| Forward foreign currency exchange contracts |
|
|
(206,342 |
) |
| Foreign currency translations |
|
|
(6,835 |
) |
|
|
|
|
|
| Net change in unrealized appreciation (depreciation) |
|
|
27,821,555 |
|
|
|
|
|
|
| Net Realized and Unrealized Gain (Loss) |
|
|
17,103,613 |
|
|
|
|
|
|
| Net Increase (Decrease) in Net Assets Resulting from Operations |
|
|
32,875,896 |
|
|
|
|
|
|
| Distributions Paid to Series A Cumulative Preferred Stockholders (Note
7) |
|
|
(7,702 |
) |
|
|
|
|
|
| Net Increase (Decrease) in Net Assets Applicable to Common Shareholders From
Operations |
|
$ |
32,868,194 |
|
|
|
|
|
|
See accompanying notes to the
consolidated financial statements.
29
COHEN
& STEERS REIT AND
PREFERRED AND INCOME FUND, INC.
CONSOLIDATED STATEMENT OF CHANGES IN NET ASSETS APPLICABLE TO COMMON SHARES (Unaudited)
|
|
|
|
|
|
|
|
|
| |
|
For the
Six Months Ended
June 30, 2023 |
|
|
For the
Year Ended
December 31, 2022 |
|
| Change in Net Assets Applicable to Common Shareholders: |
|
|
|
|
|
|
|
|
| From Operations: |
|
|
|
|
|
|
|
|
| Net investment income (loss) |
|
$ |
15,772,283 |
|
|
$ |
42,077,233 |
|
| Net realized gain (loss) |
|
|
(10,717,942 |
) |
|
|
30,465,094 |
|
| Net change in unrealized appreciation (depreciation) |
|
|
27,821,555 |
|
|
|
(378,823,462 |
) |
| Distributions paid to Series A Cumulative Preferred Stockholders |
|
|
(7,702 |
) |
|
|
(14,084 |
) |
|
|
|
|
|
|
|
|
|
| Net increase (decrease) in net assets applicable to Common Shareholders
from operations |
|
|
32,868,194 |
|
|
|
(306,295,219 |
) |
|
|
|
|
|
|
|
|
|
| Distributions to Common Shareholders |
|
|
(38,965,846 |
) |
|
|
(128,711,087 |
) |
|
|
|
|
|
|
|
|
|
| Capital Stock Transactions: |
|
|
|
|
|
|
|
|
| Increase (decrease) in net assets from Fund share transactions |
|
|
588,850 |
|
|
|
2,955,526 |
|
| Decrease in net assets from offering expenses from issuance of preferred
shares |
|
|
— |
|
|
|
(19,400 |
) |
|
|
|
|
|
|
|
|
|
| Net increase (decrease) in net assets from capital stock transactions |
|
|
588,850 |
|
|
|
2,936,126 |
|
|
|
|
|
|
|
|
|
|
| Total increase (decrease) in net assets applicable to Common
Shareholders |
|
|
(5,508,802 |
) |
|
|
(432,070,180 |
) |
| Net Assets Applicable to Common Shareholders |
|
|
|
|
|
|
|
|
| Beginning of period |
|
|
959,568,727 |
|
|
|
1,391,638,907 |
|
|
|
|
|
|
|
|
|
|
| End of period |
|
$ |
954,059,925 |
|
|
$ |
959,568,727 |
|
|
|
|
|
|
|
|
|
|
See accompanying notes to the
consolidated financial statements.
30
COHEN
& STEERS REIT AND
PREFERRED AND INCOME FUND, INC.
CONSOLIDATED STATEMENT OF CASH FLOWS
For the Six Months Ended June 30, 2023 (Unaudited)
|
|
|
|
|
| Increase (Decrease) in Cash: |
|
| Cash Flows from Operating Activities: |
|
| Net increase (decrease) in net assets resulting from operations* |
|
$ |
32,875,896 |
|
| Adjustments to reconcile net increase (decrease) in net assets resulting from
operations to net cash provided by operating activities: |
|
|
|
|
| Purchases of long-term investments |
|
|
(214,107,223 |
) |
| Proceeds from sales and maturities of long-term investments |
|
|
238,553,308 |
|
| Net purchases, sales and maturities of short-term investments |
|
|
(10,234,929 |
) |
| Net amortization of premium on investments in securities |
|
|
977,606 |
|
| Net decrease in dividends and interest receivable and other assets |
|
|
1,189,094 |
|
| Net increase in interest expense payable, accrued expenses and other
liabilities |
|
|
261,564 |
|
| Net increase in payable for variation margin on interest rate swap
contracts |
|
|
9,628 |
|
| Net decrease in premiums received from written option contracts |
|
|
(64,792 |
) |
| Net change in unrealized depreciation on written option contracts |
|
|
402,830 |
|
| Net change in unrealized appreciation on investments in securities |
|
|
(28,668,965 |
) |
| Net change in unrealized depreciation on forward foreign currency exchange
contracts |
|
|
206,342 |
|
| Net change in unrealized appreciation on total return swap contracts |
|
|
(72,664 |
) |
| Net realized loss on investments in securities |
|
|
17,127,218 |
|
|
|
|
|
|
| Cash provided by operating activities |
|
|
38,454,913 |
|
|
|
|
|
|
| Cash Flows from Financing Activities: |
|
|
|
|
| Distributions paid on Series A Cumulative Preferred Stock (net of distributions
payable) |
|
|
(7,702 |
) |
| Dividends and distributions paid |
|
|
(38,124,900 |
) |
|
|
|
|
|
| Cash used for financing activities |
|
|
(38,132,602 |
) |
|
|
|
|
|
| Increase (decrease) in cash and restricted cash |
|
|
322,311 |
|
| Cash and restricted cash at beginning of period (including foreign
currency) |
|
|
9,422,909 |
|
|
|
|
|
|
| Cash and restricted cash at end of period (including foreign currency) |
|
$ |
9,745,220 |
|
|
|
|
|
|
Supplemental Disclosure of Cash Flow Information:
For the six months ended June 30, 2023, interest paid was $12,304,062.
For the six months ended June 30, 2023, reinvestment of dividends was $588,850.
| * |
Does not include distributions paid to Series A Cumulative Preferred Stockholders.
|
See accompanying notes to the
consolidated financial statements.
31
COHEN
& STEERS REIT AND
PREFERRED AND INCOME FUND, INC.
CONSOLIDATED STATEMENT OF CASH FLOWS—(Continued)
For the Six Months Ended June 30, 2023 (Unaudited)
The following table provides a reconciliation of cash and
restricted cash reported within the Consolidated Statement of Assets and Liabilities that sums to the total of such amounts shown on the Consolidated Statement of Cash Flows.
|
|
|
|
|
| Cash |
|
$ |
666,734 |
|
| Restricted cash |
|
|
8,503,539 |
|
| Foreign currency |
|
|
574,947 |
|
|
|
|
|
|
| Total cash and restricted cash shown on the Consolidated Statement of Cash
Flows |
|
$ |
9,745,220 |
|
|
|
|
|
|
Restricted cash consists of cash that has been deposited with a broker and pledged to cover the
Fund’s collateral or margin obligations under derivative contracts. It is reported on the Consolidated Statement of Assets and Liabilities as cash collateral pledged for interest rate swap contracts.
See accompanying notes to the consolidated financial
statements.
32
COHEN
& STEERS REIT AND
PREFERRED AND INCOME FUND, INC.
CONSOLIDATED FINANCIAL HIGHLIGHTS (Unaudited)
The following table includes selected data for a common share outstanding throughout each period and other performance information
derived from the consolidated financial statements. It should be read in conjunction with the consolidated financial statements and notes thereto.
|
|
|
|
|
|
|
|
|
|
|
|
|
|
|
|
|
|
|
|
|
|
|
|
|
| |
|
For the Six
Months Ended
June 30, 2023(a) |
|
|
For the Year Ended December 31, |
|
| Per Share Operating Data: |
|
2022(a) |
|
|
2021(a) |
|
|
2020 |
|
|
2019 |
|
|
2018 |
|
| Net asset value per common share, beginning of period |
|
|
$20.10 |
|
|
|
$29.24 |
|
|
|
$23.62 |
|
|
|
$24.73 |
|
|
|
$19.98 |
|
|
|
$22.80 |
|
|
|
|
|
|
|
|
|
|
|
|
|
|
|
|
|
|
|
|
|
|
|
|
|
|
| Income (loss) from investment operations: |
|
|
|
|
|
|
|
|
|
|
|
|
|
|
|
|
|
|
|
|
|
|
|
|
|
|
|
|
|
|
|
| Net investment income
(loss)(b) |
|
|
0.33 |
|
|
|
0.88 |
|
|
|
0.73 |
|
|
|
0.79 |
|
|
|
0.87 |
|
|
|
0.88 |
|
| Net realized and unrealized gain (loss) |
|
|
0.37 |
|
|
|
(7.32 |
) |
|
|
6.38 |
|
|
|
(0.41 |
) |
|
|
5.37 |
|
|
|
(2.21 |
)(c) |
| Distributions paid to Series A Cumulative Preferred Stockholders |
|
|
(0.00 |
)(d) |
|
|
(0.00 |
)(d) |
|
|
— |
|
|
|
— |
|
|
|
— |
|
|
|
— |
|
|
|
|
|
|
|
|
|
|
|
|
|
|
|
|
|
|
|
|
|
|
|
|
|
|
| Total from investment operations applicable to common shares |
|
|
0.70 |
|
|
|
(6.44 |
) |
|
|
7.11 |
|
|
|
0.38 |
|
|
|
6.24 |
|
|
|
(1.33 |
) |
|
|
|
|
|
|
|
|
|
|
|
|
|
|
|
|
|
|
|
|
|
|
|
|
|
| Less dividends and distributions to common shareholders from: |
|
|
|
|
|
|
|
|
|
|
|
|
|
|
|
|
|
|
|
|
|
|
|
|
|
|
|
|
|
|
|
| Net investment income |
|
|
(0.82 |
) |
|
|
(0.55 |
) |
|
|
(0.51 |
) |
|
|
(0.51 |
) |
|
|
(0.85 |
) |
|
|
(0.92 |
) |
| Net realized gain |
|
|
— |
|
|
|
(2.15 |
) |
|
|
(0.98 |
) |
|
|
(0.98 |
) |
|
|
(0.64 |
) |
|
|
(0.57 |
) |
|
|
|
|
|
|
|
|
|
|
|
|
|
|
|
|
|
|
|
|
|
|
|
|
|
| Total dividends and distributions to common shareholders |
|
|
(0.82 |
) |
|
|
(2.70 |
) |
|
|
(1.49 |
) |
|
|
(1.49 |
) |
|
|
(1.49 |
) |
|
|
(1.49 |
) |
|
|
|
|
|
|
|
|
|
|
|
|
|
|
|
|
|
|
|
|
|
|
|
|
|
| Anti-dilutive effect from the issuance of reinvested shares |
|
|
0.00 |
(d) |
|
|
0.00 |
(d) |
|
|
— |
|
|
|
— |
|
|
|
— |
|
|
|
— |
|
|
|
|
|
|
|
|
|
|
|
|
|
|
|
|
|
|
|
|
|
|
|
|
|
|
| Net increase (decrease) in net asset value per common share |
|
|
(0.12 |
) |
|
|
(9.14 |
) |
|
|
5.62 |
|
|
|
(1.11 |
) |
|
|
4.75 |
|
|
|
(2.82 |
) |
|
|
|
|
|
|
|
|
|
|
|
|
|
|
|
|
|
|
|
|
|
|
|
|
|
| Net asset value per common share, end of period |
|
|
$19.98 |
|
|
|
$20.10 |
|
|
|
$29.24 |
|
|
|
$23.62 |
|
|
|
$24.73 |
|
|
|
$19.98 |
|
|
|
|
|
|
|
|
|
|
|
|
|
|
|
|
|
|
|
|
|
|
|
|
|
|
| Market value per common share, end of period |
|
|
$18.99 |
|
|
|
$20.38 |
|
|
|
$28.62 |
|
|
|
$22.83 |
|
|
|
$23.79 |
|
|
|
$17.80 |
|
|
|
|
|
|
|
|
|
|
|
|
|
|
|
|
|
|
|
|
|
|
|
|
|
|
|
|
|
|
|
|
|
| |
|
|
|
|
|
|
|
|
|
|
|
|
|
|
|
|
|
|
|
|
|
|
|
|
| Total net asset value
return(e) |
|
|
3.55 |
%(f) |
|
|
–22.57 |
% |
|
|
31.05 |
% |
|
|
2.87 |
% |
|
|
32.35 |
% |
|
|
–5.20 |
%(c) |
|
|
|
|
|
|
|
|
|
|
|
|
|
|
|
|
|
|
|
|
|
|
|
|
|
| Total market value
return(e) |
|
|
–2.93 |
%(f) |
|
|
–19.79 |
% |
|
|
32.71 |
% |
|
|
3.36 |
% |
|
|
42.92 |
% |
|
|
–9.47 |
% |
|
|
|
|
|
|
|
|
|
|
|
|
|
|
|
|
|
|
|
|
|
|
|
|
|
|
|
|
|
|
|
|
| |
|
|
|
|
|
|
|
|
|
|
|
|
|
|
|
|
|
|
|
|
|
|
|
|
See accompanying notes to the consolidated financial statements.
33
COHEN
& STEERS REIT AND
PREFERRED AND INCOME FUND, INC.
CONSOLIDATED FINANCIAL HIGHLIGHTS (Unaudited)—(Continued)
|
|
|
|
|
|
|
|
|
|
|
|
|
|
|
|
|
|
|
|
|
|
|
|
|
| |
|
For the Six
Months Ended
June 30, 2023(a) |
|
|
For the Year Ended December 31, |
|
| Ratios/Supplemental Data: |
|
2022(a) |
|
|
2021(a) |
|
|
2020 |
|
|
2019 |
|
|
2018 |
|
|
|
|
|
|
|
|
| Net assets applicable to common shareholders, end of period
(in millions) |
|
|
$954.1 |
|
|
|
$959.6 |
|
|
|
$1,391.6 |
|
|
|
$1,123.7 |
|
|
|
$1,176.5 |
|
|
|
$950.3 |
|
|
|
|
|
|
|
|
|
|
|
|
|
|
|
|
|
|
|
|
|
|
|
|
|
|
| Ratios to average daily net assets: |
|
|
|
|
|
|
|
|
|
|
|
|
|
|
|
|
|
|
|
|
|
|
|
|
|
|
|
|
|
|
|
| Expenses |
|
|
3.82 |
%(g)(h) |
|
|
2.21 |
% |
|
|
1.78 |
% |
|
|
2.07 |
% |
|
|
1.96 |
% |
|
|
1.93 |
%(c) |
|
|
|
|
|
|
|
|
|
|
|
|
|
|
|
|
|
|
|
|
|
|
|
|
|
|
|
|
|
|
|
|
| Expenses (excluding interest expense) |
|
|
1.16 |
%(g)(h) |
|
|
1.10 |
%(h) |
|
|
1.04 |
%(e) |
|
|
1.04 |
%(e) |
|
|
1.02 |
%(e) |
|
|
1.05 |
% |
|
|
|
|
|
|
|
|
|
|
|
|
|
|
|
|
|
|
|
|
|
|
|
|
|
| Net investment income (loss) |
|
|
3.30 |
%(g)(h) |
|
|
3.67 |
%(h) |
|
|
2.77 |
% |
|
|
3.56 |
% |
|
|
3.72 |
% |
|
|
4.10 |
% |
|
|
|
|
|
|
|
|
|
|
|
|
|
|
|
|
|
|
|
|
|
|
|
|
|
| Ratio of expenses to average daily managed assets(i) |
|
|
2.61 |
%(g) |
|
|
1.59 |
% |
|
|
1.33 |
% |
|
|
1.55 |
% |
|
|
1.49 |
% |
|
|
1.43 |
% |
|
|
|
|
|
|
|
|
|
|
|
|
|
|
|
|
|
|
|
|
|
|
|
|
|
| Portfolio turnover rate |
|
|
15 |
%(f) |
|
|
40 |
% |
|
|
40 |
% |
|
|
57 |
% |
|
|
53 |
% |
|
|
39 |
% |
|
|
|
|
|
|
|
|
|
|
|
|
|
|
|
|
|
|
|
|
|
|
|
|
|
| Credit Agreement |
|
|
|
|
|
|
|
|
|
|
|
|
|
|
|
|
|
|
|
|
|
|
|
|
|
|
|
|
|
|
|
| Asset coverage ratio for credit agreement |
|
|
312 |
% |
|
|
313 |
% |
|
|
427 |
% |
|
|
381 |
% |
|
|
436 |
% |
|
|
372 |
% |
|
|
|
|
|
|
|
|
|
|
|
|
|
|
|
|
|
|
|
|
|
|
|
|
|
| Asset coverage per $1,000 for credit agreement |
|
|
$3,120 |
|
|
|
$3,132 |
|
|
|
$4,274 |
|
|
|
$3,809 |
|
|
|
$4,361 |
|
|
|
$3,715 |
|
|
|
|
|
|
|
|
|
|
|
|
|
|
|
|
|
|
|
|
|
|
|
|
|
|
| Amount of loan outstanding (in millions) |
|
|
$450.0 |
|
|
|
$450.0 |
|
|
|
$425.0 |
|
|
|
$400.0 |
|
|
|
$350.0 |
|
|
|
$350.0 |
|
|
|
|
|
|
|
|
|
|
|
|
|
|
|
|
|
|
|
|
|
|
|
|
|
|
| Series A Cumulative Preferred Stock at liquidation value, end of year
(in 000s) |
|
|
$125.0 |
|
|
|
$125.0 |
|
|
|
— |
|
|
|
— |
|
|
|
— |
|
|
|
— |
|
|
|
|
|
|
|
|
|
|
|
|
|
|
|
|
|
|
|
|
|
|
|
|
|
|
| Asset coverage ratio for Series A Cumulative Preferred Stock |
|
|
312 |
% |
|
|
313 |
% |
|
|
— |
|
|
|
— |
|
|
|
— |
|
|
|
— |
|
|
|
|
|
|
|
|
|
|
|
|
|
|
|
|
|
|
|
|
|
|
|
|
|
|
| Asset Coverage, per $1,000 liquidation value per share of Series A Cumulative
Preferred Stock |
|
|
$3,120 |
|
|
|
$3,132 |
|
|
|
— |
|
|
|
— |
|
|
|
— |
|
|
|
— |
|
|
|
|
|
|
|
|
|
|
|
|
|
|
|
|
|
|
|
|
|
|
|
|
|
|
See accompanying notes to the
consolidated financial statements.
34
COHEN
& STEERS REIT AND
PREFERRED AND INCOME FUND, INC.
CONSOLIDATED FINANCIAL HIGHLIGHTS (Unaudited)—(Continued)
| (a) |
Consolidated (see Note 1). |
| (b) |
Calculation based on average shares outstanding. |
| (c) |
During the reporting period the Fund settled legal claims against one issuer of securities
previously held by the Fund. As a result, the net realized and unrealized gain (loss) on investments per share includes proceeds received from the settlement. Without these proceeds the net realized and unrealized gain (loss) on investments per
share would have been $(2.22). Additionally, the expense ratio includes extraordinary expenses related to the direct action. Without these expenses, the ratio of expenses to average daily net assets would have been 1.92%. Excluding the proceeds from
and expenses relating to the settlements, the total return on a NAV basis would have been -5.24%. |
| (d) |
Amount is less than $0.005. |
| (e) |
Total net asset value return measures the change in net asset value per share over the year
indicated. Total market value return is computed based upon the Fund’s market price per share and excludes the effects of brokerage commissions. Dividends and distributions are assumed, for purposes of these calculations, to be reinvested at
prices obtained under the Fund’s dividend reinvestment plan. |
| (h) |
Calculated on the basis of average net assets of common stock shareholders. Ratios do not reflect
the effect of dividend payments to Series A Cumulative Preferred Stockholders. |
| (i) |
Average daily managed assets represent net assets plus the outstanding balance of the credit
agreement. Ratios do not reflect the effect of dividend payments to Series A Cumulative Preferred Stockholders. |
See accompanying notes to the consolidated financial statements.
35
COHEN
& STEERS REIT AND
PREFERRED AND INCOME FUND, INC.
NOTES TO CONSOLIDATED FINANCIAL STATEMENTS (Unaudited)
Note 1. Organization and Significant Accounting Policies
Cohen & Steers REIT and Preferred and Income Fund, Inc. (the Fund) was incorporated under the laws of the State of
Maryland on March 25, 2003 and is registered under the Investment Company Act of 1940 (the 1940 Act) as a diversified, closed-end management investment company. The Fund’s investment objective is
high current income. The Fund’s secondary investment objective is capital appreciation.
Cohen & Steers
RNP Trust (the REIT Subsidiary), is a wholly-owned subsidiary of the Fund organized under the laws of the state of Maryland as a statutory trust on July 9, 2021 that commenced operations on November 30, 2021. The REIT Subsidiary acts as an
investment vehicle for the Fund in order to effect certain investments on behalf of the Fund, consistent with the Fund’s investment objectives and policies. The Fund expects that it will achieve a significant portion of its exposure to private
real estate investments through investment in the REIT Subsidiary. The REIT Subsidiary may use wholly-owned, limited liability companies to contain the exposure of individual private real estate investments. Unlike the Fund, the REIT Subsidiary may
invest without limitation in private real estate. Investments in the REIT Subsidiary are limited to 25% of the Fund’s total assets. The Consolidated Schedule of Investments includes positions of the Fund and the REIT Subsidiary. The financial
statements have been consolidated and include the accounts of the Fund and the REIT Subsidiary. All significant inter-company balances and transactions have been eliminated in consolidation.
The following is a summary of significant accounting policies consistently followed by the Fund in the preparation of its
consolidated financial statements. The Fund is an investment company and, accordingly, follows the investment company accounting and reporting guidance of the Financial Accounting Standards Board Accounting Standards Codification (ASC) Topic
946—Investment Companies. The accounting policies of the Fund are in conformity with accounting principles generally accepted in the United States of America (GAAP). The preparation of the consolidated financial statements in accordance with
GAAP requires management to make estimates and assumptions that affect the reported amounts of assets and liabilities at the date of the consolidated financial statements and the reported amounts of income and expenses during the reporting period.
Actual results could differ from those estimates.
Portfolio Valuation: Investments in securities that are listed
on the New York Stock Exchange (NYSE) are valued, except as indicated below, at the last sale price reflected at the close of the NYSE on the business day as of which such value is being determined. If there has been no sale on such day, the
securities are valued at the mean of the closing bid and ask prices on such day or, if no ask price is available, at the bid price. Centrally cleared interest rate swaps are valued at the price determined by the relevant exchange or clearinghouse.
Forward foreign currency exchange contracts are valued daily at the prevailing forward exchange rate. Exchange-traded options are valued at their last sale price as of the close of options trading on applicable exchanges on the valuation date. In
the absence of a last sale price on such day, options are valued based upon prices provided by a third-party pricing service. Over-the-counter (OTC) options and total
return swap contracts are valued based upon prices provided by a third-party pricing service or counterparty.
Securities not listed on the NYSE but listed on other domestic or foreign securities exchanges (including NASDAQ) are valued in a
similar manner. Securities traded on more than one securities
36
COHEN
& STEERS REIT AND
PREFERRED AND INCOME FUND, INC.
NOTES TO CONSOLIDATED FINANCIAL STATEMENTS (Unaudited)—(Continued)
exchange are valued at the last sale price reflected at the close of the
exchange representing the principal market for such securities on the business day as of which such value is being determined. If after the close of a foreign market, but prior to the close of business on the day the securities are being valued,
market conditions change significantly, certain non-U.S. equity holdings may be fair valued pursuant to procedures established by the Board of Directors.
Readily marketable securities traded in the over-the-counter (OTC) market, including listed
securities whose primary market is believed by Cohen & Steers Capital Management, Inc. (the investment manager) to be OTC, are valued on the basis of prices provided by a third-party pricing service or third-party broker-dealers when such
prices are believed by the investment manager, pursuant to delegation by the Board of Directors, to reflect the fair value of such securities.
Fixed-income securities are valued on the basis of prices provided by a third-party pricing service or third-party broker-dealers
when such prices are believed by the investment manager, pursuant to delegation by the Board of Directors, to reflect the fair value of such securities. The pricing services or broker-dealers use multiple valuation techniques to determine fair
value. In instances where sufficient market activity exists, the pricing services or broker-dealers may utilize a market-based approach through which quotes from market makers are used to determine fair value. In instances where sufficient market
activity may not exist or is limited, the pricing services or broker-dealers also utilize proprietary valuation models which may consider market transactions in comparable securities and the various relationships between securities in determining
fair value and/or characteristics such as benchmark yield curves, option-adjusted spreads, credit spreads, estimated default rates, coupon rates, anticipated timing of principal repayments, underlying collateral, and other unique security features
which are then used to calculate the fair values.
Short-term debt securities with a maturity date of 60 days or less
are valued at amortized cost, which approximates fair value. Investments in open-end mutual funds are valued at net asset value (NAV).
The Fund utilizes an independent valuation services firm (the Independent Valuation Advisor) to assist the investment manager in
the determination of the Fund‘s fair value of private real estate investments held by the REIT Subsidiary. Limited scope appraisals are prepared on a monthly basis and typically include a limited comparable sales and a full discounted cash flow
analysis. Annually, a full scope, detailed appraisal report is completed which typically includes market analysis, cost approach, sales comparison approach and an income approach containing a discounted cash flow analysis. The full scope report is
prepared by a third-party appraisal firm. The investment manager, including through communication with the Independent Valuation Advisor, monitors for material events that the investment manager believes may be expected to have a material impact on
the most recent estimated fair values of such private real estate investments. However, rapidly changing market conditions or material events may not be immediately reflected in the Fund’s or REIT Subsidiary’s daily NAV. The investment
manager, in conjunction with the Independent Valuation Advisor, values the private real estate investments using the valuation methodology it deems most appropriate and consistent with industry best practices and market conditions. The investment
manager expects the primary methodology used to value private real estate investments will be the income approach. Consistent with industry practices, the income approach incorporates actual contractual lease income, professional judgments regarding
37
COHEN
& STEERS REIT AND
PREFERRED AND INCOME FUND, INC.
NOTES TO CONSOLIDATED FINANCIAL STATEMENTS (Unaudited)—(Continued)
comparable rental and operating expense data, the capitalization or discount
rate and projections of future rent and expenses based on appropriate market evidence, and other subjective factors. Other methodologies that may also be used to value properties include, among other approaches, sales comparisons and cost
approaches. Private real estate appraisals are reported on a free and clear basis (i.e. any property-level indebtedness that may be in place is not incorporated into the valuation). Property level debt is valued separately in accordance with GAAP.
The Board of Directors has designated the investment manager as the Fund’s “Valuation Designee” under
Rule 2a-5 under the 1940 Act. As Valuation Designee, the investment manager is authorized to make fair valuation determinations, subject to the oversight of the Board of Directors. The investment manager has
established a valuation committee (Valuation Committee) to administer, implement and oversee the fair valuation process according to the policies and procedures approved annually by the Board of Directors. Among other things, these procedures allow
the Fund to utilize independent pricing services, quotations from securities and financial instrument dealers and other market sources to determine fair value.
Securities for which market prices are unavailable, or securities for which the investment manager determines that the bid and/or
ask price or a counterparty valuation does not reflect market value, will be valued at fair value, as determined in good faith by the Valuation Committee, pursuant to procedures approved by the Fund’s Board of Directors. Circumstances in which
market prices may be unavailable include, but are not limited to, when trading in a security is suspended, the exchange on which the security is traded is subject to an unscheduled close or disruption or material events occur after the close of the
exchange on which the security is principally traded. In these circumstances, the Fund determines fair value in a manner that fairly reflects the market value of the security on the valuation date based on consideration of any information or factors
it deems appropriate. These may include, but are not limited to, recent transactions in comparable securities, information relating to the specific security and developments in the markets.
For equity securities, including restricted securities, where observable inputs are limited, assumptions about market activity and
risk are used and these securities would be categorized as Level 2 or 3 in the hierarchy, depending on the relative significance of the valuation inputs. Securities, including private placements or other restricted securities, for which
observable inputs are not available are valued using alternate valuation approaches, including the market approach, the income approach and cost approach, and are categorized as Level 3 in the hierarchy. The market approach considers factors
including the price of recent investments in the same or a similar security or financial metrics of comparable securities. The income approach considers factors including expected future cash flows, security specific risks and corresponding discount
rates. The cost approach considers factors including the value of the security’s underlying assets and liabilities.
The Fund’s use of fair value pricing may cause the NAV of Fund shares to differ from the NAV that would be calculated using
market quotations. Fair value pricing involves subjective judgments and it is possible that the fair value determined for a security may be materially different than the value that could be realized upon the sale of that security.
Fair value is defined as the price that the Fund would expect to receive upon the sale of an investment or expect to pay to
transfer a liability in an orderly transaction with an independent buyer in
38
COHEN
& STEERS REIT AND
PREFERRED AND INCOME FUND, INC.
NOTES TO CONSOLIDATED FINANCIAL STATEMENTS (Unaudited)—(Continued)
the principal market or, in the absence of a principal market, the most
advantageous market for the investment or liability. The hierarchy of inputs that are used in determining the fair value of the Fund’s investments is summarized below.
| |
• |
|
Level 1—quoted prices in active markets for identical investments |
| |
• |
|
Level 2—other significant observable inputs (including quoted prices for similar investments,
interest rates, credit risk, etc.) |
| |
• |
|
Level 3—significant unobservable inputs (including the Fund’s own assumptions in
determining the fair value of investments) |
The inputs or methodology used for valuing investments may
or may not be an indication of the risk associated with those investments. Changes in valuation techniques may result in transfers into or out of an assigned level within the disclosure hierarchy.
The following is a summary of the inputs used as of June 30, 2023 in valuing the Fund’s investments carried at value:
|
|
|
|
|
|
|
|
|
|
|
|
|
|
|
|
|
| |
|
Quoted Prices
in Active
Markets for
Identical
Investments
(Level 1) |
|
|
Other
Significant
Observable
Inputs
(Level 2) |
|
|
Significant
Unobservable
Inputs
(Level 3) |
|
|
Total |
|
| Common Stock: |
|
|
|
|
|
|
|
|
|
|
|
|
|
|
|
|
| Real Estate—Industrials |
|
$ |
93,539,584 |
|
|
$ |
— |
|
|
$ |
6,553,919 |
(a) |
|
$ |
100,093,503 |
|
| Other Industries |
|
|
569,123,566 |
|
|
|
— |
|
|
|
— |
|
|
|
569,123,566 |
|
| Exchange-Traded Funds |
|
|
2,130,830 |
|
|
|
— |
|
|
|
— |
|
|
|
2,130,830 |
|
| Preferred Securities—
Exchange-Traded |
|
|
116,374,195 |
|
|
|
— |
|
|
|
— |
|
|
|
116,374,195 |
|
| Preferred Securities—
Over-the-Counter |
|
|
— |
|
|
|
566,557,804 |
|
|
|
— |
|
|
|
566,557,804 |
|
| Private Real Estate—Office |
|
|
— |
|
|
|
— |
|
|
|
14,951,266 |
(b) |
|
|
14,951,266 |
|
| Short-Term Investments |
|
|
— |
|
|
|
19,355,694 |
|
|
|
— |
|
|
|
19,355,694 |
|
| Purchased Option Contracts |
|
|
301,350 |
|
|
|
— |
|
|
|
— |
|
|
|
301,350 |
|
|
|
|
|
|
|
|
|
|
|
|
|
|
|
|
|
|
| Total Investments in
Securities(c) |
|
$ |
781,469,525 |
|
|
$ |
585,913,498 |
|
|
$ |
21,505,185 |
|
|
$ |
1,388,888,208 |
|
|
|
|
|
|
|
|
|
|
|
|
|
|
|
|
|
|
| Forward Foreign Currency Exchange Contracts |
|
$ |
— |
|
|
$ |
25,462 |
|
|
$ |
— |
|
|
$ |
25,462 |
|
| Interest Rate Swap Contracts |
|
|
— |
|
|
|
35,772,884 |
|
|
|
— |
|
|
|
35,772,884 |
|
| Total Return Swap Contracts |
|
|
— |
|
|
|
72,664 |
|
|
|
— |
|
|
|
72,664 |
|
|
|
|
|
|
|
|
|
|
|
|
|
|
|
|
|
|
| Total Derivative
Assets(c) |
|
$ |
— |
|
|
$ |
35,871,010 |
|
|
$ |
— |
|
|
$ |
35,871,010 |
|
|
|
|
|
|
|
|
|
|
|
|
|
|
|
|
|
|
39
COHEN
& STEERS REIT AND
PREFERRED AND INCOME FUND, INC.
NOTES TO CONSOLIDATED FINANCIAL STATEMENTS (Unaudited)—(Continued)
|
|
|
|
|
|
|
|
|
|
|
|
|
|
|
|
|
| |
|
Quoted Prices
in Active
Markets for
Identical
Investments
(Level 1) |
|
|
Other
Significant
Observable
Inputs
(Level 2) |
|
|
Significant
Unobservable
Inputs
(Level 3) |
|
|
Total |
|
| Forward Foreign Currency Exchange Contracts |
|
$ |
— |
|
|
$ |
(961,734 |
) |
|
$ |
— |
|
|
$ |
(961,734 |
) |
| Written Option Contracts |
|
|
(508,149 |
) |
|
|
(16,870 |
) |
|
|
— |
|
|
|
(525,019 |
) |
|
|
|
|
|
|
|
|
|
|
|
|
|
|
|
|
|
| Total Derivative
Liabilities(c) |
|
$ |
(508,149 |
) |
|
$ |
(978,604 |
) |
|
$ |
— |
|
|
$ |
(1,486,753 |
) |
|
|
|
|
|
|
|
|
|
|
|
|
|
|
|
|
|
| (a) |
Restricted security, where observable inputs are limited, has been fair valued by the Valuation
Committee, pursuant to the Fund’s fair value procedures and classified as Level 3 security. |
| (b) |
Private Real Estate, where observable inputs are limited, has been fair valued by the valuation
committee, pursuant to the fund’s fair value procedures and classified as Level 3 security. See Note 1—Portfolio Valuation. |
| (c) |
Portfolio holdings are disclosed individually on the Consolidated Schedule of Investments.
|
The following is a reconciliation of investments for which significant unobservable inputs (Level 3)
were used in determining fair value:
|
|
|
|
|
|
|
|
|
|
|
|
|
| |
|
Common Stock—
Real Estate—
Industrials |
|
|
Preferred
Securities—
Over-the-Counter—
Food |
|
|
Private
Real Estate—
Office |
|
| Balance as of December 31, 2022 |
|
$ |
5,760,042 |
|
|
$ |
7,303,248 |
|
|
$ |
15,812,130 |
|
| Transfer out of Level
3(a) |
|
|
— |
|
|
|
(7,585,000 |
) |
|
|
— |
|
| Change in unrealized appreciation (depreciation) |
|
|
793,877 |
|
|
|
281,752 |
|
|
|
(860,864 |
) |
|
|
|
|
|
|
|
|
|
|
|
|
|
| Balance as of June 30, 2023 |
|
$ |
6,553,919 |
|
|
$ |
— |
|
|
$ |
14,951,266 |
|
|
|
|
|
|
|
|
|
|
|
|
|
|
| (a) |
As of December 31, 2022, the Fund used significant unobservable inputs in determining the
value of this investment. As of June 30, 2023, the same investment was transferred from Level 3 to Level 2 as a result of the availability of observable inputs. |
The change in unrealized appreciation (depreciation) attributable to securities owned on June 30, 2023 which were valued using
significant unobservable inputs (Level 3) amounted to $214,765.
40
COHEN
& STEERS REIT AND
PREFERRED AND INCOME FUND, INC.
NOTES TO CONSOLIDATED FINANCIAL STATEMENTS (Unaudited)—(Continued)
The following table summarizes the quantitative inputs and
assumptions used for investments categorized in Level 3 of the fair value hierarchy.
|
|
|
|
|
|
|
|
|
|
|
|
|
|
|
|
|
|
|
| |
|
Fair Value at
June 30, 2023 |
|
|
Valuation
Technique |
|
|
Unobservable Inputs |
|
Amount |
|
|
Valuation Impact
from an Increase
in Input(a) |
|
| Common Stock—
Real Estate—
Industrials |
|
|
$ 6,553,919 |
|
|
|
Market
Comparable
Companies |
|
|
Enterprise Value/
EBITDA(b) Multiple |
|
|
23.3x |
|
|
|
Increase |
|
| |
|
|
|
|
|
|
|
|
|
|
|
|
|
|
|
|
|
|
| Private Real
Estate —
Office |
|
|
$14,951,266 |
|
|
|
Discounted
Cash Flow |
|
|
Discount Rate Terminal Capitalization Rate |
|
|
7.50%
6.50% |
|
|
|
Decrease
Decrease |
|
| (a) |
Represents the directional change in the fair value of the Level 3 investments that could have
resulted from an increase in the corresponding input as of period end. A decrease to the unobservable input would have had the opposite effect. Significant changes in these inputs may result in a materially higher or lower fair value measurement.
|
| (b) |
Earnings Before Interest, Taxes, Depreciation and Amortization. |
Security Transactions and Investment Income: Security transactions are recorded on trade date. Realized gains and losses on
investments sold are recorded on the basis of identified cost. Interest income, which includes the amortization of premiums and accretion of discounts, is recorded on the accrual basis. Dividend income is recorded on
the ex-dividend date except for certain dividends on foreign securities, which are recorded as soon as the Fund is informed after the ex-dividend date.
Distributions from real estate investment trusts (REITs) are recorded as ordinary income, net realized capital gain or return of capital based on information reported by the REITs and management’s estimates of such amounts based on historical
information. These estimates are adjusted when the actual source of distributions is disclosed by the REITs and actual amounts may differ from the estimated amounts.
Foreign Currency Translation: The books and records of the Fund are maintained in U.S. dollars. Investment securities and
other assets and liabilities denominated in foreign currencies are translated into U.S. dollars based upon prevailing exchange rates on the date of valuation. Purchases and sales of investment securities and income and expense items denominated in
foreign currencies are translated into U.S. dollars based upon prevailing exchange rates on the respective dates of such transactions. The Fund does not isolate that portion of the results of operations resulting from fluctuations in foreign
exchange rates on investments from the fluctuations arising from changes in market prices of securities held. Such fluctuations are included with the net realized and unrealized gain or loss on investments.
Net realized foreign currency transaction gains or losses arise from sales of foreign currencies, (excluding gains and losses on
forward foreign currency exchange contracts, which are presented separately, if any), currency gains or losses realized between the trade and settlement dates on securities transactions, and the difference between the amounts of dividends, interest,
and foreign withholding taxes recorded on the Fund’s books and the U.S. dollar equivalent of the amounts actually
41
COHEN
& STEERS REIT AND
PREFERRED AND INCOME FUND, INC.
NOTES TO CONSOLIDATED FINANCIAL STATEMENTS (Unaudited)—(Continued)
received or paid. Net unrealized foreign currency translation gains and
losses arise from changes in the values of assets and liabilities, other than investments in securities, on the date of valuation, resulting from changes in exchange rates. Pursuant to U.S. federal income tax regulations, certain foreign currency
gains/losses included in realized and unrealized gains/losses are included in or are a reduction of ordinary income for federal income tax purposes.
Forward Foreign Currency Exchange Contracts: The Fund enters into forward foreign currency exchange contracts to hedge the
currency exposure associated with certain of its non-U.S. dollar denominated securities. A forward foreign currency exchange contract is a commitment between two parties to purchase or sell foreign currency at
a set price on a future date. The market value of a forward foreign currency exchange contract fluctuates with changes in foreign currency exchange rates. These contracts are marked to market daily and the change in value is recorded by the Fund as
unrealized appreciation and/or depreciation on forward foreign currency exchange contracts. Realized gains or losses equal to the difference between the value of the contract at the time it was opened and the value at the time it was closed are
included in net realized gain or loss on forward foreign currency exchange contracts. For federal income tax purposes, the Fund has made an election to treat gains and losses from forward foreign currency exchange contracts as capital gains and
losses.
Forward foreign currency exchange contracts involve elements of market risk in excess of the amounts reflected
on the Consolidated Statement of Assets and Liabilities. The Fund bears the risk of an unfavorable change in the foreign exchange rate underlying the contract. Risks may also arise upon entering these contracts from the potential inability of the
counterparties to meet the terms of their contracts. In connection with these contracts, securities may be identified as collateral in accordance with the terms of the respective contracts.
Option Contracts: The Fund may purchase and write exchange-listed and OTC put or call options on securities, stock indices
and other financial instruments for hedging purposes, to enhance portfolio returns and/or reduce overall volatility.
When the Fund writes (sells) an option, an amount equal to the premium received by the Fund is recorded on the Consolidated
Statement of Assets and Liabilities as a liability. The amount of the liability is subsequently marked-to-market to reflect the current market value of the option
written. When an option expires, the Fund realizes a gain on the option to the extent of the premium received. Premiums received from writing options which are exercised or closed are added to or offset against the proceeds or amount paid on the
transaction to determine the realized gain or loss. If a put option on a security is exercised, the premium reduces the cost basis of the security purchased by the Fund. If a call option is exercised, the premium is added to the proceeds of the
security sold to determine the realized gain or loss. The Fund, as writer of an option, bears the market risk of an unfavorable change in the price of the underlying investment. Other risks include the possibility of an illiquid options market or
the inability of the counterparties to fulfill their obligations under the contracts.
Put and call options purchased
are accounted for in the same manner as portfolio securities. Premiums paid for purchasing options which expire are treated as realized losses. Premiums paid for purchasing options which are exercised or closed are added to the amounts paid or
offset against the proceeds on the underlying investment transaction to determine the realized gain or loss when the underlying transaction is executed. The risk associated with purchasing an option is that the Fund pays
42
COHEN
& STEERS REIT AND
PREFERRED AND INCOME FUND, INC.
NOTES TO CONSOLIDATED FINANCIAL STATEMENTS (Unaudited)—(Continued)
a premium whether or not the option is exercised. Additionally, the Fund
bears the risk of loss of the premium and change in market value should the counterparty not perform under the contract.
Over-the-Counter Total Return Swap
Contracts: In a total return swap, one party receives a periodic payment equal to the total return of a specified security, basket of securities, index, or other reference asset for a specified period of time. In return, the other party receives
a fixed or variable stream of payments, typically based upon short-term interest rates, possibly plus or minus an agreed upon spread. During the term of the outstanding swap agreement, changes in the value of the swap are recorded as unrealized
gains and losses. Periodic payments received or made are recorded as realized gains or losses. The Fund bears the risk of loss in the event of nonperformance by the swap counterparty. Risks may also arise from unanticipated movements in the value of
exchange rates, interest rates, securities, index, or other reference asset.
Centrally Cleared Interest Rate Swap
Contracts: The Fund uses interest rate swaps in connection with borrowing under its credit agreement. The interest rate swaps are intended to reduce interest rate risk by countering the effect that an increase in short-term interest rates could
have on the performance of the Fund’s shares as a result of the floating rate structure of interest owed pursuant to the credit agreement. When entering into interest rate swaps, the Fund agrees to pay the other party to the interest rate swap
(which is known as the counterparty) a fixed rate payment in exchange for the counterparty’s agreement to pay the Fund a variable rate payment that was intended to approximate the Fund’s variable rate payment obligation on the credit
agreement, the accruals for which would begin at a specific date in the future (the effective date). The payment obligation is based on the notional amount of the swap. Depending on the state of interest rates in general, the use of interest rate
swaps could enhance or harm the overall performance of the Fund. Swaps are marked-to-market daily and changes in the value are recorded as unrealized appreciation
(depreciation).
Immediately following execution of the swap agreement, the swap agreement is novated to a central
counterparty (the CCP) and the Fund’s counterparty on the swap agreement becomes the CCP. The Fund is required to interface with the CCP through a broker. Upon entering into a centrally cleared swap, the Fund is required to deposit initial
margin with the broker in the form of cash or securities in an amount that varies depending on the size and risk profile of the particular swap. Securities deposited as initial margin are designated on the Consolidated Schedule of Investments and
cash deposited is recorded on the Consolidated Statement of Assets and Liabilities as cash collateral pledged for interest rate swap contracts. The daily change in valuation of centrally cleared swaps is recorded as a receivable or payable for
variation margin on interest rate swap contracts in the Consolidated Statement of Assets and Liabilities. Any upfront payments paid or received upon entering into a swap agreement would be recorded as assets or liabilities, respectively, in the
Consolidated Statement of Assets and Liabilities, and amortized or accreted over the life of the swap and recorded as realized gain (loss) in the Consolidated Statement of Operations. Payments received from or paid to the counterparty during the
term of the swap agreement, or at termination, are recorded as realized gain (loss) in the Consolidated Statement of Operations.
Swap agreements involve, to varying degrees, elements of market and counterparty risk, and exposure to loss in excess of the related amounts reflected on the Consolidated Statement of Assets and Liabilities. Such risks involve the
possibility that there will be no liquid market for these agreements,
43
COHEN
& STEERS REIT AND
PREFERRED AND INCOME FUND, INC.
NOTES TO CONSOLIDATED FINANCIAL STATEMENTS (Unaudited)—(Continued)
that the counterparty to the agreements may default on its obligation to
perform or disagree as to the meaning of contractual terms in the agreements and that there may be unfavorable changes in interest rates.
Dividends and Distributions to Shareholders: Dividends from net investment income and capital gain distributions are determined in accordance with U.S. federal income tax regulations, which may differ from GAAP. Dividends
from net investment income, if any, are typically declared quarterly and paid monthly. Net realized capital gains, unless offset by any available capital loss carryforward, are typically distributed to shareholders at least annually. Dividends and
distributions to shareholders are recorded on the ex-dividend date and are automatically reinvested in full and fractional shares of the Fund in accordance with the Fund’s Reinvestment Plan, unless the
shareholder has elected to have them paid in cash.
The Fund has a managed distribution policy in accordance with
exemptive relief issued by the U.S. Securities and Exchange Commission (SEC). The Plan gives the Fund greater flexibility to realize long-term capital gains throughout the year and to distribute those gains on a more regular basis to shareholders.
Therefore, regular monthly distributions throughout the year may include a portion of estimated realized long-term capital gains, along with net investment income, short-term capital gains and return of capital, which is not taxable. In accordance
with the Plan, the Fund is required to adhere to certain conditions in order to distribute long-term capital gains during the year.
Dividends from net investment income are subject to recharacterization for tax purposes. Based upon the results of operations for the six months ended June 30, 2023, the investment manager considers it likely that a portion of
the dividends will be reclassified to distributions from net realized gain upon the final determination of the Fund’s taxable income after December 31, 2023 the Fund’s fiscal year end.
Distributions Subsequent to June 30, 2023: The following distributions have been declared by the
Fund’s Board of Directors and are payable subsequent to the period end of this report.
|
|
|
|
|
|
|
|
|
|
|
|
Ex-Date |
|
Record Date |
|
Payable Date |
|
|
Amount |
|
| 7/11/23 |
|
7/12/23 |
|
|
7/31/23 |
|
|
$ |
0.136 |
|
| 8/15/23 |
|
8/16/23 |
|
|
8/31/23 |
|
|
$ |
0.136 |
|
| 9/12/23 |
|
9/13/23 |
|
|
9/29/23 |
|
|
$ |
0.136 |
|
Distributions to holders of Series A Cumulative Preferred Stock are accrued daily and paid
semi-annually and are determined as described in Note 7. The payments made to the holders of the Fund’s Series A Cumulative Preferred Stock are treated as dividends or distributions.
Income Taxes: It is the policy of the Fund to continue to qualify as a regulated investment company (RIC), if such
qualification is in the best interest of the shareholders, by complying with the requirements of Subchapter M of the Internal Revenue Code applicable to RICs, and by distributing substantially all of its taxable earnings to its shareholders. Also,
in order to avoid the payment of any federal excise taxes, the Fund will distribute substantially all of its net investment income and net realized gains on a calendar year basis. Accordingly, no provision for federal income or excise tax is
necessary. Dividend and interest income from holdings in non-U.S. securities is recorded net of
44
COHEN
& STEERS REIT AND
PREFERRED AND INCOME FUND, INC.
NOTES TO CONSOLIDATED FINANCIAL STATEMENTS (Unaudited)—(Continued)
non-U.S. taxes paid. Management has
analyzed the Fund’s tax positions taken on federal and applicable state income tax returns as well as its tax positions in non-U.S. jurisdictions in which it trades for all open tax years and has
concluded that as of June 30, 2023, no additional provisions for income tax are required in the Fund’s consolidated financial statements. The Fund’s tax positions for the tax years for which the applicable statutes of limitations have
not expired are subject to examination by the Internal Revenue Service, state departments of revenue and by foreign tax authorities.
The REIT Subsidiary intends to elect to be taxed as a REIT under Subchapter M of the Code. The REIT Subsidiary’s qualification and taxation as a REIT depends upon the REIT Subsidiary’s ability to meet on a continuing
basis, through actual operating results, certain qualification tests set forth in the Code. Those qualification tests involve the percentage of income that it earns from specified sources, the percentage of its assets that falls within specified
categories, the diversity of the ownership of its shares, and the percentage of its taxable income that the REIT Subsidiary distributes. As a REIT, the REIT Subsidiary generally will be allowed to deduct dividends paid to its shareholders and, as a
result, the REIT Subsidiary will not be subject to U.S. federal income tax on that portion of its ordinary income and net capital gain that the REIT Subsidiary annually distributes to its shareholders, as long as the REIT Subsidiary meets the
minimum distribution requirements under the Code. The REIT Subsidiary intends to make distributions on a regular basis as necessary to avoid material U.S. federal income tax and to comply with the REIT distribution requirements.
Note 2. Investment Management Fees, Administration Fees and Other Transactions with Affiliates
Investment Management Fees: Cohen & Steers Capital Management, Inc. serves as the Fund’s investment manager
pursuant to an investment management agreement (the investment management agreement). Under the terms of the investment management agreement, the investment manager provides the Fund with day-to-day investment decisions and generally manages the Fund’s investments in accordance with the stated policies of the Fund, subject to the supervision of the Board of Directors.
For the services provided to the Fund, the investment manager receives a fee, accrued daily and paid monthly, at the annual rate of
0.65% of the average daily managed assets of the Fund. Managed assets are equal to the net assets plus the amount of any borrowings used for leverage outstanding.
Administration Fees: The Fund has entered into an administration agreement with the investment manager under which the
investment manager performs certain administrative functions for the Fund and receives a fee, accrued daily and paid monthly, at the annual rate of 0.06% of the average daily managed assets of the Fund. For the six months ended June 30, 2023,
the Fund incurred $420,859 in fees under this administration agreement. Additionally, the Fund pays State Street Bank and Trust Company as co-administrator under a fund accounting and administration agreement.
Directors’ and Officers’ Fees: Certain directors and officers of the Fund are also directors, officers
and/or employees of the investment manager. The Fund does not pay compensation to directors and officers affiliated with the investment manager except for the Chief Compliance Officer, who received compensation from the investment manager, which was
reimbursed by the Fund, in the amount of $4,941 for the six months ended June 30, 2023.
45
COHEN
& STEERS REIT AND
PREFERRED AND INCOME FUND, INC.
NOTES TO CONSOLIDATED FINANCIAL STATEMENTS (Unaudited)—(Continued)
Note 3. Purchases and Sales of Securities
Purchases and sales of securities, excluding short-term investments, for the six months ended June 30, 2023, totaled
$215,284,199 and $237,489,627, respectively.
Note 4. Investments in Non-Consolidated Limited
Liability Company
In accordance with requirements under Regulation S-X Rules 3-09 and 4-08(g), the Fund evaluates its unconsolidated subsidiaries as significant subsidiaries under the rules and, accordingly, below is summary financial information for
the Fund’s investments in non-consolidated limited liability companies at historical cost as of June 30, 2023. The Fund states its ownership interests in
non-consolidated limited liability companies at fair value.
|
|
|
|
|
| |
|
Legacy Gateway JV LLC(a) |
|
| Balance Sheet: |
|
|
|
|
| Assets: |
|
|
|
|
| Real estate, net (total cost) |
|
$ |
88,112,247 |
|
| Cash |
|
|
4,103,347 |
|
| Other current assets |
|
|
1,086,180 |
|
|
|
|
|
|
| Total Assets |
|
$ |
93,301,774 |
|
|
|
|
|
|
|
|
| Liabilities and Equity: |
|
|
|
|
| Mortgage notes payable |
|
$ |
52,000,000 |
|
| Accrued expenses and accounts payable |
|
|
1,301,079 |
|
| Tenant security deposits |
|
|
105,480 |
|
| Other liabilities |
|
|
533,512 |
|
|
|
|
|
|
| Total Liabilities |
|
|
53,940,071 |
|
|
|
|
|
|
|
|
| Equity |
|
|
39,361,703 |
|
|
|
|
|
|
|
|
| Total Liabilities and Equity |
|
$ |
93,301,774 |
|
|
|
|
|
|
|
|
| Income Statement |
|
|
|
|
| Revenue |
|
$ |
4,229,601 |
|
| Expenses |
|
|
3,634,573 |
|
|
|
|
|
|
| Net Income |
|
$ |
595,028 |
|
|
|
|
|
|
| (a) |
Represents summarized financial information of Legacy Gateway JV LLC, a Class A office
building located at 6860 N. Dallas Parkway, Plano, Texas 75024, which includes 100% of ownership interests in the limited liability company. |
46
COHEN
& STEERS REIT AND
PREFERRED AND INCOME FUND, INC.
NOTES TO CONSOLIDATED FINANCIAL STATEMENTS (Unaudited)—(Continued)
Note 5. Derivative Investments
The following tables present the value of derivatives held at June 30, 2023 and the effect of derivatives held during the six
months ended June 30, 2023, along with the respective location in the consolidated financial statements.
Consolidated Statement of
Assets and Liabilities
|
|
|
|
|
|
|
|
|
|
|
|
|
| |
|
Assets |
|
|
Liabilities |
|
| Derivatives |
|
Location |
|
Fair Value |
|
|
Location |
|
Fair Value |
|
| Credit Risk: |
|
|
|
|
|
|
|
|
|
|
|
|
| Total Return Swap Contracts— Over-the-Counter |
|
Total return swap contracts, at value |
|
$ |
72,664 |
|
|
— |
|
$ |
— |
|
| Equity Risk: |
|
|
|
|
|
|
|
|
|
|
|
|
| Purchased Option Contracts— Exchange-Traded(a) |
|
Investments in securities, at value |
|
|
301,350 |
|
|
— |
|
|
— |
|
| Written Option Contracts— Exchange-Traded(a) |
|
— |
|
|
— |
|
|
Written option contracts, at value |
|
|
525,019 |
|
| Foreign Currency
Exchange Risk: |
|
|
|
|
|
|
|
|
|
|
|
|
| Forward Foreign Currency Exchange Contracts(b) |
|
Unrealized appreciation |
|
|
25,462 |
|
|
Unrealized depreciation |
|
|
961,734 |
|
| Interest Rate Risk: |
|
|
|
|
|
|
|
|
|
|
|
|
| Interest Rate
Swap Contracts(a) |
|
— |
|
|
— |
|
|
Payable for variation margin on interest rate swap contracts |
|
|
35,772,884 |
(c) |
| (a) |
Not subject to a master netting agreement or another similar arrangement.
|
| (b) |
Forward foreign currency exchange contracts executed with Brown Brothers Harriman are not subject
to a master netting agreement or another similar arrangement. |
| (c) |
Amount represents the cumulative net appreciation on interest rate swap contracts as reported on
the Consolidated Schedule of Investments. The Consolidated Statement of Assets and Liabilities only reflects the current day variation margin payable to the broker. |
47
COHEN
& STEERS REIT AND
PREFERRED AND INCOME FUND, INC.
NOTES TO CONSOLIDATED FINANCIAL STATEMENTS (Unaudited)—(Continued)
Consolidated Statement of Operations
|
|
|
|
|
|
|
|
|
|
|
| Derivatives |
|
Location |
|
Realized
Gain (Loss) |
|
|
Change in
Unrealized
Appreciation
(Depreciation) |
|
| Credit Risk: |
|
|
|
|
|
|
|
|
|
|
| Total Return Swap
Contracts—
Over-the-Counter |
|
Net Realized and Unrealized Gain (Loss) |
|
$ |
(115,678 |
) |
|
$ |
72,664 |
|
| Equity Risk: |
|
|
|
|
|
|
|
|
|
|
| Purchased Option
Contracts(a) |
|
Net Realized and Unrealized Gain (Loss) |
|
|
(64,837 |
) |
|
|
233,202 |
|
| Written Option Contracts |
|
Net Realized and Unrealized Gain (Loss) |
|
|
258,533 |
|
|
|
(402,830 |
) |
Foreign Currency
Exchange Risk: |
|
|
|
|
|
|
|
|
|
|
| Forward Foreign Currency Exchange Contracts |
|
Net Realized and Unrealized Gain (Loss) |
|
|
(447,616 |
) |
|
|
(206,342 |
) |
| Interest Rate Risk: |
|
|
|
|
|
|
|
|
|
|
| Interest Rate Swap Contracts |
|
Net Realized and Unrealized Gain (Loss) |
|
|
6,640,766 |
|
|
|
(304,067 |
) |
| Purchased Option
Contracts(a) |
|
Net Realized and Unrealized Gain (Loss) |
|
|
(176,110 |
) |
|
|
— |
|
| (a) |
Purchased option contracts are included in net realized gain (loss) and change in unrealized
appreciation (depreciation) on investments in securities. |
At June 30, 2023, the Fund’s
derivative assets and liabilities (by type), which are subject to a master netting agreement, are as follows:
|
|
|
|
|
|
|
|
|
| Derivative Financial Instruments |
|
Assets |
|
|
Liabilities |
|
| Credit Risk: |
|
| Total Return Swap
Contracts—Over-the-Counter |
|
$ |
72,664 |
|
|
$ |
— |
|
48
COHEN
& STEERS REIT AND
PREFERRED AND INCOME FUND, INC.
NOTES TO CONSOLIDATED FINANCIAL STATEMENTS (Unaudited)—(Continued)
The following table presents the Fund’s derivative
assets and liabilities by counterparty net of amounts available for offset under a master netting agreement and net of the related collateral received and pledged by the Fund, if any, as of June 30, 2023:
|
|
|
|
|
|
|
|
|
|
|
|
|
|
|
|
|
|
Counterparty |
|
Gross Amount
of Liabilities
Presented
in the Consolidated
Statement
of Assets
and
Liabilities |
|
|
Financial
Instruments
and Derivatives
Available
for Offset |
|
|
Collateral
Pledged(a) |
|
|
Net Amount
of Derivative
Liabilities(b) |
|
| BNP Paribas |
|
$ |
72,664 |
|
|
$ |
— |
|
|
$ |
— |
|
|
$ |
72,664 |
|
| (a) |
Collateral received or pledged is limited to the net derivative asset or net derivative liability
amounts. Actual collateral amounts received or pledged may be higher than amounts above. |
| (b) |
Net amount represents the net receivable from the counterparty or net payable due to the
counterparty in the event of default. |
The following summarizes the volume of the Fund’s option
contracts, total return swap contracts, interest rate swap contracts and forward foreign currency exchange contracts activity for the six months ended June 30, 2023:
|
|
|
|
|
|
|
|
|
|
|
|
|
|
|
|
|
|
|
|
|
| |
|
Purchased
Option
Contracts(a) |
|
|
Written
Option
Contracts(a) |
|
|
Total
Return
Swap
Contracts(b) |
|
|
Interest Rate
Swap
Contracts |
|
|
Forward
Foreign
Currency
Exchange
Contracts |
|
| Average Notional Amount |
|
$ |
2,324,156 |
|
|
$ |
16,761,696 |
|
|
$ |
7,762,235 |
|
|
$ |
362,500,000 |
|
|
$ |
38,789,893 |
|
| (a) |
Notional amount is calculated using the number of contracts multiplied by notional contract size
multiplied by the underlying price. |
| (b) |
Average notional amounts represent the average for all months in which the Fund had total return
swap contracts outstanding. For total return swap contracts, this represents the period April 28, 2023 through June 30, 2023. |
49
COHEN
& STEERS REIT AND
PREFERRED AND INCOME FUND, INC.
NOTES TO CONSOLIDATED FINANCIAL STATEMENTS (Unaudited)—(Continued)
Note 6. Income Tax Information
As of June 30, 2023, the federal tax cost and net unrealized appreciation (depreciation) in value of investments held were as
follows:
|
|
|
|
|
| Cost of investments in securities for federal income tax purposes |
|
$ |
1,312,570,738 |
|
|
|
|
|
|
| Gross unrealized appreciation on investments |
|
$ |
207,319,046 |
|
| Gross unrealized depreciation on investments |
|
|
(96,352,083 |
) |
|
|
|
|
|
| Net unrealized appreciation (depreciation) on investments |
|
$ |
110,966,963 |
|
|
|
|
|
|
Note 7. Series A Cumulative Preferred Stock
On January 27, 2022, the Fund’s wholly-owned REIT Subsidiary completed a private placement of 125 shares of 12.0% Series
A Cumulative Non-Voting Preferred Stock (the Preferred Stock) for aggregate gross proceeds of $125,000. The Preferred Stock has a liquidation preference of $1,000 per share plus an amount equal to accrued but
unpaid dividends (the Liquidation Preference). The Preferred Stock dividends are cumulative at a rate of 12.0% per annum and are redeemable under certain conditions by the REIT Subsidiary or subject to mandatory redemption upon default of certain
coverage requirements at a redemption price equal to the Liquidation Preference.
Note 8. Capital Stock
The Fund is authorized to issue 100 million shares of common stock at a par value of $0.001 per share.
During the six months ended June 30, 2023, the Fund issued 27,351 shares of common stock at $588,850 for the reinvestment of
dividends. During the year ended December 31, 2022, the Fund issued 137,181 shares of common stock at $2,955,526 for the reinvestment of dividends.
On December 13, 2022, the Board of Directors approved the continuation of the delegation of its authority to management to
effect repurchases, pursuant to management’s discretion and subject to market conditions and investment considerations, of up to 10% of the Fund’s common shares outstanding (Share Repurchase Program) as of January 1, 2023, through
June 30, 2023.
During the six months ended June 30, 2023 and the year ended December 31, 2022, the Fund
did not effect any repurchases.
Note 9. Borrowings
The Fund has entered into an amended and restated credit agreement (the credit agreement) with BNP Paribas Prime Brokerage
International, Ltd. (BNPP) in which the Fund pays a monthly financing charge based on a combination of London Interbank Offered Rate (LIBOR)-based variable and fixed rates through June 30, 2022, a combination of Secured Overnight Financing Rate
(SOFR)-based
50
COHEN
& STEERS REIT AND
PREFERRED AND INCOME FUND, INC.
NOTES TO CONSOLIDATED FINANCIAL STATEMENTS (Unaudited)—(Continued)
variable and fixed rates effective July 1, 2022, and SOFR-based
variable rates effective December 28, 2022, pursuant to an amendment to the credit agreement. The commitment amount of the credit agreement is $450,000,000. The Fund may pay a fee of 0.45% per annum on any unused portion of the credit
agreement. BNPP may not change certain terms of the credit agreement except upon 360 days’ notice. Also, if the Fund violates certain conditions, the credit agreement may be terminated. The Fund is required to pledge portfolio securities and/or
cash as collateral in an amount up to two times the loan balance outstanding (or more depending on the terms of the credit agreement) and has granted a security interest in the securities pledged to, and in favor of, BNPP as security for the loan
balance outstanding. If the Fund fails to meet certain requirements, or maintain other financial covenants required under the credit agreement, the Fund may be required to repay immediately, in part or in full, the loan balance outstanding under the
credit agreement, necessitating the sale of portfolio securities at potentially inopportune times. The credit agreement also permits, subject to certain conditions, BNPP to rehypothecate portfolio securities pledged by the Fund up to the amount of
the loan balance outstanding and the Fund receives a portion of the fees earned by BNPP in connection with the rehypothecation of portfolio securities. The Fund continues to receive dividends and interest on rehypothecated securities. The Fund also
has the right under the credit agreement to recall the rehypothecated securities from BNPP on demand. If BNPP fails to deliver the recalled security in a timely manner, the Fund will be compensated by BNPP for any fees or losses related to the
failed delivery or, in the event a recalled security will not be returned by BNPP, the Fund, upon notice to BNPP, may reduce the loan balance outstanding by the amount of the recalled security failed to be returned.
As of June 30, 2023, the Fund had outstanding borrowings of $450,000,000 at a rate of 6.0%. The carrying value of the
borrowings approximates fair value. The borrowings are classified as Level 2 within the fair value hierarchy. During the six months ended June 30, 2023, the Fund borrowed an average daily balance of $450,000,000 at a weighted average
borrowing cost of 5.7%.
Note 10. Other Risks
Market Price Discount from Net Asset Value Risk: Shares of closed-end investment
companies frequently trade at a discount from their NAV. This characteristic is a risk separate and distinct from the risk that NAV could decrease as a result of investment activities. Whether investors will realize gains or losses upon the sale of
the shares will depend not upon the Fund’s NAV but entirely upon whether the market price of the shares at the time of sale is above or below the investor’s purchase price for the shares. Because the market price of the shares is
determined by factors such as relative supply of and demand for shares in the market, general market and economic conditions, and other factors beyond the control of the Fund, the shares may trade at, above or below NAV.
Common Stock Risk: While common stocks have historically generated higher average returns than fixed-income securities over
the long-term, common stocks have also experienced significantly more volatility in those returns, although under certain market conditions, fixed-income investments may have comparable or greater price volatility. The value of common stocks and
other equity securities will fluctuate in response to developments concerning the company, political and regulatory circumstances, the stock market, and the economy. In the short term, stock prices can fluctuate dramatically in response to these
developments. Different parts of the market and different types of equity securities
51
COHEN
& STEERS REIT AND
PREFERRED AND INCOME FUND, INC.
NOTES TO CONSOLIDATED FINANCIAL STATEMENTS (Unaudited)—(Continued)
can react differently to these developments. For example, stocks of large
companies can react differently than stocks of smaller companies, and value stocks (stocks of companies that are undervalued by various measures and have potential for long-term capital appreciation), can react differently from growth stocks (stocks
of companies with attractive cash flow returns on invested capital and earnings that are expected to grow). These developments can affect a single company, all companies within the same industry, economic sector or geographic region, or the stock
market as a whole.
Real Estate Market Risk: Since the Fund concentrates its assets companies in the real estate
industry, an investment in the Fund will be closely linked to the performance of the real estate markets. Risks of investing in real estate securities include falling property values due to increasing vacancies, declining rents resulting from
economic, legal, tax, political or technological developments, lack of liquidity, limited diversification, and sensitivity to certain economic factors such as interest-rate changes and market recessions. Real estate company prices also may drop
because of the failure of borrowers to pay their loans and poor management, and residential developers, in particular, could be negatively impacted by falling home prices, slower mortgage origination and rising construction costs. The risks of
investing in REITs are similar to those associated with direct investments in real estate securities.
REIT Risk:
In addition to the risks of securities linked to the real estate industry, REITs are subject to certain other risks related to their structure and focus. REITs are dependent upon management skills and generally may not be diversified. REITs are
also subject to heavy cash flow dependency, defaults by borrowers and self-liquidation. In addition, REITs could possibly fail to (i) qualify for favorable tax treatment under applicable tax law, or (ii) maintain their exemptions from
registration under the 1940 Act. The above factors may also adversely affect a borrower’s or a lessee’s ability to meet its obligations to the REIT. In the event of a default by a borrower or lessee, the REIT may experience delays in
enforcing its rights as a mortgagee or lessor and may incur substantial costs associated with protecting its investments.
Small-and Medium-Sized Companies Risk: Real estate companies in the industry tend to be small-to medium-sized companies in relation to the equity markets as a whole. There may be less trading in a smaller company’s stock, which means that buy and sell transactions in that stock could have a larger impact
on the stock’s price than is the case with larger company stocks. Smaller companies also may have fewer lines of business so that changes in any one line of business may have a greater impact on a smaller company’s stock price than is the
case for a larger company. Further, smaller company stocks may perform differently in different cycles than larger company stocks. Accordingly, real estate company shares can, and at times will, perform differently than large company stocks.
Preferred Securities Risk: Preferred securities are subject to credit risk, which is the risk that a security
will decline in price, or the issuer of the security will fail to make dividend, interest or principal payments when due, because the issuer experiences a decline in its financial status. Preferred securities are also subject to interest rate risk
and may decline in value because of changes in market interest rates. The Fund may be subject to a greater risk of rising interest rates than would normally be the case in an environment of low interest rates and the effect of potential government
fiscal policy initiatives and resulting market reaction to those initiatives. In addition, an issuer may be permitted to
52
COHEN
& STEERS REIT AND
PREFERRED AND INCOME FUND, INC.
NOTES TO CONSOLIDATED FINANCIAL STATEMENTS (Unaudited)—(Continued)
defer or omit distributions. Preferred securities are also generally
subordinated to bonds and other debt instruments in a company’s capital structure. During periods of declining interest rates, an issuer may be able to exercise an option to redeem (call) its issue at par earlier than scheduled, and the Fund
may be forced to reinvest in lower yielding securities. Certain preferred securities may be substantially less liquid than many other securities, such as common stocks. Generally, preferred security holders have no voting rights with respect to the
issuing company unless certain events occur. Certain preferred securities may give the issuers special redemption rights allowing the securities to be redeemed prior to a specified date if certain events occur, such as changes to tax or securities
laws.
Contingent Capital Securities Risk: Contingent capital securities (sometimes referred to as
“CoCos”) are debt or preferred securities with loss absorption characteristics built into the terms of the security, for example, a mandatory conversion into common stock of the issuer under certain circumstances, such as the issuer’s
capital ratio falling below a certain level. Since the common stock of the issuer may not pay a dividend, investors in these instruments could experience a reduced income rate, potentially to zero, and conversion would deepen the subordination of
the investor, hence worsening the investor’s standing in a bankruptcy. Some CoCos provide for a reduction in the value or principal amount of the security (potentially to zero) under such circumstances. In March 2023, a Swiss regulator required
a write-down of outstanding CoCos to zero notwithstanding the fact that the equity shares continued to exist and have economic value. It is currently unclear whether regulators of issuers in other jurisdictions will take similar actions.
Notwithstanding these risks, the Fund intends to continue to invest in CoCos issued by Swiss companies and by companies in other jurisdictions. In addition, most CoCos are considered to be high yield or “junk” securities and are therefore
subject to the risks of investing in below investment-grade securities. Finally, CoCo issuers can, at their discretion, suspend dividend distributions on their CoCo securities and are more likely to do so in response to negative economic conditions
and/or government regulation. Omitted distributions are typically non-cumulative and will not be paid on a future date. Any omitted distribution may negatively impact the returns or distribution rate of the
Fund.
Credit and Below-Investment-Grade Securities Risk: Preferred securities may be rated below investment
grade or may be unrated. Below-investment-grade securities, or equivalent unrated securities, which are commonly known as “high-yield bonds” or “junk bonds,” generally involve greater volatility of price and risk of loss of
income and principal, and may be more susceptible to real or perceived adverse economic and competitive industry conditions than higher grade securities. It is reasonable to expect that any adverse economic conditions could disrupt the market for
lower-rated securities, have an adverse impact on the value of those securities and adversely affect the ability of the issuers of those securities to repay principal and interest on those securities.
Leverage Risk: The use of leverage is a speculative technique and there are special risks and costs associated with
leverage. The NAV of the Fund’s shares may be reduced by the issuance and ongoing costs of leverage. So long as the Fund is able to invest in securities that produce an investment yield that is greater than the total cost of leverage, the
leverage strategy will produce higher current net investment income for the shareholders. On the other hand, to the extent that the total cost of leverage exceeds the incremental income gained from employing such leverage, shareholders would realize
lower net investment income. In addition to the impact on net income, the use of leverage will have an
53
COHEN
& STEERS REIT AND
PREFERRED AND INCOME FUND, INC.
NOTES TO CONSOLIDATED FINANCIAL STATEMENTS (Unaudited)—(Continued)
effect of magnifying capital appreciation or depreciation for shareholders.
Specifically, in an up market, leverage will typically generate greater capital appreciation than if the Fund were not employing leverage. Conversely, in down markets, the use of leverage will generally result in greater capital depreciation than if
the Fund had been unlevered. To the extent that the Fund is required or elects to reduce its leverage, the Fund may incur applicable breakage fees under the Fund’s credit arrangement and may need to liquidate investments, including under
adverse economic conditions which may result in capital losses potentially reducing returns to shareholders. The use of leverage also results in the investment management fees payable to the investment manager being higher than if the Fund did not
use leverage and can increase operating costs, which may reduce total return. There can be no assurance that a leveraging strategy will be successful during any period in which it is employed.
Liquidity Risk: Liquidity risk is the risk that particular investments of the Fund may become difficult to sell or purchase.
The market for certain investments may become less liquid or illiquid due to adverse changes in the conditions of a particular issuer or due to adverse market or economic conditions. In addition, dealer inventories of certain securities, which
provide an indication of the ability of dealers to engage in “market making,” are at, or near, historic lows in relation to market size, which has the potential to increase price volatility in the fixed income markets in which the Fund
invests. Federal banking regulations may also cause certain dealers to reduce their inventories of certain securities, which may further decrease the Fund’s ability to buy or sell such securities. As a result of this decreased liquidity, the
Fund may have to accept a lower price to sell a security, sell other securities to raise cash, or give up an investment opportunity, any of which could have a negative effect on performance. Further, transactions in less liquid or illiquid
securities may entail transaction costs that are higher than those for transactions in liquid securities.
Foreign (Non-U.S.) Securities Risk: The Fund directly purchases securities of foreign issuers. Risks of investing in foreign securities include currency risks, future political and economic developments and possible
imposition of foreign withholding taxes on income or proceeds payable on the securities. In addition, there may be less publicly available information about a foreign issuer than about a domestic issuer, and foreign issuers may not be subject to the
same accounting, auditing and financial recordkeeping standards and requirements as domestic issuers. Moreover, securities of many foreign issuers and their markets may be less liquid and their prices more volatile than securities of comparable U.S.
issuers.
Investing in securities of companies in emerging markets may entail special risks relating to potential
economic, political or social instability and the risks of expropriation, nationalization, confiscation, trade sanctions or embargoes or the imposition of restrictions on foreign investment, the lack of hedging instruments, and repatriation of
capital invested. The securities and real estate markets of some emerging market countries have in the past experienced substantial market disruptions and may do so in the future.
Foreign Currency Risk: Although the Fund will report its NAV and pay dividends in U.S. dollars, foreign securities often are
purchased with and make any dividend and interest payments in foreign currencies. Therefore, the Fund’s investments in foreign securities will be subject to foreign currency risk, which means that the Fund’s NAV could decline solely as a
result of changes in the exchange rates between foreign currencies and the U.S. dollar. Certain foreign countries may impose restrictions on the
54
COHEN
& STEERS REIT AND
PREFERRED AND INCOME FUND, INC.
NOTES TO CONSOLIDATED FINANCIAL STATEMENTS (Unaudited)—(Continued)
ability of issuers of foreign securities to make payment of principal,
dividends and interest to investors located outside the country, due to blockage of foreign currency exchanges or otherwise. The Fund may, but is not required to, engage in various investments that are designed to hedge the Fund’s foreign
currency risks, and such investments are subject to the risks described under “Derivatives and Hedging Transactions Risk” below.
Derivatives and Hedging Transactions Risk: The Fund’s use of derivatives, including for the purpose of hedging interest rate or foreign currency risks, presents risks different from, and possibly greater than, the risks
associated with investing directly in traditional securities. Among the risks presented are counterparty risk, financial leverage risk, liquidity risk, OTC trading risk and tracking risk. The use of derivatives can lead to losses because of adverse
movements in the price or value of the underlying asset, index or rate, which may be magnified by certain features of the derivatives.
Options Risk: Gains on options transactions depend on the investment manager’s ability to predict correctly the direction of stock prices, indexes, interest rates, and other economic factors, and unanticipated changes
may cause poorer overall performance for the Fund than if it had not engaged in such transactions. A rise in the value of the security or index underlying a call option written by the Fund exposes the Fund to possible loss or loss of opportunity to
realize appreciation in the value of any portfolio securities underlying or otherwise related to the call option. By writing a put option, the Fund assumes the risk of a decline in the underlying security or index. There can be no assurance that a
liquid market will exist when the Fund seeks to close out an option position, and for certain options not traded on an exchange no market usually exists. Trading could be interrupted, for example, because of supply and demand imbalances arising from
a lack of either buyers or sellers, or an options exchange could suspend trading after the price has risen or fallen more than the maximum specified by the exchange.
Although the Fund may be able to offset to some extent any adverse effects of being unable to liquidate an option position, that
Fund may experience losses in some cases as a result of such inability, may not be able to close its position and, in such an event would be unable to control its losses.
Private Real Estate Risk: The Fund’s investments in private real estate include additional risks. For example, lease
defaults, terminations by one or more tenants or landlord-tenant disputes may reduce the Fund’s revenues and net income. Any of these situations may result in extended periods during which there is a significant decline in revenues or no
revenues generated by a property. If this occurred, it could adversely affect the Fund’s results of operations.
The Fund’s investments in private real estate are expected to be substantially less liquid than many other securities, such as
common stocks or U.S. government securities.
REIT Subsidiary Risk: Investments in a REIT Subsidiary are subject
to risks associated with the direct ownership of real estate. A REIT Subsidiary, and therefore the Fund, may be affected by changes in the real estate markets generally as well as changes in the values of any properties owned by a REIT Subsidiary or
securing any mortgages owned by a REIT Subsidiary (which changes in value could be influenced by market conditions for real estate in general or issues related to the particular property). If a REIT Subsidiary’s underlying assets are
concentrated in properties used by a particular industry, it will be subject to risks associated with such industry.
55
COHEN
& STEERS REIT AND
PREFERRED AND INCOME FUND, INC.
NOTES TO CONSOLIDATED FINANCIAL STATEMENTS (Unaudited)—(Continued)
By investing through a REIT Subsidiary, the Fund bears the
fees and expenses of the REIT Subsidiary (including, among other things operating costs, transaction expenses, administrative and custody fees, legal expenses and custody expenses). Thus, investing through a REIT Subsidiary may cause the Fund to be
subject to higher operating expenses than if it invested directly.
Real Estate Limited Liability Company Risk:
The Fund through a REIT subsidiary may invest in real estate limited liability companies with third parties. The Fund may also make investments in partnerships or other co-ownership arrangements or
participations. Such investments may involve risks not otherwise present with other methods of investment, which include risks associated with having a limited liability company partner, such as the real estate limited liability company partner
becoming insolvent or bankrupt, engaging in fraud or other misconduct or having economic or business interests or goals that conflict with the Fund’s business interest or goals. Also, the terms of the limited liability company agreement could
restrict the Fund’s ability to sell or transfer its interest to a third party or could cause the Fund to sell its interest or acquire its partner’s interest at a time when the Fund otherwise would not have initiated such a transaction.
In addition, disputes between the Fund and its real estate limited liability company partners may result in litigation
or arbitration that would increase the Fund’s expenses and prevent the Fund’s officers and trustees from focusing their time and efforts on the Fund’s business. Any of the above might subject the Fund to liabilities and thus reduce
its returns on the investment with that real estate limited liability company partner.
Geopolitical Risk:
Occurrence of global events similar to those in recent years, such as war (including Russia’s military invasion of Ukraine), terrorist attacks, natural or environmental disasters, country instability, infectious disease epidemics or
pandemics, such as that caused by COVID-19, market instability, debt crises and downgrades, embargoes, tariffs, sanctions and other trade barriers and other governmental trade or market control programs, the
potential exit of a country from its respective union and related geopolitical events, may result in market volatility and may have long-lasting impacts on U.S. and global economies and financial markets. Supply chain disruptions or significant
changes in the supply or prices of commodities or other economic inputs may have material and unexpected effects on both global securities markets and individual countries, regions, sectors, companies or industries. Events occurring in one region of
the world may negatively impact industries and regions that are not otherwise directly impacted by the events. Additionally, those events, as well as other changes in foreign and domestic political and economic conditions, could adversely affect
individual issuers or related groups of issuers, securities markets, interest rates, secondary trading, credit ratings, inflation, investor sentiment and other factors affecting the value of the Fund’s investments.
Although the long-term economic fallout of COVID-19 is difficult to predict, it has
contributed to, and may continue to contribute to, market volatility, inflation and systemic economic weakness. COVID-19 and efforts to contain its spread may also exacerbate other pre-existing political, social, economic, market and financial risks. In addition, the U.S. government and other central banks across Europe, Asia, and elsewhere announced and/or adopted economic relief packages in
response to COVID-19. The end of any such program could cause market downturns, disruptions and volatility, particularly if markets view the ending as premature. The U.S. federal government ended the COVID-19
56
COHEN
& STEERS REIT AND
PREFERRED AND INCOME FUND, INC.
NOTES TO CONSOLIDATED FINANCIAL STATEMENTS (Unaudited)—(Continued)
public health emergency declaration on May 11, 2023; however, the
effects of the COVID-19 pandemic are expected to continue and the risk that new variants of COVID-19 may emerge remains. Therefore the economic outlook, particularly for
certain industries and businesses, remains inherently uncertain.
On January 31, 2020, the United Kingdom (UK)
withdrew from the European Union (EU) (referred to as Brexit), commencing a transition period that ended on December 31, 2020. The EU-UK Trade and Cooperation Agreement, a bilateral trade and cooperation
deal governing the future relationship between the UK and the EU (TCA), provisionally went into effect on January 1, 2021, and entered into force officially on May 1, 2021, but critical aspects of the relationship remain unresolved and
subject to further negotiation and agreement. Brexit has resulted in volatility in European and global markets and could have negative long-term impacts on financial markets in the UK and throughout Europe. There is still considerable uncertainty
relating to the potential consequences of the exit, how the negotiations for new trade agreements will be conducted, and whether the UK’s exit will increase the likelihood of other countries also departing the EU. During this period of
uncertainty, the negative impact on the UK, European and broader global economies, could be significant, potentially resulting in increased market volatility and illiquidity, political, economic, and legal uncertainty, and lower economic growth for
companies that rely significantly on Europe for their business activities and revenues.
On February 24, 2022,
Russia launched a large-scale invasion of Ukraine significantly amplifying already existing geopolitical tensions. The United States and many other countries have instituted various economic sanctions against Russia, Russian individuals and entities
and Belarus. The extent and duration of the military action, sanctions imposed and other punitive actions taken (including any Russian retaliatory responses to such sanctions and actions), and resulting disruptions in Europe and globally cannot be
predicted, but could be significant and have a severe adverse effect on the global economy, securities markets and commodities markets globally, including through global supply chain disruptions, increased inflationary pressures and reduced economic
activity. To the extent the Fund has exposure to the energy sector, the Fund may be especially susceptible to these risks. Furthermore, in March 2023, the shut-down of certain financial institutions raised economic concerns over disruption in the
U.S. banking system. There can be no certainty that the actions taken by the U.S. government to strengthen public confidence in the U.S. banking system will be effective in mitigating the effects of financial institution failures on the economy and
restoring public confidence in the U.S. banking system. These disruptions may also make it difficult to value the Fund’s portfolio investments and cause certain of the Fund’s investments to become illiquid. The strengthening or weakening
of the U.S. dollar relative to other currencies may, among other things, adversely affect the Fund’s investments denominated in non-U.S. dollar currencies. It is difficult to predict when similar events
affecting the U.S. or global financial markets may occur, the effects that such events may have, and the duration of those effects.
Regulatory Risk: The U.S. government has proposed and adopted multiple regulations that could have a long-lasting impact on the Fund and on the mutual fund industry in general. The SEC’s final rules, related requirements
and amendments to modernize reporting and disclosure, along with other potential upcoming regulations, could, among other things, restrict the Fund’s ability to engage in transactions, and/or increase overall expenses of the Fund. In addition
to Rule 18f-4, which governs the way derivatives are used by registered investment companies, the SEC, Congress, various exchanges and regulatory and self-regulatory authorities, both domestic and foreign,
have undertaken reviews of the
57
COHEN
& STEERS REIT AND
PREFERRED AND INCOME FUND, INC.
NOTES TO CONSOLIDATED FINANCIAL STATEMENTS (Unaudited)—(Continued)
use of derivatives by registered investment companies, which could affect
the nature and extent of instruments used by the Fund. While the full extent of all of these regulations is still unclear, these regulations and actions may adversely affect both the Fund and the instruments in which the Fund invests and its ability
to execute its investment strategy. For example, climate change regulation (such as decarbonization legislation, other mandatory controls to reduce emissions of greenhouse gases, or related disclosure requirements) could significantly affect the
Fund or its investments by, among other things, increasing compliance costs or underlying companies’ operating costs and capital expenditures. Similarly, regulatory developments in other countries may have an unpredictable and adverse impact on
the Fund.
LIBOR Risk: Many financial instruments are tied to the London Interbank Offered Rate, or
“LIBOR,” to determine payment obligations, financing terms, hedging strategies, or investment value. LIBOR is the offered rate for short-term Eurodollar deposits between major international banks. The Head of the UK Financial Conduct
Authority the (FCA) and LIBOR’s administrator, ICE Benchmark Administration (IBA) ceased publication of most LIBOR settings at the end of 2021 and the IBA ceased publication of a majority of U.S. dollar LIBOR settings after June 30, 2023.
In addition, global regulators have announced that, with limited exceptions, no new LIBOR-based contracts should be entered into after 2021. Actions by regulators have resulted in the establishment of alternative reference rates to LIBOR in most
major currencies (e.g., the Secured Overnight Financing Rate (SOFR) for U.S. dollar LIBOR and the Sterling Overnight Index Average Rate for GBP LIBOR). Other countries are introducing their own local-currency-denominated alternative reference rates
for short-term lending and global consensus on alternative rates is lacking.
In March 2022, the U.S. federal government
enacted the Adjustable Interest Rate (LIBOR) Act (the LIBOR Act) to establish a process for replacing LIBOR in certain existing contracts that do not already provide for the use of a clearly defined and practicable replacement benchmark rate as
described in the LIBOR Act. Generally, for contracts that do not contain clear and practicable fallback provisions as described in the LIBOR Act, a benchmark replacement recommended by the Federal Reserve Board will effectively replace the U.S.
dollar LIBOR benchmark after June 30, 2023. The recommended benchmark replacement will be based on SOFR, which is published by the Federal Reserve Bank of New York, and will include certain spread adjustments and benchmark replacement
conforming changes. On December 16, 2022, the Federal Reserve Board adopted a final rule that implements the LIBOR Act. The final rule restates safe harbor protections contained in the LIBOR Act for selection or use of the replacement benchmark
rate selected by the Federal Reserve Board. Consistent with the LIBOR Act, the final rule is also intended to ensure that LIBOR contracts adopting a benchmark rate selected by the Federal Reserve Board will not be interrupted or terminated following
LIBOR’s replacement.
The transition away from LIBOR may lead to increased volatility and illiquidity in markets
that are tied to LIBOR, reduced values of, inaccurate valuations of, and miscalculations of payment amounts for LIBOR-related investments or investments in issuers that utilize LIBOR, increased difficulty in borrowing or refinancing and reduced
effectiveness of hedging strategies, adversely affecting the Fund’s performance or NAV. In addition, any alternative reference rate may be a less effective substitute
58
COHEN
& STEERS REIT AND
PREFERRED AND INCOME FUND, INC.
NOTES TO CONSOLIDATED FINANCIAL STATEMENTS (Unaudited)—(Continued)
resulting in prolonged adverse market conditions for the Fund.
Note 11. Other
In the normal course of business, the Fund enters into contracts that provide general indemnifications. The Fund’s maximum
exposure under these arrangements is dependent on claims that may be made against the Fund in the future and, therefore, cannot be estimated; however, based on experience, the risk of material loss from such claims is considered remote.
Note 12. New Accounting Pronouncement
In January 2021, the Financial Accounting Standards Board (“FASB”) issued Accounting Standards Update No. 2021-01 (“ASU
2021-01”), “Reference Rate Reform (Topic 848)”. Additionally, in December 2022, the Financial Accounting Standards Board (“FASB”) issued Accounting Standards Update No. 2022-06 (“ASU 2022-06”), “Reference Rate Reform (Topic 848)”. ASU 2022-06 and ASU 2021-01 are updates to ASU 2020-04, which is in response to concerns about structural risks of interbank offered rates, and particularly the risk of cessation of
LIBOR, and the reference rate reform that regulators have undertaken to identify alternative reference rates that are more observable or transaction based and less susceptible to manipulation. ASU 2020-04
provides optional guidance for a limited period of time to ease the potential burden in accounting for (or recognizing the effects of) reference rate reform on financial reporting. ASU 2020-04 is elective and
applies to all entities, subject to meeting certain criteria, that have contracts, hedging relationships, and other transactions that reference LIBOR or another reference rate expected to be discontinued because of reference rate reform. The ASU 2021-01 update clarifies that certain optional expedients and exceptions in Topic 848 for contract modifications and hedge accounting apply to derivatives that are affected by the discounting transition. The ASU 2022-06 update extends the period of time preparers can use the reference rate reform relief guidance by two years. ASU 2022-06 defers the sunset date of Topic 848 from
December 31, 2022 to December 31, 2024, after which entities will no longer be permitted to apply the relief in Topic 848. The amendments in these updates are effective immediately through December 31, 2024, for all entities.
Management does not expect ASU 2021-01 or ASU 2022-06 to have a material impact on the financial statements.
Note 13. Subsequent Events
Management has evaluated events and transactions occurring after June 30, 2023 through the date that the consolidated financial statements were issued, and has determined that no additional disclosure in the consolidated
financial statements is required.
59
COHEN
& STEERS REIT AND
PREFERRED AND INCOME FUND, INC.
PROXY RESULTS (Unaudited)
Cohen & Steers REIT and Preferred and Income Fund, Inc. shareholders voted on the following proposals at the annual meeting
held on April 26, 2023. The description of each proposal and number of shares voted are as follows:
|
|
|
|
|
|
|
|
|
| Common Shares |
|
Shares Voted
for |
|
|
Authority
Withheld |
|
| To elect Directors: |
|
|
|
|
|
|
|
|
|
|
|
| Michael G. Clark |
|
|
35,755,447 |
|
|
|
1,429,966 |
|
| Dean A. Junkans |
|
|
35,849,680 |
|
|
|
1,335,734 |
|
| Ramona Rogers- Windsor |
|
|
35,864,081 |
|
|
|
1,321,333 |
|
60
COHEN
& STEERS REIT AND
PREFERRED AND INCOME FUND, INC.
(The following pages are unaudited)
REINVESTMENT PLAN
We urge shareholders who want to take advantage of this plan and whose shares are held in ‘Street Name’ to consult your broker as soon as possible to determine if you must change registration into your own name to
participate.
OTHER INFORMATION
A description of the policies and procedures that the Fund uses to determine how to vote proxies relating to portfolio securities
is available (i) without charge, upon request, by calling 866-227-0757, (ii) on our website at cohenandsteers.com or (iii) on the U.S. Securities and Exchange Commission’s (SEC) website at http://www.sec.gov. In addition, the
Fund’s proxy voting record for the most recent 12-month period ended June 30 is available by August 31 of each year (i) without charge, upon request, by calling 866-227-0757 or (ii) on
the SEC’s website at http://www.sec.gov.
Disclosures of the Fund’s complete holdings are required to be made
monthly on Form N-PORT, with every third month made available to the public by the SEC 60 days after the end of the Fund’s fiscal quarter. The Fund’s Form N-PORT is available (i) without charge, upon request, by calling 866-227-0757
or (ii) on the SEC’s website at http://www.sec.gov.
Please note that distributions paid by the Fund to
shareholders are subject to recharacterization for tax purposes and are taxable up to the amount of the Fund’s investment company taxable income and net realized gains. Distributions in excess of the Fund’s investment company taxable
income and net realized gains are a return of capital distributed from the Fund’s assets. To the extent this occurs, the Fund’s shareholders of record will be notified of the estimated amount of capital returned to shareholders for each
such distribution and this information will also be available at cohenandsteers.com. The final tax treatment of all distributions is reported to shareholders on their 1099-DIV forms, which are mailed after the close of each calendar year.
Distributions of capital decrease the Fund’s total assets and, therefore, could have the effect of increasing the Fund’s expense ratio. In addition, in order to make these distributions, the Fund may have to sell portfolio securities at a
less than opportune time.
Notice is hereby given in accordance with Rule 23c-1
under the 1940 Act that the Fund may purchase, from time to time, shares of its common stock in the open market.
APPROVAL OF INVESTMENT MANAGEMENT AGREEMENT
The Board of Directors of the Fund, including a majority of the directors who are not parties to the Fund’s investment
management agreement (the Management Agreement), or interested persons of any such party (the Independent Directors), has the responsibility under the Investment Company Act of 1940 to approve the Fund’s Management Agreement for its initial two
year term and its continuation annually thereafter at a meeting of the Board of Directors called for the purpose of voting on the approval or continuation. The Management Agreement was discussed at a meeting of the Independent Directors, in their
capacity as the Contract Review Committee, held on June 6, 2023 and at meetings of the full Board of Directors held on March 14, 2023 and June 13, 2023. The Independent Directors, in their capacity as the Contract Review Committee,
also discussed the Management Agreement in
61
COHEN
& STEERS REIT AND
PREFERRED AND INCOME FUND, INC.
executive session on June 13, 2023. At the meeting of the full Board of Directors on June 13, 2023, the Management Agreement was
unanimously continued for a term ending June 30, 2024 by the Fund’s Board of Directors, including the Independent Directors. The Independent Directors were represented by independent counsel who assisted them in their deliberations during
the meetings and executive session.
In considering whether to continue the Management Agreement, the Board of Directors
reviewed materials provided by an independent data provider, which included, among other items, fee, expense and performance information compared to peer funds (the Peer Funds and, collectively with the Fund, the Peer Group) and performance
comparisons to a larger category universe; summary information prepared by the Fund’s investment manager (the Investment Manager); and a memorandum from counsel to the Independent Directors outlining the legal duties of the Board of Directors.
The Board of Directors also spoke directly with representatives of the independent data provider and met with investment management personnel. In addition, the Board of Directors considered information provided from time to time by the Investment
Manager throughout the year at meetings of the Board of Directors, including presentations by portfolio managers relating to the investment performance of the Fund and the investment strategies used in pursuing the Fund’s objective. The Board
of Directors also considered information provided by the Investment Advisor in response to a request for information submitted by counsel to the Independent Directors, on behalf of the Independent Directors, as well as information provided by the
Investment Advisor in response to a supplemental request. In particular, the Board of Directors considered the following:
(i) The nature, extent and quality of services to be provided by the Investment Manager: The Board of Directors reviewed the services that the Investment Manager provides to the Fund, including, but not limited to, making the
day-to-day investment decisions for the Fund, placing orders for the investment and reinvestment of the Fund’s assets, furnishing information to the Board of
Directors of the Fund regarding the Fund’s portfolio, providing individuals to serve as Fund officers, managing the Fund’s debt leverage level, and generally managing the Fund’s investments in accordance with the stated policies of
the Fund. The Board of Directors also discussed with officers and portfolio managers of the Fund the types of transactions conducted on behalf of the Fund. Additionally, the Board of Directors took into account the services provided by the
Investment Manager to its other funds and accounts, including those that have investment objectives and strategies similar to those of the Fund. The Board of Directors also considered the education, background and experience of the Investment
Manager’s personnel, particularly noting the potential benefit that the portfolio managers’ work experience and favorable reputation can have on the Fund. The Board of Directors further noted the Investment Manager’s ability to
attract qualified and experienced personnel. The Board of Directors also considered the administrative services provided by the Investment Manager, including compliance and accounting services. After consideration of the above factors, among others,
the Board of Directors concluded that the nature, extent and quality of services provided by the Investment Manager are satisfactory and appropriate.
(ii) Investment performance of the Fund and the Investment Manager: The Board of Directors considered the investment
performance of the Fund compared to Peer Funds and compared to a relevant linked blended benchmark. The Board of Directors noted that the Fund’s dual focus on REITs and preferred securities is uncommon and as a result, the Peer Funds generally
consisted of real-estate only or preferred-only funds, making it difficult to make quantitative comparisons of the Fund’s
62
COHEN
& STEERS REIT AND
PREFERRED AND INCOME FUND, INC.
performance with that of the Peer Funds. The Board of Directors noted that the Fund outperformed the Peer Group medians for the three-, five- and ten-year periods and underperformed for the one-year period ended March 31, 2023, ranking the Fund four out of eight peers, three out of eight peers, two out of eight
peers and six out of eight peers for each period, respectively. The Board of Directors noted that the Fund outperformed the relevant linked blended benchmark for the three-, five- and ten-year periods and
underperformed for the one-year period ended March 31, 2023. The Board of Directors engaged in discussions with the Investment Manager regarding the contributors to and detractors from the Fund’s
performance during the period, as well as the impact of leverage on the Fund’s performance. The Board of Directors also considered supplemental information provided by the Investment Manager, including a narrative summary of various factors
affecting performance and the Investment Manager’s performance in managing similarly managed funds and accounts. The Board of Directors determined that Fund performance, in light of all the considerations noted above, supported the continuation
of the Management Agreement.
(iii) Cost of the services to be provided and profits to be realized by the Investment
Manager from the relationship with the Fund: The Board of Directors considered the contractual and actual management fees paid by the Fund as well as the Fund’s total expense ratios. As part of its analysis, the Board of Directors gave
consideration to the fee and expense analyses provided by the independent data provider. The Board of Directors considered that the Fund’s actual management fees at managed and common asset levels are lower than the Peer Group medians, ranking
two out of eight peers for each. The Board of Directors noted that the Fund’s total expense ratios including investment-related expenses at common and managed asset levels were higher than the Peer Group median, ranking five out of eight peers
and six out of eight peers, respectively. The Board of Directors also noted that the Fund’s total expense ratios excluding investment-related expenses at managed and common asset levels were lower than the Peer Group medians, ranking two out of
eight peers for each period. The Board of Directors considered the impact of leverage levels on the Fund’s fees and expenses at managed and common asset levels. In light of the considerations above, the Board of Directors concluded that the
Fund’s current expense structure was satisfactory.
The Board of Directors also reviewed information regarding the
profitability to the Investment Manager of its relationship with the Fund. The Board of Directors considered the level of the Investment Manager’s profits and whether the profits were reasonable for the Investment Manager. The Board of
Directors took into consideration other benefits to be derived by the Investment Manager in connection with the Management Agreement, noting particularly the research and related services, within the meaning of Section 28(e) of the Securities
Exchange Act of 1934, that the Investment Manager receives by allocating the Fund’s brokerage transactions. The Board of Directors further considered that the Investment Manager continues to reinvest profits back in the business, including
upgrading and/or implementing new trading, compliance and accounting systems, and by adding investment personnel to the portfolio management teams. The Board of Directors also considered the administrative services provided by the Investment Manager
and the associated administration fee paid to the Investment Manager for such services under the Administration Agreement. The Board of Directors determined that the services received under the Administration Agreement are beneficial to the Fund.
The Board of Directors concluded that the profits realized by the Investment Manager from its relationship with the Fund were reasonable and consistent with the Investment Manager’s fiduciary duties.
63
COHEN
& STEERS REIT AND
PREFERRED AND INCOME FUND, INC.
(iv) The extent to which economies of scale would be realized as the Fund grows and whether fee levels would reflect such
economies of scale: The Board of Directors noted that, as a closed-end fund, the Fund would not be expected to have inflows of capital that might produce increasing economies of scale. The Board of
Directors determined that, given the Fund’s closed-end structure, there were no significant economies of scale that were not already being shared with shareholders. In considering economies of scale, the
Board of Directors also noted, as discussed above in (iii), that the Investment Manager continues to reinvest profits back in the business.
(v) Comparison of services to be rendered and fees to be paid to those under other investment management contracts, such as contracts of the same and other investment advisors or other clients: As discussed above in (iii),
the Board of Directors compared the fees paid under the Management Agreement to those under other investment management contracts of other investment advisors managing Peer Funds. The Board of Directors also compared the services rendered and fees
paid under the Management Agreement to fees paid, including the ranges of such fees, under the Investment Manager’s other fund management agreements and advisory contracts with institutional and other clients with similar investment mandates,
noting that the Investment Manager provides more services to the Fund than it does for institutional or subadvised accounts. The Board of Directors also considered the entrepreneurial risk and financial exposure assumed by the Investment Manager in
developing and managing the Fund that the Investment Manager does not have with institutional and other clients and other differences in the management of registered investment companies and institutional accounts. The Board of Directors determined
that on a comparative basis the fees under the Management Agreement were reasonable in relation to the services provided.
No single factor was cited as determinative to the decision of the Board of Directors, and each Director may have assigned different weights to the various factors. Rather, after weighing all of the considerations and conclusions
discussed above, the Board of Directors, including the Independent Directors, unanimously approved the continuation of the Management Agreement.
64
COHEN
& STEERS REIT AND
PREFERRED AND INCOME FUND, INC.
Cohen & Steers Privacy Policy
|
|
|
| |
|
| Facts |
|
What Does Cohen & Steers Do With Your Personal Information? |
|
|
| Why? |
|
Financial companies choose how they share your personal information. Federal law gives consumers the right to limit some but not all sharing. Federal law also requires
us to tell you how we collect, share, and protect your personal information. Please read this notice carefully to understand what we do. |
|
|
| What? |
|
The types of personal information we collect and share depend on the product or service
you have with us. This information can include: • Social Security number and account balances
• Transaction history and account transactions
• Purchase history and wire
transfer instructions |
|
|
| How? |
|
All financial companies need to share customers’ personal information to run their everyday business. In the section below, we list the reasons financial
companies can share their customers’ personal information; the reasons Cohen & Steers chooses to share; and whether you can limit this sharing. |
|
|
|
|
|
| Reasons we can share your personal information |
|
Does Cohen & Steers
share? |
|
Can you limit this
sharing? |
|
|
|
| For our everyday business purposes—
such as to process your transactions, maintain your account(s), respond to court orders and legal investigations, or reports to
credit bureaus |
|
Yes |
|
No |
|
|
|
| For our marketing purposes—
to offer our products and services to you |
|
Yes |
|
No |
|
|
|
| For joint marketing with other financial companies— |
|
No |
|
We don’t share |
|
|
|
| For our affiliates’ everyday business purposes—
information about your transactions and experiences |
|
No |
|
We don’t share |
|
|
|
| For our affiliates’ everyday business purposes—
information about your creditworthiness |
|
No |
|
We don’t share |
|
|
|
| For our affiliates to market to you— |
|
No |
|
We don’t share |
|
|
|
| For non-affiliates to market to you— |
|
No |
|
We don’t share |
|
|
|
|
|
|
|
|
| |
|
|
| Questions? Call 800.330.7348 |
|
|
|
|
65
COHEN
& STEERS REIT AND
PREFERRED AND INCOME FUND, INC.
Cohen & Steers Privacy Policy—(Continued)
|
|
|
| |
|
| Who we are |
|
|
|
|
| Who is providing this notice? |
|
Cohen & Steers Capital Management, Inc., Cohen & Steers Asia Limited, Cohen & Steers Japan Limited, Cohen & Steers UK Limited,
Cohen & Steers Ireland Limited, Cohen & Steers Singapore Private Limited, Cohen & Steers Securities, LLC, Cohen & Steers Private Funds and Cohen & Steers Open and Closed-End
Funds (collectively, Cohen & Steers). |
|
|
| What we do |
|
|
|
|
| How does Cohen & Steers protect my personal information? |
|
To protect your personal information from unauthorized access and use, we use security measures that comply with federal law. These measures include computer
safeguards and secured files and buildings. We restrict access to your information to those employees who need it to perform their jobs, and also require companies that provide services on our behalf to protect your information. |
|
|
| How does Cohen & Steers collect my personal information? |
|
We collect your personal information, for example, when you:
• Open an account or buy
securities from us
• Provide account information or give us your contact information
• Make deposits or
withdrawals from your account We also collect your personal
information from other companies. |
|
|
| Why can’t I limit all sharing? |
|
Federal law gives you the right to limit only:
• sharing for
affiliates’ everyday business purposes—information about your creditworthiness
• affiliates from using your information to market to you
• sharing for non-affiliates to market to you
State law and individual companies may give you additional rights to limit sharing. |
|
|
| Definitions |
|
|
|
|
| Affiliates |
|
Companies related by common ownership or control. They can be financial and
nonfinancial companies.
• Cohen & Steers does not share with affiliates. |
|
|
| Non-affiliates |
|
Companies not related by common ownership or control. They can be financial and
nonfinancial companies.
• Cohen & Steers does not share with
non-affiliates. |
|
|
| Joint marketing |
|
A formal agreement between non-affiliated
financial companies that together market financial products or services to you.
• Cohen & Steers does not jointly market. |
66
COHEN
& STEERS REIT AND
PREFERRED AND INCOME FUND, INC.
Cohen & Steers Open-End Mutual Funds
COHEN & STEERS REALTY
SHARES
| • |
|
Designed for investors seeking total return, investing primarily in U.S. real estate securities |
| • |
|
Symbols: CSJAX, CSJCX, CSJIX, CSRSX, CSJRX, CSJZX |
COHEN & STEERS REAL ESTATE SECURITIES
FUND
| • |
|
Designed for investors seeking total return, investing primarily in U.S. real estate securities |
| • |
|
Symbols: CSEIX, CSCIX, CREFX, CSDIX, CIRRX, CSZIX |
COHEN & STEERS INSTITUTIONAL REALTY SHARES
| • |
|
Designed for institutional investors seeking total return, investing primarily in U.S. real estate securities |
COHEN &
STEERS GLOBAL REALTY SHARES
| • |
|
Designed for investors seeking total return, investing primarily in global real estate equity securities |
| • |
|
Symbols: CSFAX, CSFCX, CSSPX, GRSRX, CSFZX |
COHEN & STEERS INTERNATIONAL REALTY FUND
| • |
|
Designed for investors seeking total return, investing primarily in international (non-U.S.) real estate securities |
| • |
|
Symbols: IRFAX, IRFCX, IRFIX, IRFRX, IRFZX |
COHEN & STEERS REAL ASSETS FUND
| • |
|
Designed for investors seeking total return and the maximization of real returns during inflationary environments by investing primarily in real assets |
| • |
|
Symbols: RAPAX, RAPCX, RAPIX, RAPRX, RAPZX
|
COHEN & STEERS PREFERRED
SECURITIES AND INCOME FUND
| • |
|
Designed for investors seeking total return (high current income and capital appreciation), investing primarily in preferred and debt securities issued by U.S. and
non-U.S. companies |
| • |
|
Symbols: CPXAX, CPXCX, CPXFX, CPXIX, CPRRX, CPXZX |
COHEN & STEERS LOW DURATION PREFERRED
AND INCOME FUND
| • |
|
Designed for investors seeking high current income and capital preservation by investing in low-duration preferred and other income securities issued by U.S.
and non-U.S. companies |
| • |
|
Symbols: LPXAX, LPXCX, LPXFX, LPXIX, LPXRX, LPXZX |
COHEN & STEERS MLP & ENERGY OPPORTUNITY
FUND
| • |
|
Designed for investors seeking total return, investing primarily in midstream energy master limited partnership (MLP) units and related stocks |
| • |
|
Symbols: MLOAX, MLOCX, MLOIX, MLORX, MLOZX |
COHEN & STEERS GLOBAL INFRASTRUCTURE FUND
| • |
|
Designed for investors seeking total return, investing primarily in global infrastructure securities |
| • |
|
Symbols: CSUAX, CSUCX, CSUIX, CSURX, CSUZX |
COHEN & STEERS ALTERNATIVE INCOME FUND
| • |
|
Designed for investors seeking high current income and capital appreciation, investing in equity, preferred and debt securities, focused on real assets and alternative income strategies
|
| • |
|
Symbols: DVFAX, DVFCX, DVFIX, DVFRX, DVFZX |
Distributed by Cohen & Steers Securities, LLC.
Please consider the investment objectives, risks,
charges and expenses of any Cohen & Steers U.S. registered open-end fund carefully before investing. A summary prospectus and prospectus containing this and other information can be obtained by
calling 800-330-7348 or by visiting cohenandsteers.com. Please read the summary prospectus and prospectus carefully before investing.
67
COHEN
& STEERS REIT AND
PREFERRED AND INCOME FUND, INC.
OFFICERS AND DIRECTORS
Joseph M. Harvey
Director, Chair
and Vice President
Adam M. Derechin
Director
Michael G. Clark
Director
George Grossman
Director
Dean A. Junkans
Director
Gerald J. Maginnis
Director
Jane F. Magpiong
Director
Daphne L.
Richards
Director
Ramona Rogers-Windsor
Director
James Giallanza
President and Chief Executive Officer
Albert Laskaj
Treasurer and Chief Financial Officer
Dana A. DeVivo
Secretary and
Chief Legal Officer
Stephen Murphy
Chief Compliance Officer
and Vice President
Yigal D. Jhirad
Vice President
William F. Scapell
Vice President
Mathew Kirschner
Vice President
Jason
Yablon
Vice President
KEY INFORMATION
Investment Manager and Administrator
Cohen & Steers Capital Management, Inc.
280 Park Avenue
New York, NY 10017
(212) 832-3232
Co-administrator and Custodian
State Street Bank and Trust Company
One Congress Street, Suite 1
Boston, MA 02114-2016
Transfer
Agent
Computershare
150 Royall Street
Canton, MA
02021
(866) 227-0757
Legal Counsel
Ropes &
Gray LLP
1211 Avenue of the Americas
New York, NY 10036
|
|
|
| New York Stock Exchange Symbol: |
|
RNP |
Website: cohenandsteers.com
This report is for shareholder information. This is not a prospectus intended for use in the purchase or sale of Fund shares. Performance data
quoted represent past performance. Past performance is no guarantee of future results and your investment may be worth more or less at the time you sell your shares.
68
eDelivery AVAILABLE
Stop traditional mail delivery;
receive your shareholder reports
and prospectus online.
Sign up at cohenandsteers.com

Cohen & Steers
REIT and Preferred
and Income
Fund (RNP)
Semiannual Report June 30, 2023
RNPSAR
Item 2. Code of Ethics.
Not applicable.
Item 3. Audit
Committee Financial Expert.
Not applicable.
Item 4. Principal Accountant Fees and Services.
Not applicable.
Item 5. Audit
Committee of Listed Registrants.
Not applicable.
Item 6. Schedule of Investments.
Included in Item 1 above.
Item 7.
Disclosure of Proxy Voting Policies and Procedures for Closed-End Management Investment Companies.
Not applicable.
Item 8. Portfolio
Managers of Closed-End Management Investment Companies.
| (b) |
The registrant has not had any change in the portfolio managers identified in response to paragraph (a)(1)
of this item in the registrant’s most recent annual report on Form N-CSR. |
Item 9.
Purchases of Equity Securities by Closed-End Management Investment Company and Affiliated Purchasers.
None.
Item 10. Submission of Matters
to a Vote of Security Holders.
None.
Item 11. Controls and Procedures.
| (a) |
The registrant’s principal executive officer and principal financial officer have concluded that the
registrant’s disclosure controls and procedures are reasonably designed to ensure that |
| |
information required to be disclosed by the registrant in this Form N-CSR was recorded, processed, summarized and reported within the time periods
specified in the Securities and Exchange Commission’s rules and forms, based upon such officers’ evaluation of these controls and procedures as of a date within 90 days of the filing date of this report. |
| (b) |
There were no changes in the registrant’s internal control over financial reporting that occurred
during the period covered by this report that have materially affected, or are reasonably likely to materially affect, the registrant’s internal control over financial reporting. |
Item 12. Disclosure of Securities Lending Activities for Closed-End Management Investment Companies.
| (a) |
For the fiscal year ended December 31, 2022, the registrant had the following dollar amounts of income
and fees/compensation related to its securities lending activities: |
|
|
|
|
|
| |
|
Total |
|
| Gross income from securities lending activities |
|
|
$613,584 |
|
| Fees and/or compensation for securities lending activities and related services |
|
|
|
|
| Fees paid
to securities lending agent from a revenue split |
|
|
$139,635 |
|
| Fees paid
for cash collateral management services (including fees deducted from a pooled cash collateral reinvestment vehicle) that are not included in the revenue split |
|
|
— |
|
|
Administrative fees that are not included in the revenue split |
|
|
— |
|
|
Indemnification fee not included in the revenue split |
|
|
— |
|
| Rebates
paid to borrowers; |
|
|
— |
|
| Other
fees relating to the securities lending program not included in the revenue split |
|
|
— |
|
| Aggregate fees/compensation for securities lending activities and related services |
|
|
$139,635 |
|
| Net income from securities lending activities |
|
|
$473,949 |
|
| (b) |
During the registrants most recent fiscal year ended December 31, 2022, BNP Paribas (“BNPP”)
served as the registrant’s securities lending agent. |
As a securities lending agent, BNPP is responsible for the
implementation and administration of the registrant’s securities lending program. Pursuant to its respective Securities Lending Agreement (“Securities Lending Agreement”) with the registrant, BNPP, as a general matter, performs
various services, including the following:
| |
• |
|
Monitoring daily the value of the loaned securities and collateral (i.e. the collateral posted by the
party borrowing); |
| |
• |
|
Negotiation of loan terms; |
| |
• |
|
Selection of securities to be loaned; |
| |
• |
|
Recordkeeping and account servicing; |
| |
• |
|
Monitoring of dividend activity and material proxy votes relating to loaned securities, and;
|
| |
• |
|
Arranging for return of loaned securities to the registrant at loan termination. |
BNPP is compensated for the above-described services from its securities lending revenue split.
The table above shows what the registrant earned and the fees and compensation it paid in connections with its securities lending activities during its most recent fiscal year.
Item 13. Exhibits.
(a)(1) Not
applicable.
(a)(2) Certifications of principal executive officer and principal financial officer as required
by Rule 30a-2(a) under the Investment Company Act of 1940.
(a)(3) Not applicable.
(a)(4) Not applicable.
(b)
Certifications of principal executive officer and principal financial officer as required by Rule 30a- 2(b) under the Investment Company Act of 1940.
(c) Registrant’s notices to shareholders pursuant to Registrant’s exemptive order granting an exemption from
Section 19(b) of the 1940 Act and Rule 19b-1 thereunder regarding distributions pursuant to the Registrant’s Managed Distribution Plan.
SIGNATURES
Pursuant to the requirements of the Securities Exchange Act of 1934 and the Investment Company Act of 1940, the registrant has duly caused
this report to be signed on its behalf by the undersigned, thereunto duly authorized.
COHEN & STEERS REIT AND PREFERRED AND INCOME FUND, INC.
|
|
|
|
|
|
|
|
|
|
By: |
|
/s/ James Giallanza |
|
|
|
|
Name: James Giallanza
Title: Principal Executive Officer
(President and Chief Executive Officer) |
|
|
|
|
|
Date: |
|
September 1, 2023 |
Pursuant to the requirements of the Securities Exchange Act of 1934 and the Investment Company Act of 1940,
this report has been signed below by the following persons on behalf of the registrant and in the capacities and on the dates indicated.
|
|
|
|
|
|
|
|
|
|
By: |
|
/s/ James Giallanza |
|
|
|
|
Name: James Giallanza
Title: Principal Executive Officer
(President and Chief Executive Officer) |
|
|
|
|
|
By: |
|
/s/ Albert Laskaj |
|
|
|
|
Name: Albert Laskaj
Title: Principal Financial Officer
(Treasurer and Chief Financial Officer) |
|
|
|
|
Date: September 1, 2023 |
EX-99.CERT
EXHIBIT 13 (a)(2)
RULE 30a-2(a) CERTIFICATIONS
I, James Giallanza, certify that:
| 1. |
I have reviewed this report on Form N-CSR of Cohen & Steers
REIT and Preferred and Income Fund, Inc.; |
| 2. |
Based on my knowledge, this report does not contain any untrue statement of a material fact or omit to state
a material fact necessary to make the statements made, in light of the circumstances under which such statements were made, not misleading with respect to the period covered by this report; |
| 3. |
Based on my knowledge, the financial statements, and other financial information included in this report,
fairly present in all material respects the financial condition, results of operations, changes in net assets, and cash flows (if the financial statements are required to include a statement of cash flows) of the registrant as of, and for, the
periods presented in this report; |
| 4. |
The registrant’s other certifying officer and I are responsible for establishing and maintaining
disclosure controls and procedures (as defined in Rule 30a-3(c) under the Investment Company Act of 1940) and internal control over financial reporting (as defined in Rule
30a-3(d) under the Investment Company Act of 1940) for the registrant and have: |
| |
(a) |
designed such disclosure controls and procedures, or caused such disclosure controls and procedures to be
designed under our supervision, to ensure that material information relating to the registrant, including its consolidated subsidiaries, is made known to us by others within those entities, particularly during the period in which this report is
being prepared; |
| |
(b) |
designed such internal control over financial reporting, or caused such internal control over financial
reporting to be designed under our supervision, to provide reasonable assurance regarding the reliability of financial reporting and the preparation of financial statements for external purposes in accordance with generally accepted accounting
principles; |
| |
(c) |
evaluated the effectiveness of the registrant’s disclosure controls and procedures and presented in
this report our conclusions about the effectiveness of the disclosure controls and procedures, as of a date within 90 days prior to the filing date of this report based on such evaluation; and |
| |
(d) |
disclosed in this report any change in the registrant’s internal control over financial reporting that
occurred during the period covered by this report that has materially affected, or is reasonably likely to materially affect, the registrant’s internal control over financial reporting; and |
| 5. |
The registrant’s other certifying officer and I have disclosed to the registrant’s auditors and
the audit committee of the registrant’s board of directors (or persons performing the equivalent functions): |
| |
(a) |
all significant deficiencies and material weaknesses in the design or operation of internal control over
financial reporting which are reasonably likely to adversely affect the registrant’s ability to record, process, summarize, and report financial information; and |
| |
(b) |
any fraud, whether or not material, that involves management or other employees who have a significant role
in the registrant’s internal control over financial reporting. |
|
| /s/ James Giallanza |
| James Giallanza Principal Executive
Officer (President and Chief Executive Officer) |
EX-99.CERT
EXHIBIT 13 (a)(2)
RULE 30a-2(a) CERTIFICATIONS
I, Albert Laskaj, certify that:
| 1. |
I have reviewed this report on Form N-CSR of Cohen & Steers
REIT and Preferred and Income Fund, Inc.; |
| 2. |
Based on my knowledge, this report does not contain any untrue statement of a material fact or omit to state
a material fact necessary to make the statements made, in light of the circumstances under which such statements were made, not misleading with respect to the period covered by this report; |
| 3. |
Based on my knowledge, the financial statements, and other financial information included in this report,
fairly present in all material respects the financial condition, results of operations, changes in net assets, and cash flows (if the financial statements are required to include a statement of cash flows) of the registrant as of, and for, the
periods presented in this report; |
| 4. |
The registrant’s other certifying officer and I are responsible for establishing and maintaining
disclosure controls and procedures (as defined in Rule 30a-3(c) under the Investment Company Act of 1940) and internal control over financial reporting (as defined in Rule
30a-3(d) under the Investment Company Act of 1940) for the registrant and have: |
| |
(a) |
designed such disclosure controls and procedures, or caused such disclosure controls and procedures to be
designed under our supervision, to ensure that material information relating to the registrant, including its consolidated subsidiaries, is made known to us by others within those entities, particularly during the period in which this report is
being prepared; |
| |
(b) |
designed such internal control over financial reporting, or caused such internal control over financial
reporting to be designed under our supervision, to provide reasonable assurance regarding the reliability of financial reporting and the preparation of financial statements for external purposes in accordance with generally accepted accounting
principles; |
| |
(c) |
evaluated the effectiveness of the registrant’s disclosure controls and procedures and presented in
this report our conclusions about the effectiveness of the disclosure controls and procedures, as of a date within 90 days prior to the filing date of this report based on such evaluation; and |
| |
(d) |
disclosed in this report any change in the registrant’s internal control over financial reporting that
occurred during the period covered by this report that has materially affected, or is reasonably likely to materially affect, the registrant’s internal control over financial reporting; and |
| 5. |
The registrant’s other certifying officer and I have disclosed to the registrant’s auditors and
the audit committee of the registrant’s board of directors (or persons performing the equivalent functions): |
| |
(a) |
all significant deficiencies and material weaknesses in the design or operation of internal control over
financial reporting which are reasonably likely to adversely affect the registrant’s ability to record, process, summarize, and report financial information; and |
| |
(b) |
any fraud, whether or not material, that involves management or other employees who have a significant role
in the registrant’s internal control over financial reporting. |
|
| /s/ Albert Laskaj |
| Albert Laskaj Principal Financial
Officer (Treasurer and Chief Financial Officer) |
EX-99.906CERT
EXHIBIT 13 (b)
RULE 30a-2(b) CERTIFICATIONS
In connection with the report of Cohen & Steers REIT and Preferred
and Income Fund, Inc. (the “Company”) on Form N-CSR as filed with the Securities and Exchange Commission on the date hereof (the “Report”), I, James Giallanza, Principal Executive Officer
of the Company, certify, pursuant to 18 U.S.C. §1350, as adopted pursuant to Section 906 of the Sarbanes-Oxley Act of 2002, that:
| (1) |
The Report fully complies with the requirements of Section 13(a) or 15(d) of the Securities Exchange
Act of 1934, as applicable; and |
| (2) |
The information contained in the Report fairly presents, in all material respects, the financial condition
and results of operations of the Company. |
|
| /s/ James Giallanza |
| James Giallanza Principal Executive
Officer (President and Chief Executive Officer) |
| Date: September 1, 2023 |
EX-99.906CERT
EXHIBIT 13 (b)
RULE 30a-2(b) CERTIFICATIONS
In connection with the report of Cohen & Steers REIT and Preferred
and Income Fund, Inc. (the “Company”) on Form N-CSR as filed with the Securities and Exchange Commission on the date hereof (the “Report”), I, Albert Laskaj, Principal Financial Officer of
the Company, certify, pursuant to 18 U.S.C. §1350, as adopted pursuant to Section 906 of the Sarbanes-Oxley Act of 2002, that:
| (1) |
The Report fully complies with the requirements of Section 13(a) or 15(d) of the Securities Exchange
Act of 1934, as applicable; and |
| (2) |
The information contained in the Report fairly presents, in all material respects, the financial condition
and results of operations of the Company. |
|
| /s/ Albert Laskaj |
| Albert Laskaj Principal Financial
Officer (Treasurer and Chief Financial Officer) |
| Date: September 1, 2023 |

Notification of Sources of Distribution
Pursuant to Section 19(a) of the Investment Company Act of 1940
Cohen & Steers REIT and Preferred and Income Fund, Inc. (RNP)
Cohen & Steers REIT and Preferred and Income Fund, Inc. (NYSE: RNP) (the “Fund”), acting in accordance with an exemptive
order received from the Securities and Exchange Commission and with approval of its Board of Directors, adopted a managed distribution policy under which the Fund intends to include long-term capital gains, where applicable, as part of the regular
monthly cash distributions to its shareholders. This policy will give the Fund greater flexibility to realize long-term capital gains and to distribute those gains on a regular monthly basis.
The Board of Directors of the Fund declared a monthly distribution per share for the month of January 2023. Please review the following
information and important disclosures set forth below.
|
|
|
|
|
|
|
| Amount of Distribution |
|
Ex-Dividend Date |
|
Record Date |
|
Payable Date |
| $0.136 |
|
January 17, 2023 |
|
January 18, 2023 |
|
January 31, 2023 |
The following table sets forth the estimated amounts of the current distribution and the cumulative
distributions paid this fiscal year-to-date from the sources indicated in the table. All amounts are expressed per common share.
|
|
|
|
|
|
|
|
|
| DISTRIBUTION ESTIMATES |
|
January 2023 |
|
YEAR-TO-DATE (YTD)
January 31, 2023* |
| Source |
|
Per Share
Amount |
|
% of Current
Distribution |
|
Per Share
Amount |
|
% of 2023
Distributions |
|
Net Investment Income |
|
$0.0000 |
|
0.00% |
|
$0.0000 |
|
0.00% |
|
Net Realized Short-Term Capital Gains |
|
$0.0000 |
|
0.00% |
|
$0.0000 |
|
0.00% |
|
Net Realized Long-Term Capital Gains |
|
$0.1360 |
|
100.00% |
|
$0.1360 |
|
100.00% |
|
Return of Capital (or other Capital Source) |
|
$0.0000 |
|
0.00% |
|
$0.0000 |
|
0.00% |
|
Total Current Distribution |
|
$0.1360 |
|
100.00% |
|
$0.1360 |
|
100.00% |
You should not draw any conclusions about the Fund’s investment performance from the amount of this
distribution or from the terms of the Fund’s managed distribution policy. The amounts and sources of distributions reported in this Notice are only estimates, are likely to change over time, and are not being provided for tax reporting
purposes. The actual amounts and sources of the amounts for accounting and tax reporting purposes will depend upon the Fund’s investment experience during the remainder of its fiscal year and may be subject to changes based on tax
regulations. The amounts and sources of distributions year-to-date may be subject to additional adjustments.
*THE FUND WILL SEND YOU A FORM 1099-DIV FOR THE CALENDAR YEAR THAT WILL TELL YOU HOW TO REPORT
THESE DISTRIBUTIONS FOR FEDERAL INCOME TAX PURPOSES.
The Fund’s
Year-to-date Cumulative Total Return for fiscal year 2022 (January 1, 2022 through December 31, 2022) is set forth below. Shareholders should take note of the
relationship between the Year-to-date Cumulative Total Return with the Fund’s Cumulative Distribution Rate for 2022. In addition, the Fund’s Average Annual
Total Return for the five-year period ending December 31, 2022 is set forth below. Shareholders should note the relationship between the Average Annual Total Return with the Fund’s Current Annualized Distribution Rate for 2022. The
performance and distribution rate information disclosed in the table is based on the Fund’s net asset value per share (NAV). The Fund’s NAV is calculated as the total market value of all the securities and other assets held by the Fund
minus the total liabilities, divided by the total number of shares outstanding. While NAV performance may be indicative of the Fund’s investment performance, it does not measure the value of a shareholder’s individual investment in the
Fund. The value of a shareholder’s investment in the Fund is determined by the Fund’s market price, which is based on the supply and demand for the Fund’s shares in the open market.
280 Park Avenue, New York, NY 10017-1216 Tel: 212.832.3232 Fax:
212-832-3622
Fund Performance and Distribution Rate Information:
|
|
|
|
|
| Year-to-date
January 1, 2022 to December 31, 2022 |
|
| Year-to-date Cumulative Total Return1 |
|
|
-22.57 |
% |
|
Cumulative Distribution Rate2 |
|
|
0.68 |
% |
| |
|
|
|
|
| Five-year period ending December 31, 2022 |
|
| Average
Annual Total Return3 |
|
|
5.55 |
% |
| Current
Annualized Distribution Rate4 |
|
|
8.12 |
% |
| 1. |
Year-to-date Cumulative
Total Return is the percentage change in the Fund’s NAV over the year-to-date time period including distributions paid and assuming reinvestment of those
distributions. |
| 2. |
Cumulative Distribution Rate for the Fund’s current fiscal period (January 1, 2023 through
January 31, 2023) measured on the dollar value of distributions in the year-to-date period as a percentage of the Fund’s NAV as of December 31, 2022.
|
| 3. |
Average Annual Total Return represents the compound average of the Annual NAV Total Returns of the Fund for
the five-year period ending December 31, 2022. Annual NAV Total Return is the percentage change in the Fund’s NAV over a year including distributions paid and assuming reinvestment of those distributions. |
| 4. |
The Current Annualized Distribution Rate is the current fiscal period’s distribution rate annualized as
a percentage of the Fund’s NAV as of December 31, 2022. |
This Fund has a managed distribution policy that
seeks to deliver the Fund’s long term total return potential through regular monthly distributions declared at a fixed rate per share. Distributions may be paid in part or in full from net investment income, realized capital gains and by
returning capital, or a combination thereof. Shareholders should note, however, that if the Fund’s aggregate net investment income and net realized capital gains are less than the amount of the distribution level, the difference will be
distributed from the Fund’s assets and will constitute a return of the shareholder’s capital. A return of capital is not taxable; rather it reduces a shareholder’s tax basis in his or her shares of the Fund. The Board of Directors of
the Fund may amend, terminate or suspend the managed distribution policy at any time, which could have an adverse effect on the market price of the Fund’s shares.
Shareholders should not use the information provided in preparing their tax returns. Shareholders will receive a Form 1099-DIV for the calendar year indicating how to report fund distributions for federal income tax purposes.
Notification of Sources of Distribution
Pursuant to Section 19(a) of the Investment Company Act of 1940
Cohen & Steers REIT and Preferred and Income Fund, Inc. (RNP)
Cohen & Steers REIT and Preferred and Income Fund, Inc. (NYSE: RNP) (the “Fund”), acting in accordance with an exemptive
order received from the Securities and Exchange Commission and with approval of its Board of Directors, adopted a managed distribution policy under which the Fund intends to include long-term capital gains, where applicable, as part of the regular
monthly cash distributions to its shareholders. This policy will give the Fund greater flexibility to realize long-term capital gains and to distribute those gains on a regular monthly basis.
The Board of Directors of the Fund declared a monthly distribution per share for the month of February 2023. Please review the following
information and important disclosures set forth below.
|
|
|
|
|
|
|
| Amount of Distribution |
|
Ex-Dividend Date |
|
Record Date |
|
Payable Date |
| $0.136 |
|
February 14, 2023 |
|
February 15, 2023 |
|
February 28, 2023 |
The following table sets forth the estimated amounts of the current distribution and the cumulative
distributions paid this fiscal year-to-date from the sources indicated in the table. All amounts are expressed per common share.
|
|
|
|
|
|
|
|
|
| DISTRIBUTION ESTIMATES |
|
February 2023 |
|
YEAR-TO-DATE (YTD)
February 28, 2023* |
| Source |
|
Per Share
Amount |
|
% of Current
Distribution |
|
Per Share
Amount |
|
% of 2023
Distributions |
|
Net Investment Income |
|
$0.0000 |
|
0.00% |
|
$0.0000 |
|
0.00% |
|
Net Realized Short-Term Capital Gains |
|
$0.0000 |
|
0.00% |
|
$0.0000 |
|
0.00% |
|
Net Realized Long-Term Capital Gains |
|
$0.1360 |
|
100.00% |
|
$0.2720 |
|
100.00% |
|
Return of Capital (or other Capital Source) |
|
$0.0000 |
|
0.00% |
|
$0.0000 |
|
0.00% |
|
Total Current Distribution |
|
$0.1360 |
|
100.00% |
|
$0.2720 |
|
100.00% |
You should not draw any conclusions about the Fund’s investment performance from the amount of this
distribution or from the terms of the Fund’s managed distribution policy. The amounts and sources of distributions reported in this Notice are only estimates, are likely to change over time, and are not being provided for tax reporting
purposes. The actual amounts and sources of the amounts for accounting and tax reporting purposes will depend upon the Fund’s investment experience during the remainder of its fiscal year and may be subject to changes based on tax
regulations. The amounts and sources of distributions year-to-date may be subject to additional adjustments.
*THE FUND WILL SEND YOU A FORM 1099-DIV FOR THE CALENDAR YEAR THAT WILL TELL YOU HOW TO REPORT
THESE DISTRIBUTIONS FOR FEDERAL INCOME TAX PURPOSES.
The Fund’s
Year-to-date Cumulative Total Return for fiscal year 2023 (January 1, 2023 through January 31, 2023) is set forth below. Shareholders should take note of the
relationship between the Year-to-date Cumulative Total Return with the Fund’s Cumulative Distribution Rate for 2023. In addition, the Fund’s Average Annual
Total Return for the five-year period ending January 31, 2023 is set forth below. Shareholders should note the relationship between the Average Annual Total Return with the Fund’s Current Annualized Distribution Rate for 2023. The
performance and distribution rate information disclosed in the table is based on the Fund’s net asset value per share (NAV). The Fund’s NAV is calculated as the total market value of all the securities and other assets held by the Fund
minus the total liabilities, divided by the total number of shares outstanding. While NAV performance may be indicative of the Fund’s investment performance, it does not measure the value of a shareholder’s individual investment in the
Fund. The value of a shareholder’s investment in the Fund is determined by the Fund’s market price, which is based on the supply and demand for the Fund’s shares in the open market.
280 Park Avenue, New York, NY 10017-1216 Tel: 212.832.3232 Fax:
212-832-3622
Fund Performance and Distribution Rate Information:
|
|
|
|
|
| Year-to-date
January 1, 2023 to January 31, 2023 |
|
| Year-to-date Cumulative Total Return1 |
|
|
11.52 |
% |
|
Cumulative Distribution Rate2 |
|
|
1.22 |
% |
| |
|
|
|
|
| Five-year period ending January 31, 2023 |
|
| Average
Annual Total Return3 |
|
|
8.50 |
% |
| Current
Annualized Distribution Rate4 |
|
|
7.32 |
% |
| 1. |
Year-to-date Cumulative
Total Return is the percentage change in the Fund’s NAV over the year-to-date time period including distributions paid and assuming reinvestment of those
distributions. |
| 2. |
Cumulative Distribution Rate for the Fund’s current fiscal period (January 1, 2023 through
February 28, 2023) measured on the dollar value of distributions in the year-to-date period as a percentage of the Fund’s NAV as of January 31, 2023.
|
| 3. |
Average Annual Total Return represents the compound average of the Annual NAV Total Returns of the Fund for
the five-year period ending January 31, 2023. Annual NAV Total Return is the percentage change in the Fund’s NAV over a year including distributions paid and assuming reinvestment of those distributions. |
| 4. |
The Current Annualized Distribution Rate is the current fiscal period’s distribution rate annualized as
a percentage of the Fund’s NAV as of January 31, 2023. |
This Fund has a managed distribution policy that seeks
to deliver the Fund’s long term total return potential through regular monthly distributions declared at a fixed rate per share. Distributions may be paid in part or in full from net investment income, realized capital gains and by returning
capital, or a combination thereof. Shareholders should note, however, that if the Fund’s aggregate net investment income and net realized capital gains are less than the amount of the distribution level, the difference will be distributed from
the Fund’s assets and will constitute a return of the shareholder’s capital. A return of capital is not taxable; rather it reduces a shareholder’s tax basis in his or her shares of the Fund. The Board of Directors of the Fund may
amend, terminate or suspend the managed distribution policy at any time, which could have an adverse effect on the market price of the Fund’s shares.
Shareholders should not use the information provided in preparing their tax returns. Shareholders will receive a Form 1099-DIV for the calendar year indicating how to report fund distributions for federal income tax purposes.
Notification of Sources of Distribution
Pursuant to Section 19(a) of the Investment Company Act of 1940
Cohen & Steers REIT and Preferred and Income Fund, Inc. (RNP)
Cohen & Steers REIT and Preferred and Income Fund, Inc. (NYSE: RNP) (the “Fund”), acting in accordance with an exemptive
order received from the Securities and Exchange Commission and with approval of its Board of Directors, adopted a managed distribution policy under which the Fund intends to include long-term capital gains, where applicable, as part of the regular
monthly cash distributions to its shareholders. This policy will give the Fund greater flexibility to realize long-term capital gains and to distribute those gains on a regular monthly basis.
The Board of Directors of the Fund declared a monthly distribution per share for the month of March 2023. Please review the following
information and important disclosures set forth below.
|
|
|
|
|
|
|
| Amount of Distribution |
|
Ex-Dividend Date |
|
Record Date |
|
Payable Date |
| $0.136 |
|
March 14, 2023 |
|
March 15, 2023 |
|
March 31, 2023 |
The following table sets forth the estimated amounts of the current distribution and the cumulative
distributions paid this fiscal year-to-date from the sources indicated in the table. All amounts are expressed per common share.
|
|
|
|
|
|
|
|
|
| DISTRIBUTION ESTIMATES |
|
March 2023 |
|
YEAR-TO-DATE (YTD)
March 31, 2023* |
| Source |
|
Per Share
Amount |
|
% of Current
Distribution |
|
Per Share
Amount |
|
% of 2023
Distributions |
|
Net Investment Income |
|
$0.0000 |
|
0.00% |
|
$0.0000 |
|
0.00% |
|
Net Realized Short-Term Capital Gains |
|
$0.0000 |
|
0.00% |
|
$0.0000 |
|
0.00% |
|
Net Realized Long-Term Capital Gains |
|
$0.1360 |
|
100.00% |
|
$0.4080 |
|
100.00% |
|
Return of Capital (or other Capital Source) |
|
$0.0000 |
|
0.00% |
|
$0.0000 |
|
0.00% |
|
Total Current Distribution |
|
$0.1360 |
|
100.00% |
|
$0.4080 |
|
100.00% |
You should not draw any conclusions about the Fund’s investment performance from the amount of this
distribution or from the terms of the Fund’s managed distribution policy. The amounts and sources of distributions reported in this Notice are only estimates, are likely to change over time, and are not being provided for tax reporting
purposes. The actual amounts and sources of the amounts for accounting and tax reporting purposes will depend upon the Fund’s investment experience during the remainder of its fiscal year and may be subject to changes based on tax
regulations. The amounts and sources of distributions year-to-date may be subject to additional adjustments.
*THE FUND WILL SEND YOU A FORM 1099-DIV FOR THE CALENDAR YEAR THAT WILL TELL YOU HOW TO REPORT
THESE DISTRIBUTIONS FOR FEDERAL INCOME TAX PURPOSES.
The Fund’s
Year-to-date Cumulative Total Return for fiscal year 2023 (January 1, 2023 through February 28, 2023) is set forth below. Shareholders should take note of the
relationship between the Year-to-date Cumulative Total Return with the Fund’s Cumulative Distribution Rate for 2023. In addition, the Fund’s Average Annual
Total Return for the five-year period ending February 28, 2023 is set forth below. Shareholders should note the relationship between the Average Annual Total Return with the Fund’s Current Annualized Distribution Rate for 2023. The
performance and distribution rate information disclosed in the table is based on the Fund’s net asset value per share (NAV). The Fund’s NAV is calculated as the total market value of all the securities and other assets held by the Fund
minus the total liabilities, divided by the total number of shares outstanding. While NAV performance may be indicative of the Fund’s investment performance, it does not measure the value of a shareholder’s individual investment in the
Fund. The value of a shareholder’s investment in the Fund is determined by the Fund’s market price, which is based on the supply and demand for the Fund’s shares in the open market.
280 Park Avenue, New York, NY 10017-1216 Tel: 212.832.3232 Fax:
212-832-3622
Fund Performance and Distribution Rate Information:
|
|
|
|
|
| Year-to-date
January 1, 2023 to February 28, 2023 |
|
| Year-to-date Cumulative Total Return1 |
|
|
6.95 |
% |
|
Cumulative Distribution Rate2 |
|
|
1.92 |
% |
| |
|
|
|
|
| Five-year period ending February 28, 2023 |
|
| Average
Annual Total Return3 |
|
|
8.80 |
% |
| Current
Annualized Distribution Rate4 |
|
|
7.69 |
% |
| 1. |
Year-to-date Cumulative
Total Return is the percentage change in the Fund’s NAV over the year-to-date time period including distributions paid and assuming reinvestment of those
distributions. |
| 2. |
Cumulative Distribution Rate for the Fund’s current fiscal period (January 1, 2023 through
March 31, 2023) measured on the dollar value of distributions in the year-to-date period as a percentage of the Fund’s NAV as of February 28, 2023.
|
| 3. |
Average Annual Total Return represents the compound average of the Annual NAV Total Returns of the Fund for
the five-year period ending February 28, 2023. Annual NAV Total Return is the percentage change in the Fund’s NAV over a year including distributions paid and assuming reinvestment of those distributions. |
| 4. |
The Current Annualized Distribution Rate is the current fiscal period’s distribution rate annualized as
a percentage of the Fund’s NAV as of February 28, 2023. |
This Fund has a managed distribution policy that
seeks to deliver the Fund’s long term total return potential through regular monthly distributions declared at a fixed rate per share. Distributions may be paid in part or in full from net investment income, realized capital gains and by
returning capital, or a combination thereof. Shareholders should note, however, that if the Fund’s aggregate net investment income and net realized capital gains are less than the amount of the distribution level, the difference will be
distributed from the Fund’s assets and will constitute a return of the shareholder’s capital. A return of capital is not taxable; rather it reduces a shareholder’s tax basis in his or her shares of the Fund. The Board of Directors of
the Fund may amend, terminate or suspend the managed distribution policy at any time, which could have an adverse effect on the market price of the Fund’s shares.
Shareholders should not use the information provided in preparing their tax returns. Shareholders will receive a Form 1099-DIV for the calendar year indicating how to report fund distributions for federal income tax purposes.
Notification of Sources of Distribution
Pursuant to Section 19(a) of the Investment Company Act of 1940
Cohen & Steers REIT and Preferred and Income Fund, Inc. (RNP)
Cohen & Steers REIT and Preferred and Income Fund, Inc. (NYSE: RNP) (the “Fund”), acting in accordance with an exemptive
order received from the Securities and Exchange Commission and with approval of its Board of Directors, adopted a managed distribution policy under which the Fund intends to include long-term capital gains, where applicable, as part of the regular
monthly cash distributions to its shareholders. This policy will give the Fund greater flexibility to realize long-term capital gains and to distribute those gains on a regular monthly basis.
The Board of Directors of the Fund declared a monthly distribution per share for the month of April 2023. Please review the following
information and important disclosures set forth below.
|
|
|
|
|
|
|
| Amount of Distribution |
|
Ex-Dividend Date |
|
Record Date |
|
Payable Date |
| $0.136 |
|
April 11, 2023 |
|
April 12, 2023 |
|
April 28, 2023 |
The following table sets forth the estimated amounts of the current distribution and the cumulative
distributions paid this fiscal year-to-date from the sources indicated in the table. All amounts are expressed per common share.
|
|
|
|
|
|
|
|
|
| DISTRIBUTION ESTIMATES |
|
April 2023 |
|
YEAR-TO-DATE (YTD)
April 30, 2023* |
| Source |
|
Per Share
Amount |
|
% of Current
Distribution |
|
Per Share
Amount |
|
% of 2023
Distributions |
|
Net Investment Income |
|
$0.0000 |
|
0.00% |
|
$0.0000 |
|
0.00% |
|
Net Realized Short-Term Capital Gains |
|
$0.0000 |
|
0.00% |
|
$0.0000 |
|
0.00% |
|
Net Realized Long-Term Capital Gains |
|
$0.1360 |
|
100.00% |
|
$0.5440 |
|
100.00% |
|
Return of Capital (or other Capital Source) |
|
$0.0000 |
|
0.00% |
|
$0.0000 |
|
0.00% |
|
Total Current Distribution |
|
$0.1360 |
|
100.00% |
|
$0.5440 |
|
100.00% |
You should not draw any conclusions about the Fund’s investment performance from the amount of this
distribution or from the terms of the Fund’s managed distribution policy. The amounts and sources of distributions reported in this Notice are only estimates, are likely to change over time, and are not being provided for tax reporting
purposes. The actual amounts and sources of the amounts for accounting and tax reporting purposes will depend upon the Fund’s investment experience during the remainder of its fiscal year and may be subject to changes based on tax
regulations. The amounts and sources of distributions year-to-date may be subject to additional adjustments.
*THE FUND WILL SEND YOU A FORM 1099-DIV FOR THE CALENDAR YEAR THAT WILL TELL YOU HOW TO REPORT
THESE DISTRIBUTIONS FOR FEDERAL INCOME TAX PURPOSES.
The Fund’s
Year-to-date Cumulative Total Return for fiscal year 2023 (January 1, 2023 through March 31, 2023) is set forth below. Shareholders should take note of the
relationship between the Year-to-date Cumulative Total Return with the Fund’s Cumulative Distribution Rate for 2023. In addition, the Fund’s Average Annual
Total Return for the five-year period ending March 31, 2023 is set forth below. Shareholders should note the relationship between the Average Annual Total Return with the Fund’s Current Annualized Distribution Rate for 2023. The
performance and distribution rate information disclosed in the table is based on the Fund’s net asset value per share (NAV). The Fund’s NAV is calculated as the total market value of all the securities and other assets held by the Fund
minus the total liabilities, divided by the total number of shares outstanding. While NAV performance may be indicative of the Fund’s investment performance, it does not measure the value of a shareholder’s individual investment in the
Fund. The value of a shareholder’s investment in the Fund is determined by the Fund’s market price, which is based on the supply and demand for the Fund’s shares in the open market.
280 Park Avenue, New York, NY 10017-1216 Tel: 212.832.3232 Fax:
212-832-3622
Fund Performance and Distribution Rate Information:
|
|
|
|
|
| Year-to-date
January 1, 2023 to March 31, 2023 |
|
| Year-to-date Cumulative Total Return1 |
|
|
-0.22 |
% |
|
Cumulative Distribution Rate2 |
|
|
2.77 |
% |
| |
|
|
|
|
| Five-year period ending March 31, 2023 |
|
| Average
Annual Total Return3 |
|
|
6.79 |
% |
| Current
Annualized Distribution Rate4 |
|
|
8.30 |
% |
| 1. |
Year-to-date Cumulative
Total Return is the percentage change in the Fund’s NAV over the year-to-date time period including distributions paid and assuming reinvestment of those
distributions. |
| 2. |
Cumulative Distribution Rate for the Fund’s current fiscal period (January 1, 2023 through
April 30, 2023) measured on the dollar value of distributions in the year-to-date period as a percentage of the Fund’s NAV as of March 31, 2023.
|
| 3. |
Average Annual Total Return represents the compound average of the Annual NAV Total Returns of the Fund for
the five-year period ending March 31, 2023. Annual NAV Total Return is the percentage change in the Fund’s NAV over a year including distributions paid and assuming reinvestment of those distributions. |
| 4. |
The Current Annualized Distribution Rate is the current fiscal period’s distribution rate annualized as
a percentage of the Fund’s NAV as of March 31, 2023. |
This Fund has a managed distribution policy that seeks
to deliver the Fund’s long term total return potential through regular monthly distributions declared at a fixed rate per share. Distributions may be paid in part or in full from net investment income, realized capital gains and by returning
capital, or a combination thereof. Shareholders should note, however, that if the Fund’s aggregate net investment income and net realized capital gains are less than the amount of the distribution level, the difference will be distributed from
the Fund’s assets and will constitute a return of the shareholder’s capital. A return of capital is not taxable; rather it reduces a shareholder’s tax basis in his or her shares of the Fund. The Board of Directors of the Fund may
amend, terminate or suspend the managed distribution policy at any time, which could have an adverse effect on the market price of the Fund’s shares.
Shareholders should not use the information provided in preparing their tax returns. Shareholders will receive a Form 1099-DIV for the calendar year indicating how to report fund distributions for federal income tax purposes.
Notification of Sources of Distribution
Pursuant to Section 19(a) of the Investment Company Act of 1940
Cohen & Steers REIT and Preferred and Income Fund, Inc. (RNP)
Cohen & Steers REIT and Preferred and Income Fund, Inc. (NYSE: RNP) (the “Fund”), acting in accordance with an exemptive
order received from the Securities and Exchange Commission and with approval of its Board of Directors, adopted a managed distribution policy under which the Fund intends to include long-term capital gains, where applicable, as part of the regular
monthly cash distributions to its shareholders. This policy will give the Fund greater flexibility to realize long-term capital gains and to distribute those gains on a regular monthly basis.
The Board of Directors of the Fund declared a monthly distribution per share for the month of May 2023. Please review the following
information and important disclosures set forth below.
|
|
|
|
|
|
|
| Amount of Distribution |
|
Ex-Dividend Date |
|
Record Date |
|
Payable Date |
| $0.136 |
|
May 9, 2023 |
|
May 10, 2023 |
|
May 31, 2023 |
The following table sets forth the estimated amounts of the current distribution and the cumulative
distributions paid this fiscal year-to-date from the sources indicated in the table. All amounts are expressed per common share.
|
|
|
|
|
|
|
|
|
| DISTRIBUTION ESTIMATES |
|
May 2023 |
|
YEAR-TO-DATE (YTD)
May 31, 2023* |
| Source |
|
Per Share
Amount |
|
% of Current
Distribution |
|
Per Share
Amount |
|
% of 2023
Distributions |
|
Net Investment Income |
|
$0.0710 |
|
52.21% |
|
$0.0710 |
|
10.44% |
|
Net Realized Short-Term Capital Gains |
|
$0.0000 |
|
0.00% |
|
$0.0000 |
|
0.00% |
|
Net Realized Long-Term Capital Gains |
|
$0.0650 |
|
47.79% |
|
$0.6090 |
|
89.56% |
|
Return of Capital (or other Capital Source) |
|
$0.0000 |
|
0.00% |
|
$0.0000 |
|
0.00% |
|
Total Current Distribution |
|
$0.1360 |
|
100.00% |
|
$0.6800 |
|
100.00% |
You should not draw any conclusions about the Fund’s investment performance from the amount of this
distribution or from the terms of the Fund’s managed distribution policy. The amounts and sources of distributions reported in this Notice are only estimates, are likely to change over time, and are not being provided for tax reporting
purposes. The actual amounts and sources of the amounts for accounting and tax reporting purposes will depend upon the Fund’s investment experience during the remainder of its fiscal year and may be subject to changes based on tax
regulations. The amounts and sources of distributions year-to-date may be subject to additional adjustments.
*THE FUND WILL SEND YOU A FORM 1099-DIV FOR THE CALENDAR YEAR THAT WILL TELL YOU HOW TO REPORT
THESE DISTRIBUTIONS FOR FEDERAL INCOME TAX PURPOSES.
The Fund’s
Year-to-date Cumulative Total Return for fiscal year 2023 (January 1, 2023 through April 30, 2023) is set forth below. Shareholders should take note of the
relationship between the Year-to-date Cumulative Total Return with the Fund’s Cumulative Distribution Rate for 2023. In addition, the Fund’s Average Annual
Total Return for the five-year period ending April 30, 2023 is set forth below. Shareholders should note the relationship between the Average Annual Total Return with the Fund’s Current Annualized Distribution Rate for 2023. The
performance and distribution rate information disclosed in the table is based on the Fund’s net asset value per share (NAV). The Fund’s NAV is calculated as the total market value of all the securities and other assets held by the Fund
minus the total liabilities, divided by the total number of shares outstanding. While NAV performance may be indicative of the Fund’s investment performance, it does not measure the value of a shareholder’s individual investment in the
Fund. The value of a shareholder’s investment in the Fund is determined by the Fund’s market price, which is based on the supply and demand for the Fund’s shares in the open market.
280 Park Avenue, New York, NY 10017-1216 Tel: 212.832.3232 Fax:
212-832-3622
Fund Performance and Distribution Rate Information:
|
|
|
|
|
| Year-to-date
January 1, 2023 to April 30, 2023 |
|
| Year-to-date Cumulative Total Return1 |
|
|
1.25 |
% |
|
Cumulative Distribution Rate2 |
|
|
3.43 |
% |
| |
|
|
|
|
| Five-year period ending April 30, 2023 |
|
| Average
Annual Total Return3 |
|
|
6.94 |
% |
| Current
Annualized Distribution Rate4 |
|
|
8.23 |
% |
| 1. |
Year-to-date Cumulative
Total Return is the percentage change in the Fund’s NAV over the year-to-date time period including distributions paid and assuming reinvestment of those
distributions. |
| 2. |
Cumulative Distribution Rate for the Fund’s current fiscal period (January 1, 2023 through May 31,
2023) measured on the dollar value of distributions in the year-to-date period as a percentage of the Fund’s NAV as of April 30, 2023. |
| 3. |
Average Annual Total Return represents the compound average of the Annual NAV Total Returns of the Fund for
the five-year period ending April 30, 2023. Annual NAV Total Return is the percentage change in the Fund’s NAV over a year including distributions paid and assuming reinvestment of those distributions. |
| 4. |
The Current Annualized Distribution Rate is the current fiscal period’s distribution rate annualized as
a percentage of the Fund’s NAV as of April 30, 2023. |
This Fund has a managed distribution policy that seeks
to deliver the Fund’s long term total return potential through regular monthly distributions declared at a fixed rate per share. Distributions may be paid in part or in full from net investment income, realized capital gains and by returning
capital, or a combination thereof. Shareholders should note, however, that if the Fund’s aggregate net investment income and net realized capital gains are less than the amount of the distribution level, the difference will be distributed from
the Fund’s assets and will constitute a return of the shareholder’s capital. A return of capital is not taxable; rather it reduces a shareholder’s tax basis in his or her shares of the Fund. The Board of Directors of the Fund may
amend, terminate or suspend the managed distribution policy at any time, which could have an adverse effect on the market price of the Fund’s shares.
Shareholders should not use the information provided in preparing their tax returns. Shareholders will receive a Form 1099-DIV for the calendar year indicating how to report fund distributions for federal income tax purposes.
Notification of Sources of Distribution
Pursuant to Section 19(a) of the Investment Company Act of 1940
Cohen & Steers REIT and Preferred and Income Fund, Inc. (RNP)
Cohen & Steers REIT and Preferred and Income Fund, Inc. (NYSE: RNP) (the “Fund”), acting in accordance with an exemptive
order received from the Securities and Exchange Commission and with approval of its Board of Directors, adopted a managed distribution policy under which the Fund intends to include long-term capital gains, where applicable, as part of the regular
monthly cash distributions to its shareholders. This policy will give the Fund greater flexibility to realize long-term capital gains and to distribute those gains on a regular monthly basis.
The Board of Directors of the Fund declared a monthly distribution per share for the month of June 2023. Please review the following
information and important disclosures set forth below.
|
|
|
|
|
|
|
| Amount of Distribution |
|
Ex-Dividend Date |
|
Record Date |
|
Payable Date |
| $0.136 |
|
June 13, 2023 |
|
June 14, 2023 |
|
June 30, 2023 |
The following table sets forth the estimated amounts of the current distribution and the cumulative
distributions paid this fiscal year-to-date from the sources indicated in the table. All amounts are expressed per common share.
|
|
|
|
|
|
|
|
|
| DISTRIBUTION ESTIMATES |
|
June 2023 |
|
YEAR-TO-DATE (YTD)
June 30, 2023* |
| Source |
|
Per Share
Amount |
|
% of Current
Distribution |
|
Per Share
Amount |
|
% of 2023
Distributions |
|
Net Investment Income |
|
$0.1360 |
|
100.00% |
|
$0.2070 |
|
25.37% |
|
Net Realized Short-Term Capital Gains |
|
$0.0000 |
|
0.00% |
|
$0.0000 |
|
0.00% |
|
Net Realized Long-Term Capital Gains |
|
$0.0000 |
|
0.00% |
|
$0.6090 |
|
74.63% |
|
Return of Capital (or other Capital Source) |
|
$0.0000 |
|
0.00% |
|
$0.0000 |
|
0.00% |
|
Total Current Distribution |
|
$0.1360 |
|
100.00% |
|
$0.8160 |
|
100.00% |
You should not draw any conclusions about the Fund’s investment performance from the amount of this
distribution or from the terms of the Fund’s managed distribution policy. The amounts and sources of distributions reported in this Notice are only estimates, are likely to change over time, and are not being provided for tax reporting
purposes. The actual amounts and sources of the amounts for accounting and tax reporting purposes will depend upon the Fund’s investment experience during the remainder of its fiscal year and may be subject to changes based on tax
regulations. The amounts and sources of distributions year-to-date may be subject to additional adjustments.
*THE FUND WILL SEND YOU A FORM 1099-DIV FOR THE CALENDAR YEAR THAT WILL TELL YOU HOW TO REPORT
THESE DISTRIBUTIONS FOR FEDERAL INCOME TAX PURPOSES.
The Fund’s
Year-to-date Cumulative Total Return for fiscal year 2023 (January 1, 2023 through May 31, 2023) is set forth below. Shareholders should take note of the
relationship between the Year-to-date Cumulative Total Return with the Fund’s Cumulative Distribution Rate for 2023. In addition, the Fund’s Average Annual
Total Return for the five-year period ending May 31, 2023 is set forth below. Shareholders should note the relationship between the Average Annual Total Return with the Fund’s Current Annualized Distribution Rate for 2023. The performance
and distribution rate information disclosed in the table is based on the Fund’s net asset value per share (NAV). The Fund’s NAV is calculated as the total market value of all the securities and other assets held by the Fund minus the total
liabilities, divided by the total number of shares outstanding. While NAV performance may be indicative of the Fund’s investment performance, it does not measure the value of a shareholder’s individual investment in the Fund. The value of
a shareholder’s investment in the Fund is determined by the Fund’s market price, which is based on the supply and demand for the Fund’s shares in the open market.
280 Park Avenue, New York, NY 10017-1216 Tel: 212.832.3232 Fax:
212-832-3622
Fund Performance and Distribution Rate Information:
|
|
|
|
|
| Year-to-date
January 1, 2023 to May 31, 2023 |
|
| Year-to-date Cumulative Total Return1 |
|
|
-1.09 |
% |
|
Cumulative Distribution Rate2 |
|
|
4.25 |
% |
| |
|
|
|
|
| Five-year period ending May 31, 2023 |
|
| Average
Annual Total Return3 |
|
|
6.07 |
% |
| Current
Annualized Distribution Rate4 |
|
|
8.49 |
% |
| 1. |
Year-to-date Cumulative
Total Return is the percentage change in the Fund’s NAV over the year-to-date time period including distributions paid and assuming reinvestment of those
distributions. |
| 2. |
Cumulative Distribution Rate for the Fund’s current fiscal period (January 1, 2023 through
June 30, 2023) measured on the dollar value of distributions in the year-to-date period as a percentage of the Fund’s NAV as of May 31, 2023.
|
| 3. |
Average Annual Total Return represents the compound average of the Annual NAV Total Returns of the Fund for
the five-year period ending May 31, 2023. Annual NAV Total Return is the percentage change in the Fund’s NAV over a year including distributions paid and assuming reinvestment of those distributions. |
| 4. |
The Current Annualized Distribution Rate is the current fiscal period’s distribution rate annualized as
a percentage of the Fund’s NAV as of May 31, 2023. |
This Fund has a managed distribution policy that seeks to
deliver the Fund’s long term total return potential through regular monthly distributions declared at a fixed rate per share. Distributions may be paid in part or in full from net investment income, realized capital gains and by returning
capital, or a combination thereof. Shareholders should note, however, that if the Fund’s aggregate net investment income and net realized capital gains are less than the amount of the distribution level, the difference will be distributed from
the Fund’s assets and will constitute a return of the shareholder’s capital. A return of capital is not taxable; rather it reduces a shareholder’s tax basis in his or her shares of the Fund. The Board of Directors of the Fund may
amend, terminate or suspend the managed distribution policy at any time, which could have an adverse effect on the market price of the Fund’s shares.
Shareholders should not use the information provided in preparing their tax returns. Shareholders will receive a Form 1099-DIV for the calendar year indicating how to report fund distributions for federal income tax purposes.
Cohen and Steers REIT an... (NYSE:RNP)
과거 데이터 주식 차트
부터 4월(4) 2024 으로 5월(5) 2024

Cohen and Steers REIT an... (NYSE:RNP)
과거 데이터 주식 차트
부터 5월(5) 2023 으로 5월(5) 2024
