U.S. SECURITIES AND EXCHANGE COMMISSION
Washington, D.C. 20549
FORM 6-K
REPORT OF FOREIGN PRIVATE ISSUER
PURSUANT TO RULE 13a-16 OR 15d-16 UNDER THE
SECURITIES EXCHANGE
ACT OF 1934
For the Month of July 2023
Nexa Resources S.A.
(Exact Name as Specified in its Charter)
N/A
(Translation of Registrant’s Name)
37A, Avenue J.F. Kennedy
L-1855, Luxembourg
Grand Duchy of Luxembourg
(Address of principal executive offices)
Indicate by check mark
whether the registrant files or will file annual reports under cover Form 20-F or Form 40-F.
Indicate by check mark
if the registrant is submitting the Form 6-K in paper as permitted by Regulation S-T Rule 101(b)(1): ____
Indicate by check mark
if the registrant is submitting the Form 6-K in paper as permitted by Regulation S-T Rule 101(b)(7): ____
Indicate by check mark
whether by furnishing the information contained in this Form, the registrant is also thereby furnishing the information to the Commission
pursuant to Rule 12g3-2(b) under the Securities Exchange Act of 1934.
If “Yes” is marked,
indicate below the file number assigned to the registrant in connection with Rule 12g3-2(b): Not applicable.
SIGNATURES
Pursuant to the requirements
of the Securities Exchange Act of 1934, the registrant has duly caused this report to be signed on its behalf by the undersigned, thereunto
duly authorized.
Date: July 27, 2023
| Nexa Resources S.A. |
| By:/s/ José Carlos del Valle |
| Name: José Carlos del Valle |
|
Title: Senior Vice President of
Finance and Group Chief Financial Officer
|
| |
| |
EXHIBIT INDEX

Nexa Reports Second
Quarter 2023 Results including Adjusted EBITDA of US$72 Million
Luxembourg, July
27, 2023 – Nexa Resources S.A. (“Nexa Resources”, “Nexa”, or “Company”)
announces today its results for the three months ended June 30, 2023.
CEO Message – Ignacio
Rosado
“In 2Q23, we experienced an increasingly
volatile macroeconomic environment, driven by persistent U.S. inflation in some important sectors, and concerns about the Chinese economy,
where relevant indicators such as the property sector and GDP, came in below expectations. These factors put downward pressure on base
metal prices, with zinc prices falling 19% and copper 5% compared to 1Q23.
As we anticipated in the previous quarter,
some of these headwinds are persisting and continue to weigh on metal prices and our business.
Although we expect LME prices to remain
under pressure, we remain committed to financial discipline, evidenced by a portfolio of initiatives focused on cost reduction, plus CAPEX
and working capital optimization which are being implemented, and are among our priorities for the year. These initiatives have allowed
us to achieve positive cash generation in 2Q23. Despite this challenging environment, we are maintaining our production and cash cost
guidance.
From an operational standpoint, we have
made good progress in the completion of the ramp-up phase at Aripuanã, which will contribute to enhancing our operational profile
and cash generation capacity. In 2Q23, importantly, production and capacity utilization increased while concentrates quality also improved.
The zinc concentrate is being processed by our smelters in Brazil, and the copper concentrate is being shipped to an off-taker. In addition,
lead concentrates are also being sold.
Looking ahead, we will remain focused
on completing the ramp up of Aripuanã and taking appropriate measures to maintain a healthy balance sheet. Additionally, we will
continue to advance our mineral exploration plan, the optimization of our portfolio as well as carry on with the studies related to the
Pasco Integration Project, aiming to develop a robust organic strategic option for Nexa.
Lastly, we remain confident in the long-term
fundamentals of our industry and our business. We will continue focusing on safety, productivity and costs control, in order to create
value for all our stakeholders, always prioritizing our ESG commitments.”
Summary of Financial
Performance
| US$ million (except per share amounts) |
2Q23 |
1Q23 |
2Q22 |
1H23 |
1H22 |
| Net revenues |
627 |
667 |
829 |
1,294 |
1,552 |
| Gross profit |
62 |
100 |
273 |
161 |
470 |
| Net income (loss) |
(103) |
(15) |
124 |
(118) |
198 |
| EBITDA (1) |
(44) |
115 |
314 |
71 |
503 |
| Basic and diluted earnings per share ("EPS") |
(0.77) |
(0.15) |
0.82 |
(0.92) |
1.30 |
| Adjusted net income (loss) (1) |
12 |
2 |
112 |
15 |
214 |
| Adjusted EBITDA (1) |
72 |
133 |
302 |
205 |
519 |
| Adjusted basic and diluted EPS (1) |
0.04 |
(0.01) |
0.74 |
0.03 |
1.43 |
| Cash provided by operating activities before working capital (1) (2) |
51 |
106 |
241 |
157 |
468 |
| Capex |
60 |
56 |
98 |
116 |
180 |
| Free cash flows (1) |
34 |
(132) |
29 |
(97) |
(139) |
| Total cash (3) |
421 |
375 |
633 |
421 |
633 |
| Net debt (1) |
1,262 |
1,302 |
1,045 |
1,262 |
1,045 |
| Net Debt/LTM Adj. EBITDA |
2.83x |
1.92x |
1.23x |
2.83x |
1.23x |
(1) Refer
to “Use of Non-IFRS Financial Measures” for further information. Adjusted EBITDA, adjusted net income (loss) and adjusted
EPS, exclude the items presented in the “Net income (loss) reconciliation to Adjusted EBITDA” section for further details
on page 12 of this earnings release. For details on segment definition and accounting policy, please refer to explanatory note 2 –
“Information by business segment” in the “Condensed consolidated interim financial statements (unaudited) at and for
the three and six-month periods ended on June 30, 2023”.
(2) Working
capital had a positive impact of US$83 million in 2Q23, totaling negative US$21 million in 1H23. Working capital in 2Q22 had a negative
impact of US$23 million, totaling negative US$179 million in 1H22.
(3) Cash,
cash equivalents and financial investments.
Earnings Release – 2Q23 | |  |
Executive Summary
Operational Performance
| § | Zinc production
of 81kt in 2Q23 rose by 2% compared to 2Q22, mainly explained by the increase in treated ore volume and the start-up of the Aripuanã
operation. Compared to 1Q23, zinc production increased by 8% due to the resumption of the Cerro Lindo mine and the progress of the Aripuanã
ramp-up. |
| § | Run-of-mine mining cost in 2Q23 was US$44/t, in the mid-range of our
guidance for the year and 3% higher when compared to 2Q22. Compared to 1Q23, run-of-mine mining cost decreased by 2%. |
| § | Mining cash cost net of by-products1
in 2Q23 was US$0.37/lb compared with US$0.16/lb in 2Q22. This increase was mainly
due to lower by-products contribution driven by lower LME prices, and higher treatment charges (“TCs”). Compared to 1Q23,
mining cash cost net of by-products decreased by 14% from US$0.43/lb explained by higher by-products contribution due to higher lead and
copper concentrate volumes. |
| § | The smelting segment delivered metal production of 148kt, down by 6%
from 2Q22, mainly driven by lower volumes in Cajamarquilla and Três Marias. Compared to 1Q23, production was up 1%. |
| § | In 2Q23, zinc metal and oxide sales were 149kt, down by 2% from 2Q22
following lower production volumes. Compared to 1Q23, metal sales grew 4%, driven by higher production volumes and sales strategy in line
with working capital improvement initiatives. |
| § | Smelting conversion cost was US$0.31/lb in 2Q23 compared with US$0.29/lb
in 2Q22 due to higher maintenance, energy expenses and other variable costs, which was partially offset by lower third-party services.
Compared to 1Q23, conversion cost was flat. |
| § | Smelting cash cost1 was US$1.12/lb in 2Q23 compared with
US$1.46/lb in 2Q22 and compared with US$1.25 in 1Q23. In both periods, the decrease was mainly explained by lower zinc prices. |
Aripuanã
| § | Ramp-up activities are progressing well and are currently focused on steadily
increasing the plant throughput rate, asset reliability, and reduction of plant downtime, as well as improving metal recoveries and concentrate
grades and quality while consuming our ore stockpile inventory. At the end of 2Q23, the plant reached 76%² of nameplate capacity
(vs. 50% in 1Q23), while the average utilization rate in 2Q23 was 66%. The plant downtime reduced significantly from 394 hours in March
to 148 hours in June, a 62% reduction. In 2Q23, recovery rates improved compared to 1Q23, with zinc recovery averaging
63% in June compared to 48% in March. Concentrates grades are also improving. Zinc concentrates average grade reached 52% in 2Q23 and
the concentrate is being processed by our smelters in Brazil. For the upcoming quarters, we expect to conclude the adjustments related
to the bottlenecks in the pumping and piping systems mentioned in the previous quarter, and further improve the recovery and concentrate
grades. This would allow us to reach approximately 80-85% of the nameplate capacity in 3Q23, paving the way to expected operations above
90% in 4Q23. |
1
Our cash cost net of by-products credits is measured with respect to zinc sold.
2 The percentage considers impact from plant downtime (hours) in the
referred period.
 | 2 |
Earnings Release – 2Q23 | | |
Financial Performance
| § | Net revenues in 2Q23 were US$627 million compared with US$829 million
in 2Q22, mainly due to lower LME metal prices and, to a lesser extent, smelting sales volume. Compared to 1Q23, net revenues decreased
by 6% as a result of lower LME metal prices, partially offset by higher mining production and metal sales volumes. In 1H23, net revenues
amounted to US$1,294 million, down 17% compared to the same period a year ago. |
| § | Adjusted EBITDA3
in 2Q23 was US$72 million, compared with US$302 million in 2Q22 and US$133 million
in 1Q23. This decrease was mainly driven by lower LME metal prices (Zn down 35% vs 2Q22 and 19% vs 1Q23). In 1H23, Adjusted EBITDA amounted
to US$205 million, down 61% compared to the same period a year ago. |
| § | Adjusted EBITDA for the mining segment in 2Q23 was US$20 million compared
with US$42 million in 1Q23. This decrease was mainly driven by lower LME metal prices and higher TCs, higher operational costs mainly
related to concentrate and stockpile costs in Aripuanã and exchange rate effect, which were partially offset by higher sales volume
in Cerro Lindo and Aripuanã, and higher by-products contribution. Compared to 2Q22, Adjusted EBITDA decreased by 88%. |
| § | Adjusted EBITDA for the smelting segment in 2Q23 was US$51 million compared
with US$89 million in 1Q23. This decrease was mainly driven by the negative net price effect related to changes in market prices resulting
in quotation period adjustments, the negative impact of slightly higher freight and sales expenses, higher third-party services and maintenance
expenses mainly related to the scheduled maintenance in Três Marias. These were partially offset by the positive hedge variation
and higher by-products contribution. Compared to 2Q22, Adjusted EBITDA decreased by 64%. |
| § | In 2Q23, net loss was US$103 million, totaling US$118
million in 1H23, resulting in losses per share of US$0.77 and
US$0.92, respectively. |
| § | Adjusted
net income in 2Q23, was US$12 million, totaling US$15 million in 1H23. Adjusted net income attributable
to Nexa’s shareholders was US$6 million in 2Q23 and US$4 million in 1H23, resulting in adjusted
EPS of US$0.04 and US$0.03, respectively. |
Financial Position,
Investments and Financing
| § | Total cash4
at June 30, 2023, increased to US$421 million from US$375 million at March 31, 2023.
Our current available liquidity remains at US$721 million, including our revolving credit facility of US$300 million. |
| § | In 2Q23, our free cash flow generation was positive US$34 million, mainly
due to the positive impact of working capital changes of US$83 million, as a result of decrease in inventories and trade accounts receivables
and increase of confirming payables, partially offset by the decrease in trade payables, which was partially offset by investments in
sustaining CAPEX (including HSE investments) in the amount of US$60 million, including US$16 million in Aripuanã. Refer to our
“Net cash flows from operating activities excluding working capital changes and free cash flow - Reconciliation” section for
further details. |
3
Adjusted EBITDA exclude the items presented in the “Net income (loss) reconciliation to Adjusted EBITDA” section on page 12
of this earnings release – US$115 million in 2Q23, totaling US$133 million in 1H23.
4
Cash and cash equivalents and financial investments.
| | 3 |
Earnings Release – 2Q23 | | |
| § | Net debt to Adjusted EBITDA ratio for the last twelve months (“LTM”)
increased to 2.83x compared with 1.92x at the end of March 2023 and 1.23x at the end of 2Q22. The increase was mainly due to lower LTM
Adjusted EBITDA, impacted in part by lower metal prices. |
Environmental,
Social and Governance (“ESG”) and Corporate Highlights
| § | In the last week of June, Nexa informed that production at the Atacocha
San Gerardo open pit mine was temporarily suspended due to protest activities by local communities. The communities were illegally blocking
access to the mine and claiming rights over areas registered as the property of Nexa Atacocha. Nexa is complying with all existing agreements,
pursuing an active dialogue with the community and authorities for a peaceful resolution of this situation and continuing to reinforce
its commitment to the social development of all its host communities. |
| § | In June 2023, at the Annual General Meeting, Mr. Hilmar Rode was approved
as an independent director of the Company for a term starting as of June 22, 2023, and ending at the 2024 annual general meeting of the
shareholders. Mr. Rode has over 30 years of experience in the global mining, materials, chemicals, and industrial gases industries. Mr.
Rode has been the CEO of Sibelco Group since September 2020. |
| § | In
May 2023, Nexa released its 2022 Annual Sustainability Report, which provides detailed information
on the company’s main economic, financial, environmental, and social results achieved
throughout 2022. The document is available at: (https://www.nexaresources.com/en/esg/performance/).
Information contained on our website is not incorporated by reference into this Earnings
Release, and you should not consider it to be part of this Earnings Release. |
| § | In April 2023, we, along with one of our local suppliers, committed
to reducing CO2 emissions by using natural gas to replace diesel fuel in vehicles that transport materials at mining sites in Peru, in
line with our commitments to decarbonize our value chain. Currently, 25% of the fleet of 20 trucks are already operating using natural
gas, and our goal is for our fleet to achieve 100% of vehicles using natural gas. With this first step we expect to reduce approximately
23 tons of CO2 emitted by our vehicles annually. |
| § | We have obtained the authorization from the Regional Superintendence
for the Environment of the State of Minas Gerais to use biofuel to replace fossil fuels, used in all 47 furnaces in the zinc oxide operation
in Três Marias. During the quarter we made progress by increasing bio-oil consumption in 3 zinc oxide process furnaces. By the end
of the year, our goal is to expand the use of biofuel to 12 furnaces at the Três Marias smelter. |
| § | The Global Mining Industry Risk Management (“GMIRM”) Program,
developed in partnership with the University of São Paulo (“USP”), expanded its scope in 2023 through offering training
to operational coordinators and supervisors. By the end of June 2023, 230 leaders have been trained across 10 courses, with the goal of
engaging our operational teams by enhancing our commitment to Health, Safety and Environment (HS&E) efforts. |
| § | Nexa partnered with Amazon Web Services with the goal of training 100,000
individuals in cloud computing fundamentals in Brazil and Peru by 2025, creating opportunities for skills development and nurturing local
talents. |
| § | In July 2023, we registered our carbon emissions on “LMEpassport”,
the London Metal Exchange platform that promotes sustainability and transparency across the base metals sector. Nexa’s zinc production
has one of the lowest carbon footprints recorded in the sector, with an emission intensity of 0.36 tons of CO2 equivalent (scopes 1 and
2) according to the GHG protocol methodology, an achievement that positions Nexa as a global leader in carbon reduction within the zinc
industry. |
| | 4 |
Earnings Release – 2Q23 | | |
Growth Strategy
and Asset Portfolio
§
We have been focused on free cash flow generation and we continue to evaluate our capital allocation
framework to ensure that Nexa’s capital is appropriately allocated to the highest return assets.
§
Our strategic review of our assets continues along with initiatives to optimize the portfolio.
We continue to assess risk-return alternatives for our Magistral copper project in Peru and our Morro Agudo mine and Bonsucesso project
in Brazil and, in the meantime, we have recorded an impairment against these two assets this quarter.
§
We are progressing the technical studies of the Pasco integration project, aiming to develop
a robust organic growth option for Nexa. The project has the potential to unlock important value for Nexa through economies of scale,
costs improvements and extension of the life of the asset.
§
In addition to our greenfield exploration focused on organic growth, we have been selectively
evaluating certain minor assets and certain other potential external growth alternatives for Nexa, such as our investment in Tinka Resources
Limited.
Outlook
Production, Sales
and Cash Cost Guidance
| § | As of the date of this report, in 2023, Nexa has experienced disruptions
to production, sales, and its supply chain due to community blockages and weather conditions related to the rainy season and/or climate
change. |
| § | Nexa will continue to monitor risks associated with global supply chain
disruptions, which could be exacerbated, among other factors, by the ongoing Russia-Ukraine war, unusual weather conditions and/or increased
restrictions related to the COVID-19 pandemic; the global recession, and the potential impact on the demand for our products; inflationary
cost pressure; metal prices; and community protests, political situation and changes to the regulatory framework in the countries in which
we operate that could affect our production levels and our costs. Refer to “Risks and Uncertainties” and “Cautionary
Statement on Forward-Looking Statements” for further information. |
| § | Nexa reiterates its 2023 production guidance for all metals. Zinc metal
sales, consolidated cash cost for mining and smelting, capital expenditures, exploration, project evaluation and other expenses are outlined
below. |
| o | Cerro Lindo: we expect to increase production in 3Q23 due to renewed
access to the high-grade areas that were restricted in 2Q23 after the rainfall-related shutdown in mid-March (due to the effects of cyclone
Yaku), which impacted the mine development. These areas are currently in the process of preparation and will be prioritized in the upcoming
quarters. |
| o | El Porvenir: based on mine sequencing, zinc production in 3Q23 is expected
to remain at a similar level to the average in 2Q23. Lead and silver production are also expected to increase, due to estimated higher
average head grades. |
| o | Atacocha: zinc production is estimated to decrease in 3Q23 compared
to 2Q23 due to illegal protest activities that started at the end of June and ceased as of the date of this release. |
| o | Vazante: ore throughput in 3Q23 is expected to be higher than 2Q23,
and zinc production is expected to follow the same trend, given the scheduled maintenance (mill replacement) that took place in 2Q23,
which is expected to further improve the plant performance in the upcoming months (the capacity of the new mill is expected to increase
by 5-10%). |
| o | Morro Agudo: zinc production in 3Q23 is expected to remain at a similar
level to the average of 2Q23. Lead production is expected to decrease compared to 2Q23, due to the estimated lower average head grade. |
| | 5 |
Earnings Release – 2Q23 | | |
| o | Aripuanã: the ramp-up phase is expected to continue to progress
in 3Q23. The annual production guidance continues to be expected on the low end of the guidance range and remains subject to risks around
the ramp-up of the mine, among other factors. |
| § | Zinc metal sales guidance also remains unchanged at 580-605kt. |
| o | Peru: we expect production in 3Q23 at Cajamarquilla to be at a similar
level to the average in 2Q23. |
| o | Brazil: in Três Marias we expect production to increase in 3Q23
following production stability, while Juiz de Fora production is anticipated to be slightly lower due to scheduled maintenance in the
next quarter. |
| § | Nexa also estimates that 2023 consolidated cash cost guidance for its
mining and smelting segments will be achieved. |
| o | Mining and smelting volumes are expected to increase in 3Q23 compared
to 2Q23 and remain in the guidance ranges, as noted above. |
| o | Continuous improvements in operational efficiency and cost management
are expected to offset some of the ongoing inflationary pressures. Certain initiatives are already being implemented in the Aripuanã
mine and in the Peruvian mines. |
| o | We do not expect significant changes in commodity prices in 3Q23 from
current levels. Nexa’s C1 cash cost is sensitive to by-product prices and volumes, which may affect the results of our final costs. |
| o | Foreign exchange rates assumptions are maintained (BRL/USD: 5.07 and
Soles/USD: 3.94). |
| o | Zinc TCs assumptions for the year of US$285/t remain unchanged. |
Mining segment – production
| Mining production |
|
1H23 |
|
2023e |
| (Metal in concentrate) |
|
| |
|
|
|
|
|
|
|
| Zinc |
kt |
|
156 |
|
307 |
- |
351 |
| Cerro Lindo |
|
|
32 |
|
69 |
- |
79 |
| El Porvenir |
|
|
27 |
|
51 |
- |
55 |
| Atacocha |
|
|
4 |
|
9 |
- |
11 |
| Vazante |
|
|
72 |
|
131 |
- |
144 |
| Morro Agudo |
|
|
10 |
|
17 |
- |
23 |
| Aripuanã |
|
|
9 |
|
28 |
- |
40 |
| |
|
|
|
|
|
|
|
| Copper |
kt |
|
15 |
|
31 |
- |
36 |
| Cerro Lindo |
|
|
13 |
|
25 |
- |
28 |
| El Porvenir |
|
|
0.2 |
|
0.2 |
- |
0.3 |
| Aripuanã |
|
|
2.0 |
|
6.3 |
- |
7.8 |
| |
|
|
|
|
|
|
|
| Lead |
kt |
|
31 |
|
56 |
- |
71 |
| Cerro Lindo |
|
|
6 |
|
11 |
- |
13 |
| El Porvenir |
|
|
12 |
|
20 |
- |
26 |
| Atacocha |
|
|
6 |
|
10 |
- |
12 |
| Vazante |
|
|
0.8 |
|
1.1 |
- |
1.2 |
| Morro Agudo |
|
|
3.8 |
|
4.9 |
- |
6.1 |
| Aripuanã |
|
|
2.5 |
|
8.9 |
- |
12.9 |
| |
|
|
|
|
|
|
|
| Silver |
MMoz |
|
5.0 |
|
9 |
- |
11 |
| Cerro Lindo |
|
|
1.6 |
|
3.5 |
- |
3.8 |
| El Porvenir |
|
|
2.2 |
|
3.7 |
- |
4.5 |
| Atacocha |
|
|
0.7 |
|
1.0 |
- |
1.2 |
| Vazante |
|
|
0.3 |
|
0.3 |
- |
0.4 |
| Aripuanã |
|
|
0.2 |
|
0.8 |
- |
1.2 |
| | 6 |
Earnings Release – 2Q23 | | |
Smelting segment – sales
| Smelting sales |
|
1H23 |
|
2023e |
| |
|
|
|
|
|
|
|
| Metal Sales |
kt |
|
293 |
|
580 |
- |
605 |
| Zinc metal |
|
|
276 |
|
545 |
- |
565 |
| Zinc oxide |
|
|
17 |
|
35 |
- |
40 |
Cash Costs
| Mining Operating costs |
|
Cost ROM
(US$/t) |
|
Cash Cost
(US$/lb) |
|
Cost ROM
(US$/t) |
|
Cash Cost
(US$/lb) |
| |
|
|
|
| |
1H23 |
|
1H23 |
|
2023e |
|
2023e |
| |
|
|
|
|
|
|
|
|
|
|
|
|
| Mining (1) |
|
44.5 |
|
0.40 |
|
43.9 |
- |
46.4 |
|
0.49 |
- |
0.54 |
| Cerro Lindo |
|
39.7 |
|
(0.08) |
|
40.1 |
- |
42.1 |
|
0.11 |
- |
0.13 |
| El Porvenir |
|
61.6 |
|
0.28 |
|
57.3 |
- |
60.7 |
|
0.39 |
- |
0.42 |
| Atacocha |
|
34.0 |
|
(0.60) |
|
33.1 |
- |
35.4 |
|
0.26 |
- |
0.30 |
| Vazante |
|
56.2 |
|
0.62 |
|
57.2 |
- |
59.0 |
|
0.68 |
- |
0.74 |
| Morro Agudo |
|
33.1 |
|
0.96 |
|
35.0 |
- |
38.2 |
|
1.02 |
- |
1.18 |
(1) C1 Weighted Cash cost net
of by-products credits is measured with respect to zinc sold per mine.
| Smelting Operating costs |
|
Conversion cost
(US$/lb) |
|
Cash Cost
(US$/lb) |
|
Conversion cost
(US$/lb) |
|
Cash Cost
(US$/lb) |
| |
|
|
|
| |
1H23 |
|
1H23 |
|
2023e |
|
2023e |
| |
|
|
|
|
|
|
|
|
|
|
|
|
| Smelting (2) |
|
0.31 |
|
1.19 |
|
0.29 |
- |
0.32 |
|
1.13 |
- |
1.18 |
| Cajamarquilla |
|
0.29 |
|
1.12 |
|
0.27 |
- |
0.29 |
|
1.11 |
- |
1.15 |
| Três Marias |
|
0.25 |
|
1.26 |
|
0.27 |
- |
0.30 |
|
1.10 |
- |
1.15 |
| Juiz de Fora |
|
0.49 |
|
1.29 |
|
0.45 |
- |
0.49 |
|
1.27 |
- |
1.37 |
(2) C1 Weighted Cash cost net
of by-products credits is measured with respect to zinc sold per smelter.
| § | Mining C1 cash cost of US$0.40/lb in 1H23 was lower than our 2023 guidance
driven primarily by Cerro Lindo and Atacocha. For reference, please see the section “Business performance – Mining segment”. |
| § | Smelting C1 cash cost of US$1.19/lb in 1H23 was slightly higher than
our 2023 guidance. This was mainly related to lower by-products credits in the period, driven by lower LME metal prices. Smelting C1 cash
in 2Q23 was within the guidance range. |
| | 7 |
Earnings Release – 2Q23 | | |
Capital Expenditures
(“CAPEX”) Guidance
| § | Nexa invested US$60 million in 2Q23, totaling US$116 million in 1H23.
All of the investment was classified as sustaining, which includes capex to sustain operations, HS&E and mine development. |
| § | At Aripuanã, sustaining capex in 2Q23 accounted for US$16 million,
totaling US$31 million in 1H23. Of this amount, US$4 million was invested in mine development in the quarter, totaling US$11 million in
1H23. |
| § | The Brazilian real appreciation against the U.S. dollar had a negative
impact of US$1.7 million in the quarter, totaling a negative impact of US$0.9 million in 1H23. |
| § | 2023 CAPEX guidance remains unchanged to date, however, in view of the challenged
scenario regarding lower prices, the company has been implementing initiatives to optimize capital allocation, which may generate a downward
revision of the CAPEX guidance in 2H23. |
| CAPEX |
|
1H23 |
|
2023e |
| (US$ million) |
|
|
| Expansion projects (1) |
|
(1) |
|
7 |
| |
|
|
|
|
| Non-Expansion |
|
123 |
|
303 |
| Sustaining (2) |
|
115 |
|
268 |
| HSE |
|
7 |
|
26 |
| Others (3) |
|
2 |
|
10 |
| Reconciliation to Financial Statements (4) |
|
(6) |
|
- |
| TOTAL |
|
116 |
|
310 |
(1) Including
Vazante deepening, among other several projects to improve operational performance. The negative impact in 1H23 refers to provisions not
reversed in the period.
(2) Investments
in tailing dams are included in sustaining expenses.
(3) Modernization,
IT and others.
(4) The
amounts are mainly related to capitalization of interest net of advanced payments for imported materials and tax credits.
Exploration &
Project Evaluation and Other Expenses Guidance
| § | In 2Q23 we invested US$21 million in exploration and project evaluation,
totaling US$42 million in 1H23. |
| § | Total planned exploration and project evaluation expenditures are expected
to be US$110 million in 2023 and remain unchanged at this date. |
| § | As part of our long-term strategy, we will maintain our efforts to replace
and increase mineral reserves and resources. We expect to continue advancing with our exploration activities, primarily focusing on identifying
new ore bodies and upgrading resources classification through infill drilling campaigns. |
| Other Operating Expenses |
|
1H23 |
|
2023e |
| (US$ million) |
|
|
| Exploration |
|
26 |
|
55 |
| Mineral Exploration |
|
16 |
|
33 |
| Mineral rights |
|
3 |
|
7 |
| Sustaining (mine development) |
|
7 |
|
15 |
| |
|
|
|
|
| Project Evaluation |
|
16 |
|
55 |
| Três Marias Project |
|
6 |
|
20 |
| |
|
|
|
|
| Exploration & Project Evaluation |
|
42 |
|
110 |
| |
|
|
|
|
| Other |
|
6 |
|
25 |
| Technology |
|
2.5 |
|
10 |
| Communities |
|
3.3 |
|
15 |
Note: Exploration and project evaluation expenses
consider several stages of development, from mineral potential definition, R&D, and subsequent scoping and pre-feasibility studies
(FEL1 and FEL2).
| | 8 |
Earnings Release – 2Q23 | | |
Earnings Release
– 2Q23
This Earnings Release should be read
in conjunction with the Condensed consolidated interim financial statements (unaudited) at and for the three and six-month periods ended
on June 30, 2023. This document contains forward-looking statements.
Table of contents
| Consolidated performance |
10 |
| Business performance – Mining |
15 |
| Business performance – Smelting |
27 |
| Liquidity and Indebtedness |
34 |
| Cash flows |
35 |
| Others |
36 |
| Market scenario |
37 |
| Risks and Uncertainties |
39 |
| Use of Non-IFRS Financial Measures |
40 |
| Cautionary Statement on Forward-Looking Statements |
42 |
| Appendix |
44 |
UPCOMING EVENT
Earnings Conference
Call
Date: Friday, July 28, 2023 –
9:00am (EST)
Dial In
US: +1-844-763-8274
Canada: +1-647-484-8814
Brazil: +55 11 3181-8565
International: +1-412-717-9224
Conference ID: Nexa Resources
Live audio webcast with slide presentation
will be available on:
https://ir.nexaresources.com
| | 9 |
Earnings Release – 2Q23 | | |
Consolidated performance
Selected financial
information
US$ million
(excepted indicated otherwise) |
2Q23 |
1Q23 |
2Q22 |
1H23 |
1H22 |
| |
|
|
|
|
|
| Net Revenues |
627 |
667 |
829 |
1,294 |
1,552 |
| Mining |
268 |
268 |
370 |
536 |
692 |
| Smelting |
465 |
543 |
683 |
1,008 |
1,245 |
| Intersegment results | Adjustments |
(107) |
(144) |
(224) |
(250) |
(385) |
| |
|
|
|
|
|
| Cost of Sales |
(565) |
(568) |
(556) |
(1,133) |
(1,081) |
| Mining |
(256) |
(243) |
(216) |
(499) |
(409) |
| Current Operations |
(195) |
(202) |
(216) |
(398) |
(409) |
| Aripuanã |
(60) |
(41) |
0 |
(101) |
0 |
| Smelting |
(415) |
(469) |
(566) |
(884) |
(1,069) |
| Intersegment results | Adjustments |
106 |
144 |
226 |
250 |
397 |
| |
|
|
|
|
|
| Selling, general and administrative |
(33) |
(28) |
(37) |
(61) |
(73) |
| Mining |
(14) |
(15) |
(17) |
(29) |
(32) |
| Smelting |
(16) |
(15) |
(15) |
(31) |
(30) |
| Intersegment results | Adjustments |
(3) |
1 |
(5) |
(1) |
(11) |
| |
|
|
|
|
|
| Depreciation and amortization |
72 |
72 |
74 |
143 |
140 |
| Mining |
53 |
53 |
51 |
105 |
96 |
| Smelting |
19 |
19 |
22 |
38 |
41 |
| Intersegment results | Adjustments |
0 |
0 |
1 |
0 |
3 |
| |
|
|
|
|
|
| Adjusted EBITDA (1) |
72 |
133 |
302 |
205 |
519 |
| Mining |
20 |
42 |
162 |
61 |
298 |
| Smelting |
51 |
89 |
140 |
140 |
222 |
| Intersegment results | Adjustments |
1 |
2 |
0 |
3 |
(1) |
| Adj. EBITDA margin (%) |
11.4% |
19.9% |
36.5% |
15.8% |
33.5% |
| |
|
|
|
|
|
| Net income (loss) |
(103) |
(15) |
124 |
(118) |
198 |
| Attributable to Nexa's shareholders |
(102) |
(20) |
109 |
(122) |
172 |
| Attributable to non-controlling interests |
(0) |
4 |
15 |
4 |
26 |
| |
|
|
|
|
|
| Basic and diluted EPS |
(0.77) |
(0.15) |
0.82 |
(0.92) |
1.30 |
| |
|
|
|
|
|
| Adjusted net income (loss) (1) |
12 |
2 |
112 |
15 |
214 |
| Attributable to Nexa's shareholders |
6 |
(1) |
98 |
4 |
189 |
| Attributable to non-controlling interests |
7 |
4 |
14 |
10 |
25 |
| |
|
|
|
|
|
| Adjusted basic and diluted EPS (1) |
0.04 |
(0.01) |
0.74 |
0.03 |
1.43 |
(1) Refer to “Use of Non-IFRS Financial
Measures” for further information. Adjusted EBITDA, adjusted net income (loss) and adjusted EPS, exclude the items presented in
the “Net income (loss) reconciliation to Adjusted EBITDA” section for further details on page 12 of this earnings release.
For details on segment definition and accounting policy, please refer to explanatory note 2 – “Information by business segment”
in the “Condensed consolidated interim financial statements (unaudited) at and for the three and six-month periods ended on June
30, 2023”.
| | 10 |
Earnings Release – 2Q23 | | |
Net revenues
In 2Q23, net revenues were US$627 million,
24% lower year-over-year, primarily due to lower LME metal prices and smelting sales volume. The LME average price for zinc, copper, and
lead was down by 35%, 11% and 4%, respectively, compared to the same period in 2022 – for more information, regarding the decrease,
refer to the “Market Scenario” section.
Compared to 1Q23, net revenues decreased
by 6% reflecting lower LME metal prices, which was partially offset by higher mining production and metal sales volumes.
In 1H23, net revenues amounted to US$1,294
million, down 17% compared to the same period a year ago, as a result of lower LME metal prices across all base metals, which was partially
offset by higher zinc mining production and higher metal sales volume.
Cost of sales
In 2Q23, cost of sales amounted to US$565
million, up 2% year-over-year. The higher cost is primarily related to the mining segment, particularly by Aripuanã cost of sales,
given the mine is still in the ramp-up phase. Compared to 1Q23, cost of sales remained relatively flat, impacted by higher mining production
volumes and smelting sales, which was offset by lower LME metal prices, positively impacting the purchase of the zinc concentrate in our
smelting segment.
In 1H23, cost of sales amounted to US$1,133
million, up 5% compared to the same period a year ago, mainly due to the above-mentioned reasons.
Mineral exploration
and project evaluation
In 2Q23, mineral exploration and project
evaluation investments were US$21 million, a decrease compared to 2Q22 (US$24 million), mainly driven by lower mineral exploration expenses,
partially offset by higher project evaluation expenses. In 1H23, mineral exploration and project evaluation investment amounted to US$42
million.
For additional information on our exploration
results in the second quarter of 2023, please refer to our 2Q23 Exploration Report published on July 20, 2023.
SG&A
In 2Q23, SG&A expenses decreased to
US$33 million compared with US$37 million in 2Q22, mainly driven by lower employee benefit expenses, and increased when compared to US$28
million in 1Q23 due to higher third-party services in support areas. In 1H23, SG&A expenses amounted
to US$61 million, down 16% compared to the same period a year ago, partially as a result of our organizational redesign that occurred
in 2022 and lower third-party services in support areas.
Adjusted EBITDA
In 2Q23, Adjusted EBITDA was US$72 million
compared with US$302 million in 2Q22. The main factors that contributed to this decrease year-over-year were (i) the negative net price
effect of US$140 million, primarily related to lower LME metal prices, which was partially offset by the positive effect of variation
in MTM (“mark-to-market”); (ii) the negative impact of US$66 million related to higher operating costs, mainly in Aripuanã
which started operations in 4Q22, and higher energy expenses in the Cajamarquilla smelter; (iii) lower by-products contribution of US$14
million, primarily related to lower sulphuric acid volumes and prices, and lower lead and copper volumes and prices in Cerro Lindo, which
were partially offset by higher volumes of lead in Vazante and Aripuanã; (iv) the negative hedge variation of US$3 million; and
(v) related to the accounting effect regarding Enercan’s deconsolidation, which was partially offset by (vi) lower workers’
participation.
| | 11 |
Earnings Release – 2Q23 | | |

Compared to 1Q23, Adjusted EBITDA decreased
by 46%. This decrease was mainly explained by (i) the negative price effect of US$75 million due to lower LME metal prices; (ii) the negative
impact of US$13 million due to higher operational costs mainly in Aripuanã, related to concentrate and stockpile costs; and (iii)
the negative FX impact of US$7 million, which was partially offset by (iv) higher by-products contribution of US$36 million with the increase
in sales volumes, including Aripuanã, compensating lower prices; and (v) the positive hedge effect of US$11 million.

During 1H23, Adjusted EBITDA was US$205
million compared with US$519 million in the same period a year ago, mainly driven by the aforementioned factors.
Net income (loss) reconciliation
to Adjusted EBITDA
| US$ million |
2Q23 |
1Q23 |
2Q22 |
1H23 |
1H22 |
| Net Income (loss) |
(102.8) |
(15.4) |
123.5 |
(118.2) |
197.7 |
| Depreciation, amortization and depletion |
71.7 |
71.7 |
74.4 |
143.4 |
140.3 |
| Share in the results of associates |
(5.7) |
(5.4) |
0.0 |
(11.1) |
0.0 |
| Net financial results |
26.5 |
39.2 |
74.2 |
65.7 |
63.6 |
| Taxes on income |
(33.5) |
25.1 |
41.8 |
(8.4) |
101.5 |
| EBITDA |
(43.7) |
115.2 |
314.0 |
71.5 |
503.0 |
| Fair value of offtake agreement (2) |
(13.4) |
13.4 |
(28.2) |
(0.0) |
(8.8) |
| Impairment loss of long-lived assets |
57.2 |
0.0 |
0.0 |
57.2 |
0.0 |
| Aripuanã pre-operating expenses and ramp-up impacts (3) |
(3.8) |
5.7 |
18.9 |
1.8 |
28.6 |
| Loss on sale of property, plant and equipment |
1.0 |
0.3 |
(0.1) |
1.3 |
(0.0) |
| Remeasurement in estimates of asset retirement obligations |
1.4 |
(1.5) |
(2.2) |
(0.1) |
(3.7) |
| Energy forward contracts – MTM |
9.7 |
0.0 |
0.0 |
9.7 |
0.0 |
| Provisions – Value added tax ("VAT") discussions |
63.2 |
0.0 |
0.0 |
63.2 |
0.0 |
| Adjusted EBITDA (1) |
71.5 |
133.0 |
302.4 |
204.5 |
519.1 |
(1) Adjusted EBITDA exclude the items presented
above in the “Net income (loss) reconciliation to Adjusted EBITDA”. For details on segment definition and accounting policy,
please refer to explanatory note 2 – “Information by business segment” in the “Condensed consolidated interim
financial statements (unaudited) at and for the three and six-month periods ended on June 30, 2023”.
(2) Refers to the fair value of the financial
instrument related to the “Offtake agreement” described on page 36 of this earnings release.
(3) Management understands that given Aripuanã’s
current post-commissioning and ramp-up phase status, its related expenses are not indicative of the Company’s normal operating activities.
Although, once Aripuanã operation is stabilized and operational at its normal capacity, such effects will no longer be excluded.
| | 12 |
Earnings Release – 2Q23 | | |
Net financial
results
The net
financial results in 2Q23 were an expense of US$27 million compared to US$39 million expense in 1Q23, mainly driven by higher foreign
exchange rate gains and higher financial income (interest on financial investments and cash equivalents), which were partially offset
by higher financial expenses, including interest paid in the factoring program, accrued interest related to our two outstanding corporate
bonds and other financial expenses5.
The foreign
exchange variation had a positive impact of US$27 million versus a positive impact of US$1 million in 1Q23, mainly explained by the 5%
appreciation of the Brazilian real against the U.S. dollar6
in 2Q23 versus the previous quarter.
Excluding the effect of the foreign exchange
variation, the net financial results in 2Q23 were an expense of US$53 million compared to an expense of US$41 million in the previous
quarter.
| US$ thousand |
2Q23 |
1Q23 |
2Q22 |
| |
|
|
|
| Financial income |
6,700 |
5,617 |
8,435 |
| |
|
|
|
| Financial expenses |
(59,363) |
(46,415) |
(40,329) |
| |
|
|
|
| Other financial items, net |
26,149 |
1,573 |
(42,340) |
| Foreign exchange gain (loss) |
26,812 |
1,337 |
(42,548) |
| |
|
|
|
| Net financial result |
(26,514) |
(39,225) |
(74,234) |
| Net financial result excluding FX |
(53,326) |
(40,562) |
(31,686) |
5
For details on financial expenses, please refer to the Legal Matters section of this Earnings Release and explanatory note 1 (b) “Contingent
Liabilities and Provisions – VAT discussions” in the “Condensed consolidated interim financial statements ended on June
30, 2023”.
6
In 2Q23, the Brazilian real / U.S. dollar average exchange rate was R$4.948/US$1.00 compared to R$5.196/US$1.00 in 1Q23.
| | 13 |
Earnings Release – 2Q23 | | |
Net income (loss)
Net loss
was US$103 million in 2Q23 compared to net income of US$124 million in 2Q22 and net loss of US$15 million in 1Q23, mainly driven by the
decrease in operating income when compared to both periods, the recognition of an impairment loss7
and contingent liabilities and provisions. In 1H23, net loss was US$118 million compared to net income
of US$198 million in the same period a year ago.
Excluding the miscellaneous adjustments
presented below and detailed above in the Net income (loss) reconciliation to Adjusted EBITDA section, adjusted net income was US$12 million
in the quarter. In 1H23, adjusted net income totaled US$15 million.
Adjusted net income attributable to Nexa’s
shareholders was US$6 million in 2Q23 and US$4 million in 1H23, resulting in adjusted EPS of US$0.04 and
US$0.03, respectively.
US$ million
(excepted indicated otherwise) |
2Q23 |
1Q23 |
2Q22 |
1H23 |
1H22 |
| Net Income (loss) |
(102.8) |
(15.4) |
123.5 |
(118.2) |
197.7 |
| Attributable to Nexa's shareholders |
(102.5) |
(19.7) |
109.0 |
(122.2) |
172.0 |
| Attributable to non-controlling interests |
(0.3) |
4.3 |
14.5 |
4.0 |
25.7 |
| Basic and diluted earnings (loss) per share |
(0.77) |
(0.15) |
0.82 |
(0.92) |
1.30 |
| |
|
|
|
|
|
| Miscellaneous adjustments |
115.2 |
17.8 |
(11.6) |
133.0 |
16.1 |
| Attributable to Nexa's shareholders |
108.2 |
18.4 |
(11.0) |
126.6 |
17.2 |
| Attributable to non-controlling interests |
7.0 |
(0.6) |
(0.6) |
6.4 |
(1.1) |
| Basic and diluted miscellaneous adjustments per share |
0.82 |
0.14 |
(0.08) |
0.96 |
0.13 |
| |
|
|
|
|
|
| Adjusted net income (loss) |
12.5 |
2.4 |
111.9 |
14.8 |
213.8 |
| Attributable to Nexa's shareholders |
5.7 |
(1.4) |
98.1 |
4.4 |
189.2 |
| Attributable to non-controlling interests |
6.7 |
3.8 |
13.9 |
10.5 |
24.6 |
| Weighted average number of outstanding shares - in thousand |
132,439 |
132,439 |
132,439 |
132,439 |
132,439 |
| Adjusted basic and diluted EPS |
0.04 |
(0.01) |
0.74 |
0.03 |
1.43 |
(1) Miscellaneous adjustments include: (i)
Fair value of offtake agreement; (ii) Impairment loss of long-lived assets; (iii) Aripuanã pre-operating expenses and ramp-up impacts;
(iv) Impairment of other assets; (v) Loss on sale of property, plant and equipment; (vi) Remeasurement in estimates of asset retirement
obligations; (vii) Remeasurement adjustment of streaming agreement; and (viii) Other adjustments.
7
Note: For details on Impairment Loss and Contingent Liabilities and Provisions, please refer to the “Condensed
consolidated interim financial statements (unaudited) ended on June 30, 2023”.
| | 14 |
Earnings Release – 2Q23 | | |
Business Performance
Mining segment
| Consolidated |
|
2Q23 |
1Q23 |
2Q22 |
2Q23 vs. 2Q22 |
1H23 |
1H22 |
1H23 vs. 1H22 |
| Ore Mined |
kt |
3,214 |
2,947 |
3,164 |
1.6% |
6,153 |
5,871 |
4.8% |
| Treated Ore |
kt |
3,546 |
3,131 |
3,174 |
11.7% |
6,677 |
5,927 |
12.7% |
| |
|
|
|
|
|
|
|
|
| Grade |
|
|
|
|
|
|
|
|
| Zinc |
% |
2.72 |
2.92 |
2.88 |
(16 bps) |
2.81 |
2.84 |
(2 bps) |
| Copper |
% |
0.35 |
0.27 |
0.37 |
(2 bps) |
0.31 |
0.35 |
(4 bps) |
| Lead |
% |
0.64 |
0.70 |
0.59 |
5 bps |
0.67 |
0.61 |
6 bps |
| Silver |
oz/t |
1.02 |
1.03 |
1.09 |
(6.5%) |
1.02 |
1.09 |
(5.6%) |
| Gold |
oz/t |
0.005 |
0.005 |
0.005 |
5.6% |
0.005 |
0.005 |
3.5% |
| |
|
|
|
|
|
|
|
|
| Production | metal contained |
|
|
|
|
|
|
|
| Zinc |
kt |
80.7 |
74.8 |
79.2 |
1.9% |
155.5 |
145.5 |
6.9% |
| Copper |
kt |
8.7 |
6.1 |
9.6 |
(9.7%) |
14.7 |
16.5 |
(10.5%) |
| Lead |
kt |
16.0 |
15.2 |
14.2 |
13.0% |
31.2 |
26.5 |
17.5% |
| Silver |
MMoz |
2.6 |
2.4 |
2.6 |
1.5% |
5.0 |
4.8 |
3.0% |
| Gold |
koz |
6.8 |
6.5 |
6.9 |
(0.3%) |
13.3 |
13.2 |
0.7% |
| Zinc Equivalent (1) |
kt |
133.5 |
118.1 |
133.5 |
0.0% |
251.6 |
242.5 |
3.7% |
(1) Consolidated mining production in kt
of zinc equivalent is calculated by converting copper, lead, silver and gold contents to a zinc equivalent grade, assuming 2022 LME average
benchmark prices: Zn: US$1.58/lb; Cu: US$3.99/lb; Pb: US$0.98/lb; Ag: US$21.7/oz; Au: US$1,800/oz.
In 2Q23, treated ore volume was 3,546k
up 12% year-over-year, explained by overall better plant performance in all the mines, except Cerro Lindo, which was 8% lower compared
to 2Q22, but in line with our expectations for the year.
Compared to 1Q23, treated ore volume increased
by 13%, mainly driven by the Aripuanã and Cerro Lindo mines, which were impacted in 1Q23 by challenges related to the pumping and
piping systems bottlenecks and the effects of cyclone Yaku, respectively.
The ore throughput, year-over-year, increased
at El Porvenir (+5%), Atacocha (+15%), Morro Agudo (+24%), while Cerro Lindo decreased by (-8%) and Vazante decreased by (-1%).
Zinc production of 81kt in the quarter
rose by 2% from 2Q22, mainly explained by an increase in treated ore volume and the start-up of Aripuanã mine. Compared with 1Q23,
zinc production rose by 8%, mainly due to the resumption of operations at Cerro Lindo and higher volumes from Aripuanã due to the
progress of the ramp-up phase.
Copper production of 9kt decreased by
10% from 2Q22, as a result of lower head grade in Cerro Lindo. Compared to 1Q23, copper production was 42% higher, mainly driven by Aripuanã
contribution.
Lead production increased 13% year-over-year
and 5% quarter-over-quarter.
In 1H23, treated ore volume increased
by 13% year-over-year to 6,677kt mainly explained by the higher ore throughput at Cerro Pasco, comprising the Atacocha and El Porvenir
operations, in addition to the Aripuanã and Morro Agudo mines. Zinc average grade was down 2bps to 2.81%. Therefore, zinc production
totaled 156kt, 7% higher than in 1H22. Copper production was 10% lower and lead production increased by 17% to 31kt, following higher
average grades.
| | 15 |
Earnings Release – 2Q23 | | |
Cerro Lindo
Cerro Lindo
(100% basis) |
|
2Q23 |
1Q23 |
1H23 |
4Q22 |
3Q22 |
2Q22 |
1Q22 |
1H22 |
| |
|
|
|
|
|
|
|
|
|
| Ore Mined |
kt |
1,595 |
1,254 |
2,850 |
1,581 |
1,558 |
1,698 |
1,425 |
3,124 |
| Treated Ore |
kt |
1,530 |
1,277 |
2,807 |
1,589 |
1,594 |
1,661 |
1,392 |
3,054 |
| |
|
|
|
|
|
|
|
|
|
| Grade |
|
|
|
|
|
|
|
|
|
| |
|
|
|
|
|
|
|
|
|
| Zinc |
% |
1.31 |
1.38 |
1.34 |
1.49 |
1.42 |
1.58 |
1.71 |
1.64 |
| Copper |
% |
0.57 |
0.48 |
0.53 |
0.65 |
0.55 |
0.66 |
0.57 |
0.62 |
| Lead |
% |
0.33 |
0.25 |
0.29 |
0.28 |
0.37 |
0.35 |
0.34 |
0.35 |
| Silver |
oz/t |
0.83 |
0.72 |
0.78 |
0.70 |
0.94 |
0.99 |
0.92 |
0.96 |
| Gold |
oz/t |
0.002 |
0.002 |
0.002 |
0.003 |
0.002 |
0.003 |
0.003 |
0.003 |
| |
|
|
|
|
|
|
|
|
|
| Production | metal contained |
|
|
|
|
|
|
|
| |
|
|
|
|
|
|
|
|
|
| Zinc |
kt |
16.9 |
15.0 |
31.9 |
20.7 |
19.9 |
22.7 |
21.1 |
43.8 |
| Copper |
kt |
7.4 |
5.2 |
12.5 |
9.1 |
7.4 |
9.5 |
6.8 |
16.3 |
| Lead |
kt |
3.6 |
2.1 |
5.7 |
3.2 |
4.7 |
4.4 |
3.4 |
7.8 |
| Silver |
MMoz |
0.9 |
0.6 |
1.6 |
0.8 |
1.1 |
1.2 |
1.0 |
2.2 |
| Gold |
koz |
0.8 |
0.7 |
1.5 |
0.9 |
1.0 |
1.1 |
1.1 |
2.2 |
| |
|
|
|
|
|
|
|
|
|
| Zinc sales |
kt |
17.5 |
14.8 |
32.3 |
19.9 |
19.7 |
22.9 |
23.4 |
46.3 |
| |
|
|
|
|
|
|
|
|
|
| Costs |
|
|
|
|
|
|
|
|
| |
|
|
|
|
|
|
|
|
|
| Cost of sales |
US$ mm |
86.5 |
81.6 |
168.1 |
99.0 |
94.6 |
105.9 |
97.0 |
202.9 |
| Cost ROM (2) |
US$/t |
39.8 |
39.6 |
39.7 |
42.2 |
40.1 |
38.2 |
41.0 |
39.5 |
| Cash cost (1) |
US$/lb |
(0.13) |
(0.02) |
(0.08) |
(0.38) |
0.37 |
(0.59) |
(0.34) |
(0.47) |
| Sustaining cash cost (1) |
US$/lb |
0.15 |
0.23 |
0.19 |
(0.04) |
0.59 |
(0.39) |
(0.19) |
(0.29) |
| |
|
|
|
|
|
|
|
|
|
| CAPEX |
US$ mm |
|
|
|
|
|
|
|
|
| |
|
|
|
|
|
|
|
|
|
| Sustaining |
|
9.4 |
8.0 |
17.3 |
12.8 |
8.6 |
9.4 |
7.3 |
16.7 |
| Other |
|
1.5 |
0.4 |
1.9 |
2.1 |
1.0 |
0.8 |
0.5 |
1.3 |
(1) Our cash cost and sustaining cash cost
are net of by-products credits, measured with respect to zinc sold per mine. For a cash cost reconciliation to COGS, please refer to Appendix
– All in Sustaining Cash Cost | Mining.
(2) Our cost per ROM is measured with respect
to treated ore volume. Refer to “Use of Non-IFRS Financial Measures” for further information.
Zinc production of 17kt decreased by 26%
from 2Q22 and increased by 13% compared to 1Q23.
As previously disclosed, the mine was
partially flooded in March 2023 after heavy rainfall levels and overflowing rivers in the region caused by cyclone Yaku. A rehabilitation
plan was implemented, and operations were resumed at full capacity in April 2023.
| | 16 |
Earnings Release – 2Q23 | | |
Additionally, the mine sequencing plan
was revised and areas with higher grades, which were restricted in 2Q23, will be prioritized in the upcoming quarters, which we expect
to contribute to higher grades resulting in higher zinc production.
Zinc head grade averaged 1.31% in the
quarter, down 28bps and 7bps compared to 2Q22 and 1Q23, respectively.
Copper production of 7kt decreased by
22% compared to 2Q23 and increased by 43% compared to 1Q23. Copper average grade was 0.57%, down 9bps from 2Q22 and up 9bps from 1Q23.
Lead production was 3.6kt, down 17% compared
to 2Q22 and up 73% compared to 1Q23, driven by higher lead average grade (up 8bps to 0.33%), mainly explained by the review of the mining
sequence plan, which focused on areas with higher lead grades.
In the first six months of 2023, zinc
production totaled 32kt, down 27% compared to 1H22, as daily production was reduced in 1Q23. Copper and lead production were down 23%
and 26%, to 13kt and 6kt, respectively, following lower average grades.
Cost
Cost of sales was US$87 million in 2Q23
compared to US$106 million in the same period last year, mainly due to lower volumes, workers participation and lower depreciation and
amortization. Compared to 1Q23, cost of sales increased by 6%, mainly related to higher volumes and higher variable costs.
Run-of-mine mining cost was US$39.8/t
in the quarter, up 4% from 2Q22 due to lower treated ore volumes and was relatively flat compared to 1Q23.
Cash cost net of by-products in 2Q23 increased
to US$(0.13)/lb compared with US$(0.59)/lb in 2Q22, mainly explained by lower volumes and lower by-products contribution, as LME prices
significantly dropped year-over-year. Compared to 1Q23, when the cash cost net of by-products was US$(0.02)/lb, 2Q23 cash cost decreased
due to higher by products contribution, mainly explained by higher copper concentrate volumes, which were partially offset by lower LME
prices.
CAPEX
In 2Q23, sustaining capital expenditures
amounted to US$9.4 million, mainly related to mining development, and other mining infrastructure expenses, totaling US$17 million in
1H23.
El Porvenir
El Porvenir
(100% basis) |
|
2Q23 |
1Q23 |
1H23 |
4Q22 |
3Q22 |
2Q22 |
1Q22 |
1H22 |
| |
|
|
|
|
|
|
|
|
|
| Ore Mined |
kt |
546 |
544 |
1,090 |
551 |
529 |
520 |
513 |
1,034 |
| Treated Ore |
kt |
546 |
544 |
1,090 |
550 |
527 |
521 |
514 |
1,035 |
| |
|
|
|
|
|
|
|
|
|
| Grade |
|
|
|
|
|
|
|
|
|
| |
|
|
|
|
|
|
|
|
|
| Zinc |
% |
2.89 |
2.82 |
2.85 |
2.61 |
2.77 |
2.86 |
2.96 |
2.91 |
| Copper |
% |
0.17 |
0.15 |
0.16 |
0.13 |
0.16 |
0.17 |
0.18 |
0.17 |
| Lead |
% |
1.35 |
1.38 |
1.36 |
1.38 |
1.34 |
1.34 |
1.31 |
1.33 |
| Silver |
oz/t |
2.42 |
2.55 |
2.48 |
2.64 |
2.45 |
2.35 |
2.41 |
2.38 |
| Gold |
oz/t |
0.011 |
0.011 |
0.011 |
0.012 |
0.011 |
0.011 |
0.013 |
0.012 |
| |
|
|
|
|
|
|
|
|
|
| Production | metal contained |
|
|
|
|
|
|
|
| |
|
|
|
|
|
|
|
|
|
| Zinc |
kt |
13.8 |
13.6 |
27.5 |
12.6 |
12.7 |
13.0 |
13.2 |
26.2 |
| Copper |
kt |
0.1 |
0.1 |
0.2 |
0.0 |
0.1 |
0.1 |
0.1 |
0.2 |
| Lead |
kt |
6.0 |
6.2 |
12.2 |
6.3 |
5.8 |
5.7 |
5.4 |
11.1 |
| Silver |
MMoz |
1.1 |
1.2 |
2.2 |
1.2 |
1.0 |
1.0 |
1.0 |
2.0 |
| Gold |
koz |
2.2 |
2.3 |
4.5 |
2.5 |
2.4 |
2.1 |
2.2 |
4.3 |
| |
|
|
|
|
|
|
|
|
|
| Zinc sales |
kt |
14.5 |
14.4 |
28.9 |
12.1 |
12.4 |
14.0 |
13.5 |
27.5 |
| |
|
|
|
|
|
|
|
|
|
| Costs |
|
|
|
|
|
|
|
|
| |
|
|
|
|
|
|
|
|
|
| Cost of sales |
US$ mm |
48.1 |
51.8 |
99.9 |
39.2 |
40.1 |
45.6 |
42.9 |
88.6 |
| Cost ROM (2) |
US$/t |
63.1 |
60.1 |
61.6 |
58.6 |
58.5 |
60.1 |
62.1 |
61.1 |
| Cash cost (1) |
US$/lb |
0.35 |
0.22 |
0.28 |
(0.00) |
0.63 |
0.31 |
0.37 |
0.34 |
| Sustaining cash cost (1) |
US$/lb |
0.65 |
0.64 |
0.65 |
0.63 |
0.98 |
0.48 |
0.54 |
0.51 |
| |
|
|
|
|
|
|
|
|
|
| CAPEX |
US$ mm |
|
|
|
|
|
|
|
|
| |
|
|
|
|
|
|
|
|
|
| Sustaining |
|
9.7 |
13.4 |
23.1 |
16.6 |
9.4 |
5.1 |
4.7 |
9.8 |
| Other |
|
(0.0) |
(0.0) |
(0.0) |
0.3 |
0.1 |
0.2 |
0.4 |
0.5 |
(1) Our cash cost and sustaining cash cost
are net of by-products credits, measured with respect to zinc sold per mine. For a cash cost reconciliation to COGS, please refer to Appendix
– All in Sustaining Cash Cost | Mining.
(2) Our cost per ROM is measured with respect
to treated ore volume. Refer to “Use of Non-IFRS Financial Measures” for further information.
| | 17 |
Earnings Release – 2Q23 | | |
In 2Q23, zinc production of 14kt was up
6% and 2% from 2Q22 and 1Q23, respectively. Zinc grade increased to 2.89% in the quarter as production focused on cut and fill areas with
higher grades.
Lead and silver production in 2Q23 increased
by 5% and 10% from the same period a year ago. Compared to 1Q23, lead and silver production decreased by 3% and 6%, respectively, as a
result of the mine sequencing plan review, which prioritized cut and fill areas with lower grades due to the limited availability of third-party
equipment in the period, reducing access to areas with higher grades.
In the first six months of 2023, zinc
production totaled 27kt, up 5% compared to 1H22. Lead and silver production were up 9% to 12kt and 14% to 2MMoz, respectively, following
higher average grades.
Cost
Cost of sales was US$48 million in 2Q23
compared to US$46 million in 2Q22 due to higher depreciation and amortization. Compared to 1Q23, cost of sales decreased by 7% due to
lower inventory costs in the period.
Run-of-mine mining cost was US$63/t in
the quarter, up 5% from 2Q22 and 1Q23, mainly explained by higher third-party services and FX effect.
Cash cost net of by-products in 2Q23 increased
to US$0.35/lb compared to 2Q22, mainly driven by higher by-products contribution due to higher lead prices, higher TCs and slightly higher
operational costs. Compared to 1Q23, cash cost increased US$0.13/lb due to higher operating costs, higher TCs and lower by-products contribution.
CAPEX
| | 18 |
Earnings Release – 2Q23 | | |
In 2Q23, sustaining capital expenditures
amounted to US$9.7 million, mainly related to mine development, the tailings dam project and other mining infrastructure implementation,
totaling US$23 million in 1H23.
Atacocha
Atacocha
(100% basis) |
|
2Q23 |
1Q23 |
1H23 |
4Q22 |
3Q22 |
2Q22 |
1Q22 |
1H22 |
| |
|
|
|
|
|
|
|
|
|
| Ore Mined |
kt |
363 |
342 |
705 |
394 |
339 |
325 |
296 |
621 |
| Treated Ore |
kt |
373 |
342 |
715 |
394 |
339 |
325 |
296 |
621 |
| |
|
|
|
|
|
|
|
|
|
| Grade |
|
|
|
|
|
|
|
|
|
| |
|
|
|
|
|
|
|
|
|
| Zinc |
% |
0.67 |
0.94 |
0.80 |
0.87 |
0.90 |
0.82 |
1.00 |
0.91 |
| Lead |
% |
0.80 |
1.23 |
1.00 |
1.20 |
0.96 |
0.83 |
0.82 |
0.82 |
| Silver |
oz/t |
1.11 |
1.24 |
1.17 |
1.26 |
0.99 |
0.99 |
0.94 |
0.96 |
| Gold |
oz/t |
0.010 |
0.012 |
0.011 |
0.013 |
0.016 |
0.015 |
0.015 |
0.015 |
| |
|
|
|
|
|
|
|
|
|
| Production | metal contained |
|
|
|
|
|
|
|
| |
|
|
|
|
|
|
|
|
|
| Zinc |
kt |
1.9 |
2.5 |
4.4 |
2.6 |
2.4 |
2.1 |
2.4 |
4.5 |
| Lead |
kt |
2.6 |
3.6 |
6.1 |
4.1 |
2.8 |
2.3 |
2.1 |
4.3 |
| Silver |
MMoz |
0.3 |
0.4 |
0.7 |
0.4 |
0.3 |
0.3 |
0.2 |
0.5 |
| Gold |
koz |
2.2 |
2.6 |
4.7 |
3.1 |
3.8 |
3.6 |
3.1 |
6.7 |
| |
|
|
|
|
|
|
|
|
|
| Zinc sales |
kt |
2.4 |
2.3 |
4.6 |
2.9 |
2.3 |
2.3 |
2.1 |
4.4 |
| |
|
|
|
|
|
|
|
|
|
| Costs |
|
|
|
|
|
|
|
|
| |
|
|
|
|
|
|
|
|
|
| Cost of sales |
US$ mm |
19.8 |
16.5 |
36.3 |
23.3 |
15.7 |
21.1 |
15.3 |
36.4 |
| Cost ROM (2) |
US$/t |
31.7 |
36.6 |
34.0 |
35.7 |
37.7 |
35.5 |
38.0 |
36.7 |
| Cash cost (1) |
US$/lb |
(1.05) |
(0.12) |
(0.60) |
(1.54) |
0.54 |
(1.28) |
(0.30) |
(0.81) |
| Sustaining cash cost (1) |
US$/lb |
(0.58) |
0.81 |
0.10 |
(1.36) |
0.64 |
(1.14) |
0.14 |
(0.53) |
| |
|
|
|
|
|
|
|
|
|
| CAPEX |
US$ mm |
|
|
|
|
|
|
|
|
| |
|
|
|
|
|
|
|
|
|
| Sustaining |
|
2.5 |
4.7 |
7.1 |
1.1 |
0.5 |
0.8 |
2.0 |
2.8 |
| Other |
|
0.0 |
(0.0) |
0.0 |
0.1 |
- |
(0.0) |
0.0 |
0.0 |
(1) Our cash cost and sustaining cash cost
are net of by-products credits, measured with respect to zinc sold per mine. For a cash cost reconciliation to COGS, please refer to Appendix
– All in Sustaining Cash Cost | Mining.
(2) Our cost per ROM is measured with respect
to treated ore volume. Refer to “Use of Non-IFRS Financial Measures” for further information.
As previously disclosed, Atacocha mine
production was temporarily suspended at the end of June 2023 due to illegal protest activities by local communities that blocked the access
to the mine.
Although the Atacocha operation was impacted
for approximately 5 days at the end of June, in 2Q23 treated ore volume increased by 15% from 2Q22 to 373kt. Compared to 1Q23, treated
ore volume was up 9%.
| | 19 |
Earnings Release – 2Q23 | | |
On the other hand, zinc production of
1.9kt in 2Q23 decreased by 13% compared to 2Q22 and by 26% compared to 1Q23, mainly impacted by lower zinc average grade, 0.67% down 15bps
year-over-year and 27bps quarter-over-quarter.
Lead production increased by 11% to 2.6kt
compared to 2Q22, while silver production increased by 34% to 347koz. Compared to 1Q23, lead and silver production decreased by 29% and
3%, respectively.
Illegal protest activities also affected
stripping activities, reducing the preparation of high-grade areas in the period.
In 1H23, treated ore volume totaled 715kt,
up 15% from the same period last year. As a result, zinc production was relatively flat from 4.5kt to 4.4kt, while lead and silver increased
by 41% to 6kt and 45% to 704koz, respectively.
As of the date of this release, the operations
at the Atacocha San Gerardo open pit mine was resumed at normal capacity utilization rates. The estimated zinc production loss of 0.9Kt is
expected to be recovered in the upcoming months. As previously disclosed, the 2023 production guidance remains unchanged.
Cost
Cost of sales was US$20 million in 2Q23
compared to US$21 million in the same period last year. Compared to 1Q23, cost of sales increased by 20%, mainly explained by the reduction
in the concentrate inventories and idleness costs.
Run-of-mine mining cost was US$32/t in
the quarter, down 11% and 13% from 2Q22 and 1Q23, respectively, mainly explained by higher treated ore in 2Q23.
Cash cost net of by-products was US$(1.05)/lb
in 2Q23 compared with US$(1.28)/lb in 2Q22 due to lower by-products contribution and lower volumes, which was partially offset by lower
operational costs. Compared to 1Q23, cash cost net of by-products was down US$0.93/lb, mainly due to higher by-products contribution due
to higher lead prices and lower operating costs related to stoppage of operations.
CAPEX
In 2Q23, sustaining capital expenditures
amounted to US$2.5 million, mainly driven by the tailings dam deposit area and system, totaling US$7.1 million in 1H23.
Vazante
Vazante
(100% basis) |
|
2Q23 |
1Q23 |
1H23 |
4Q22 |
3Q22 |
2Q22 |
1Q22 |
1H22 |
| |
|
|
|
|
|
|
|
|
|
| Ore Mined |
kt |
366 |
385 |
751 |
372 |
376 |
381 |
264 |
645 |
| Treated Ore |
kt |
405 |
394 |
799 |
395 |
416 |
408 |
305 |
713 |
| |
|
|
|
|
|
|
|
|
|
| Grade |
|
|
|
|
|
|
|
|
|
| |
|
|
|
|
|
|
|
|
|
| Zinc |
% |
10.25 |
10.44 |
10.35 |
9.87 |
10.06 |
10.29 |
9.57 |
9.98 |
| Lead |
% |
0.35 |
0.34 |
0.35 |
0.36 |
0.31 |
0.32 |
0.35 |
0.33 |
| Silver |
oz/t |
0.66 |
0.69 |
0.67 |
0.63 |
0.62 |
0.65 |
0.61 |
0.63 |
| |
|
|
|
|
|
|
|
|
|
| Production | metal contained |
|
|
|
|
|
|
|
| |
|
|
|
|
|
|
|
|
|
| Zinc |
kt |
36.6 |
35.8 |
72.4 |
33.7 |
36.4 |
36.5 |
24.9 |
61.4 |
| Lead |
kt |
0.4 |
0.4 |
0.8 |
0.4 |
0.3 |
0.3 |
0.2 |
0.5 |
| Silver |
MMoz |
0.2 |
0.1 |
0.3 |
0.1 |
0.1 |
0.1 |
0.1 |
0.2 |
| |
|
|
|
|
|
|
|
|
|
| Zinc sales |
kt |
36.6 |
35.8 |
72.4 |
33.7 |
36.4 |
36.5 |
24.9 |
61.4 |
| |
|
|
|
|
|
|
|
|
|
| Costs |
|
|
|
|
|
|
|
|
| |
|
|
|
|
|
|
|
|
|
| Cost of sales |
US$ mm |
32.0 |
29.8 |
61.7 |
30.1 |
30.0 |
29.4 |
26.5 |
55.9 |
| Cost ROM (2) |
US$/t |
57.0 |
55.4 |
56.2 |
53.6 |
47.1 |
45.5 |
43.7 |
44.4 |
| Cash cost (1) |
US$/lb |
0.61 |
0.63 |
0.62 |
0.58 |
0.59 |
0.57 |
0.46 |
0.53 |
| Sustaining cash cost (1) |
US$/lb |
0.72 |
0.71 |
0.72 |
0.72 |
0.72 |
0.68 |
0.62 |
0.66 |
| |
|
|
|
|
|
|
|
|
|
| CAPEX |
US$ mm |
|
|
|
|
|
|
|
|
| |
|
|
|
|
|
|
|
|
|
| Sustaining |
|
8.8 |
6.2 |
15.0 |
13.4 |
9.9 |
8.6 |
7.7 |
16.3 |
| Other |
|
0.8 |
0.2 |
1.0 |
7.2 |
6.6 |
1.0 |
1.4 |
2.4 |
(1) Our cash cost and sustaining cash cost
are net of by-products credits, measured with respect to zinc sold per mine. For a cash cost reconciliation to COGS, please refer to Appendix
– All in Sustaining Cash Cost | Mining.
(2) Our cost per ROM is measured with respect
to treated ore volume. Refer to “Use of Non-IFRS Financial Measures” for further information.
| | 20 |
Earnings Release – 2Q23 | | |
Zinc production of 37kt in 2Q23 was relatively
flat compared to 2Q22 and up 2% from 1Q23, mainly explained by better plant performance year-over-year and higher treated ore quarter-over-quarter.
During the period, scheduled maintenance
was carried out to replace the secondary mill (at Calamina circuit), which took approximately one month, however, this circuit represents
only 30% of production capacity. As a result, the mill’s capacity increased from 45 tons to 60 tons per hour.
Zinc head grade averaged 10.25% (down
3bps from 2Q22 and 19bps from 1Q23) due to higher tailing re-treatment rate.
In 1H23, treated ore volume totaled 799kt,
up 12% from the same period of last year. As a result, zinc production increased by 18% to 72kt from 1H22.
Cost
Cost of sales was US$32 million in 2Q23
compared to US$29 million in 2Q22 in part due to higher operating costs related to the accounting effect regarding Enercan’s deconsolidation.
Compared to 1Q23, cost of sales increased by 7%, mainly related to higher personnel costs and higher depreciation and amortization.
Run-of-mine mining cost was US$57/t in
2Q23 compared to US$45/t in 2Q22 and US$55/t in 1Q23, explained by the above-mentioned reasons.
Cash cost net of by-products increased
to US$0.61/lb compared with US$0.57/lb in 2Q22, primarily explained by higher operational costs related to the deepening of the mine,
and higher TCs. Compared to 1Q23, cash cost decreased by 3%, mainly due to higher by-products volumes contribution.
CAPEX
In 2Q23, sustaining capital expenditures
amounted to US$8.8 million, mainly related to mine development, disbursements related to maintenance (equipment replacement) and other
mining infrastructure, totaling US$15 million in 1H23.
Morro Agudo
| | 21 |
Earnings Release – 2Q23 | | |
Morro Agudo
(100% basis) |
|
2Q23 |
1Q23 |
1H23 |
4Q22 |
3Q22 |
2Q22 |
1Q22 |
1H22 |
| |
|
|
|
|
|
|
|
|
|
| Ore Mined |
kt |
283 |
265 |
548 |
233 |
226 |
240 |
208 |
448 |
| Treated Ore |
kt |
320 |
296 |
616 |
254 |
259 |
259 |
245 |
504 |
| |
|
|
|
|
|
|
|
|
|
| Grade |
|
|
|
|
|
|
|
|
|
| |
|
|
|
|
|
|
|
|
|
| Zinc |
% |
1.79 |
2.02 |
1.90 |
1.99 |
1.91 |
2.09 |
2.26 |
2.17 |
| Lead |
% |
0.81 |
0.91 |
0.85 |
0.94 |
0.81 |
0.76 |
0.88 |
0.82 |
| |
|
|
|
|
|
|
|
|
|
| Production | metal contained |
|
|
|
|
|
|
|
| |
|
|
|
|
|
|
|
|
|
| Zinc |
kt |
5.1 |
5.3 |
10.4 |
4.6 |
4.6 |
4.7 |
4.7 |
9.5 |
| Lead |
kt |
1.9 |
1.9 |
3.8 |
1.8 |
1.7 |
1.5 |
1.3 |
2.8 |
| |
|
|
|
|
|
|
|
|
|
| Zinc sales |
kt |
5.1 |
5.3 |
10.4 |
4.6 |
4.6 |
4.7 |
4.7 |
9.5 |
| |
|
|
|
|
|
|
|
|
|
| Costs |
|
|
|
|
|
|
|
|
| |
|
|
|
|
|
|
|
|
|
| Cost of sales |
US$ mm |
17.6 |
15.5 |
33.1 |
18.0 |
15.1 |
17.7 |
13.0 |
30.7 |
| Cost ROM (2) |
US$/t |
31.7 |
36.9 |
33.1 |
54.4 |
31.6 |
41.2 |
43.4 |
42.3 |
| Cash cost (1) |
US$/lb |
0.87 |
1.05 |
0.96 |
1.26 |
1.00 |
0.74 |
0.93 |
0.84 |
| Sustaining cash cost (1) |
US$/lb |
0.97 |
1.07 |
1.02 |
1.46 |
1.09 |
0.97 |
1.06 |
1.01 |
| |
|
|
|
|
|
|
|
|
|
| CAPEX |
US$ mm |
|
|
|
|
|
|
|
|
| |
|
|
|
|
|
|
|
|
|
| Sustaining |
|
1.0 |
0.2 |
1.3 |
1.9 |
0.9 |
2.3 |
1.1 |
3.5 |
| Other |
|
0.1 |
0.0 |
0.1 |
0.2 |
0.1 |
0.1 |
0.2 |
0.3 |
(1) Our cash cost and sustaining cash cost
are net of by-products credits, measured with respect to zinc sold per mine. For a cash cost reconciliation to COGS, please refer to Appendix
– All in Sustaining Cash Cost | Mining.
(2) Our cost per ROM is measured with respect
to treated ore volume. Refer to “Use of Non-IFRS Financial Measures” for further information.
In 2Q23, treated ore volume was 320kt,
up 24% compared to 2Q22 and 8% compared to 1Q23.
Zinc production of 5.1kt in 2Q23 increased
by 7% compared to 2Q22 explained by higher treated ore and decreased by 6% compared to 1Q23 due to lower grades. Zinc head grade averaged
1.79% down 30bps and 23bps compared to 2Q22 and 1Q23, respectively.
In 1H23, zinc production totaled 10kt,
up 10% compared to 1H22. As previously disclosed, several initiatives related to the prioritization of the mine deepening development
to increase underground production and mining flexibility were implemented last year, supporting the positive results in 1H23.
Cost
Cost of sales was US$18 million in 2Q23
and was relatively flat compared to the same period last year. Compared to 1Q23, cost of sales increased by 13% explained by higher treated
ore volume and higher limestone production.
Run-of-mine mining cost was US$32/t in
the quarter, down 23% and 14% from 2Q22 and 1Q23, respectively, mainly explained by higher treated ore, despite a slightly increase (2Q23
vs. 2Q22) in variable costs.
| | 22 |
Earnings Release – 2Q23 | | |
In 2Q23, cash cost net of by-products
was US$0.87/lb compared with US$0.74/lb in 2Q22 due to lower by-products contribution and higher TCs. Compared to 1Q23, cash cost decreased
by US$0.18/lb, due to lower operational costs and higher by-products contribution, which were partially offset by higher TCs.
CAPEX
In 2Q23, sustaining capital expenditures
amounted to US$1.0 million, mainly related to mine development, totaling US$1.3 million in 1H23.
Other
In accordance with Nexa’s accounting
policy, the Company evaluates, at each reporting date, whether there are indications that the carrying amount of an asset or cash generation
unit (“CGU”) may not be recovered, or an impairment previously recorded should be reversed.
The impairment assessment resulted in
the recognition of an impairment loss in the Morro Agudo CGU for the period ended June 30, 2023. In addition to this economic impairment,
Nexa recognized a net reversal of impairment of other non-relevant individual assets. As a result, a net impairment loss was recorded
for the second quarter of 2023. For more information, please refer to explanatory note 16 – “Impairment of Long-Lived Assets”
in the “Condensed consolidated interim financial statements ended on June 30, 2023”.
Aripuanã
Aripuanã
(100% basis) |
|
2Q23 |
1Q23 |
1H23 |
4Q22 |
3Q22 |
2Q22 |
1Q22 |
1H22 |
| |
|
|
|
|
|
|
|
|
|
| Ore Mined |
kt |
61 |
157 |
209 |
42 |
- |
- |
- |
- |
| Treated Ore |
kt |
372 |
277 |
650 |
100 |
- |
- |
- |
- |
| |
|
|
|
|
|
|
|
|
|
| Grade |
|
|
|
|
|
|
|
|
|
| |
|
|
|
|
|
|
|
|
|
| Zinc |
% |
2.92 |
2.98 |
2.95 |
2.44 |
- |
- |
- |
- |
| Copper |
% |
0.74 |
0.57 |
0.67 |
0.49 |
- |
- |
- |
- |
| Lead |
% |
0.94 |
1.04 |
0.98 |
- |
- |
- |
- |
- |
| Silver |
oz/t |
0.89 |
0.86 |
0.88 |
0.61 |
- |
- |
- |
- |
| Gold |
oz/t |
0.013 |
0.013 |
0.013 |
0.011 |
- |
- |
- |
- |
| |
|
|
|
|
|
|
|
|
|
| Production | metal contained |
|
|
|
|
|
|
|
| |
|
|
|
|
|
|
|
|
|
| Zinc |
kt |
6.5 |
2.5 |
9.0 |
0.7 |
- |
- |
- |
- |
| Copper |
kt |
1.2 |
0.9 |
2.0 |
0.2 |
- |
- |
- |
- |
| Lead |
kt |
1.5 |
1.1 |
2.5 |
- |
- |
- |
- |
- |
| Silver |
MMoz |
0.1 |
0.1 |
0.2 |
0.0 |
- |
- |
- |
- |
| Gold |
koz |
1.7 |
0.9 |
2.6 |
0.3 |
- |
- |
- |
- |
| |
|
|
|
|
|
|
|
|
|
| CAPEX |
US$ mm |
|
|
|
|
|
|
|
|
| |
|
|
|
|
|
|
|
|
|
| Sustaining |
|
15.9 |
15.2 |
31.1 |
- |
- |
- |
- |
- |
| Other (1) |
|
(19.3) |
(2.8) |
(22.1) |
- |
- |
- |
- |
- |
(1) The negative amounts are mainly related
to reclassifications between Aripuanã and Corporate, and capitalization of interest net of advanced payments for imported materials
and tax credits.
| | 23 |
Earnings Release – 2Q23 | | |
In 2Q23, treated ore volume increased
by 34% to 372kt. Zinc production was 6.5kt (vs. 2.5kt in 1Q23), while zinc average grade was 2.92%, mainly explained by the efforts of
the task force in place since 1Q23 to progress the ramp-up, stabilize the plant and make bottleneck adjustments.
Copper production was 1.2kt (vs. 0.9kt
in 1Q23), while copper average grade was 0.74% and other metals followed the same trend.
Ramp-up activities are in progress and
are currently focused on steadily increasing the plant throughput rate, asset reliability, and reduction of plant downtime, as well as
improving concentrate grades and quality. At the end of 2Q23, the plant reached 76% of nameplate capacity (vs. 50% in 1Q23), while the
average utilization rate in 2Q23 was 66%. The plant downtime reduced significantly from 394 hours in March to 148 hours in June, which
represents a 62% reduction.
In 2Q23, recovery rates improved compared
to 1Q23, with zinc recovery averaging 63% in June compared to 48% in March. Concentrates grades are also improving. The zinc concentrate
reached 52% of average grade in 2Q23 and it is being processed by our smelters in Brazil. For the upcoming quarters, we expect to conclude
the adjustments related to the bottlenecks in pumping and piping systems mentioned in the previous quarter, and further improve the recovery
and concentrate grades. This would allow us to reach 80-85% of the nameplate capacity in 3Q23, paving the way to expected operations above
90% in 4Q23.
We continue with mine development activities
at both the Arex and Link mines. At the end of 2Q23, approximately 188kt of ore was available in stockpiles (versus 522kt in 1Q23), which
is aligned with the strategy to reduce intermediate ore stocks and increase mine production to directly feed the plant.
Mine production ROM reached 60.9 kt in
2Q23 compared to 147.9 kt in 1Q23 which has been adjusted following the evolution of the plant’s ramp-up to optimize the allocation
of working capital and costs.
Horizontal mine development reached an
accumulated amount of 1,652 meters developed for both the Arex and Link mines in 2Q23 compared to 2,341 meters in 1Q23, following the
current plan to transition from outsourced development to an insourcing team.
The main infrastructure of paste backfill
has been commissioned and it is ramping-up, supporting the start-up production at VRM areas (vertical retreat mining method) by 3Q23,
which will contribute to create the conditions for the mine to be close to full production by 4Q23, in line with the evolution of plant
improvement.
CAPEX
In 2Q23, sustaining capital expenditures
amounted to US$16 million, mainly related to mining development, mining infrastructure and other sustaining activities, totaling US$31
million in 1H23.
Outlook: 2023 production is currently
expected on the low end of the guidance range and remains subject to risks around the ramp-up of the new mine, among other factors.
Financial performance
| US$ million |
|
2Q23 |
1Q23 |
2Q22 |
2Q23 vs. 2Q22 |
1H23 |
1H22 |
1H23 vs. 1H22 |
| Net Revenues |
|
268.2 |
267.7 |
369.6 |
(27.4%) |
536.0 |
691.5 |
(22.5%) |
| Cost of Sales (1) |
|
(255.6) |
(243.5) |
(215.6) |
18.5% |
(499.1) |
(408.9) |
22.1% |
| Gross Profit |
|
12.6 |
24.3 |
153.9 |
(91.8%) |
36.9 |
282.6 |
(87.0%) |
| Adjusted EBITDA |
|
20.0 |
41.5 |
161.9 |
(87.7%) |
61.5 |
298.1 |
(79.4%) |
| Adjusted EBITDA Mrg. |
|
7.4% |
15.5% |
43.8% |
(36.4pp) |
11.5% |
43.1% |
(31.6pp) |
Note: Financial performance pre intersegment
eliminations. (1) Includes the cost of sales of Aripuanã of US$60 million in 2Q23 and US$41 million in 1Q23, totaling
US$101 million in 1H23.
| | 24 |
Earnings Release – 2Q23 | | |
Net revenues for the mining segment
totaled US$268 million in 2Q23, down 27% versus 2Q22. This performance was mainly driven by (i) the decrease in LME metal prices, (ii)
lower copper volumes and (iii) higher TCs; which was partially offset by higher zinc, lead, and silver volumes. Compared to 1Q23, net
revenues remained flat, mainly due to the increase in production across all metals, which was partially offset by lower LME metal prices.
In 1H23, net revenues amounted to US$536
million, 22% lower when compared to the same period a year ago, due to the above-mentioned reasons.
Reconciliation of realized prices
Revenues are recorded at provisional prices
and, typically, an adjustment is then made after delivery, based on the pricing terms under the relevant contract. In addition, the difference
between the provisional and the final price received is recognized by adjusting the price in the period in which the sale is concluded.
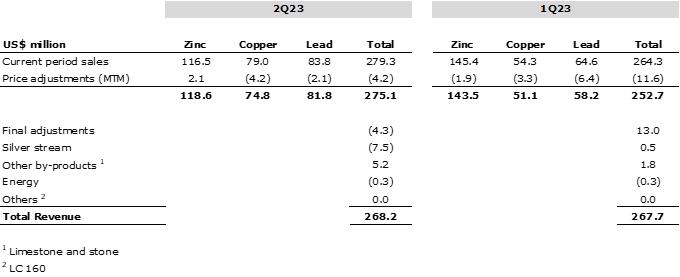
Cost of sales in 2Q23 was US$256
million, including US$60 million from Aripuanã with a higher unit cost (ramp-up phase). Excluding the effect of Aripuanã,
cost of sales decreased to US$195 million, due to lower sales volumes, when compared to US$216 million in 2Q22 and US$202 million in 1Q23.
Adjusted EBITDA for the mining
segment in 2Q23 was US$20 million compared to US$162 million in 2Q22. This decrease in performance was primarily explained by (i) the
negative net price effect of US$88 million, mainly due to lower LME metal prices and higher TCs of US$97 million; (ii) the negative impact
of US$51 million related to higher operating costs, mainly in Aripuanã which started operations in 4Q22; and (iii) the negative
net impact of US$12 million in volumes, mainly in Cerro Lindo due to impacts from the heavy rainfall that occurred in 1Q23, which delayed
access to higher grade areas, partially offset by Aripuanã volumes ramping up in 2Q23; partially offset by (iv) the positive impact
of US$8 million due to lower mineral exploration and project evaluation expenses.
| | 25 |
Earnings Release – 2Q23 | | |

Compared to 1Q23, Adjusted EBITDA decreased
by 52%. This decrease was mainly driven by (i) the negative price effect of US$53 million, due to lower LME metal prices and higher TCs;
(ii) the negative impact of US$15 million due to higher operational costs mainly in Aripuanã, related to concentrate and stockpile
costs; and (iii) the negative FX impact of US$5 million, which was partially offset by (iv) the positive impact of US$34 million in volumes,
due to higher sales volume in Cerro Lindo and Aripuanã; and (v) higher by-products contribution of US$19 million related to higher
sales volume of copper and lead concentrates and higher prices and volumes of limestone sales.
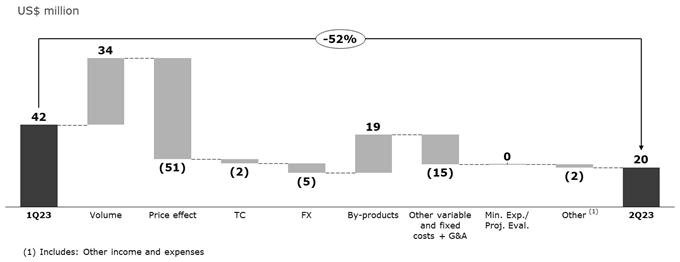
Cash cost and AISC 8,9
| Consolidated cash cost |
2Q23 |
1Q23 |
2Q22 |
2Q23 vs. 2Q22 |
1H23 |
1H22 |
1H23 vs. 1H22 |
| Run-of-mine mining cost |
US$/t |
43.9 |
45.0 |
42.7 |
2.9% |
44.5 |
43.8 |
1.6% |
| Cash cost net of by-products |
US$/t |
817 |
948 |
362 |
126.0% |
881 |
390 |
126.1% |
| AISC net of by-products |
US$/t |
1,423 |
1,840 |
1,213 |
17.3% |
1,627 |
1,266 |
28.5% |
| Cash cost net of by-products |
US$/lb |
0.37 |
0.43 |
0.16 |
126.0% |
0.40 |
0.18 |
126.1% |
| AISC net of by-products |
US$/lb |
0.65 |
0.83 |
0.55 |
17.3% |
0.74 |
0.57 |
28.5% |
Note: Cash cost and AISC per ton sold does
not include the impact of the cost of idleness capacity of US$0.9 million and US$1.2 million in Atacocha in 2Q23 and 2Q22, respectively,
and US$5.2 million in Cerro Lindo in 1Q23.
8
Our cash cost and AISC are net of by-products credits, measured with respect to zinc sold.
9
AISC does not include Aripuanã.
| | 26 |
Earnings Release – 2Q23 | | |
Cash cost net of by-products for
the mining segment in 2Q23 increased to US$0.37/lb compared to US$0.16/lb in 2Q22. This increase was mainly due to lower by-products contribution
and higher TCs.
Compared to 1Q23, cash cost decreased
by US$0.06/lb due to higher by-products contribution, mainly explained by higher lead price and higher copper concentrate volumes.
Run-of-mine mining cost was US$44/t in
the quarter, up 3% from 2Q22 due to higher third-party services and maintenance expenses. Compared to 1Q23, run-of-mine mining cost decreased
by 2% due to higher treated ore and a decrease in fixed costs.
AISC net of by-products in 2Q23 was US$0.65/lb,
up 18% and down 23% compared to US$0.55/lb in 2Q22 and US$0.83/lb in 1Q23, respectively.
For a reconciliation of cash cost and
AISC net of by-products, please refer to the appendix section “All in Sustaining Cash Cost | Mining”.
| | 27 |
Earnings Release – 2Q23 | | |
Smelting segment
| Consolidated |
|
2Q23 |
1Q23 |
2Q22 |
2Q23 vs. 2Q22 |
1H23 |
1H22 |
1H23 vs. 1H22 |
| Production |
|
|
|
|
|
|
|
|
| Zinc metal |
kt |
139.1 |
137.9 |
144.9 |
(4.0%) |
277.0 |
270.4 |
2.5% |
| Global Recovery |
% |
93.0 |
93.0 |
93.5 |
(59bps) |
93.0 |
93.9 |
(94bps) |
| Zinc oxide |
kt |
8.4 |
8.2 |
11.2 |
(25.2%) |
16.6 |
21.1 |
(21.5%) |
| Total |
kt |
147.5 |
146.1 |
156.2 |
(5.5%) |
293.6 |
291.5 |
0.7% |
| Sales |
|
|
|
|
|
|
|
|
| Zinc metal |
kt |
140.4 |
135.7 |
141.4 |
(0.7%) |
276.1 |
265.3 |
4.1% |
| Zinc oxide |
kt |
8.5 |
8.1 |
10.8 |
(21.3%) |
16.6 |
21.1 |
(21.6%) |
| Total |
kt |
148.9 |
143.8 |
152.1 |
(2.1%) |
292.7 |
286.4 |
2.2% |
In 2Q23, total production was 148kt, down
6% year-over-year driven by lower volumes in the Cajamarquilla and Três Marias units, mainly explained by operational instabilities
and maintenance in the period. Compared to 1Q23, production was up 1%.
In 2Q23, zinc metal and oxide sales were
149kt, down by 2% from 2Q22 following lower production volumes. Compared to 1Q23, metal sales grew 4%, driven by higher production volumes
and sales strategy in line with working capital improvement initiatives.
In 1H23, total production amounted to
294kt and was flat compared to the same period a year ago due to the aforementioned operational instabilities in Cajamarquilla and Três
Marias. Total sales increased by 2% to 293kt, including 17kt from zinc oxide.
Peru
Cajamarquilla
(100% basis) |
|
2Q23 |
1Q23 |
1H23 |
4Q22 |
3Q22 |
2Q22 |
1Q22 |
1H22 |
| |
|
|
|
|
|
|
|
|
|
| Zinc metal production |
kt |
82.7 |
81.3 |
164.1 |
86.4 |
85.6 |
84.1 |
76.7 |
160.8 |
| Zinc metal sales |
kt |
81.2 |
78.8 |
159.9 |
93.0 |
92.1 |
81.0 |
74.3 |
155.3 |
| |
|
|
|
|
|
|
|
|
|
| Zinc content in products |
kt |
81.1 |
78.6 |
159.7 |
92.7 |
91.5 |
78.5 |
71.4 |
149.9 |
| |
|
|
|
|
|
|
|
|
|
| Cost of sales (2) |
US$ mm |
218 |
261 |
479 |
317 |
337 |
287 |
278 |
566 |
| (-) Raw material |
|
(156) |
(199) |
(356) |
(214) |
(238) |
(236) |
(235) |
(471) |
| (+) By-product |
|
(7.6) |
(6.7) |
(14.4) |
(7.9) |
(6.5) |
(8.1) |
(5.1) |
(13.3) |
| (+/-) Consolidation effects |
(8.5) |
(6.4) |
(14.9) |
(50.9) |
(40.5) |
17.6 |
5.5 |
23.0 |
| (+) Others |
|
7.7 |
2.2 |
9.9 |
4.8 |
1.5 |
(6.4) |
(0.6) |
(6.9) |
| (=) Conversion cost |
US$ mm |
53.4 |
50.4 |
103.7 |
49.2 |
52.9 |
54.2 |
43.2 |
97.5 |
| Conversion cost |
US$/lb |
0.30 |
0.29 |
0.29 |
0.24 |
0.26 |
0.31 |
0.27 |
0.29 |
| |
|
|
|
|
|
|
|
|
|
| Cash cost (1) |
US$/lb |
1.06 |
1.17 |
1.12 |
1.18 |
1.34 |
1.32 |
1.12 |
1.30 |
| Sustaining cash cost (1) |
US$/lb |
1.09 |
1.20 |
1.14 |
1.25 |
1.40 |
1.41 |
1.15 |
1.36 |
| |
|
|
|
|
|
|
|
|
|
| CAPEX |
US$ mm |
|
|
|
|
|
|
|
|
| |
|
|
|
|
|
|
|
|
|
| Sustaining |
|
3.2 |
4.0 |
7.2 |
10.2 |
10.0 |
13.1 |
5.2 |
18.3 |
| Other |
|
1.3 |
0.5 |
1.8 |
2.7 |
2.2 |
1.4 |
0.6 |
1.9 |
(1) Our cash cost and sustaining cash cost
are net of by-products credits, measured with respect to zinc sold per smelter. For a cash cost reconciliation to COGS, please refer
to Appendix - Conversion and All in Sustaining Cash Cost | Smelting.
(2) Cost of sales does not include resale operations from third parties.
| | 28 |
Earnings Release – 2Q23 | | |
In 2Q23, Cajamarquilla smelter production
was 83kt, down 2% compared to 2Q22 mainly explained by lower zinc recovery, which was impacted by operational instabilities (losses of
soluble zinc in the filters), in addition to a short-scheduled maintenance at the power substation, which took 2 days, however, much of
this instability caused in the period has already been remediated. Compared to 1Q23, smelter production increased by 2%. Recovery rates
averaged 93.8% during the quarter, compared to 94.6% in 2Q22 and 94.0% in 1Q23.
Metal sales totaled 81kt in 2Q23 and were
relatively flat year-over-year. Compared to 1Q23, sales increased by 3%.
In 1H23, smelter production totaled 164kt,
up 2% compared to 1H22 due to the unit’s better operating performance. Smelter sales totaled 160kt, up 3% from last year, following
the increase in production year-over-year.
Costs
Cost of sales was US$218 million in 2Q23
compared to US$287 million in the same period last year and US$261 million in 1Q23. In both periods, this performance was positively affected
by lower raw material costs due to lower LME metal prices.
In 2Q23, conversion cost was US$0.30/lb
compared to US$0.31/lb in 2Q22 due to higher volumes and lower variable costs. Compared to 1Q23, conversion cost increased by US$0.01/lb,
explained by other variable costs.
Cash cost net of by-products in 2Q23 was
US$1.06/lb compared to US$1.32/lb in 2Q22 and US$1.17/lb in 1Q23. In both periods, cash cost decreased, mainly due to lower LME metal
prices.
CAPEX
In 2Q23, sustaining capital expenditures
amounted to US$3.2 million, mainly due to the acquisition and repairs of equipment, totaling US$7.2 million in 1H23.
Brazil
In 2Q23, smelter production amounted to
65kt, down 10% compared to the same period last year. Compared to 1Q23, smelter production was relatively flat, explained by operational
instabilities in the Três Marias unit, as described
below.
Total sales volume (zinc metal + zinc
oxide) amounted to 68kt and decreased by 5% year-over-year. Compared to 1Q23, total sales volume increased by 4%, mainly driven by higher
production at Juiz de Fora.
In 1H23, smelter production was 130kt,
1% lower compared to 1H22. Metal sales increased by 6% to 116kt, while total sales volume (zinc metal + oxide) increased by 1% to 133kt.
| | 29 |
Earnings Release – 2Q23 | | |
Três Marias
Três Marias
(100% basis) |
|
2Q23 |
1Q23 |
1H23 |
4Q22 |
3Q22 |
2Q22 |
1Q22 |
1H22 |
| |
|
|
|
|
|
|
|
|
|
| Zinc metal production |
kt |
35.7 |
37.9 |
73.6 |
40.5 |
39.6 |
40.2 |
29.3 |
69.5 |
| Zinc oxide production |
kt |
8.4 |
8.2 |
16.6 |
8.1 |
11.1 |
11.2 |
9.9 |
21.1 |
| Zinc metal sales |
kt |
38.9 |
36.8 |
75.7 |
44.1 |
37.3 |
39.9 |
30.5 |
70.4 |
| |
|
|
|
|
|
|
|
|
|
| Zinc content in products |
kt |
45.6 |
43.1 |
88.7 |
50.5 |
45.2 |
46.5 |
37.9 |
84.4 |
| |
|
|
|
|
|
|
|
|
|
| Cost of sales (2) |
US$ mm |
132 |
138 |
270 |
146 |
153 |
185 |
138 |
323 |
| (-) Raw material |
|
(61) |
(84) |
(145) |
(90) |
(110) |
(133) |
(99) |
(231) |
| (+) By-product |
|
(19.7) |
(12.9) |
(32.6) |
(14.3) |
(14.0) |
(17.0) |
(12.1) |
(29.1) |
| (+/-) Consolidation effects |
(2.1) |
- |
(2.1) |
(2.1) |
1.8 |
(0.6) |
(2.6) |
(3.2) |
| (+) Others |
|
(22.3) |
(18.8) |
(41.1) |
(14.4) |
(12.0) |
(14.8) |
(11.2) |
(26.0) |
| (=) Conversion cost |
US$ mm |
26.6 |
22.3 |
48.9 |
24.5 |
19.3 |
19.9 |
13.1 |
33.0 |
| Conversion cost |
US$/lb |
0.26 |
0.23 |
0.25 |
0.22 |
0.19 |
0.19 |
0.16 |
0.18 |
| |
|
|
|
|
|
|
|
|
|
| Cash cost (1) |
US$/lb |
1.18 |
1.36 |
1.26 |
1.17 |
1.37 |
1.67 |
1.47 |
1.58 |
| Sustaining cash cost (1) |
US$/lb |
1.25 |
1.40 |
1.32 |
1.28 |
1.49 |
1.78 |
1.54 |
1.68 |
| |
|
|
|
|
|
|
|
|
|
| CAPEX |
US$ mm |
|
|
|
|
|
|
|
|
| |
|
|
|
|
|
|
|
|
|
| Sustaining |
|
5.2 |
2.4 |
7.6 |
2.8 |
2.8 |
5.5 |
2.6 |
8.1 |
| Other |
|
2.1 |
1.4 |
3.6 |
9.5 |
9.1 |
6.4 |
3.5 |
9.9 |
(1) Our cash cost and sustaining cash cost
are net of by-products credits, measured with respect to zinc sold per smelter. For a cash cost reconciliation to COGS, please refer to
Appendix - Conversion and All in Sustaining Cash Cost | Smelting.
(2) Cost of sales does not include resale
operations from third parties.
In Três Marias total production
(zinc metal + oxide) decreased by 14% and 4% compared to 2Q22 and 1Q23, respectively, mainly explained by operational instabilities in
the period due to scheduled roaster maintenance, which took longer than expected (approximately 15 days), in addition to issues in the
silicate circuit, which have already been remediated.
Metallic zinc production was down 11%
from 2Q22 and down 6% compared to 1Q23. Metallic zinc sales amounted to 39kt, down 2% year-over-year following lower production and up
6% quarter-over-quarter due to higher sales volume in the period, which was explained by an improvement in demand when compared to the
last quarter. In 2Q23, zinc oxide sales increased to 8.5kt.
In 1H23, Três Marias total production
amounted to 90kt, relatively flat compared to 1H22. Zinc metal sales increased by 8% to 76kt and zinc oxide sales decreased by 22% to
17kt, respectively.
Costs
Cost of sales of US$132 million in 2Q23
decreased by 29% and 5% from 2Q22 and 1Q23, respectively. In both periods, the decrease was mainly driven by lower raw materials costs,
which was positively affected by lower LME prices.
In 2Q23, conversion cost increased to
US$0.26/lb, compared to US$0.19/lb in 2Q22 and US$0.23/lb in 1Q23. In both periods, the increase was mainly explained by higher energy,
maintenance and other variable costs.
| | 30 |
Earnings Release – 2Q23 | | |
Cash cost net of by-products in 2Q23 decreased
to US$1.18/lb compared to US$1.67/lb in 2Q22 and US$1.36/lb in 1Q23. In both periods, the decrease was mainly explained by market-related
factors, such as lower LME zinc price, which impacted the concentrate purchased price.
CAPEX
In 2Q23, sustaining capital expenditures
amounted to US$5.2 million, mainly due to the acquisition and repairs of equipment, as well as disbursements related to the roaster maintenance,
totaling US$7.6 million in 1H23.
Juiz de Fora
Juiz de Fora
(100% basis) |
|
2Q23 |
1Q23 |
1H23 |
4Q22 |
3Q22 |
2Q22 |
1Q22 |
1H22 |
| |
|
|
|
|
|
|
|
|
|
| Zinc metal production |
kt |
20.7 |
18.7 |
39.4 |
21.9 |
22.2 |
20.7 |
19.4 |
40.1 |
| Zinc metal sales |
kt |
20.3 |
20.2 |
40.5 |
21.7 |
22.3 |
20.5 |
19.2 |
39.7 |
| |
|
|
|
|
|
|
|
|
|
| Zinc content in products |
kt |
20.2 |
20.0 |
40.2 |
21.6 |
22.1 |
20.3 |
19.0 |
39.3 |
| |
|
|
|
|
|
|
|
|
|
| Cost of sales |
US$ mm |
67 |
71 |
138 |
79 |
88 |
83 |
75 |
158 |
| (-) Raw material |
|
(47) |
(43) |
(90) |
(57) |
(61) |
(66) |
(50) |
(116) |
| (+) By-product |
|
(0.4) |
(1.0) |
(1.4) |
(1.4) |
(0.6) |
(1.1) |
(1.0) |
(2.1) |
| (+/-) Consolidation effects |
5.1 |
- |
5.1 |
2.5 |
0.3 |
2.4 |
(1.8) |
0.6 |
| (+) Others |
|
(4.2) |
(4.1) |
(8.2) |
(6.4) |
(9.3) |
(0.4) |
(7.7) |
(8.1) |
| (=) Conversion cost |
US$ mm |
20.4 |
23.1 |
43.5 |
16.0 |
18.2 |
17.8 |
15.0 |
32.9 |
| Conversion cost |
US$/lb |
0.46 |
0.52 |
0.49 |
0.34 |
0.37 |
0.40 |
0.36 |
0.38 |
| |
|
|
|
|
|
|
|
|
|
| Cash cost (1) |
US$/lb |
1.24 |
1.35 |
1.29 |
1.35 |
1.45 |
1.50 |
1.35 |
1.43 |
| Sustaining cash cost (1) |
US$/lb |
1.30 |
1.40 |
1.35 |
1.47 |
1.59 |
1.65 |
1.44 |
1.55 |
| |
|
|
|
|
|
|
|
|
|
| CAPEX |
US$ mm |
|
|
|
|
|
|
|
|
| |
|
|
|
|
|
|
|
|
|
| Sustaining |
|
2.5 |
1.5 |
4.0 |
3.7 |
5.4 |
5.2 |
2.0 |
7.2 |
| Other |
|
0.4 |
0.8 |
1.2 |
1.8 |
1.1 |
1.6 |
1.6 |
3.2 |
(1) Our cash cost and sustaining cash cost
are net of by-products credits, measured with respect to zinc sold per smelter. For a cash cost reconciliation to COGS, please refer to
Appendix - Conversion and All in Sustaining Cash Cost | Smelting.
In 2Q23, Juiz de Fora production reached
21kt and was flat compared to 2Q22. Compared to 1Q23, production was up 10%, explained by better operational performance.
Recoveries rates averaged 94.0% during
the quarter, compared to 93.1% in 2Q22 and 92.3% in 1Q23. Zinc metal sales totaled 20kt in 2Q23, relatively flat compared to 2Q22 and
1Q23.
In the first six months of 2023, zinc
metal production decreased by 2% to 39kt, and sales of 41kt were 2% higher compared to 1H22.
Costs
Cost of sales was US$67 million in 2Q23
compared to US$83 million in the same period last year primarily driven by lower LME prices. Compared to 1Q23, cost of sales decreased
by 6% due to the above-mentioned reason.
| | 31 |
Earnings Release – 2Q23 | | |
In 2Q23, conversion cost was US$0.46/lb
compared to US$0.40/lb in 2Q22. The increase was mainly explained by higher energy costs and higher maintenance costs. Compared to 1Q23,
conversion cost decreased by 12% due to lower variable costs.
Cash cost net of by-products in 2Q23 was
US$1.24/lb compared to US$1.50/lb in 2Q22. This decrease was due to lower LME metal prices and lower operating costs, which were partially
offset by lower by-products contribution. Compared to 1Q23, cash cost net of by-products decreased by 8% due to lower LME metal prices
and other operating costs, which were partially offset by FX effect.
CAPEX
In 2Q23, sustaining capital expenditures
amounted to US$2.5 million, mainly driven by the replacement and repairs of equipment, as well as disbursements related to the scheduled
maintenance in 3Q23, totaling US$4.0 million in 1H23.
Financial performance
| US$ million |
|
2Q23 |
1Q23 |
2Q22 |
2Q23 vs. 2Q22 |
1H23 |
1H22 |
1H23 vs. 1H22 |
| Net Revenues |
|
465.1 |
543.3 |
683.4 |
(31.9%) |
1,008.4 |
1,245.1 |
(19.0%) |
| Cost of Sales |
|
(415.1) |
(468.5) |
(566.5) |
(26.7%) |
(883.7) |
(1,069.4) |
(17.4%) |
| Gross Profit |
|
50.0 |
74.8 |
116.9 |
(57.2%) |
124.8 |
175.7 |
(29.0%) |
| Adjusted EBITDA |
|
50.6 |
89.2 |
140.2 |
(63.9%) |
139.8 |
222.2 |
(37.1%) |
| Adjusted EBITDA Mrg. |
|
10.9% |
16.4% |
20.5% |
(9.6pp) |
13.9% |
17.8% |
(4.0pp) |
Note: Financial performance pre intersegment
eliminations.
Net revenues were US$465 million
in 2Q23, down 32% compared to US$683 million in 2Q22, mainly due to lower metal prices. Compared to 1Q23, net revenues decreased by 14%
due to lower LME metal prices, which were partially offset by higher volumes.
Cost of sales decreased by 27%
in 2Q23, totaling US$415 million compared to US$566 million in 2Q22. Compared to 1Q23, cost of sales decreased by 11% mainly benefitting
from lower LME prices and higher TCs.
Reconciliation of realized prices
Purchases of zinc in concentrate are recorded
at provisional prices and, typically, an adjustment is made after delivery, which is based on the pricing terms provided for under the
respective contract. In addition, the difference between the provisional and the final price received is recognized by adjusting the price
in the period in which the purchase is concluded.
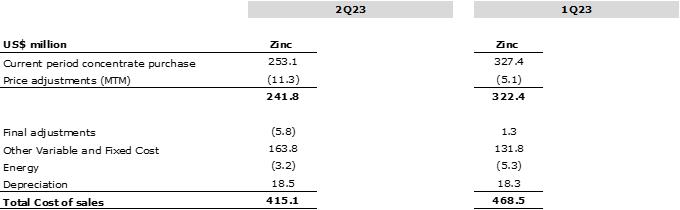
| | 32 |
Earnings Release – 2Q23 | | |
Sources
of Zinc Concentrate to Nexa Smelters (kt) – 2Q23
In 2Q23, Nexa acquired 44% of zinc concentrate
from our own mines, with the remainder supplied by third parties. The smelters use zinc concentrate as feedstock, which is supplied from
our mines, and we apply a benchmark TC for our operations; from third-party suppliers, the treatment charge is based on the benchmark
TC, spot TCs, or TCs negotiated annually. |
|
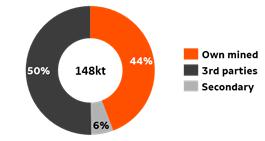 |
The 2023 benchmark TC, negotiated in April
2023, was US$274/t concentrate, up 19% from 2022 (US$230/t). In order to reduce volatility, for the majority of our third-party contracts,
which are renewed during different periods throughout the year, we consider the 3-year benchmark TC. The reference benchmark for TC 2023,
2022 and 2021 is US$274/t concentrate, US$230/t concentrate, and US$159/t concentrate, respectively.
Adjusted EBITDA for the smelting
segment totaled US$51 million in 2Q23 compared to US$140 million reported in 2Q22. This decrease was mainly explained by (i) the negative
net price effect of US$58 million due to lower LME metal prices; (ii) lower by-products contribution of US$10 million, primarily related
to lower sulphuric acid volumes and prices; (iii) the negative impact of US$12 million, due to higher energy, sales and freight expenses
in Cajamarquilla; (iv) the negative hedge variation of US$3 million; and (v) the negative impact related to the accounting effect regarding
Enercan’s deconsolidation, which were partially offset by higher TCs and lower workers’ participation.
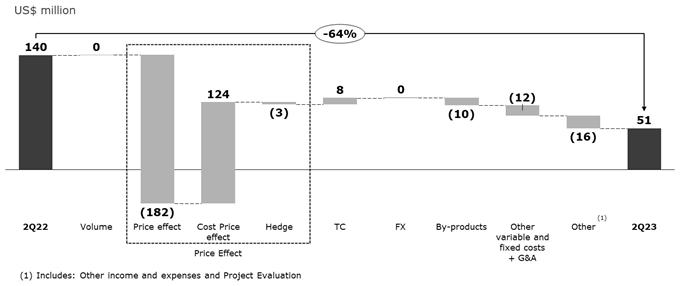
Compared to 1Q23, Adjusted EBITDA decreased
by 43%, mainly driven by (i) the negative net price effect of US$20 million, related to changes in market prices resulting in quotation
period adjustments of US$34 million, which was partially offset by the positive hedge variation of US$11 million and higher TCs of US$4
million; (ii) the negative impact of US$8 million mainly related to higher freight and sales expenses; (iii) higher maintenance expenses
related to scheduled maintenance in Três Marias and higher third-party services with a total amount of US$4 million; (iv) the negative
FX impact of US$2 million, which were partially offset by (v) higher by-products contribution of US$7 million.
| | 33 |
Earnings Release – 2Q23 | | |
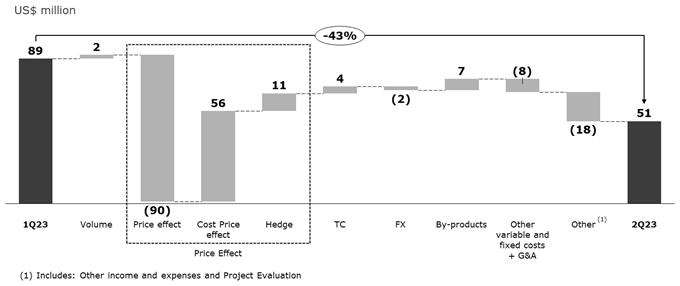
Conversion cost, Cash cost and
AISC 10
| Consolidated |
|
2Q23 |
1Q23 |
2Q22 |
2Q23 vs. 2Q22 |
1H23 |
1H22 |
1H23 vs. 1H22 |
| Smelting conversion cost |
US$/t |
684 |
675 |
633 |
8.0% |
679 |
597 |
13.8% |
| Cash cost net of by-products |
US$/t |
2,474 |
2,761 |
3,213 |
(23.0%) |
2,615 |
3,099 |
(15.6%) |
| AISC net of by-products |
US$/t |
2,721 |
2,919 |
3,487 |
(22.0%) |
2,819 |
3,338 |
(15.6%) |
| Smelting conversion cost |
US$/lb |
0.31 |
0.31 |
0.29 |
8.0% |
0.31 |
0.27 |
13.8% |
| Cash cost net of by-products |
US$/lb |
1.12 |
1.25 |
1.46 |
(23.0%) |
1.19 |
1.41 |
(15.6%) |
| AISC net of by-products |
US$/lb |
1.23 |
1.32 |
1.58 |
(22.0%) |
1.28 |
1.51 |
(15.6%) |
Note: Cash cost and AISC per ton sold does
not include the impact of the cost of idleness capacity of US$2.3 million in Três Marias in 1H22.
Cash cost net of by-products
for the smelting segment decreased to US$1.12/lb in 2Q23 compared to US$1.46/lb in 2Q22. This decrease was driven by lower cost of raw
material, explained by lower LME zinc prices, with an impact of US$0.55/lb which were partially offset by higher operating costs of US$0.14/lb
and lower by-products contribution of US$0.04/lb.
Compared to 1Q23, cash cost decreased
by US$0.13/lb, also driven by lower LME zinc prices, with an impact of US$0.22/lb, which were partially offset by lower by-products price
contribution.
AISC net of by-products decreased in 2Q23
to US$1.23/lb from US$1.58/lb in 2Q22, mainly due to the above-mentioned reasons, in addition to the decrease in sustaining investments
and workers participation.
Conversion cost for the smelting
segment in 2Q23 was US$0.31/lb, up US$0.02/lb from 2Q22, explained by higher maintenance, energy expenses and other variable costs with
an impact of US$0.04/lb, partially offset by lower third-party services. Compared to 1Q23, conversion cost was flat.
For a reconciliation of conversion cost,
cash cost and AISC, please refer to the appendix section “Conversion and All in Sustaining Cash Cost | Smelting”.
10 Our conversion cost, cash
cost and AISC net of by-products credits are measured with respect to zinc sold.
| | 34 |
Earnings Release – 2Q23 | | |
Liquidity and
Indebtedness
On June
30, 2023, Nexa’s consolidated gross debt11
amounted to US$1,681 million, 1% higher compared to the balance at March 31, 2023, mainly driven by the
8% Brazilian real (end of period) appreciation against the U.S. dollar, partially offset by the payments of loans and financings.
At the end of the period, 83% (or US$1,394
million) of the gross debt was denominated in U.S. dollars and 17% (or US$287 million) in Brazilian reais. The following charts show Nexa’s
gross debt by category and currency.
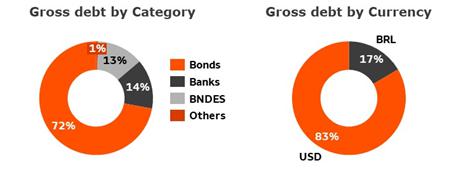
Cash and cash equivalents and financial
investments (“total cash”) amounted to US$421 million on June 30, 2023, 12% higher compared to March 31, 2023, mainly driven
by the positive operating cash flows in the quarter.
Total cash at the end of 2Q23 is sufficient
to cover the payment of all obligations maturing over the next 4 years. The average maturity of the total debt was 4.2 years at an average
interest rate of 5.61% per year. Only 2% (US$40 million) of the total debt matures in 2023, 13% (US$215 million) matures between 2024
and 2026, while 85% (US$1,426 million) of the total debt matures in and after 2027.
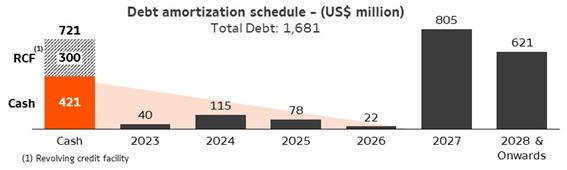
On
June 30, 2023, Nexa’s net debt12
was US$1,262 million compared with US$1,302 million at the end of 1Q23. As of June 30,
2023, Nexa was in compliance with all of its financial covenants.
| US$ million |
Jun 30, 2023 |
Mar 31, 2023 |
| Net debt |
1,262.2 |
1,301.7 |
| LTM Adj. EBITDA |
445.7 |
676.6 |
| Net debt/LTM Adj. EBITDA |
2.83x |
1.92x |
In addition to continuing to assess short-term
and mid-term commodities prices, management continues to review Nexa’s capital structure, financial position and the maturity profile
of our debt.
11
Loans and financings (“gross debt”)
12
Gross debt (US$1,681 million) minus cash and cash equivalents (US$401 million), minus financial investments (US$21 million), plus negative derivatives (US$0.2 million), plus Lease Liabilities (US$3
million). It does not include the financial instrument related to the offtake agreement.
| | 35 |
Earnings Release – 2Q23 | | |
Cash flows
| US$ million |
2Q23 |
1H23 |
| Cash provided by operating activities before working capital |
51.2 |
156.8 |
| Changes in operating assets and liabilities |
83.3 |
(21.2) |
| Net cash flows provided by (used in): |
|
|
| Operating activities |
94.7 |
39.0 |
| Investing activities |
(58.1) |
(105.2) |
| Financing activities |
(8.3) |
(39.8) |
| Increase (decrease) in cash and cash eq. |
34.4 |
(97.1) |
| Cash and cash eq. at the beginning of the period |
366.3 |
497.8 |
| Cash and cash eq. at the end of the period (1) |
400.7 |
400.7 |
(1) Does not include financial investments
totaling US$21 million at June 30, 2023.
Note: For details on Cash flows, please refer
to the “Condensed consolidated interim financial statements (unaudited) at and for the three and six-month periods ended on June
30, 2023”.
In 2Q23, the cash provided by operating
activities before working capital changes was US$51 million. Working capital changes had a positive impact of US$83 million, primarily
due to (i) the decrease in inventories of US$65 million; (ii) the decrease in trade accounts receivables of US$42 million; (iii) the increase
in confirming payables of US$37 million; and (iv) the increase in other liabilities of US$9 million, related to salaries and payroll charges,
and tax liabilities, partially offset by (v) the decrease in trade payables of US$55 million and (vi) the increase in other assets of
US$32 million, mainly related to dividends not received from Enercan and the increase in tax credits. In 2Q23, we paid US$27 million in
interest and US$12 million in taxes. Consequently, net cash from operating activities was US$95 million.
We used US$58 million of net cash flows
for investing activities in 2Q23, impacted primarily by US$60 million of CAPEX and net purchases of financial investments of US$5 million,
partially offset by dividends received of US$7 million from Enercan.
We used US$8 million in cash for financing
activities due to the payments of loans and financings and lease liabilities of US$8 million.
Foreign exchange effects on cash and cash
equivalents had a positive impact of US$6 million in the quarter, totaling US$9 million in 1H23.
As a result, cash and cash equivalents
excluding financial investments, increased by US$34 million to US$400 million at the end of 2Q23.
| | 36 |
Earnings Release – 2Q23 | | |
Others
Offtake agreement
As previously disclosed, Nexa signed an
offtake agreement with a third-party international player (“Offtaker”), in which it agreed to sell 100% of the copper concentrate
produced by Aripuanã for a 5-year period starting in October 2022 and limited to 30,810 tons, at the lower of current market prices
or a price cap.
The offtake agreement was structured to
completely extinguish a previous existing future royalty obligation that the Company had with the Offtaker. The accounting for the offtake
agreement resulted in the Company recording a non-cash gain of US$13 million in 2Q23 excluded from the reported Adjusted EBITDA.
For further information, please refer
to explanatory note 10 (e) – “Financial instruments in offtake agreement: fair value” in the “Condensed consolidated
interim financial statements (unaudited) at and for the three and six-month periods ended on June 30, 2023”.
Legal Matters
Nexa is continuing to cooperate with the
investigation by the Fiscal Office of the State of Minas Gerais and the Public Ministry of Minas Gerais (the “MG Authorities”)
of commercial and value added tax (“VAT”) related practices of certain of Nexa’s former customers, as well as Nexa’s
relationship with such former customers, that Nexa previously reported could result in liabilities for all parties involved in the commercial
relationship.
Nexa is engaged in discussions with the
MG Authorities, whereby, under a potential resolution, without admitting primary responsibility for the resolved claims, Nexa may voluntarily
make certain tax payments on behalf of certain customers that allegedly failed to properly make their tax payments, as well as a contribution
to the State of Minas Gerais including to support its ESG-related efforts. Based on the status of the discussions, in the second quarter
of fiscal 2023 Nexa recognized a provision of approximately USD 70,641, comprised of a net provision of USD 63,173 recorded in “Other
Income and Expenses, net” related to the potential resolution and USD 7,468 recorded in “Financial Expenses” related
to the potential interest to be charged in connection with its former customers’ VAT-related practices.
It is estimated that Nexa will use accumulated
tax credits to pay approximately one-half of the tax-related portion of the resolution and pay the remaining portion of the payment and
the contribution to the State of Minas Gerais in cash in a series of monthly installments over a period of approximately three years.
Nexa reserves the legal right to recover from certain customers the amounts that it will pay on behalf of those customers in connection
with any resolution.
In addition to the potential resolution
under discussion in respect of which a provision has been made, there are certain other related ongoing investigations that may result
in additional liabilities for Nexa, which are expected to be less than the potential resolution currently under discussion. The final
resolution of all of these matters involving tax payments, contributions to the State of Minas Gerais and interest are expected to have
a material impact on the Company’s business, results of operations and financial condition.
| | 37 |
Earnings Release – 2Q23 | | |
Market Scenario
2Q23
| LME Prices |
|
2Q23 |
1Q23 |
2Q22 |
2Q23 vs. 2Q22 |
1H23 |
1H22 |
1H23 vs. 1H22 |
| |
|
|
|
|
|
|
|
|
| |
|
|
|
|
|
|
|
|
| Zinc |
US$/t |
2,526 |
3,124 |
3,915 |
(35.5%) |
2,835 |
3,832 |
(26.0%) |
| Copper |
US$/t |
8,464 |
8,927 |
9,513 |
(11.0%) |
8,703 |
9,761 |
(10.8%) |
| Lead |
US$/t |
2,117 |
2,140 |
2,199 |
(3.7%) |
2,129 |
2,269 |
(6.1%) |
| Silver |
US$/oz |
24.13 |
22.55 |
22.60 |
6.8% |
23.31 |
23.32 |
(0.0%) |
| Gold |
US$/oz |
1,976 |
1,890 |
1,871 |
5.6% |
1,931 |
1,874 |
3.1% |
Source: Bloomberg
In 2Q23, the LME zinc price averaged US$2,526/t
(or US$1.15/lb), down 35% and 19% compared to 2Q22 and 1Q23, respectively. Zinc traded between US$2,224/t to US$2,937/t in 2Q23. The LME
copper price averaged US$8,464/t (US$3.84/lb) in 2Q23, down 11% from 2Q22 and 5% from 1Q23.
Several factors contributed to this drop
in prices, such as concerns about the health of the global economy that continued to weigh on base metals in general, as well as the possible
additional increase in tax rates, driven by the persistent inflation in some sectors of relevant economies, such as the U.S. Additionally,
the lower-than-expected pace of China's economy recovery after COVID-19, particularly in key segments for base metals (e.g. property and
civil construction) also contributed to the downward trend in metal prices in the quarter.
The decrease in zinc prices from 2Q22 to
2Q23 was also due to the significant impact of global sanctions starting in 2Q22 in connection with the Russia-Ukraine war, which disrupted
the global supply chain and energy prices, pushing base metal prices to historical high levels. In 1Q23, there was misplaced optimism
regarding China's recovery from COVID-19-related restrictions, which positively impacted base metal prices in the first months of the
year. However, in 2Q23, it became evident that China's recovery was not progressing as expected, leading to a drop in LME prices.
Looking ahead, the slower pace of China’s
recovery is expected continue to weigh on prices. With disappointing economic indicators in 1H23, Chinese policymakers may pursue further
stimulus such as monetary and fiscal policies. However, most analysts believe this will happen gradually, so an increase in demand for
base metals may not improve in the short-term.
In respect to our home markets (Latin America
excluding Mexico), the demand for metallic zinc was 10% higher quarter-over-quarter, mainly explained by the partial recovery of demand
in the Brazilian market. On the other hand, it was 12% lower year-over-year, affected by the civil construction and infrastructure sectors.
Although the outlook for zinc demand is still uncertain, it is expected to be slightly lower in 2023 vs 2022. This decrease is expected
amid high-interest rates and marginal economic growth projected for the region (around 1.3% GDP year-over-year).
Foreign Exchange
| FX |
|
2Q23 |
1Q23 |
2Q22 |
2Q23 vs. 2Q22 |
1H23 |
1H22 |
1H23 vs. 1H22 |
| BRL/USD (Average) |
4.948 |
5.196 |
4.926 |
0.4% |
5.074 |
5.078 |
(0.1%) |
| BRL/USD (End of period) |
4.819 |
5.080 |
5.238 |
(8.0%) |
4.819 |
5.238 |
(8.0%) |
| PEN/USD (Average) |
3.697 |
3.816 |
3.748 |
(1.3%) |
3.758 |
3.776 |
(0.5%) |
| PEN/USD (End of period) |
3.625 |
3.763 |
3.827 |
(5.3%) |
3.625 |
3.827 |
(5.3%) |
Source: Bloomberg
| | 38 |
Earnings Release – 2Q23 | | |
During 2Q23, the U.S. Dollar outperformed
most of its major counterparts. Financial markets began to focus on the Federal Reserve’s aggressive expectations.
The average exchange rate for the Brazilian
real in 2Q23 was 4.948/US$, down 4.8% from 5.196/US$ in 1Q23 and up 0.4% from 4.926/US$ in 2Q22. The real appreciated due to improved
Brazilian economic further expectations (such as lower inflation and interest rates), in addition to the tax reform and fiscal frameworks
proposed by the new government, which were already approved by the Brazilian lower house. At the end of June, the real/US$ exchange rate
was 4.819.
The average exchange rate for the Peruvian
soles in 2Q23 averaged 3.697/US$, down 3.1% compared to 1Q23 and down 1.3% compared to 2Q22. At the end of June, the Peruvian soles/US$
exchange rate was 3.625.
| | 39 |
Earnings Release – 2Q23 | | |
Risks and Uncertainties
Risk management is one of the key points
in our business strategy and contributes to value creation and increasing the level of confidence in the Company held by its main stakeholders,
including shareholders, employees, customers, suppliers and the local communities.
As a result, we have adopted an Enterprise
Risk Management (“ERM”) Policy that describes Nexa’s Risk Management Model. The ERM forms an integral part of the processes
in our operational units, corporate departments and projects, and provides support for decision-making by our Executive Officers and Board
of Directors.
The risk assessment cycle is performed
annually focusing on our strategy, operations and key projects. We seek to identify material risks, which are then assessed with consideration
of the potential health, safety, environmental, social, reputational, legal and financial impacts. By embedding risk management into our
work processes and critical business systems, we work to ensure we make decisions based on relevant inputs and valid data. The material
risks identified during the risk management process are monitored and reported to the Executive Team, Audit Committee and Board of Directors.
Our operations are exposed to a number
of inherent risks and uncertainties, and our results may be influenced by the following factors, including, among others:
| · | the cyclical and volatile prices of commodities; |
| · | the changes in the expected level of supply and demand for commodities; |
| · | foreign exchange rates and inflation; |
| · | the risks and uncertainties relating to economic and political conditions in the countries in which we
operate; |
| · | changes in global market conditions; |
| · | the impact of expanded regional or global conflict, including the conflict between Russia and Ukraine,
and the resulting potential impacts on supply and demand for commodities, global security concerns, and market volatility; |
| · | outbreaks of contagious diseases or health crises impacting overall economic activity regionally or globally,
including the COVID-19 pandemic, and the potential impact thereof on commodity prices, our business and operating sites, and the global
economy; |
| · | increasing demand and evolving expectations from stakeholders with respect to our environmental, social
and governance (“ESG”) practices, performance and disclosures, including the ability to meet energy requirements while complying
with greenhouse gas emissions regulations and other energy transition policy changes and laws in the countries in which we operate; |
| · | the impact of climate change on our operations, workforce and value chain; |
| · | environmental, safety and engineering challenges and risks inherent to mining; |
| · | the ability to meet energy requirements while complying with greenhouse gas emissions regulations and
other energy transition policy changes and laws in the countries in which we operate; |
| · | severe natural disasters, such as storms and earthquakes, disrupting our operations; |
| · | operational risks, such as operator errors, mechanical failures and other accidents; |
| · | the availability of materials, supplies, insurance coverage, equipment, required permits or approvals
and financing; |
| | 40 |
Earnings Release – 2Q23 | | |
| · | supply-chain and logistic related interruptions, including impacts to international freight and transportation
networks; |
| · | the implementation of our growth strategy and risks associated with related capital expenditures; |
| · | failure to obtain financial assurance to meet closure and remediation obligations; |
| · | the possible material differences between our estimates of mineral reserves and mineral resources and
the mineral quantities we actually recover; |
| · | the possibility that our concessions may be terminated or not renewed by governmental authorities in the
countries in which we operate; |
| · | the impact of political and government changes in the countries in which we operate, and the effects of
potential new legislation and changes in taxation; |
| · | legal and regulatory risks, including ongoing or future investigations by local authorities with respect
to our business and operations, as well as the conduct of our customers, as well as the impact to our financial statements regarding the
resolution of any such matters; |
| · | labor disputes or disagreements with local communities in the countries in which we operate; |
| · | loss of reputation due to unanticipated operational failures or significant occupational incidents; |
| · | failure or outage of our digital infrastructure or information and operating technology systems; |
| · | cyber events or attacks (including ransomware, state-sponsored and other cyberattacks) due to negligence
or IT security failures; |
| · | the future impact of competition and changes in domestic and international governmental and regulatory
policies that apply to our operations; |
| · | currency exchange rate and interest rate fluctuations; and |
For a broader discussion of risks please
refer to our annual report on form 20-F filed with the SEC (www.sec.gov), on SEDAR (www.sedar.com)
and available on the Company’s website (ir.nexaresources.com).
Use of Non-IFRS
Financial Measures
Nexa’s management uses non-IFRS
measures such as Adjusted EBITDA, cash cost net of by-products, all in sustaining cash cost net of by-products, among other measures,
for internal planning and performance measurement purposes. We believe these measures provide useful information about the financial performance
of our operations that facilitates period-to-period comparisons on a consistent basis. Management uses Adjusted EBITDA internally to evaluate
our underlying operating performance for the reporting periods presented and to assist with the planning and forecasting of future operating
results. Management believes that Adjusted EBITDA is a useful measure of our performance because it reflects our cash generation potential
from our operational activities excluding impairment of non-current assets and other miscellaneous adjustments, if any. These measures
should not be considered in isolation or as a substitute for profit (loss) or operating profit, as indicators of operating performance,
or as alternatives to cash flow as measures of liquidity. Additionally, our calculation of Adjusted EBITDA may be different from the calculation
used by other companies, including our competitors in the mining industry, so our measures may not be comparable to those of other companies.
Segment performance is measured based
on Adjusted EBITDA, since financial results, comprising financial income and expenses and foreign exchange, and income taxes are managed
at the corporate level and are not allocated to operating segments. Adjusted EBITDA is defined as net income (loss) for the period, adjusted
by (i) share in the results of associates, (ii) depreciation and amortization, (iii) net financial results, (iv) income tax, (v) gain
(loss) on sale of investments, (vi) impairment and impairment reversals, (vii) gain (loss)
on sale of long-lived assets, (viii) write-offs of long-lived assets, and (ix) remeasurement in estimates of asset retirement obligations.
In addition, management may adjust the effect of certain types of transactions that in management’s judgment are not indicative
of the Company´s normal operating activities, or do not necessarily occur on a regular basis.
| | 41 |
Earnings Release – 2Q23 | | |
Mining segment | Cash cost net of by-products
credits: for our mining operations, cash cost after by-products credits includes all direct costs associated with mining, concentrating,
leaching, solvent extraction, on-site administration and general expenses, any off-site services essential to the operation, concentrate
freight costs, marketing costs and property and severance taxes paid to state or federal agencies that are not profit-related. Treatment
and refining charges on metal sales, which are typically recognized as a deduction component of sales revenues, are added to cash cost.
Cash cost net of by-products credits is measured with respect to zinc sold per mine.
Mining segment | Cost ROM: includes all
direct production costs for mining, concentrating, leaching, on-site mineral transportation, and other on-site administration expenses,
excluding royalties and workers’ participation costs. Cost ROM is measured with respect to total treated ore volume and non-metallic
products revenue (such as limestone and stones) are considered as cost-reduction for our mining operations.
Smelting segment | Cash cost net of by-products
credits: for our smelting operations, cash cost, after by-products credits includes all the costs of smelting, including costs associated
with labor, net energy, maintenance, materials, consumables and other on-site costs, as well as raw material costs. Cash cost net of by-products
credits is measured with respect to zinc sold per smelter.
Smelting segment | Conversion cost: costs
incurred to convert zinc concentrate (feed) into final products measured with respect to contained zinc sold per smelter, including energy,
consumables, and other fixed and on-site expenses. Conversion cost does not include raw material, alloys, and by-products related cost.
Sustaining cost net of by-products credits
is defined as the cash cost, net of by-product credits plus non-expansion capital expenditure, including sustaining, health, safety and
environment, modernization and other non-expansion-related capital expenditures. Sustaining cash cost net of by-products credits is measured
with respect to zinc sold.
All in sustaining cost (“AISC”)
net of by-products credits is defined as sustaining cash cost, net of by-products credits plus corporate general and administrative expenses,
royalties and workers’ participation. AISC net of by-products credits is measured with respect to zinc sold.
Net debt: defined as (i) loans and financing
(the most comparable IFRS measure), less (ii) cash and cash equivalents, less (iii) financial investments, plus or less (iv) the fair
value of derivative financial instruments, plus (v) leases liabilities. Our management believes that net debt is an important figure because
it indicates our ability to repay outstanding debts that become due simultaneously using available cash and highly liquid assets.
All forward-looking non-IFRS financial
measures in this release, including cash cost guidance, are provided only on a non-IFRS basis. This is due to the inherent difficulty
of forecasting the timing or amount of items that would be included in the most directly comparable forward-looking IFRS financial measures.
As a result, reconciliation of the forward-looking non-IFRS financial measures to IFRS financial measures is not available without unreasonable
effort and the Company is unable to assess the probable significance of the unavailable information.
See “Cautionary Statement on Forward-Looking
Statements” below.
Technical information
Jose Antonio Lopes, MausIMM CP (Geo):
224829, a mineral resources manager, a qualified person for purposes of National Instrument 43-101 and a Nexa employee, has approved the
scientific and technical information contained in this Earnings Release. Please note that the mineral reserves included in this Earnings Release were
estimated in accordance with the Canadian Institute of Mining, Metallurgy and Petroleum (“CIM”) 2014 Definition Standards
For Mineral Resources and Mineral Reserves, whose definitions are incorporated by reference in National Instrument 43-101. Accordingly,
such information may not be comparable to similar information prepared in accordance with Subpart 1300 of Regulation S-K (“S-K 1300”).
For a discussion of the differences between the requirements under S-K 1300 and NI 43-101, please see our annual report on Form 20-F.
Our estimates of mineral reserves may be materially different from mineral quantities we actually recover, and market price fluctuations
and changes in operating capital costs may render certain mineral reserves uneconomical to mine.
| | 42 |
Earnings Release – 2Q23 | | |
CAUTIONARY STATEMENT
ON FORWARD-LOOKING STATEMENTS
This Earnings
Release contains certain forward-looking information and forward-looking statements as defined in applicable securities laws (collectively
referred to in this Earnings Release as “forward-looking statements”). All statements other than statements of historical
fact are forward-looking statements. The words “believe,” “will,” “may,” “may have,” “would,”
“estimate,” “continues,” “anticipates,” “intends,” “plans,” “expects,”
“budget,” “scheduled,” “forecasts” and similar words are intended to identify estimates and forward-looking
statements. Forward-looking statements are not guarantees and involve known and unknown risks, uncertainties and other factors which may
cause the actual results, performance or achievements of NEXA to be materially different from any future results, performance or achievements
expressed or implied by the forward-looking statements. Actual results and developments may be substantially different from the expectations
described in the forward-looking statements for a number of reasons, many of which are not under our control, among them, the activities
of our competition, the future global economic situation, weather conditions, market prices and conditions, exchange rates, and operational
and financial risks. The unexpected occurrence of one or more of the abovementioned events may significantly change the results of our
operations on which we have based our estimates and forward-looking statements. Our estimates and forward-looking statements may also
be influenced by, among others, legal, political, environmental or other risks that could materially affect the potential development
of our projects, including risks related to outbreaks of contagious diseases or health crises impacting overall economic activity regionally
or globally, as well as risks relating to ongoing or future investigations by local authorities with respect to our business and
operations and the conduct of our customers, including the impact to our financial statements regarding the resolution of any such matters.
These forward-looking statements related
to future events or future performance and include current estimates, predictions, forecasts, beliefs and statements as to management’s
expectations with respect to, but not limited to, the business and operations of the Company and mining production our growth strategy,
the impact of applicable laws and regulations, future zinc and other metal prices, smelting sales, CAPEX, expenses related to exploration
and project evaluation, estimation of mineral reserves and mineral resources, mine life and our financial liquidity.
Forward-looking statements are necessarily
based upon a number of factors and assumptions that, while considered reasonable and appropriate by management, are inherently subject
to significant business, economic and competitive uncertainties and contingencies and may prove to be incorrect. Statements concerning
future production costs or volumes are based on numerous assumptions of management regarding operating matters and on assumptions that
demand for products develops as anticipated, that customers and other counterparties perform their contractual obligations, full integration
of mining and smelting operations, that operating and capital plans will not be disrupted by issues such as mechanical failure, unavailability
of parts and supplies, labor disturbances, interruption in transportation or utilities, adverse weather conditions, and other COVID-19
related impacts, and that there are no material unanticipated variations in metal prices, exchange rates, or the cost of energy, supplies
or transportation, among other assumptions.
We assume no obligation to update forward-looking
statements except as required under securities laws. Estimates and forward-looking statements refer only to the date when they were made,
and we
| | 43 |
Earnings Release – 2Q23 | | |
do not undertake any obligation to update
or revise any estimate or forward-looking statement due to new information, future events or otherwise, except as required by law. Estimates
and forward-looking statements involve risks and uncertainties and do not guarantee future performance, as actual results or developments
may be substantially different from the expectations described in the forward-looking statements. Further
information concerning risks and uncertainties associated with these forward-looking statements and our business can be found in our
annual report on Form 20-F and in our other public disclosures available on our website and filed under our profile on SEDAR (www.sedar.com)
and on EDGAR (www.sec.gov).
| | 44 |
Earnings Release – 2Q23 | | |
Appendix
| Income Statement |
45 |
Net cash flows from operating activities excluding working capital changes
and free cash flow - Reconciliation |
46 |
| CAPEX |
47 |
| All in Sustaining Cash Cost | Mining |
48 |
| Conversion and All in Sustaining Cash Cost | Smelting |
52 |
| | 45 |
Earnings Release – 2Q23 | | |
Income Statement
| US$ million |
1Q22 |
2Q22 |
3Q22 |
4Q22 |
1Q23 |
2Q23 |
| Net Revenues |
722.1 |
829.4 |
702.6 |
779.8 |
667.3 |
626.7 |
| Cost of sales |
(524.8) |
(556.3) |
(617.8) |
(696.2) |
(567.8) |
(565.0) |
| Gross Profit |
197.4 |
273.1 |
84.8 |
83.6 |
99.5 |
61.7 |
| SG&A |
(36.0) |
(37.1) |
(31.6) |
(40.8) |
(28.5) |
(32.6) |
| Mineral Exploration and Project Evaluation |
(17.2) |
(26.8) |
(27.4) |
(27.4) |
(22.0) |
(21.3) |
| Impairment of long-lived assets |
- |
- |
- |
(32.5) |
- |
(57.2) |
| Other income and expenses, net |
(20.9) |
30.4 |
12.8 |
(25.0) |
(5.5) |
(66.1) |
| Operating income (loss) |
123.2 |
239.6 |
38.6 |
(42.1) |
43.5 |
(115.5) |
| Share in the results of associates |
- |
- |
- |
1.9 |
5.4 |
5.7 |
| Net Financial Results |
10.7 |
(74.2) |
(52.3) |
(17.9) |
(39.2) |
(26.5) |
| Financial income |
3.7 |
8.4 |
6.7 |
6.2 |
5.6 |
6.7 |
| Financial expenses |
(43.4) |
(40.3) |
(41.6) |
(43.4) |
(46.4) |
(59.4) |
| Other financial items, net |
50.3 |
(42.3) |
(17.4) |
19.4 |
1.6 |
26.1 |
| Depreciation, amortization and depletion |
(65.9) |
(74.4) |
(72.8) |
(77.9) |
(71.7) |
(71.7) |
| Adjusted EBITDA |
216.7 |
302.4 |
121.1 |
120.2 |
133.0 |
71.5 |
| Adj. EBITDA margin |
30.0% |
36.5% |
17.2% |
15.4% |
19.9% |
11.4% |
| Income Tax |
(59.6) |
(41.8) |
(26.2) |
(23.3) |
(25.1) |
33.5 |
| Net Income (loss) |
74.2 |
123.5 |
(39.9) |
(81.4) |
(15.4) |
(102.8) |
| Attributable to Nexa's shareholders |
63.0 |
109.0 |
(41.2) |
(81.7) |
(19.7) |
(102.5) |
| Attributable to non-controlling interests |
11.2 |
14.5 |
1.4 |
0.3 |
4.3 |
(0.3) |
| Weighted average number of outstanding shares - in thousand |
132,439 |
132,439 |
132,439 |
132,439 |
132,439 |
132,439 |
| Basic and diluted earnings (loss) per share - (in US$) |
0.48 |
0.82 |
(0.31) |
(0.62) |
(0.15) |
(0.77) |
| Adjusted Net Income (loss) |
101.9 |
111.9 |
(30.2) |
2.9 |
2.4 |
12.5 |
| Adjusted Basic and diluted earnings (loss) per share - (in US$) |
0.69 |
0.74 |
(0.24) |
(0.04) |
(0.01) |
0.04 |
| | 46 |
Earnings Release – 2Q23 | | |
Net cash flows
from operating activities excluding working capital changes and free cash flow - Reconciliation
Nexa manages and reports cash flows from
operating activities excluding changes in working capital. Working capital can be volatile due to several factors, including prices and
a build-up or reduction of inventories.
Furthermore, we also exclude from the
analysis interest and income tax payments. Management believes excluding these measures provides investors a better visibility of the
operating cash flow performance and our capital allocation strategy.
The following table provides a reconciliation
of the cash from operating activities before changes in working capital to free cash flow.
| US$ million |
2Q23 |
1H23 |
| |
|
|
| Cash provided by operating activities |
135 |
136 |
| (-) Working capital changes |
83 |
(21) |
| Trade accounts receivables |
42 |
100 |
| Inventory |
65 |
60 |
| Other assets |
(14) |
(32) |
| Payables |
(18) |
(118) |
| Other liabilities |
9 |
(32) |
| |
|
|
| Cash flows from operations excluding working capital changes |
51 |
157 |
| |
|
|
| Interest paid |
(27) |
(59) |
| Income tax |
(12) |
(37) |
| Sustaining CAPEX (1) |
(63) |
(121) |
| |
|
|
| Net cash flows from operations excluding working capital changes |
(54) |
(63) |
| |
|
|
| Other investments (2) |
3 |
5 |
| Loans and investments (3) |
(6) |
(3) |
| Dividends and share premium |
0 |
(25) |
| Foreign exchange effects |
6 |
9 |
| Working capital changes |
83 |
(21) |
| |
|
|
| Free cash flow |
34 |
(97) |
(1) Non expansion investments related to sustaining
and HS&E.
(2) Other non-expansion investments. Refer to
page 7 of this earnings release for CAPEX breakdown.
(3) Loans and financing, bonds repurchase and
net sales of financial investments.
For details on cash flows, please refer to the
“Condensed consolidated interim financial statements (unaudited) at and for the three and six-month periods ended on June 30, 2023”.
| | 47 |
Earnings Release – 2Q23 | | |
CAPEX
| US$ million |
2Q23 |
1Q23 |
4Q22 |
3Q22 |
2Q22 |
1Q22 |
2022 |
| Mining |
30.4 |
45.4 |
55.6 |
37.1 |
28.2 |
25.2 |
146.1 |
| Cerro Lindo |
10.9 |
8.3 |
14.9 |
9.6 |
10.1 |
7.8 |
42.5 |
| El Porvenir |
9.7 |
13.4 |
16.9 |
9.5 |
5.3 |
5.0 |
36.7 |
| Atacocha |
2.5 |
4.7 |
1.1 |
0.5 |
0.7 |
2.0 |
4.5 |
| Vazante |
9.6 |
6.4 |
20.6 |
16.4 |
9.6 |
9.0 |
55.6 |
| Morro Agudo |
1.1 |
0.2 |
2.1 |
1.0 |
2.4 |
1.3 |
6.8 |
| Aripuanã (1) |
(3.4) |
12.4 |
- |
- |
- |
- |
0.0 |
| Smelting |
14.7 |
10.7 |
30.7 |
30.7 |
33.2 |
15.4 |
109.9 |
| Cajamarquilla |
4.5 |
4.5 |
12.9 |
12.2 |
14.5 |
5.7 |
45.3 |
| Três Marias |
7.3 |
3.9 |
12.2 |
11.9 |
11.9 |
6.0 |
42.1 |
| Juiz de Fora |
2.9 |
2.3 |
5.5 |
6.5 |
6.8 |
3.6 |
22.4 |
| Other |
14.8 |
0.1 |
29.5 |
17.2 |
36.5 |
42.0 |
125.3 |
| Total |
59.9 |
56.2 |
115.8 |
85.0 |
97.9 |
82.5 |
381.2 |
| |
|
|
|
|
|
|
|
| Sustaining (US$ million) |
2Q23 |
1Q23 |
4Q22 |
3Q22 |
2Q22 |
1Q22 |
2022 |
| Mining |
47.3 |
47.7 |
45.8 |
29.3 |
26.1 |
22.8 |
124.1 |
| Cerro Lindo |
9.4 |
8.0 |
12.8 |
8.6 |
9.4 |
7.3 |
38.1 |
| El Porvenir |
9.7 |
13.4 |
16.6 |
9.4 |
5.1 |
4.7 |
35.7 |
| Atacocha |
2.5 |
4.7 |
1.1 |
0.5 |
0.8 |
2.0 |
4.4 |
| Vazante |
8.8 |
6.2 |
13.4 |
9.9 |
8.6 |
7.7 |
39.5 |
| Morro Agudo |
1.0 |
0.2 |
1.9 |
0.9 |
2.3 |
1.1 |
6.3 |
| Aripuanã |
15.9 |
15.2 |
- |
- |
- |
- |
0.0 |
| Smelting |
10.9 |
7.9 |
16.7 |
18.3 |
23.8 |
9.7 |
68.5 |
| Cajamarquilla |
3.2 |
4.0 |
10.2 |
10.0 |
13.1 |
5.2 |
38.5 |
| Três Marias |
5.2 |
2.4 |
2.8 |
2.8 |
5.5 |
2.6 |
13.7 |
| Juiz de Fora |
2.5 |
1.5 |
3.7 |
5.4 |
5.2 |
2.0 |
16.3 |
| Total Operations Sustaining |
58.2 |
55.6 |
62.5 |
47.6 |
49.9 |
32.5 |
192.5 |
| Corporate Sustaining (2) |
0.3 |
0.4 |
17.6 |
11.1 |
11.0 |
7.4 |
47.2 |
| Total Sustaining |
58.5 |
56.0 |
80.1 |
58.7 |
61.0 |
39.9 |
239.7 |
(1) The negative amounts are mainly related
to reclassifications between Aripuanã and Corporate, and capitalization of interest net of advanced payments for imported materials
and tax credits.
(2) Until 4Q22, Aripuanã sustaining expenses
were included in Corporate Sustaining.
| | 48 |
Earnings Release – 2Q23 | | |
All in Sustaining
Cash Cost | Mining (1)
2Q23
| |
US$ million
(excepted indicated otherwise) |
Vazante |
Morro Agudo |
Cerro Lindo |
El Porvenir |
Atacocha |
Consolidation of Operations |
Corporate & Others |
Mining |
| |
Sales Volume (Zinc content in Products) |
|
|
|
|
|
|
|
|
| |
Tonnes |
36,556 |
5,052 |
17,468 |
14,498 |
2,356 |
75,929 |
|
75,929 |
| (+) |
COGS |
32.0 |
17.6 |
86.5 |
48.1 |
19.8 |
204.0 |
(4.9) |
199.1 |
| (+) |
On-site G&A |
0.2 |
0.1 |
0.1 |
0.2 |
0.1 |
0.7 |
|
0.7 |
| (-) |
By-products revenue |
(4.3) |
(8.8) |
(78.5) |
(35.0) |
(19.3) |
(145.9) |
7.5 |
(138.3) |
| (+) |
Treatment Charges |
28.4 |
3.2 |
9.4 |
9.3 |
1.5 |
51.9 |
|
51.9 |
| (+) |
Selling Expenses |
0.1 |
0.1 |
0.9 |
0.2 |
0.0 |
1.3 |
|
1.3 |
| (-) |
Depreciation, amortization and depletion |
(6.1) |
(2.0) |
(20.4) |
(9.8) |
(4.1) |
(42.4) |
|
(42.4) |
| (-) |
Royalties |
(0.6) |
(0.3) |
0.0 |
(0.3) |
0.0 |
(1.2) |
|
(1.2) |
| (-) |
Workers participation & Bonus |
(0.8) |
(0.3) |
(0.8) |
(0.4) |
(0.2) |
(2.5) |
|
(2.5) |
| (+) |
Others |
0.2 |
0.1 |
(2.2) |
(1.3) |
(3.3) |
(6.5) |
|
(6.5) |
| (=) |
Cash Cost (Sold) |
49.2 |
9.7 |
(5.0) |
11.1 |
(5.5) |
59.5 |
2.6 |
62.1 |
| |
Cash Cost (Sold) (per ton) |
1,345.8 |
1,913.1 |
(286.1) |
763.6 |
(2,321.9) |
783.2 |
0.0 |
817.5 |
| (+) |
Sustaining Capital Expenditure |
8.9 |
1.1 |
10.9 |
9.7 |
2.5 |
33.1 |
(0.5) |
32.6 |
| (=) |
Sustaining Cash Cost (Sold) |
58.1 |
10.8 |
5.9 |
20.8 |
(3.0) |
92.5 |
2.1 |
94.7 |
| |
Sustaining Cash Cost (Sold) (per ton) |
1,589.2 |
2,137.8 |
336.5 |
1,432.7 |
(1,272.1) |
1,218.8 |
0.0 |
1,246.7 |
| (+) |
Workers participation & Bonus |
0.8 |
0.3 |
0.8 |
0.4 |
0.2 |
2.5 |
|
2.5 |
| (+) |
Royalties |
0.6 |
0.3 |
0.0 |
0.3 |
0.0 |
1.2 |
|
1.2 |
| (+) |
Corporate G&A |
|
|
|
|
|
|
9.7 |
9.7 |
| (=) |
AISC (Sold) |
|
|
|
|
|
|
|
108.0 |
| (=) |
AISC (Sold) (per ton) |
|
|
|
|
|
|
|
1,422.8 |
| (=) |
AISC (Sold) in US$/lb |
|
|
|
|
|
|
|
0.65 |
Note: Cash cost and AISC per ton sold does not
include the impact of the cost of idleness capacity of US$0.9 million in Atacocha in 2Q23.
(1) Our cash cost, sustaining cash cost
and AISC are net of by-products credits, measured with respect to zinc sold.
| | 49 |
Earnings Release – 2Q23 | | |
2Q22
| |
US$ million
(excepted indicated otherwise) |
Vazante |
Morro Agudo |
Cerro Lindo |
El Porvenir |
Atacocha |
Consolidation of Operations |
Corporate & Others |
Mining |
| |
Sales Volume (Zinc content in Products) |
|
|
|
|
|
|
|
|
| |
Tonnes |
36,542 |
4,743 |
22,909 |
13,987 |
2,307 |
80,488 |
|
80,488 |
| (+) |
COGS |
29.4 |
17.7 |
105.9 |
45.6 |
21.1 |
219.7 |
(4.1) |
215.6 |
| (+) |
On-site G&A |
0.3 |
0.2 |
0.1 |
0.2 |
0.1 |
0.9 |
|
0.9 |
| (-) |
By-products revenue |
(1.4) |
(7.3) |
(108.0) |
(31.6) |
(19.8) |
(168.1) |
6.5 |
(161.6) |
| (+) |
Treatment Charges |
26.9 |
2.7 |
11.2 |
7.8 |
1.3 |
49.8 |
|
49.8 |
| (+) |
Selling Expenses |
(0.2) |
(1.0) |
1.1 |
0.3 |
0.0 |
0.2 |
|
0.2 |
| (-) |
Depreciation, amortization and depletion |
(6.8) |
(3.6) |
(31.3) |
(6.2) |
(3.4) |
(51.2) |
|
(51.2) |
| (-) |
Royalties |
(0.6) |
(0.4) |
(1.8) |
(0.7) |
(0.3) |
(3.7) |
|
(3.7) |
| (-) |
Workers participation & Bonus |
(0.4) |
(0.2) |
(7.7) |
(2.2) |
(0.2) |
(10.9) |
|
(10.9) |
| (+) |
Others |
(1.3) |
(0.3) |
0.4 |
(3.6) |
(5.2) |
(10.0) |
|
(10.0) |
| (=) |
Cash Cost (Sold) |
45.9 |
7.8 |
(30.0) |
9.6 |
(6.5) |
26.7 |
2.4 |
29.1 |
| |
Cash Cost (Sold) (per ton) |
1,256.8 |
1,636.3 |
(1,311.1) |
687.2 |
(2,828.0) |
332.2 |
0.0 |
361.8 |
| (+) |
Sustaining Capital Expenditure |
9.2 |
2.4 |
10.1 |
5.3 |
0.7 |
27.8 |
13.5 |
41.3 |
| (=) |
Sustaining Cash Cost (Sold) |
55.1 |
10.2 |
(19.9) |
14.9 |
(5.8) |
54.5 |
15.9 |
70.4 |
| |
Sustaining Cash Cost (Sold) (per ton) |
1,509.1 |
2,145.1 |
(868.8) |
1,065.8 |
(2,504.5) |
677.7 |
0.0 |
875.1 |
| (+) |
Workers participation & Bonus |
0.4 |
0.2 |
7.7 |
2.2 |
0.2 |
10.9 |
|
10.9 |
| (+) |
Royalties |
0.6 |
0.4 |
1.8 |
0.7 |
0.3 |
3.7 |
|
3.7 |
| (+) |
Corporate G&A |
|
|
|
|
|
|
12.6 |
12.6 |
| (=) |
AISC (Sold) |
|
|
|
|
|
|
|
97.6 |
| (=) |
AISC (Sold) (per ton) |
|
|
|
|
|
|
|
1,213.0 |
| (=) |
AISC (Sold) in US$/lb |
|
|
|
|
|
|
|
0.55 |
Note: Cash cost and AISC per ton sold does not
include the impact of the cost of idleness capacity of US$1.2 million in Atacocha in 2Q22.
| | 50 |
Earnings Release – 2Q23 | | |
1H23
| |
US$ million
(excepted indicated otherwise) |
Vazante |
Morro Agudo |
Cerro Lindo |
El Porvenir |
Atacocha |
Consolidation of Operations |
Corporate & Others |
Mining |
| |
Sales Volume (Zinc content in Products) |
|
|
|
|
|
|
|
|
| |
Tonnes |
72,393 |
10,401 |
32,301 |
28,941 |
4,628 |
148,663 |
|
148,663 |
| (+) |
COGS |
61.7 |
33.1 |
168.1 |
99.9 |
36.3 |
399.2 |
(3.3) |
395.9 |
| (+) |
On-site G&A |
0.2 |
0.2 |
0.2 |
0.2 |
0.1 |
1.0 |
|
1.0 |
| (-) |
By-products revenue |
(7.5) |
(13.0) |
(139.2) |
(70.5) |
(34.1) |
(264.4) |
7.0 |
(257.3) |
| (+) |
Treatment Charges |
56.9 |
6.8 |
16.5 |
17.0 |
2.7 |
100.0 |
|
100.0 |
| (+) |
Selling Expenses |
0.1 |
(0.3) |
1.3 |
0.4 |
0.1 |
1.6 |
|
1.6 |
| (-) |
Depreciation, amortization and depletion |
(11.5) |
(3.8) |
(41.9) |
(20.3) |
(8.0) |
(85.6) |
|
(85.6) |
| (-) |
Royalties |
(1.1) |
(0.7) |
(0.7) |
(1.6) |
(0.2) |
(4.3) |
|
(4.3) |
| (-) |
Workers participation & Bonus |
(1.2) |
(0.6) |
(2.5) |
(1.9) |
(0.5) |
(6.6) |
|
(6.6) |
| (+) |
Others |
1.3 |
0.3 |
(7.8) |
(5.0) |
(2.5) |
(13.7) |
|
(13.7) |
| (=) |
Cash Cost (Sold) |
99.0 |
22.1 |
(5.8) |
18.1 |
(6.1) |
127.3 |
3.7 |
131.0 |
| |
Cash Cost (Sold) (per ton) |
1,368.0 |
2,120.1 |
(179.6) |
625.3 |
(1,312.9) |
856.3 |
0.0 |
881.2 |
| (+) |
Sustaining Capital Expenditure |
15.1 |
1.4 |
19.2 |
23.1 |
7.1 |
66.0 |
12.0 |
78.0 |
| (=) |
Sustaining Cash Cost (Sold) |
114.2 |
23.4 |
13.4 |
41.2 |
1.1 |
193.3 |
15.7 |
209.0 |
| |
Sustaining Cash Cost (Sold) (per ton) |
1,576.9 |
2,253.0 |
415.5 |
1,423.3 |
229.0 |
1,300.0 |
0.0 |
1,405.8 |
| (+) |
Workers participation & Bonus |
1.2 |
0.6 |
2.5 |
1.9 |
0.5 |
6.6 |
|
6.6 |
| (+) |
Royalties |
1.1 |
0.7 |
0.7 |
1.6 |
0.2 |
4.3 |
|
4.3 |
| (+) |
Corporate G&A |
|
|
|
|
|
|
22.0 |
22.0 |
| (=) |
AISC (Sold) |
|
|
|
|
|
|
|
241.9 |
| (=) |
AISC (Sold) (per ton) |
|
|
|
|
|
|
|
1,627.0 |
| (=) |
AISC (Sold) in US$/lb |
|
|
|
|
|
|
|
0.74 |
Note: Cash cost and AISC per ton sold does not
include the impact of the cost of idleness capacity of US$0.9 million in Atacocha and US$5.2 million in Cerro Lindo in 1H23.
(1) Our cash cost, sustaining cash cost
and AISC are net of by-products credits, measured with respect to zinc sold.
| | 51 |
Earnings Release – 2Q23 | | |
1H22
| |
US$ million
(excepted indicated otherwise) |
Vazante |
Morro Agudo |
Cerro Lindo |
El Porvenir |
Atacocha |
Consolidation of Operations |
Corporate & Others |
Mining |
| |
Sales Volume (Zinc content in Products) |
|
|
|
|
|
|
|
|
| |
Tonnes |
61,438 |
9,491 |
46,300 |
27,499 |
4,407 |
149,136 |
|
149,136 |
| (+) |
COGS |
55.9 |
30.7 |
202.9 |
88.6 |
36.4 |
414.4 |
(5.5) |
408.9 |
| (+) |
On-site G&A |
0.6 |
0.4 |
0.2 |
0.3 |
0.2 |
1.7 |
|
1.7 |
| (-) |
By-products revenue |
(4.3) |
(10.4) |
(195.7) |
(60.2) |
(34.3) |
(304.8) |
9.5 |
(295.3) |
| (+) |
Treatment Charges |
40.6 |
4.6 |
20.9 |
14.2 |
2.2 |
82.6 |
|
82.6 |
| (+) |
Selling Expenses |
(0.5) |
(1.4) |
1.5 |
0.6 |
0.3 |
0.5 |
|
0.5 |
| (-) |
Depreciation, amortization and depletion |
(12.5) |
(4.8) |
(60.2) |
(12.0) |
(6.6) |
(96.1) |
|
(96.1) |
| (-) |
Royalties |
(1.0) |
(0.7) |
(3.4) |
(2.4) |
(0.5) |
(8.0) |
|
(8.0) |
| (-) |
Workers participation & Bonus |
(0.8) |
(0.5) |
(11.7) |
(3.7) |
(0.6) |
(17.3) |
|
(17.3) |
| (+) |
Others |
(6.8) |
(0.6) |
(2.0) |
(4.6) |
(4.9) |
(18.9) |
|
(18.9) |
| (=) |
Cash Cost (Sold) |
71.3 |
17.5 |
(47.5) |
20.7 |
(7.9) |
54.1 |
4.0 |
58.1 |
| |
Cash Cost (Sold) (per ton) |
1,160.3 |
1,842.8 |
(1,025.4) |
753.4 |
(1,792.4) |
362.9 |
0.0 |
389.7 |
| (+) |
Sustaining Capital Expenditure |
18.1 |
3.7 |
18.0 |
10.3 |
2.8 |
52.9 |
28.0 |
80.9 |
| (=) |
Sustaining Cash Cost (Sold) |
89.4 |
21.2 |
(29.5) |
31.0 |
(5.1) |
107.0 |
32.0 |
139.0 |
| |
Sustaining Cash Cost (Sold) (per ton) |
1,454.8 |
2,237.4 |
(637.5) |
1,127.9 |
(1,159.2) |
717.5 |
0.0 |
932.1 |
| (+) |
Workers participation & Bonus |
0.8 |
0.5 |
11.7 |
3.7 |
0.6 |
17.3 |
|
17.3 |
| (+) |
Royalties |
1.0 |
0.7 |
3.4 |
2.4 |
0.5 |
8.0 |
|
8.0 |
| (+) |
Corporate G&A |
|
|
|
|
|
|
24.5 |
24.5 |
| (=) |
AISC (Sold) |
|
|
|
|
|
|
|
188.8 |
| (=) |
AISC (Sold) (per ton) |
|
|
|
|
|
|
|
1,265.8 |
| (=) |
AISC (Sold) in US$/lb |
|
|
|
|
|
|
|
0.57 |
Note: Cash cost and AISC per ton sold does not
include the impact of the cost of idleness capacity of US$2.1 million in Atacocha and US$4.4 million in Vazante in 1H22.
| | 52 |
Earnings Release – 2Q23 | | |
Conversion and
All in Sustaining Cash Cost | Smelting (2)
2Q23
| |
US$ million
(excepted indicated otherwise) |
Três Marias |
Juiz de Fora |
Cajamarquilla |
Consolidation of Operations |
Corporate |
Smelting |
| |
Sales Volume (Zinc content in Products) |
|
|
|
|
|
|
| |
Tonnes |
45,572 |
20,194 |
81,054 |
146,820 |
|
146,820 |
| (+) |
COGS |
131.5 |
66.6 |
218.1 |
416.2 |
(1.0) |
415.1 |
| (-) |
Cost of freight |
(5.1) |
(2.0) |
(9.1) |
(16.2) |
|
(16.2) |
| (+) |
On-site G&A |
0.3 |
0.2 |
1.3 |
1.7 |
|
1.7 |
| (-) |
Depreciation, amortization and depletion |
(4.9) |
(3.4) |
(10.6) |
(18.8) |
|
(18.8) |
| (-) |
By-products revenue |
(4.1) |
(6.1) |
(33.2) |
(43.4) |
1.0 |
(42.4) |
| (-) |
Workers participation & Bonus |
(0.5) |
(0.6) |
(1.0) |
(2.1) |
|
(2.1) |
| (+) |
Others |
0.8 |
0.5 |
24.7 |
25.9 |
|
25.9 |
| (=) |
Cash Cost (Sold) |
118.1 |
55.1 |
190.1 |
363.3 |
0.0 |
363.3 |
| |
Cash Cost (Sold) (per ton) |
2,590.7 |
2,727.8 |
2,345.7 |
2,474.3 |
|
2,474.3 |
| (+) |
Sustaining Capital Expenditure |
7.3 |
2.9 |
4.2 |
14.5 |
14.3 |
28.8 |
| (=) |
Sustaining Cash Cost (Sold) |
125.4 |
58.0 |
194.4 |
377.7 |
14.3 |
392.1 |
| |
Sustaining Cash Cost (Sold) (per ton) |
2,751.1 |
2,871.8 |
2,398.1 |
2,572.8 |
|
2,670.5 |
| (+) |
Workers participation & Bonus |
0.5 |
0.6 |
1.0 |
2.1 |
|
2.1 |
| (+) |
Corporate G&A |
|
|
|
|
5.4 |
5.4 |
| (=) |
AISC (Sold) |
|
|
|
|
|
399.5 |
| (=) |
AISC (Sold) (per ton) |
|
|
|
|
|
2,721.2 |
| (=) |
AISC (Sold) in US$/lb |
|
|
|
|
|
1.23 |
Note: Cash cost and AISC per ton sold does
not include the impact of the cost of metal purchased for resale.
| |
US$ million
(excepted indicated otherwise) |
Três Marias |
Juiz de Fora |
Cajamarquilla |
Smelting |
| |
Contained Zinc Sales |
|
|
|
|
| |
Tonnes |
45,572 |
20,194 |
81,054 |
146,820 |
| |
COGS |
131.5 |
66.6 |
218.1 |
416.2 |
| (-) |
Raw Material |
(60.7) |
(46.7) |
(156.3) |
(263.7) |
| (+) |
By product cost |
(19.7) |
(0.4) |
(7.6) |
(27.7) |
| (+/-) |
Consolidation effects |
(2.1) |
5.1 |
(8.5) |
(5.5) |
| (+) |
Others |
(22.3) |
(4.2) |
7.7 |
(18.8) |
| (=) |
Conversion Cost |
26.6 |
20.4 |
53.4 |
100.4 |
| (=) |
Conversion Cost in US$/t |
584.2 |
1,010.8 |
658.3 |
683.8 |
| (=) |
Conversion Cost in US$/lb |
0.26 |
0.46 |
0.30 |
0.31 |
(2) Our conversion cost, cash cost, sustaining
cash cost and AISC net of by-products credits are measured with respect to zinc sold.
| | 53 |
Earnings Release – 2Q23 | | |
2Q22
| |
US$ million
(excepted indicated otherwise) |
Três Marias |
Juiz de Fora |
Cajamarquilla |
Consolidation of Operations |
Corporate |
Smelting |
| |
Sales Volume (Zinc content in Products) |
|
|
|
|
|
|
| |
Tonnes |
46,455 |
20,326 |
78,456 |
145,237 |
|
145,237 |
| (+) |
COGS |
184.8 |
83.0 |
287.2 |
555.0 |
(2.0) |
553.0 |
| (-) |
Cost of freight |
(4.2) |
(1.9) |
(14.2) |
(20.2) |
|
(20.2) |
| (+) |
On-site G&A |
0.7 |
0.3 |
1.8 |
2.9 |
|
2.9 |
| (-) |
Depreciation, amortization and depletion |
(6.1) |
(3.5) |
(12.2) |
(21.8) |
|
(21.8) |
| (-) |
By-products revenue |
(2.0) |
(9.7) |
(43.3) |
(55.0) |
2.0 |
(53.0) |
| (-) |
Workers participation & Bonus |
(0.3) |
(0.3) |
(4.3) |
(4.9) |
|
(4.9) |
| (+) |
Others |
(2.3) |
(0.8) |
13.8 |
10.7 |
|
10.7 |
| (=) |
Cash Cost (Sold) |
170.6 |
67.1 |
228.9 |
466.7 |
0.0 |
466.7 |
| |
Cash Cost (Sold) (per ton) |
3,672.6 |
3,302.5 |
2,918.1 |
3,213.3 |
|
3,213.3 |
| (+) |
Sustaining Capital Expenditure |
11.9 |
6.8 |
14.5 |
33.2 |
(5.5) |
27.7 |
| (=) |
Sustaining Cash Cost (Sold) |
182.5 |
73.9 |
243.4 |
499.9 |
(5.5) |
494.4 |
| |
Sustaining Cash Cost (Sold) (per ton) |
3,929.0 |
3,637.7 |
3,102.4 |
3,441.7 |
|
3,404.0 |
| (+) |
Workers participation & Bonus |
0.3 |
0.3 |
4.3 |
4.9 |
|
4.9 |
| (+) |
Corporate G&A |
|
|
|
|
7.2 |
7.2 |
| (=) |
AISC (Sold) |
|
|
|
|
|
506.5 |
| (=) |
AISC (Sold) (per ton) |
|
|
|
|
|
3,487.3 |
| (=) |
AISC (Sold) in US$/lb |
|
|
|
|
|
1.58 |
Note: Cash cost and AISC per ton sold does
not include the impact of the cost of metal purchased for resale.
| |
US$ million
(excepted indicated otherwise) |
Três Marias |
Juiz de Fora |
Cajamarquilla |
Smelting |
| |
Contained Zinc Sales |
|
|
|
|
| |
Tonnes |
46,455 |
20,326 |
78,456 |
145,237 |
| |
COGS |
184.8 |
83.0 |
287.2 |
555.0 |
| (-) |
Raw Material |
(132.5) |
(66.1) |
(236.0) |
(434.6) |
| (+) |
By product cost |
(17.0) |
(1.1) |
(8.1) |
(26.3) |
| (+/-) |
Consolidation effects |
(0.6) |
2.4 |
17.6 |
19.4 |
| (+) |
Others |
(14.8) |
(0.4) |
(6.4) |
(21.6) |
| (=) |
Conversion Cost |
19.9 |
17.8 |
54.2 |
91.9 |
| (=) |
Conversion Cost in US$/t |
428.1 |
876.0 |
691.3 |
632.9 |
| (=) |
Conversion Cost in US$/lb |
0.19 |
0.40 |
0.31 |
0.29 |
Note: Cash cost and AISC per ton sold does
not include the impact of the cost of idleness capacity of US$2.3 million in Três Marias in 1Q22.
| | 54 |
Earnings Release – 2Q23 | | |
1H23
| |
US$ million
(excepted indicated otherwise) |
Três Marias |
Juiz de Fora |
Cajamarquilla |
Consolidation of Operations |
Corporate |
Smelting |
| |
Sales Volume (Zinc content in Products) |
|
|
|
|
|
|
| |
Tonnes |
88,697 |
40,242 |
159,703 |
288,642 |
|
288,642 |
| (+) |
COGS |
269.7 |
137.6 |
478.7 |
886.0 |
(2.3) |
883.7 |
| (-) |
Cost of freight |
(10.0) |
(5.0) |
(24.0) |
(39.0) |
|
(39.0) |
| (+) |
On-site G&A |
0.6 |
0.3 |
2.6 |
3.5 |
|
3.5 |
| (-) |
Depreciation, amortization and depletion |
(9.5) |
(6.5) |
(21.6) |
(37.5) |
|
(37.5) |
| (-) |
By-products revenue |
(6.6) |
(12.7) |
(67.0) |
(86.3) |
2.3 |
(84.0) |
| (-) |
Workers participation & Bonus |
(0.8) |
(0.9) |
(4.8) |
(6.5) |
|
(6.5) |
| (+) |
Others |
3.6 |
2.0 |
29.2 |
34.7 |
|
34.7 |
| (=) |
Cash Cost (Sold) |
247.0 |
114.8 |
393.1 |
754.9 |
0.0 |
754.9 |
| |
Cash Cost (Sold) (per ton) |
2,785.3 |
2,852.4 |
2,461.2 |
2,615.3 |
|
2,615.3 |
| (+) |
Sustaining Capital Expenditure |
11.2 |
5.2 |
8.7 |
25.1 |
14.4 |
39.5 |
| (=) |
Sustaining Cash Cost (Sold) |
258.2 |
120.0 |
401.8 |
780.0 |
14.4 |
794.4 |
| |
Sustaining Cash Cost (Sold) (per ton) |
2,911.2 |
2,982.5 |
2,515.9 |
2,702.4 |
|
2,752.2 |
| (+) |
Workers participation & Bonus |
0.8 |
0.9 |
4.8 |
6.5 |
|
6.5 |
| (+) |
Corporate G&A |
|
|
|
0.0 |
12.7 |
12.7 |
| (=) |
AISC (Sold) |
|
|
|
0.0 |
|
813.6 |
| (=) |
AISC (Sold) (per ton) |
|
|
|
|
|
2,818.6 |
| (=) |
AISC (Sold) in US$/lb |
|
|
|
|
|
1.28 |
Note: Cash cost and AISC per ton sold does
not include the impact of the cost of metal purchased for resale.
| |
US$ million
(excepted indicated otherwise) |
Três Marias |
Juiz de Fora |
Cajamarquilla |
Smelting |
| |
Contained Zinc Sales |
|
|
|
|
| |
Tonnes |
88,697 |
40,242 |
159,703 |
288,642 |
| |
COGS |
269.7 |
137.6 |
478.7 |
886.0 |
| (-) |
Raw Material |
(145.0) |
(89.6) |
(355.6) |
(590.2) |
| (+) |
By product cost |
(32.6) |
(1.4) |
(14.4) |
(48.4) |
| (+/-) |
Consolidation effects |
(2.1) |
5.1 |
(14.9) |
(11.9) |
| (+) |
Others |
(41.1) |
(8.2) |
9.9 |
(39.4) |
| (=) |
Conversion Cost |
48.9 |
43.5 |
103.7 |
196.1 |
| (=) |
Conversion Cost in US$/t |
551.5 |
1,080.7 |
649.4 |
679.5 |
| (=) |
Conversion Cost in US$/lb |
0.25 |
0.49 |
0.29 |
0.31 |
(2) Our conversion cost, cash cost, sustaining
cash cost and AISC net of by-products credits are measured with respect to zinc sold.
| | 55 |
Earnings Release – 2Q23 | | |
1H22
| |
US$ million
(excepted indicated otherwise) |
Três Marias |
Juiz de Fora |
Cajamarquilla |
Consolidation of Operations |
Corporate |
Smelting |
| |
Sales Volume (Zinc content in Products) |
|
|
|
|
|
|
| |
Tonnes |
84,357 |
39,334 |
149,878 |
273,569 |
|
273,569 |
| (+) |
COGS |
322.5 |
158.2 |
565.7 |
1,046.4 |
(3.3) |
1,043.0 |
| (-) |
Cost of freight |
(8.7) |
(4.9) |
(28.0) |
(41.7) |
|
(41.7) |
| (+) |
On-site G&A |
1.1 |
0.5 |
4.3 |
5.9 |
|
5.9 |
| (-) |
Depreciation, amortization and depletion |
(9.4) |
(6.8) |
(25.3) |
(41.4) |
|
(41.4) |
| (-) |
By-products revenue |
(4.4) |
(20.3) |
(88.3) |
(113.0) |
3.3 |
(109.7) |
| (-) |
Workers participation & Bonus |
(0.6) |
(0.6) |
(8.0) |
(9.3) |
|
(9.3) |
| (+) |
Others |
(6.9) |
(2.3) |
10.0 |
0.8 |
|
0.8 |
| (=) |
Cash Cost (Sold) |
293.6 |
123.7 |
430.3 |
847.7 |
0.0 |
847.7 |
| |
Cash Cost (Sold) (per ton) |
3,480.8 |
3,145.0 |
2,871.3 |
3,098.6 |
|
3,098.6 |
| (+) |
Sustaining Capital Expenditure |
18.0 |
10.4 |
20.2 |
48.5 |
(6.9) |
41.7 |
| (=) |
Sustaining Cash Cost (Sold) |
311.6 |
134.1 |
450.5 |
896.2 |
(6.9) |
889.3 |
| |
Sustaining Cash Cost (Sold) (per ton) |
3,693.7 |
3,409.2 |
3,006.0 |
3,276.0 |
|
3,250.9 |
| (+) |
Workers participation & Bonus |
0.6 |
0.6 |
8.0 |
9.3 |
0.0 |
9.3 |
| (+) |
Corporate G&A |
|
|
|
0.0 |
14.6 |
14.6 |
| (=) |
AISC (Sold) |
|
|
|
0.0 |
|
913.2 |
| (=) |
AISC (Sold) (per ton) |
|
|
|
|
|
3,338.1 |
| (=) |
AISC (Sold) in US$/lb |
|
|
|
|
|
1.51 |
Note: Cash cost and AISC per ton sold does
not include the impact of the cost of metal purchased for resale.
| |
US$ million
(excepted indicated otherwise) |
Três Marias |
Juiz de Fora |
Cajamarquilla |
Smelting |
| |
Contained Zinc Sales |
|
|
|
|
| |
Tonnes |
84,357 |
39,334 |
149,878 |
273,569 |
| |
COGS |
322.5 |
158.2 |
565.7 |
1,046.4 |
| (-) |
Raw Material |
(231.2) |
(115.7) |
(471.1) |
(818.0) |
| (+) |
By product cost |
(29.1) |
(2.1) |
(13.3) |
(44.5) |
| (+/-) |
Consolidation effects |
(3.2) |
0.6 |
23.0 |
20.5 |
| (+) |
Others |
(26.0) |
(8.1) |
(6.9) |
(41.0) |
| (=) |
Conversion Cost |
33.0 |
32.9 |
97.5 |
163.3 |
| (=) |
Conversion Cost in US$/t |
391.5 |
835.3 |
650.3 |
597.1 |
| (=) |
Conversion Cost in US$/lb |
0.18 |
0.38 |
0.29 |
0.27 |
Note: Cash cost and AISC per ton sold does
not include the impact of the cost of idleness capacity of US$2.3 million in Três Marias in 1H22.
| | 56 |
Nexa Resources (NYSE:NEXA)
과거 데이터 주식 차트
부터 4월(4) 2024 으로 5월(5) 2024

Nexa Resources (NYSE:NEXA)
과거 데이터 주식 차트
부터 5월(5) 2023 으로 5월(5) 2024
