false 0001767042 0001767042 2024-01-29 2024-01-29
UNITED STATES
SECURITIES AND EXCHANGE COMMISSION
Washington, D.C. 20549
FORM 8-K
CURRENT REPORT
Pursuant to Section 13 or 15(d)
of the Securities Exchange Act of 1934
Date of Report (Date of earliest event reported): January 29, 2024
Kodiak Gas Services, Inc.
(Exact name of Registrant as specified in its charter)
|
|
|
|
|
| Delaware |
|
001-41732 |
|
83-3013440 |
(State or other jurisdiction
of incorporation) |
|
(Commission File Number) |
|
(I.R.S. Employer
Identification No.) |
|
|
|
| 15320 Highway 105 W, Suite 210, Montgomery, Texas |
|
77356 |
| (Address of principal executive offices) |
|
(Zip Code) |
Registrant’s telephone number, including area code (936) 539-3300
Check the appropriate box below if the Form 8-K filing is intended to simultaneously satisfy the filing obligation of the registrant under any of the following provisions:
| ☐ |
Written communications pursuant to Rule 425 under the Securities Act (17 CFR 230.425) |
| ☐ |
Soliciting material pursuant to Rule 14a-12 under the Exchange Act (17 CFR 240.14a-12) |
| ☐ |
Pre-commencement communications pursuant to Rule 14d-2(b) under the Exchange Act (17 CFR 240.14d-2(b)) |
| ☐ |
Pre-commencement communications pursuant to Rule 13e-4(c) under the Exchange Act (17 CFR 240.13e-4(c)) |
Securities registered pursuant to Section 12(b) of the Act:
|
|
|
|
|
| Title of each class |
|
Trading
Symbol(s) |
|
Name of each exchange
on which registered |
| Common Stock, par value $0.01 per share |
|
KGS |
|
The New York Stock Exchange |
Indicate by check mark whether the registrant is an emerging growth company as defined in Rule 405 of the Securities Act of 1933 (17 CFR §230.405) or Rule 12b-2 of the Securities Exchange Act of 1934 (17 CFR §240.12b-2).
Emerging growth company ☒
If an emerging growth company, indicate by check mark if the registrant has elected not to use the extended transition period for complying with any new or revised financial accounting standards provided pursuant to Section 13(a) of the Exchange Act. ☐
| Item 2.02. |
Results of Operations and Financial Condition. |
On January 29, 2024, in connection with the Offering (as defined below), Kodiak Gas Services, Inc., a Delaware corporation (the “Company”), provided to prospective investors certain preliminary estimated unaudited financial information for the year ended December 31, 2023 in a preliminary offering memorandum as follows:
Preliminary Estimated Unaudited Financial Information for the Fiscal Year Ended December 31, 2023
On January 29, 2024, we disclosed our preliminary estimated unaudited consolidated earnings for the fiscal year ended December 31, 2023. The preliminary estimated financial data included in this offering memorandum has been prepared by, and is the responsibility of, our management based on the most current information available to management. BDO USA, LLP (n/k/a BDO USA, P.C.) has not audited, reviewed, examined, compiled, nor applied agreed-upon procedures with respect to the preliminary estimated financial data. Accordingly, BDO USA, LLP (n/k/a BDO USA, P.C.) does not express an opinion or any other form of assurance with respect thereto. As a result, reported results may differ from the unaudited results presented here as a result of the completion of our financial closing procedures or any adjustments that may result from the completion of our review of our consolidated financial statements.
Our Annual Report on Form 10-K for the year ended December 31, 2023, will include our audited financial statements for the full year ended December 31, 2023, and our auditors’ audit reports thereon. You should note that additional information on a number of matters will be included in our Annual Report on Form 10-K, such as a comprehensive statement of our financial condition and results of operations and footnote disclosures associated with our year-end financial results, as well as our management’s discussion and analysis of financial condition and results of operations. Our audited financial statements for the year ended December 31, 2023, will not be available until after this offering is completed and, consequently, will not be available to you prior to investing in the notes pursuant to this offering.
The preliminary estimated unaudited financial results are forward-looking statements and may differ materially from actual results. These estimates should not be viewed as a substitute for our full interim or annual financial statements prepared in accordance with GAAP. Accordingly, you should not place undue reliance on these preliminary estimated unaudited results. The following discussion and analysis should be read in conjunction with our consolidated financial statements and related notes, our “Management’s Discussion and Analysis of Financial Condition and Results of Operations,” “Cautionary Note Regarding Forward-Looking Statements,” and “Risk Factors” included in our final prospectus filed with the SEC on June 30, 2023 and our Quarterly Report on Form 10-Q for the quarter ended September 30, 2023.
We have presented the following preliminary estimated ranges of certain of our financial results for the fiscal year ended December 31, 2023:
|
|
|
|
|
|
|
|
|
| (in thousands) |
|
Year Ended December 31, 2023 |
|
| |
|
Low Range |
|
|
High Range |
|
| Revenue |
|
$ |
846,000 |
|
|
$ |
851,000 |
|
| Net Income |
|
|
20,000 |
|
|
|
24,000 |
|
| Adjusted EBITDA |
|
|
438,000 |
|
|
|
443,000 |
|
| Maintenance Capital Expenditures |
|
|
36,000 |
|
|
|
38,000 |
|
| Growth Capital Expenditures(1) |
|
|
172,000 |
|
|
|
176,000 |
|
| (1) |
Growth capital expenditures includes $12-16 million in non-unit growth capital expenditures for the fiscal year 2023 and $3.8 million in leasehold improvements during the fourth quarter 2023 related to the build out of the new corporate office that the Company will be fully reimbursed for as part of its tenant improvement allowance. Amount excludes $8.6 million in capital expenditures related to the purchase and expansion of previously-leased operations facilities. |
The following table reconciles net income to Adjusted EBITDA based on the preliminary estimated financial results for the fiscal year ended December 31, 2023:
|
|
|
|
|
|
|
|
|
| (in thousands) |
|
Year Ended December 31, 2023 |
|
| |
|
Low Range |
|
|
High Range |
|
| Net income |
|
$ |
24,000 |
|
|
$ |
20,000 |
|
| Interest expense, net |
|
|
220,000 |
|
|
|
224,000 |
|
| Income tax expense |
|
|
14,000 |
|
|
|
17,000 |
|
| Depreciation and amortization |
|
|
181,000 |
|
|
|
185,000 |
|
| Loss on extinguishment of debt |
|
|
7,000 |
|
|
|
7,000 |
|
| Gain on derivatives |
|
|
(18,000 |
) |
|
|
(22,000 |
) |
| Equity compensation expense |
|
|
5,500 |
|
|
|
6,500 |
|
| Transaction expenses |
|
|
5,500 |
|
|
|
6,500 |
|
| Gain on sale of assets |
|
|
(1,000 |
) |
|
|
(1,000 |
) |
|
|
|
|
|
|
|
|
|
| Adjusted EBITDA |
|
$ |
438,000 |
|
|
$ |
443,000 |
|
|
|
|
|
|
|
|
|
|
The information under this Item 2.02 to this Current Report on Form 8-K is being furnished and shall not be deemed “filed” for the purpose of Section 18 of the Securities Exchange Act of 1934, as amended (the “Exchange Act”), or otherwise subject to the liabilities of that section. The information under this Item 2.02 to this Current Report on Form 8-K shall not be incorporated by reference into any registration statement or other document pursuant to the Securities Act of 1933, as amended (the “Securities Act”).
| Item 7.01. |
Regulation FD Disclosure. |
The information contained in Item 2.02 of this Current Report on Form 8-K is incorporated into this Item 7.01 by reference.
On January 29, 2024, the Company issued a news release announcing that its wholly owned subsidiary, Kodiak Gas Services, LLC (the “Issuer”), has launched a private offering (the “Offering”) of $750 million in aggregate principal amount of senior unsecured notes due 2029 (the “Notes”). The Notes are being offered only to persons who are either reasonably believed to be “qualified institutional buyers” under Rule 144A or who are non-“U.S. persons” under Regulation S as defined under applicable securities laws. A copy of the news release is attached as Exhibit 99.1 to this Current Report on Form 8-K and is incorporated into this Item 7.01 by reference.
On January 29, 2024, the Company made available on its corporate website an investor presentation that contains information that was used in connection with the Offering. A copy of the investor presentation is attached as Exhibit 99.2 to this Current Report on Form 8-K and is incorporated into this Item 7.01 by reference.
Neither this Current Report on Form 8-K nor the news release constitute an offer to sell, or the solicitation of an offer to buy, the Notes.
The information under this Item 7.01, including Exhibits 99.1 and 99.2, to this Current Report on Form 8-K is being furnished and shall not be deemed “filed” for the purpose of Section 18 of the Exchange Act, or otherwise subject to the liabilities of that section. The information under this Item 7.01, including Exhibits 99.1 and 99.2, to this Current Report on Form 8-K shall not be incorporated by reference into any registration statement or other document pursuant to the Securities Act.
| Item 9.01. |
Financial Statements and Exhibits. |
(d) Exhibits.
SIGNATURES
Pursuant to the requirements of the Securities Exchange Act of 1934, as amended, the registrant has duly caused this Report to be signed on its behalf by the undersigned hereunto duly authorized.
|
|
|
|
|
|
|
|
|
|
|
Kodiak Gas Services, Inc. |
|
|
|
|
| Date: January 29, 2024 |
|
|
|
By: |
|
/s/ Kelly M. Battle |
|
|
|
|
Name: |
|
Kelly M. Battle |
|
|
|
|
Title: |
|
Executive Vice President, Chief Legal Officer, Chief |
|
|
|
|
|
|
Compliance Officer and Secretary |
Exhibit 99.1

Kodiak Gas Services Announces Launch of $750 Million Senior Unsecured Notes Offering
MONTGOMERY, Texas, January 29, 2024 — Kodiak Gas Services, Inc. (NYSE: KGS) (“Kodiak”, “we” or the “Company”)
today announced that its wholly owned subsidiary, Kodiak Gas Services, LLC (the “Issuer”) has launched a private offering (the “Offering”) of $750 million in aggregate principal amount of senior unsecured notes due 2029 (the
“Notes”).
The Issuer intends to use the net proceeds from the Offering to repay a portion of the outstanding indebtedness under the
Issuer’s revolving asset-based loan credit facility (the “ABL Facility”) and to pay related fees, costs, premiums and expenses in connection therewith and with the closing of the Company’s previously announced acquisition of CSI
Compressco LP (the “CSI Acquisition”). In connection with closing of the CSI Acquisition, the Company intends, using proceeds from additional draws on the ABL Facility, to repay, terminate and/or redeem all of CSI’s existing long-term
indebtedness.
The Notes will not be registered under the Securities Act of 1933, as amended (the “Securities Act”), or under any state or other
securities laws and may not be offered or sold within the United States, or to or for the account or benefit of any U.S. person, absent registration or an applicable exemption from registration requirements. The Notes are being offered only to
persons who are either reasonably believed to be “qualified institutional buyers” under Rule 144A or who are non-“U.S. persons” under Regulation S as defined under applicable securities laws.
This news release does not constitute an offer to sell, a solicitation to buy or an offer to purchase or sell any securities, nor shall there be any sale of
these securities in any state or jurisdiction in which such offer, solicitation or sale would be unlawful prior to registration or qualification under the securities laws of any such state or jurisdiction. This news release is being issued pursuant
to and in accordance with Rule 135c under the Securities Act.
About Kodiak
KGS is one of the largest contract compression services providers in the continental United States with a fleet of over 3.2 million horsepower. Kodiak
focuses on providing contract compression services to oil and gas producers and midstream customers in high–volume gas gathering systems, processing facilities, multi–well gas lift applications and natural gas transmission systems.
Cautionary Note Regarding Forward-Looking Statements
This news release contains “forward-looking statements” within the meaning of the safe harbor provisions of the U.S. Private Securities Litigation
Reform Act of 1995. Forward-looking statements are neither historical facts nor assurances of future performance. Instead, they are based only on our current beliefs, expectations and assumptions regarding the future of our business, future plans
and strategies, projections, anticipated events and trends, the economy and other future conditions. Forward-looking statements contained herein include statements we make regarding the Notes offering and the expected use of proceeds therefrom.
Because forward-looking statements relate to the future, they are subject to inherent uncertainties, risks and changes in circumstances that are difficult to predict and many of which are outside of our control. A list and description of risks,
uncertainties and other factors can be found in the “Risk Factors” and “Management’s Discussion and Analysis of Financial Condition and Results of Operations” sections of our final prospectus filed with the U.S. Securities
and Exchange Commission (the “SEC”) on June 30, 2023 pursuant to Rule 424(b)(4) and in Part I, Item 2. “Management’s Discussion and Analysis of Financial Condition and Results of Operations” and Part II, Item 1A.
“Risk Factors” sections of our Quarterly Report on Form 10-Q for the quarterly period ended September 30, 2023 and filed with the SEC on November 9, 2023. Any forward-looking statement made
by us in this news release is based only on information currently
available to us and speaks only as of the date on which it is made. Except as may be required by applicable law, we undertake no obligation to publicly update any forward-looking statement
whether as a result of new information, future developments or otherwise.
Contacts:
Kodiak Gas Services, Inc.
Graham Sones, VP of Investor
Relations
ir@kodiakgas.com
(936) 755-3259
Dennard Lascar Investor Relations
Ken Dennard / Rick
Black
KGS@dennardlascar.com
713-529-6600
2

Exhibit 99.2 INVESTOR PRESENTATION JANUARY 2024
Disclaimer Forward Looking Statements. This presentation, and our
officers and representatives may from time to time make, forward-looking statements within the meaning of the safe harbor provisions of the U.S. Private Securities Litigation Reform Act of 1995. Forward-looking statements are neither historical
facts nor assurances of future performance. Instead, they are based only on our current beliefs, expectations and assumptions regarding the future of our business, future plans and strategies, projections, anticipated events and trends, the economy
and other future conditions. Forward-looking statements can be identified by words such as: anticipate, intend, plan, goal, seek, believe, project, estimate, expect, strategy, future, likely, may, should, will and similar references to future
periods. Examples of forward- looking statements include, among others, statements we make regarding: (i) potential or pending acquisition transactions, including the Acquisition (as defined herein), or other strategic transactions, the timing
thereof, the receipt of necessary approvals to close such acquisitions, our ability to finance such acquisitions, and our ability to achieve the intended operational, financial and strategic benefits from any such transactions; (ii) expected
synergies and efficiencies to be achieved as a result of the Acquisition; (iii) expected operating results, such as revenue growth and earnings of the combined company; (iv) anticipated levels of capital expenditures and uses of capital; (v) current
or future volatility in the credit markets and future market conditions; (vi) expectations of the effect on our financial condition of claims, litigation, environmental costs, contingent liabilities and governmental and regulatory investigations and
proceedings; (vii) production and capacity forecasts for the natural gas and oil industry; (viii) strategy for customer retention, growth, fleet maintenance, market position, financial results; (ix) expectations regarding the leverage and dividend
profile of the combined company, including the amount and timing of future dividend payments; (x) our interest rate hedges; and (xi) strategy for risk management. Because forward-looking statements relate to the future, they are subject to inherent
uncertainties, risks and changes in circumstances that are difficult to predict and many of which are outside of our control. Our actual results and financial condition may differ materially from those indicated in the forward-looking statements.
Therefore, you should not rely on any of these forward-looking statements. Important factors that could cause our actual results and financial condition to differ materially from those indicated in the forward-looking statements include, among
others, the following: (i) a reduction in the demand for natural gas and oil; (ii) the loss of, or the deterioration of the financial condition of, any of our key customers; (iii) nonpayment and nonperformance by our customers, suppliers or vendors;
(iv) competitive pressures that may cause us to lose market share; (v) the structure of our Compression Operations contracts and the failure of our customers to continue to contract for services after expiration of the primary term; (vi) our ability
to consummate the Acquisition on a timely basis or at all; (vii) our ability to successfully integrate any acquired businesses, including CSI Compressco LP, and realize the expected benefits thereof; (viii) difficulties and delays in meeting the
conditions required for the closing of the Acquisition; (ix) our ability to make additional acquisitions on economically acceptable terms; (x) our ability to fund purchases of additional compression equipment; (xi) a downturn in the economic
environment, as well as inflationary pressures; (xii) tax legislation and administrative initiatives or challenges to our tax positions; (xiii) the loss of key management, operational personnel or qualified technical personnel; (xiv) our dependence
on a limited number of suppliers; (xv) the cost of compliance with existing governmental regulations and proposed governmental regulations, including climate change legislation and regulatory initiatives and stakeholder pressures, including ESG
scrutiny; (xvi) the inherent risks associated with our operations, such as equipment defects and malfunctions; (xvii) our reliance on third-party components for use in our IT systems; (xviii) legal and reputational risks and expenses relating to the
privacy, use and security of employee and client information; (xix) threats of cyber-attacks or terrorism; (xx) our credit agreement contains features that may limit our ability to operate our business and fund future growth and also increases our
exposure to risk during adverse economic conditions; (xxi) volatility in interest rates; (xxii) our ability to access the capital and credit markets or borrow on affordable terms to obtain additional capital that we may require; (xxiii) the
effectiveness of our disclosure controls and procedures; and (xxiv) such other factors as discussed throughout the Risk Factors and Management's Discussion and Analysis of Financial Condition and Results of Operations sections of our final
prospectus filed with the U.S Securities and Exchange Commission (the SEC ) on June 30, 2023 pursuant to Rule 424(b)(4) and our Registration Statement on Form S-4 filed with the SEC on January 12, 2024 and Part II, Item 1A. Risk Factors of our
Quarterly Report on Form 10-Q for the quarterly period ended September 30, 2023. Any forward-looking statement made by us in this presentation is based only on information currently available to us and speaks only as of the date on which it is made.
Except as may be required by applicable law, we undertake no obligation to publicly update any forward-looking statement whether as a result of new information, future developments or otherwise. Non-GAAP Financial Measures. This presentation
contains certain financial measures not presented in accordance with generally accepted accounting principles (“GAAP”), including Adjusted Gross Margin, Adjusted Gross Margin Percentage, Adjusted EBITDA, Adjusted EBITDA Percentage,
Discretionary Cash Flow and Free Cash Flow. Such non-GAAP measures should not be considered an alternative to, or more meaningful than, the most directly comparable measure of financial performance presented in accordance with GAAP. Moreover, such
non-GAAP measures may not be comparable to similarly titled measures of other companies. However, we believe these non-GAAP financial measures provide useful information to investors because, when viewed with our GAAP results and the accompanying
reconciliation, they provide a more complete understanding of our performance than GAAP results alone. See Appendix beginning on page 43 for reconciliation of non-GAAP measures. LQA Combined Adjusted EBITDA and related figures do not reflect pro
forma adjustments prepared in accordance with SEC rules. The LQA Combined Adjusted EBITDA figures presented herein are calculated by adding together Kodiak’s LQA Q3 2023 Adjusted EBITDA, CSI’s LQA Q3 2023 Adjusted EBITDA and $20 million
of annual run-rate synergies. Industry & Market Data. The market data and certain other statistical information used throughout this presentation are based on independent industry publications, government publications or other published
independent sources. Although we believe these third-party sources are reliable as of their respective dates, we have not independently verified the accuracy or completeness of this information. Some data is also based on our good faith estimates
and our management’s understanding of industry conditions. The industry in which we operate is subject to a high degree of uncertainty and risk due to a variety of factors. These and other factors could cause results to differ materially from
those expressed in these publications. This presentation contains trademarks, trade names and service marks of other companies, which are the property of their respective owners. We do not intend our use or display of other parties' trademarks,
trade names or service marks to imply, and such use or display should not be construed to imply, a relationship with, or endorsement or sponsorship of us by, these other parties. KODIAK GAS SERVICES J a n u a r y 2 0 2 4 I n v e s t o r P r e s e n
t a t i o n | 2
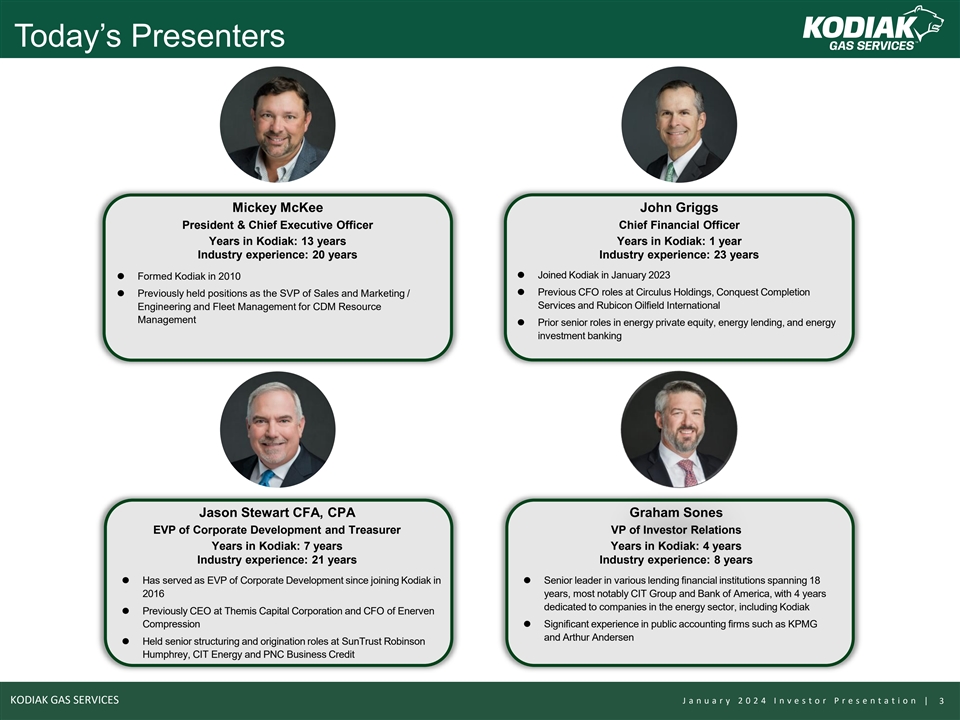
Today’s Presenters Mickey McKee John Griggs President & Chief
Executive Officer Chief Financial Officer Years in Kodiak: 13 years Years in Kodiak: 1 year Industry experience: 20 years Industry experience: 23 years ⚫ Joined Kodiak in January 2023 ⚫ Formed Kodiak in 2010 ⚫ Previous CFO roles at
Circulus Holdings, Conquest Completion ⚫ Previously held positions as the SVP of Sales and Marketing / Services and Rubicon Oilfield International Engineering and Fleet Management for CDM Resource Management ⚫ Prior senior roles in
energy private equity, energy lending, and energy investment banking Jason Stewart CFA, CPA Graham Sones EVP of Corporate Development and Treasurer VP of Investor Relations Years in Kodiak: 7 years Years in Kodiak: 4 years Industry experience: 21
years Industry experience: 8 years ⚫ Has served as EVP of Corporate Development since joining Kodiak in ⚫ Senior leader in various lending financial institutions spanning 18 2016 years, most notably CIT Group and Bank of America, with 4
years dedicated to companies in the energy sector, including Kodiak ⚫ Previously CEO at Themis Capital Corporation and CFO of Enerven Compression⚫ Significant experience in public accounting firms such as KPMG and Arthur Andersen ⚫
Held senior structuring and origination roles at SunTrust Robinson Humphrey, CIT Energy and PNC Business Credit KODIAK GAS SERVICES J a n u a r y 2 0 2 4 I n v e s t o r P r e s e n t a t i o n | 3
Table of Contents Executive Summary 1 Company Overview 2 Transaction
Overview 3 Industry Overview 4 Credit Highlights 5 Financial Summary 6 Appendix 7 KODIAK GAS SERVICES J a n u a r y 2 0 2 4 I n v e s t o r P r e s e n t a t i o n

Executive Summary
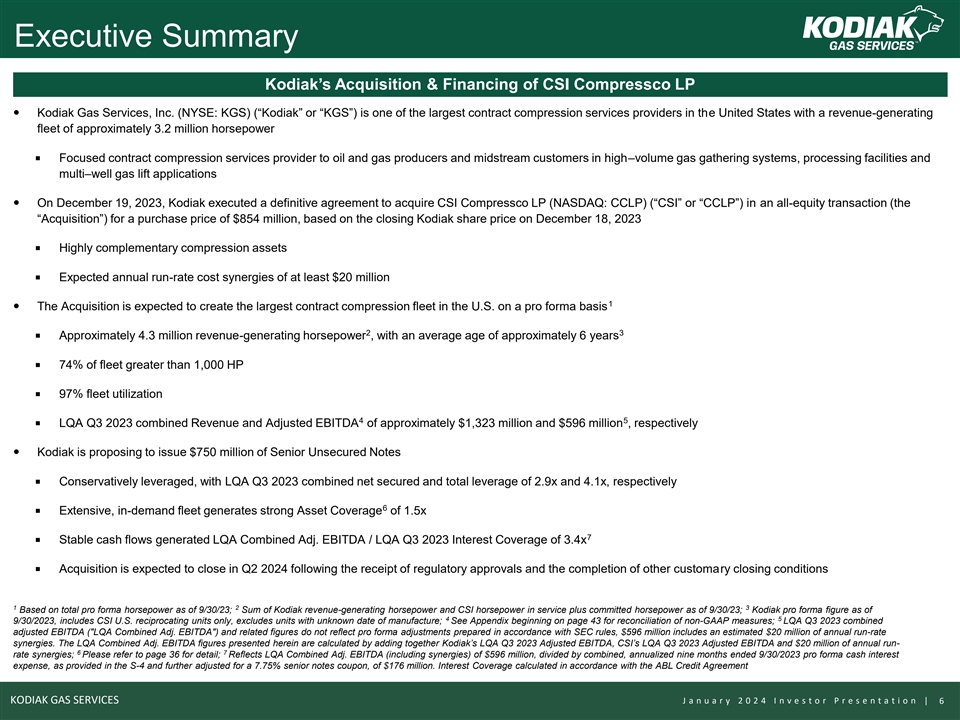
Executive Summary Kodiak’s Acquisition & Financing of CSI
Compressco LP — Kodiak Gas Services, Inc. (NYSE: KGS) (“Kodiak” or “KGS”) is one of the largest contract compression services providers in the United States with a revenue-generating fleet of approximately 3.2 million
horsepower ¡ Focused contract compression services provider to oil and gas producers and midstream customers in high–volume gas gathering systems, processing facilities and multi–well gas lift applications — On December 19,
2023, Kodiak executed a definitive agreement to acquire CSI Compressco LP (NASDAQ: CCLP) (“CSI” or “CCLP”) in an all-equity transaction (the “Acquisition”) for a purchase price of $854 million, based on the
closing Kodiak share price on December 18, 2023 ¡ Highly complementary compression assets ¡ Expected annual run-rate cost synergies of at least $20 million 1 — The Acquisition is expected to create the largest contract compression
fleet in the U.S. on a pro forma basis 2 3 ¡ Approximately 4.3 million revenue-generating horsepower , with an average age of approximately 6 years ¡ 74% of fleet greater than 1,000 HP ¡ 97% fleet utilization 4 5 ¡ LQA Q3 2023
combined Revenue and Adjusted EBITDA of approximately $1,323 million and $596 million , respectively — Kodiak is proposing to issue $750 million of Senior Unsecured Notes ¡ Conservatively leveraged, with LQA Q3 2023 combined net secured
and total leverage of 2.9x and 4.1x, respectively 6 ¡ Extensive, in-demand fleet generates strong Asset Coverage of 1.5x 7 ¡ Stable cash flows generated LQA Combined Adj. EBITDA / LQA Q3 2023 Interest Coverage of 3.4x ¡ Acquisition is
expected to close in Q2 2024 following the receipt of regulatory approvals and the completion of other customary closing conditions 1 2 3 Based on total pro forma horsepower as of 9/30/23; Sum of Kodiak revenue-generating horsepower and CSI
horsepower in service plus committed horsepower as of 9/30/23; Kodiak pro forma figure as of 4 5 9/30/2023, includes CSI U.S. reciprocating units only, excludes units with unknown date of manufacture; See Appendix beginning on page 43 for
reconciliation of non-GAAP measures; LQA Q3 2023 combined adjusted EBITDA ( LQA Combined Adj. EBITDA ) and related figures do not reflect pro forma adjustments prepared in accordance with SEC rules, $596 million includes an estimated $20 million of
annual run-rate synergies. The LQA Combined Adj. EBITDA figures presented herein are calculated by adding together Kodiak’s LQA Q3 2023 Adjusted EBITDA, CSI’s LQA Q3 2023 Adjusted EBITDA and $20 million of annual run- 6 7 rate synergies;
Please refer to page 36 for detail; Reflects LQA Combined Adj. EBITDA (including synergies) of $596 million, divided by combined, annualized nine months ended 9/30/2023 pro forma cash interest expense, as provided in the S-4 and further adjusted for
a 7.75% senior notes coupon, of $176 million. Interest Coverage calculated in accordance with the ABL Credit Agreement KODIAK GAS SERVICES J a n u a r y 2 0 2 4 I n v e s t o r P r e s e n t a t i o n | 6
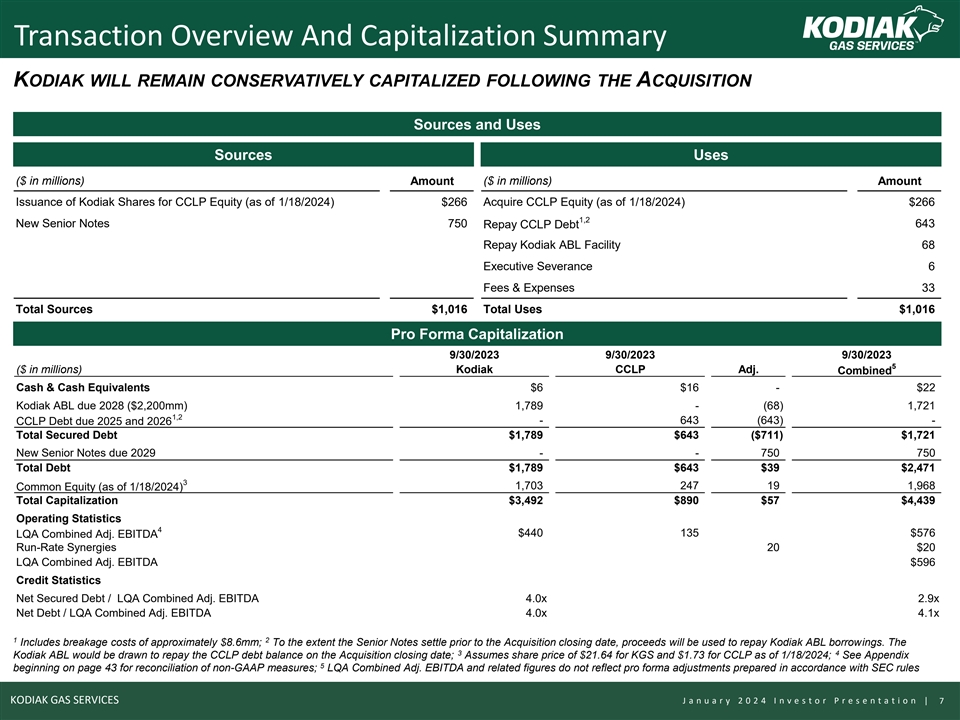
Transaction Overview And Capitalization Summary KODIAK WILL REMAIN
CONSERVATIVELY CAPITALIZED FOLLOWING THE ACQUISITION Sources and Uses Sources Uses ($ in millions) Amount ($ in millions) Amount Issuance of Kodiak Shares for CCLP Equity (as of 1/18/2024) $266 Acquire CCLP Equity (as of 1/18/2024) $266 1,2 New
Senior Notes 750 643 Repay CCLP Debt Repay Kodiak ABL Facility 68 Executive Severance 6 Fees & Expenses 33 Total Sources $1,016 Total Uses $1,016 Pro Forma Capitalization 9/30/2023 9/30/2023 9/30/2023 5 ($ in millions) Kodiak CCLP Adj. Combined
Cash & Cash Equivalents $6 $16 - $22 Kodiak ABL due 2028 ($2,200mm) 1,789 - (68) 1,721 1,2 - 643 (643) - CCLP Debt due 2025 and 2026 Total Secured Debt $1,789 $643 ($711) $1,721 New Senior Notes due 2029 - - 750 750 Total Debt $1,789 $643 $39
$2,471 3 1,703 247 19 1,968 Common Equity (as of 1/18/2024) Total Capitalization $3,492 $890 $57 $4,439 Operating Statistics 4 $440 135 $576 LQA Combined Adj. EBITDA Run-Rate Synergies 20 $20 LQA Combined Adj. EBITDA $596 Credit Statistics Net
Secured Debt / LQA Combined Adj. EBITDA 4.0x 2.9x Net Debt / LQA Combined Adj. EBITDA 4.0x 4.1x 1 2 Includes breakage costs of approximately $8.6mm; To the extent the Senior Notes settle prior to the Acquisition closing date, proceeds will be used
to repay Kodiak ABL borrowings. The 3 4 Kodiak ABL would be drawn to repay the CCLP debt balance on the Acquisition closing date; Assumes share price of $21.64 for KGS and $1.73 for CCLP as of 1/18/2024; See Appendix 5 beginning on page 43 for
reconciliation of non-GAAP measures; LQA Combined Adj. EBITDA and related figures do not reflect pro forma adjustments prepared in accordance with SEC rules KODIAK GAS SERVICES J a n u a r y 2 0 2 4 I n v e s t o r P r e s e n t a t i o n |
7
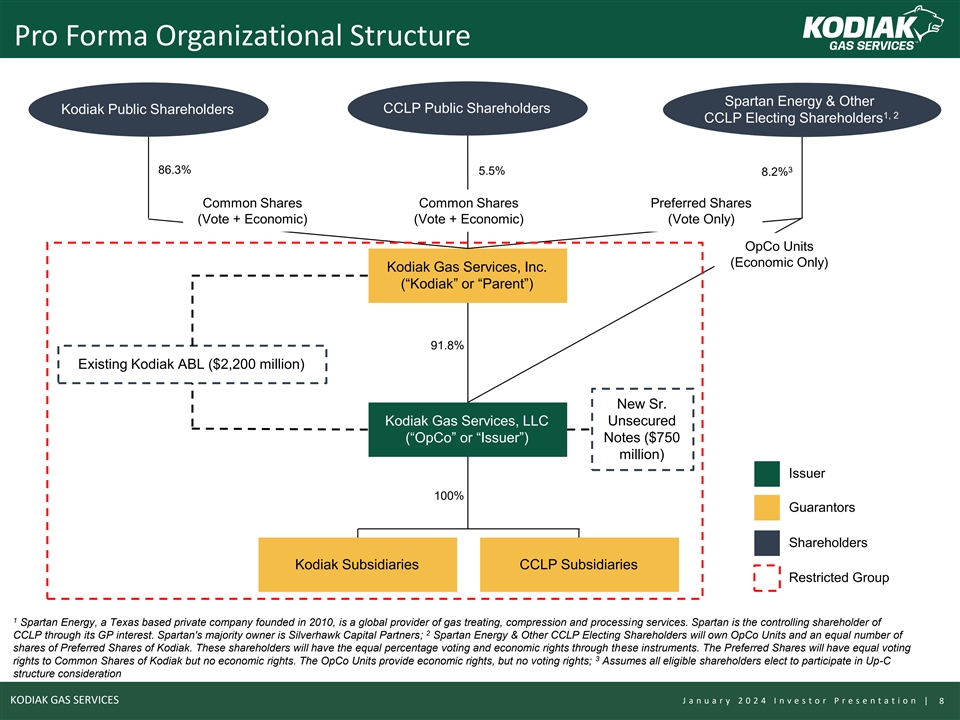
Pro Forma Organizational Structure Spartan Energy & Other CCLP
Public Shareholders Kodiak Public Shareholders 1, 2 CCLP Electing Shareholders 3 86.3% 5.5% 8.2% Common Shares Common Shares Preferred Shares (Vote + Economic) (Vote + Economic) (Vote Only) OpCo Units (Economic Only) Kodiak Gas Services, Inc.
(“Kodiak” or “Parent”) 91.8% Existing Kodiak ABL ($2,200 million) New Sr. Kodiak Gas Services, LLC Unsecured (“OpCo” or “Issuer”) Notes ($750 million) Issuer 100% Guarantors Shareholders Kodiak
Subsidiaries CCLP Subsidiaries Restricted Group 1 Spartan Energy, a Texas based private company founded in 2010, is a global provider of gas treating, compression and processing services. Spartan is the controlling shareholder of 2 CCLP through its
GP interest. Spartan's majority owner is Silverhawk Capital Partners; Spartan Energy & Other CCLP Electing Shareholders will own OpCo Units and an equal number of shares of Preferred Shares of Kodiak. These shareholders will have the equal
percentage voting and economic rights through these instruments. The Preferred Shares will have equal voting 3 rights to Common Shares of Kodiak but no economic rights. The OpCo Units provide economic rights, but no voting rights; Assumes all
eligible shareholders elect to participate in Up-C structure consideration KODIAK GAS SERVICES J a n u a r y 2 0 2 4 I n v e s t o r P r e s e n t a t i o n | 8
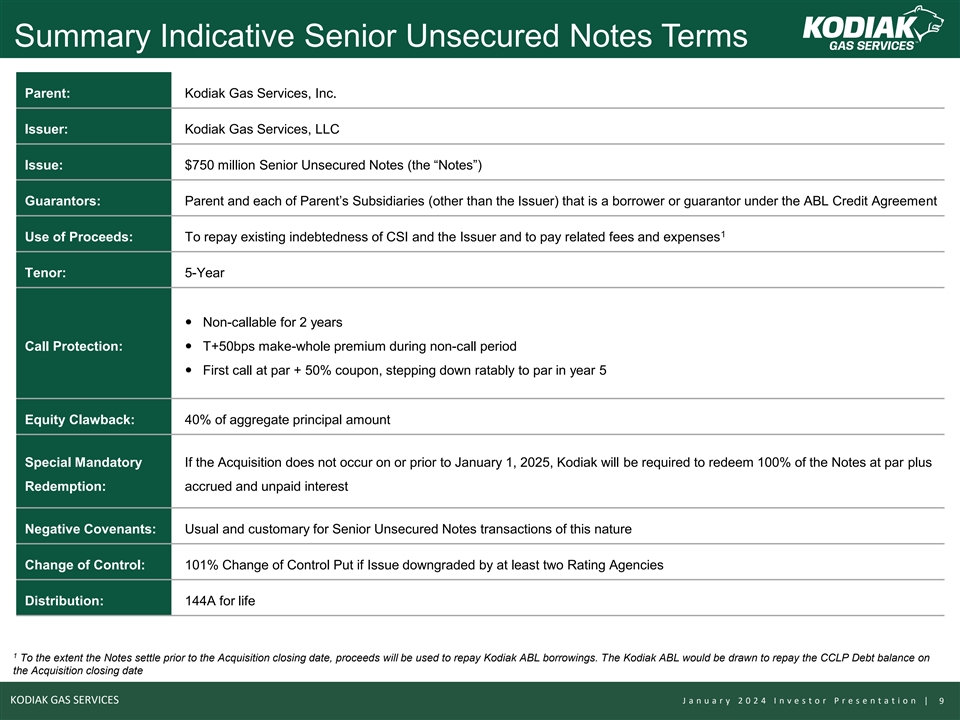
Summary Indicative Senior Unsecured Notes Terms Parent: Kodiak Gas
Services, Inc. Issuer: Kodiak Gas Services, LLC Issue: $750 million Senior Unsecured Notes (the “Notes”) Guarantors: Parent and each of Parent’s Subsidiaries (other than the Issuer) that is a borrower or guarantor under the ABL
Credit Agreement 1 Use of Proceeds: To repay existing indebtedness of CSI and the Issuer and to pay related fees and expenses Tenor: 5-Year — Non-callable for 2 years Call Protection: — T+50bps make-whole premium during non-call period
— First call at par + 50% coupon, stepping down ratably to par in year 5 Equity Clawback: 40% of aggregate principal amount Special Mandatory If the Acquisition does not occur on or prior to January 1, 2025, Kodiak will be required to redeem
100% of the Notes at par plus Redemption: accrued and unpaid interest Negative Covenants: Usual and customary for Senior Unsecured Notes transactions of this nature Change of Control: 101% Change of Control Put if Issue downgraded by at least two
Rating Agencies Distribution: 144A for life 1 To the extent the Notes settle prior to the Acquisition closing date, proceeds will be used to repay Kodiak ABL borrowings. The Kodiak ABL would be drawn to repay the CCLP Debt balance on the Acquisition
closing date KODIAK GAS SERVICES J a n u a r y 2 0 2 4 I n v e s t o r P r e s e n t a t i o n | 9

Company Overview
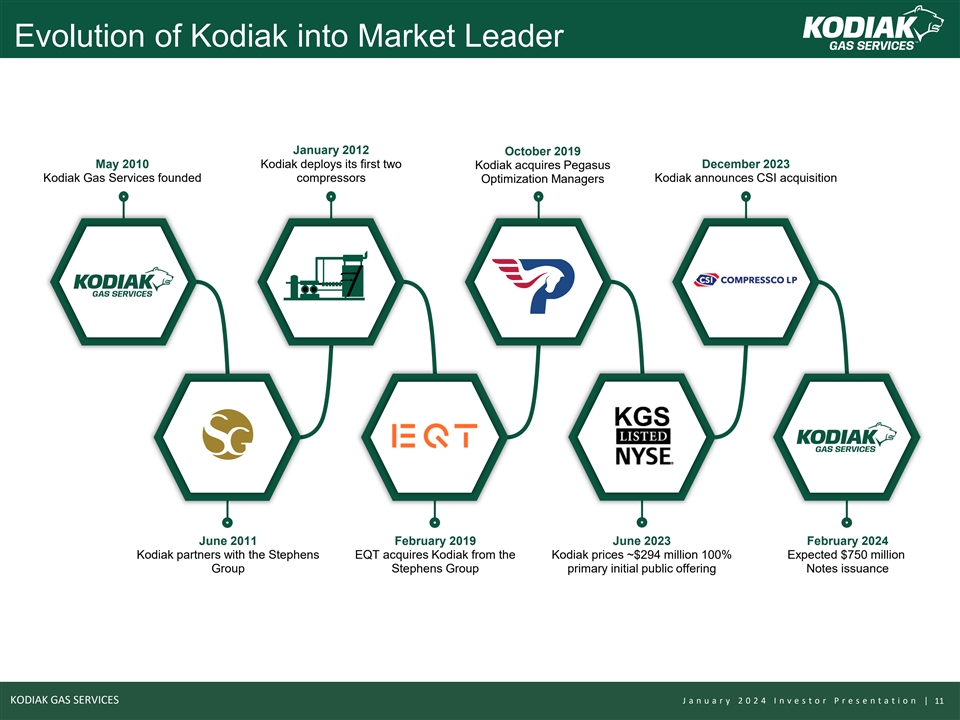
Evolution of Kodiak into Market Leader January 2012 October 2019 May
2010 Kodiak deploys its first two December 2023 Kodiak acquires Pegasus Kodiak Gas Services founded compressors Optimization Managers Kodiak announces CSI acquisition June 2011 February 2019 June 2023 February 2024 Kodiak partners with the Stephens
EQT acquires Kodiak from the Kodiak prices ~$294 million 100% Expected $750 million Group Stephens Group primary initial public offering Notes issuance KODIAK GAS SERVICES J a n u a r y 2 0 2 4 I n v e s t o r P r e s e n t a t i o n | 11
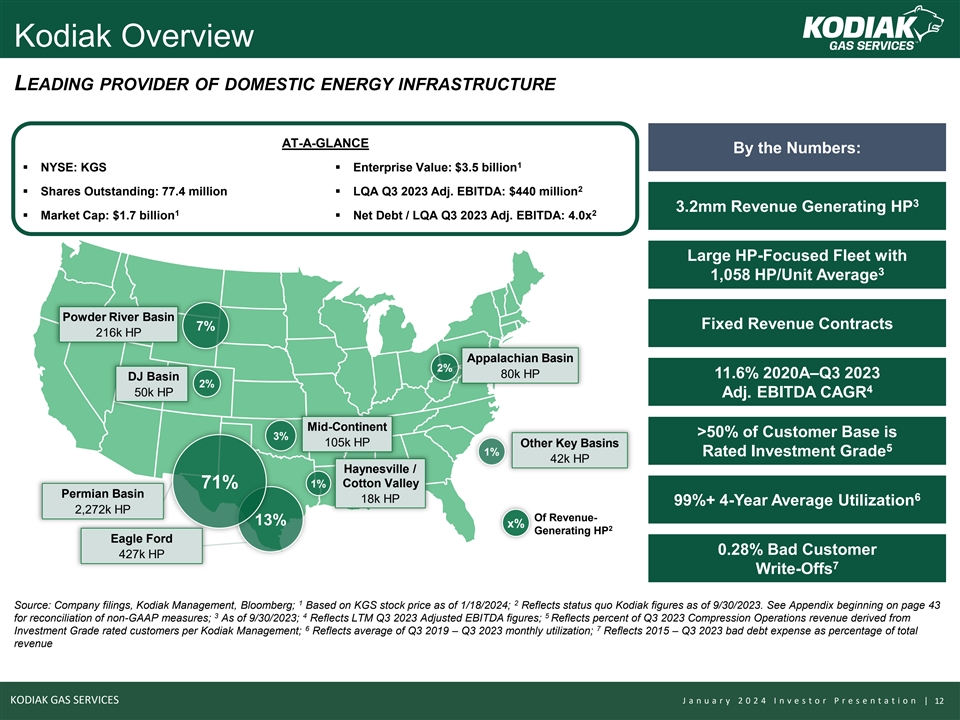
Kodiak Overview LEADING PROVIDER OF DOMESTIC ENERGY INFRASTRUCTURE
AT-A-GLANCE By the Numbers: 1 ▪ NYSE: KGS▪ Enterprise Value: $3.5 billion 2 ▪ Shares Outstanding: 77.4 million▪ LQA Q3 2023 Adj. EBITDA: $440 million 3 3.2mm Revenue Generating HP 1 2 ▪ Market Cap: $1.7 billion▪
Net Debt / LQA Q3 2023 Adj. EBITDA: 4.0x Large HP-Focused Fleet with 3 1,058 HP/Unit Average Powder River Basin Fixed Revenue Contracts 7% 216k HP Appalachian Basin 2% 80k HP 11.6% 2020A–Q3 2023 DJ Basin 2% 4 50k HP Adj. EBITDA CAGR
Mid-Continent >50% of Customer Base is 3% 105k HP Other Key Basins 5 1% Rated Investment Grade 42k HP Haynesville / 1% Cotton Valley 71% Permian Basin 6 18k HP 99%+ 4-Year Average Utilization 2,272k HP Of Revenue- 13% x% 2 Generating HP Eagle
Ford 0.28% Bad Customer 427k HP 7 Write-Offs 1 2 Source: Company filings, Kodiak Management, Bloomberg; Based on KGS stock price as of 1/18/2024; Reflects status quo Kodiak figures as of 9/30/2023. See Appendix beginning on page 43 3 4 5 for
reconciliation of non-GAAP measures; As of 9/30/2023; Reflects LTM Q3 2023 Adjusted EBITDA figures; Reflects percent of Q3 2023 Compression Operations revenue derived from 6 7 Investment Grade rated customers per Kodiak Management; Reflects average
of Q3 2019 – Q3 2023 monthly utilization; Reflects 2015 – Q3 2023 bad debt expense as percentage of total revenue KODIAK GAS SERVICES J a n u a r y 2 0 2 4 I n v e s t o r P r e s e n t a t i o n | 12
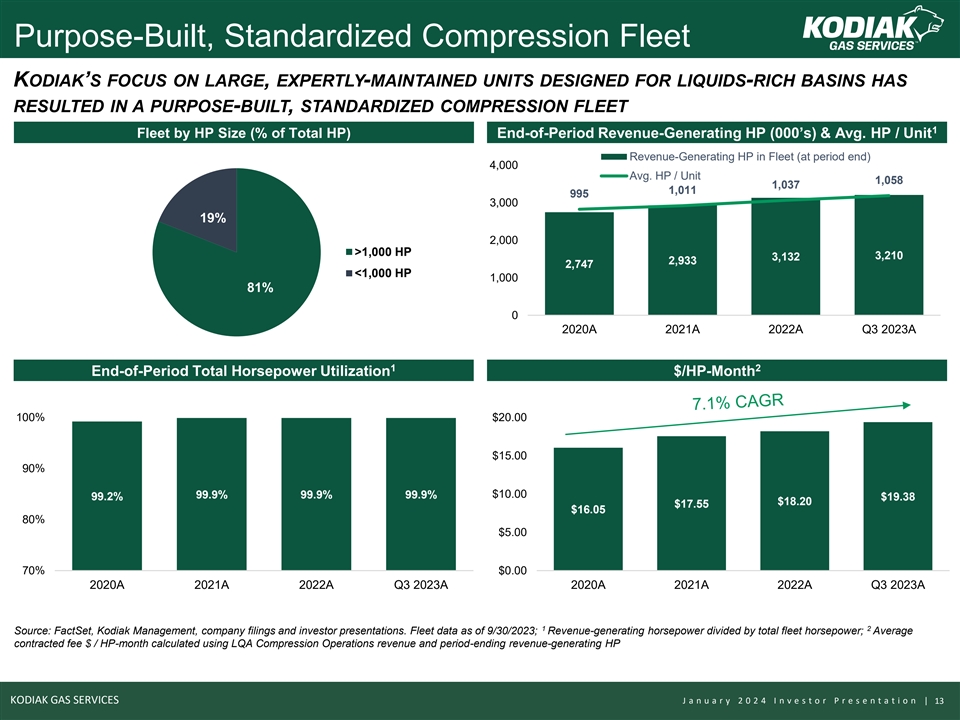
Purpose-Built, Standardized Compression Fleet KODIAK’S FOCUS ON
LARGE, EXPERTLY-MAINTAINED UNITS DESIGNED FOR LIQUIDS-RICH BASINS HAS RESULTED IN A PURPOSE-BUILT, STANDARDIZED COMPRESSION FLEET 1 Fleet by HP Size (% of Total HP) End-of-Period Revenue-Generating HP (000’s) & Avg. HP / Unit
Revenue-Generating HP in Fleet (at period end) 4,000 1200 Avg. HP / Unit 1,058 1,037 1100 1,011 995 3,000 1000 19% 900 2,000 800 >1,000 HP 3,210 3,132 2,933 2,747 700 <1,000 HP 1,000 81% 600 0 500 2020A 2021A 2022A Q3 2023A 1 2 End-of-Period
Total Horsepower Utilization $/HP-Month 100% $20.00 $15.00 90% 99.9% 99.9% 99.9% $10.00 99.2% $19.38 $18.20 $17.55 $16.05 80% $5.00 70% $0.00 2020A 2021A 2022A Q3 2023A 2020A 2021A 2022A Q3 2023A 1 2 Source: FactSet, Kodiak Management, company
filings and investor presentations. Fleet data as of 9/30/2023; Revenue-generating horsepower divided by total fleet horsepower; Average contracted fee $ / HP-month calculated using LQA Compression Operations revenue and period-ending
revenue-generating HP KODIAK GAS SERVICES J a n u a r y 2 0 2 4 I n v e s t o r P r e s e n t a t i o n | 13
Transaction Overview

Financially Accretive Pathway to Industry Leadership Acquisition
Highlights Largest Fleet in North America ~4.2mm Revenue- 1 ❑ On December 19, 2023, Kodiak announced an all-equity acquisition Generating HP ~3.2mm HP ~1.0mm HP of CSI Compressco LP valued at $854 million (based on th December 18 market
prices) Largest Operator in Permian Basin ❑ Purchase price at announcement represents ~6.6x multiple of CSI 2 LTM Q3 2023 Adj. EBITDA ~2.8mm Permian HP ~2.3mm HP ~0.5mm HP ❑ Expected to create largest domestic contract compression
fleet with 1 4.2 million revenue-generating horsepower Highest Utilization Among Peers ❑ Expected to close in Q2 2024 96.6% Utilization 99.9% 87.6% Utilization Utilization 1 2 Sum of Kodiak revenue-generating horsepower and CSI horsepower in
service plus committed horsepower less international horsepower as of 9/30/2023; Excludes synergies KODIAK GAS SERVICES J a n u a r y 2 0 2 4 I n v e s t o r P r e s e n t a t i o n | 15

Key Transaction Benefits ❑ Enhanced cash flows help achieve
leverage goal of 3.5x by year end 2025 Attractive ❑ Over $20 million of high-confidence expected annual cost synergies Transaction ❑ Transaction value of ~6.6x CSI LTM Q3 2023 Adjusted EBITDA, excluding synergies Economics ❑
Expected to be accretive to Discretionary Cash Flow and Free Cash Flow per share ❑ Increases size and scale of fleet Complementary ❑ Opportunity to generate higher utilization across CSI’s fleet Compression Assets ❑
Investments in large HP units and divestiture of small HP units have high-graded CSI's fleet Deepen Geographic ❑ Presence in the Permian Basin and Eagle Ford Shale augments Kodiak’s existing footprint Footprint and ❑
Fixed-revenue contracts with blue-chip customers Expand Customer ❑ Limited customer overlap Base Natural Extension of ❑ Broader service offerings via CSI’s natural gas treating / cooling and aftermarket services Diversified
Service ❑ Potential for cross-selling opportunities Offerings KODIAK GAS SERVICES J a n u a r y 2 0 2 4 I n v e s t o r P r e s e n t a t i o n | 16
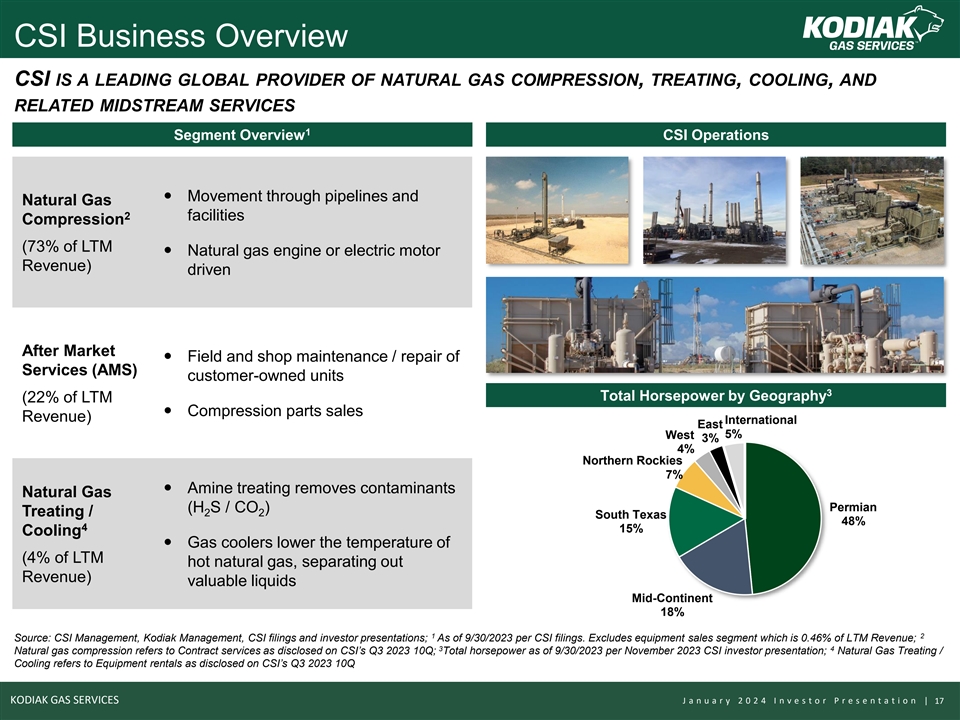
CSI Business Overview CSI IS A LEADING GLOBAL PROVIDER OF NATURAL GAS
COMPRESSION, TREATING, COOLING, AND RELATED MIDSTREAM SERVICES 1 Segment Overview CSI Operations — Movement through pipelines and Natural Gas 2 facilities Compression (73% of LTM — Natural gas engine or electric motor Revenue) driven After
Market — Field and shop maintenance / repair of Services (AMS) customer-owned units 3 Total Horsepower by Geography (22% of LTM — Compression parts sales Revenue) International East West 5% 3% 4% Northern Rockies 7% — Amine treating
removes contaminants Natural Gas Permian (H S / CO ) 2 2 Treating / South Texas 48% 4 15% Cooling — Gas coolers lower the temperature of (4% of LTM hot natural gas, separating out Revenue) valuable liquids Mid-Continent 18% 1 2 Source: CSI
Management, Kodiak Management, CSI filings and investor presentations; As of 9/30/2023 per CSI filings. Excludes equipment sales segment which is 0.46% of LTM Revenue; 3 4 Natural gas compression refers to Contract services as disclosed on
CSI’s Q3 2023 10Q; Total horsepower as of 9/30/2023 per November 2023 CSI investor presentation; Natural Gas Treating / Cooling refers to Equipment rentals as disclosed on CSI’s Q3 2023 10Q KODIAK GAS SERVICES J a n u a r y 2 0 2 4 I n v
e s t o r P r e s e n t a t i o n | 17

Pro Forma Horsepower CSI CSI 70k HP Northern Rockies 71k HP 2 Other
336k HP Kodiak 211k HP Kodiak 266k HP 140k HP CSI CSI 190k HP Mid-Continent 48k HP International 295k HP Kodiak 48k HP Kodiak 105k HP None CSI CSI 157k HP Eagle Ford 507k HP Permian 583k HP Kodiak 2,779k HP Kodiak Kodiak Headquarters 427k HP 2,272k
HP CSI Headquarters Pro Forma HP by Geography Mid- International Other 1% Continent 5% 7% CSI Northern 1,043k HP Total Revenue-Generating Rockies 8% 1 Kodiak 4,253k HP 3,210k HP Eagle Ford 14% Permian 65% 1 2 Reflects revenue-generating horsepower
for Kodiak and operating horsepower plus committed horsepower for CSI as of 9/30/2023; Other category comprised of CSI figures identified as East and West, and Kodiak figures identified as Appalachia, Haynesville, and Other KODIAK GAS SERVICES J a n
u a r y 2 0 2 4 I n v e s t o r P r e s e n t a t i o n | 18

Pro Forma Peer Comparison Key Operating Statistics by Company (HP in
millions) North American Contract Compression Market 4 16.3mm HP (~27% of Total NA Compression Market) 1 4.2 Pro Forma Kodiak 2 1 3.6 1 4.2mm HP (~7% of Total NA Compression Market) 3.4 3 3.2 4 2.7 2 1.0 4 0.9 3 4 1 0.5 4 0.4 0.4 0.3 Other Public or
Public Public Public Public Public Private Private Public Public Private - Private Ark-La-Tex, Ark-La-Tex, Bakken, Eagle Permian & Northeast, Permian & Permian, South Permian, Eagle Permian, Basin Focus Permian, Ford, Permian, Permian Global
- Eagle Ford Mid-Con, Eagle Ford TX, Mid-Con Ford, Mid-Con Barnett, Other SCOOP/STACK SCOOP/STACK Permian Utilization 97% 96% 94% 100% 88% N/A N/A N/A 79% N/A - (EOP Q3’23) % MTM 5 11% 24% 23% 7% 27% N/A N/A N/A 69% N/A - Contracts 1 Source:
Company websites, investor presentations, Kodiak Management, presentations, public filings and Spears & Associates; Sum of Kodiak revenue-generating horsepower and CSI 2 3 horsepower in service plus committed horsepower less international
horsepower as of 9/30/2023; Reflects operating horsepower as of 9/30/2023; Revenue-generating horsepower as of 4 5 9/30/2023; Data per Spears & Associates as of October 2023; As of 12/31/2022; calculated by dividing the total number of units
subject to MTM contracts by the total number of units KODIAK GAS SERVICES J a n u a r y 2 0 2 4 I n v e s t o r P r e s e n t a t i o n | 19
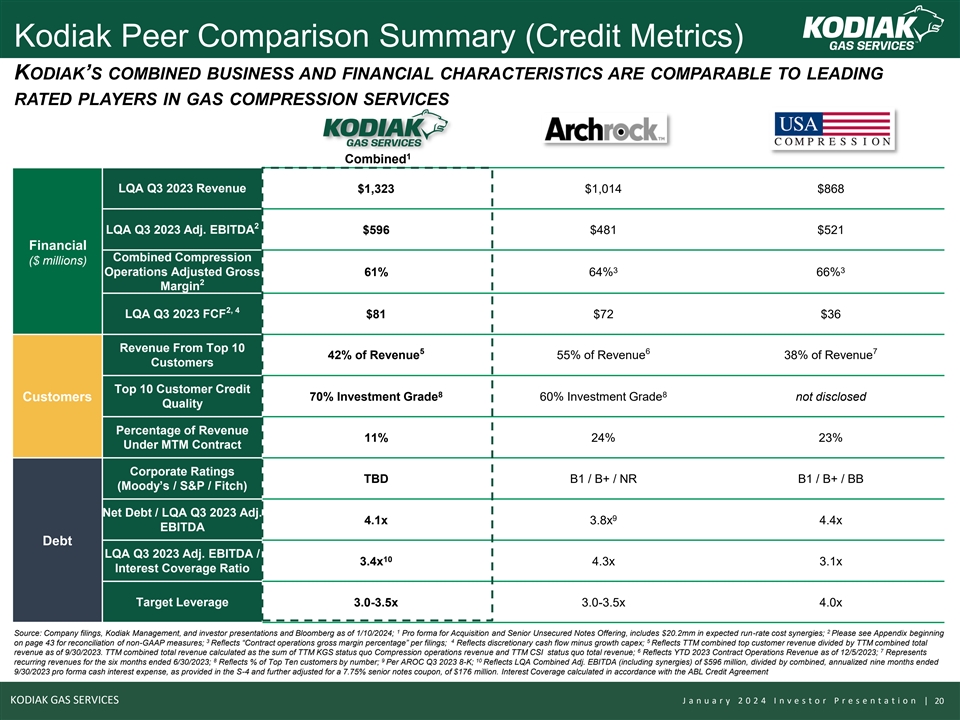
Kodiak Peer Comparison Summary (Credit Metrics) KODIAK’S COMBINED
BUSINESS AND FINANCIAL CHARACTERISTICS ARE COMPARABLE TO LEADING RATED PLAYERS IN GAS COMPRESSION SERVICES 1 Combined LQA Q3 2023 Revenue $1,323 $1,014 $868 2 LQA Q3 2023 Adj. EBITDA $596 $481 $521 Financial Combined Compression ($ millions) 3 3
Operations Adjusted Gross 61% 64% 66% 2 Margin 2, 4 LQA Q3 2023 FCF $81 $72 $36 Revenue From Top 10 5 6 7 42% of Revenue 55% of Revenue 38% of Revenue Customers Top 10 Customer Credit 8 8 Customers 70% Investment Grade 60% Investment Grade not
disclosed Quality Percentage of Revenue 11% 24% 23% Under MTM Contract Corporate Ratings TBD B1 / B+ / NR B1 / B+ / BB (Moody’s / S&P / Fitch) Net Debt / LQA Q3 2023 Adj. 9 4.1x 3.8x 4.4x EBITDA Debt LQA Q3 2023 Adj. EBITDA / 10 3.4x 4.3x
3.1x Interest Coverage Ratio Target Leverage 3.0-3.5x 3.0-3.5x 4.0x 1 2 Source: Company filings, Kodiak Management, and investor presentations and Bloomberg as of 1/10/2024; Pro forma for Acquisition and Senior Unsecured Notes Offering, includes
$20.2mm in expected run-rate cost synergies; Please see Appendix beginning 3 4 5 on page 43 for reconciliation of non-GAAP measures; Reflects “Contract operations gross margin percentage” per filings; Reflects discretionary cash flow
minus growth capex; Reflects TTM combined top customer revenue divided by TTM combined total 6 7 revenue as of 9/30/2023. TTM combined total revenue calculated as the sum of TTM KGS status quo Compression operations revenue and TTM CSI status quo
total revenue; Reflects YTD 2023 Contract Operations Revenue as of 12/5/2023; Represents 8 9 10 recurring revenues for the six months ended 6/30/2023; Reflects % of Top Ten customers by number; Per AROC Q3 2023 8-K; Reflects LQA Combined Adj. EBITDA
(including synergies) of $596 million, divided by combined, annualized nine months ended 9/30/2023 pro forma cash interest expense, as provided in the S-4 and further adjusted for a 7.75% senior notes coupon, of $176 million. Interest Coverage
calculated in accordance with the ABL Credit Agreement KODIAK GAS SERVICES J a n u a r y 2 0 2 4 I n v e s t o r P r e s e n t a t i o n | 20

Industry Overview
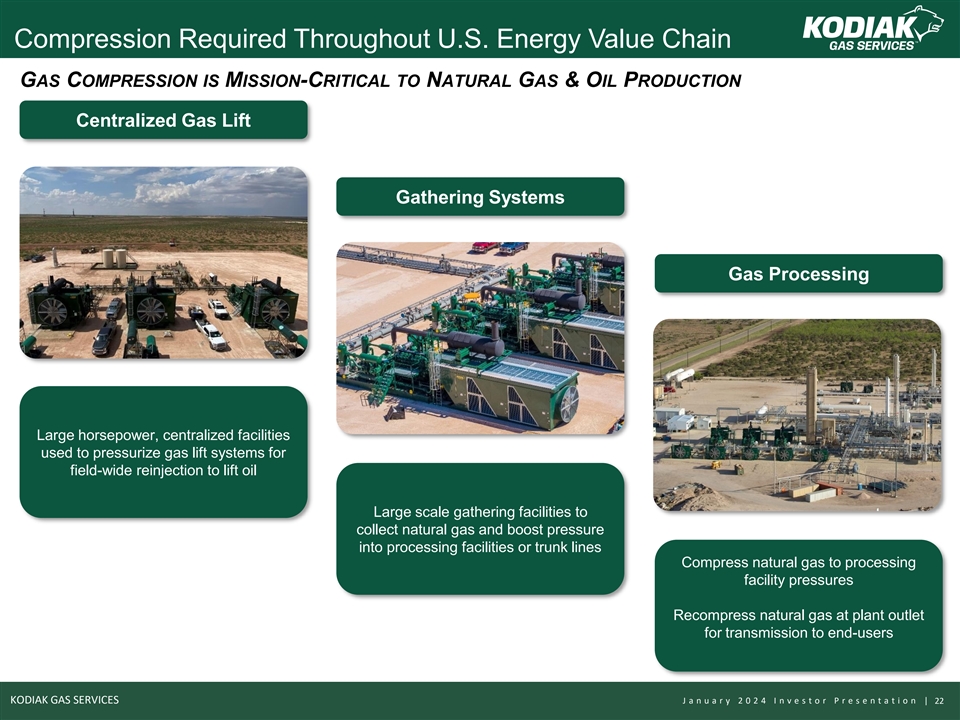
Compression Required Throughout U.S. Energy Value Chain GAS COMPRESSION
IS MISSION-CRITICAL TO NATURAL GAS & OIL PRODUCTION Centralized Gas Lift Gathering Systems Gas Processing Large horsepower, centralized facilities used to pressurize gas lift systems for field-wide reinjection to lift oil Large scale gathering
facilities to collect natural gas and boost pressure into processing facilities or trunk lines Compress natural gas to processing facility pressures Recompress natural gas at plant outlet for transmission to end-users KODIAK GAS SERVICES J a n u a r
y 2 0 2 4 I n v e s t o r P r e s e n t a t i o n | 22
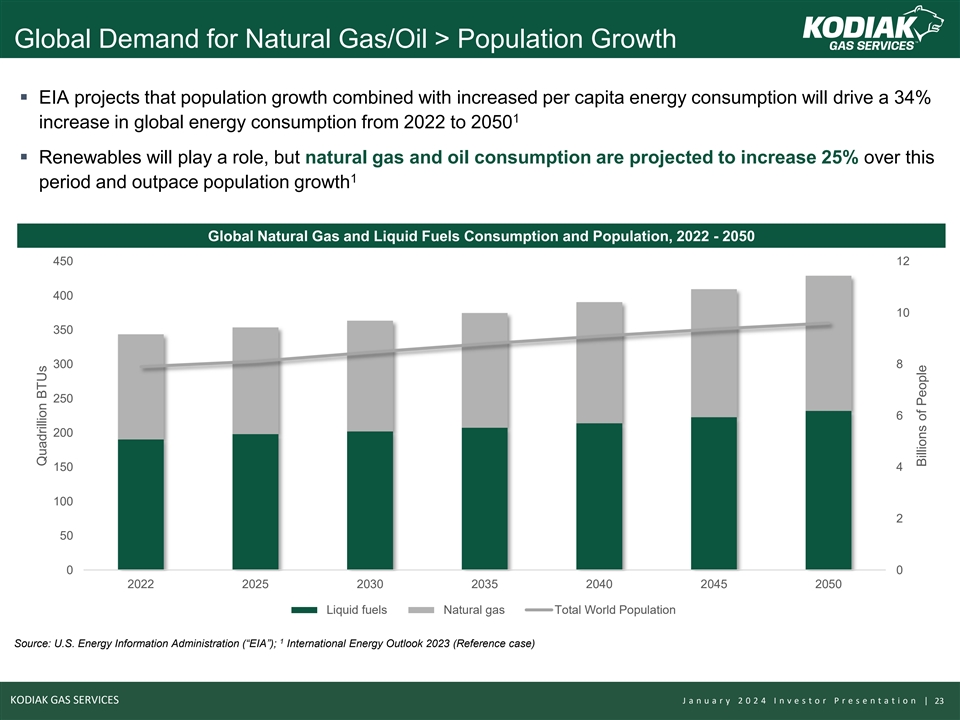
Global Demand for Natural Gas/Oil > Population Growth ▪ EIA
projects that population growth combined with increased per capita energy consumption will drive a 34% 1 increase in global energy consumption from 2022 to 2050 ▪ Renewables will play a role, but natural gas and oil consumption are projected
to increase 25% over this 1 period and outpace population growth Global Natural Gas and Liquid Fuels Consumption and Population, 2022 - 2050 450 12 400 10 350 300 8 250 6 200 150 4 100 2 50 0 0 2022 2025 2030 2035 2040 2045 2050 Liquid fuels Natural
gas Total World Population 1 Source: U.S. Energy Information Administration (“EIA”); International Energy Outlook 2023 (Reference case) KODIAK GAS SERVICES J a n u a r y 2 0 2 4 I n v e s t o r P r e s e n t a t i o n | 23 Quadrillion
BTUs Billions of People
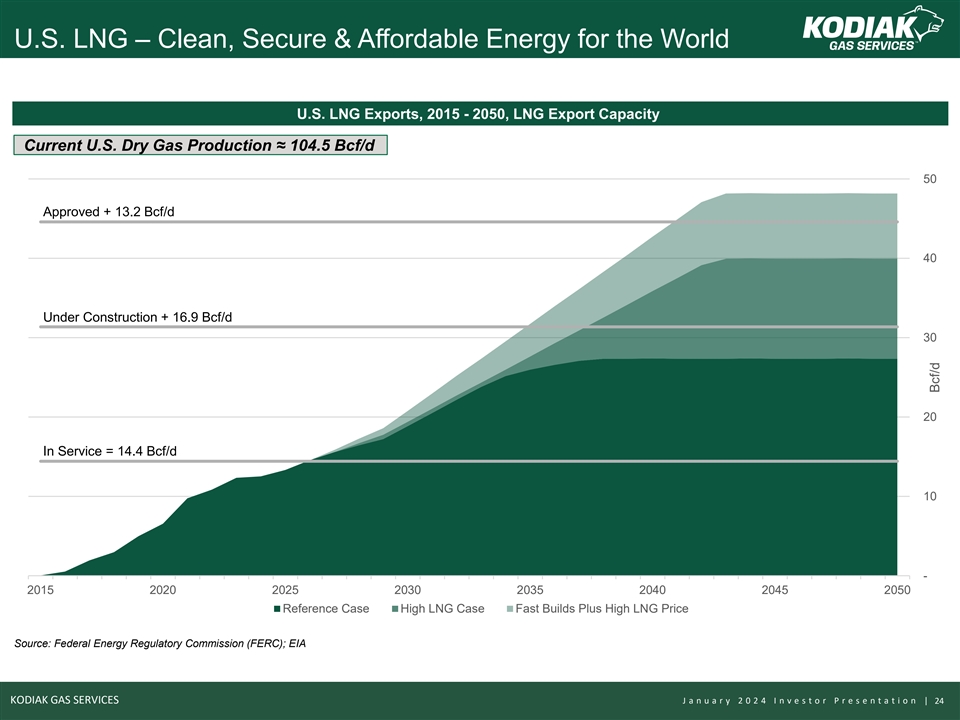
U.S. LNG – Clean, Secure & Affordable Energy for the World
U.S. LNG Exports, 2015 - 2050, LNG Export Capacity Current U.S. Dry Gas Production ≈ 104.5 Bcf/d 50 Approved + 13.2 Bcf/d 40 Under Construction + 16.9 Bcf/d 30 20 In Service = 14.4 Bcf/d 10 - 2015 2020 2025 2030 2035 2040 2045 2050 Reference
Case High LNG Case Fast Builds Plus High LNG Price Source: Federal Energy Regulatory Commission (FERC); EIA KODIAK GAS SERVICES J a n u a r y 2 0 2 4 I n v e s t o r P r e s e n t a t i o n | 24 Bcf/d
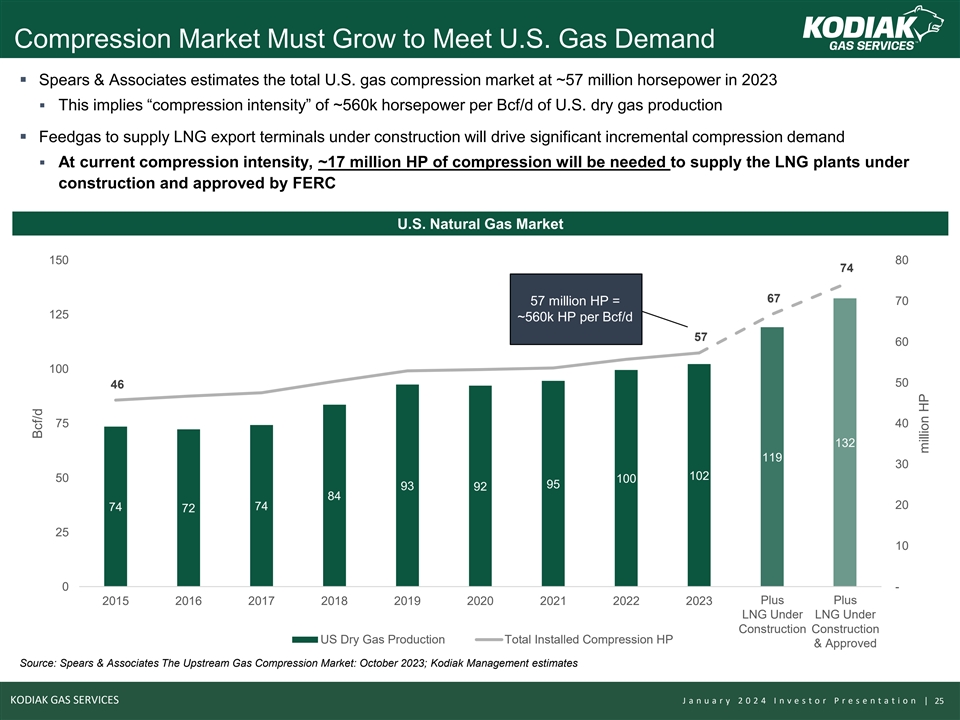
Compression Market Must Grow to Meet U.S. Gas Demand ▪ Spears
& Associates estimates the total U.S. gas compression market at ~57 million horsepower in 2023 ▪ This implies “compression intensity” of ~560k horsepower per Bcf/d of U.S. dry gas production ▪ Feedgas to supply LNG export
terminals under construction will drive significant incremental compression demand ▪ At current compression intensity, ~17 million HP of compression will be needed to supply the LNG plants under construction and approved by FERC U.S. Natural
Gas Market 150 80 74 67 57 million HP = 70 125 ~560k HP per Bcf/d 57 60 100 50 46 75 40 132 119 30 102 50 100 95 93 92 84 20 74 74 72 25 10 0 - Plus Plus 2015 2016 2017 2018 2019 2020 2021 2022 2023 Existing + Existing + L LNG NG Un Und de er r L
LNG NG Un Und de er r Con Cons stru truc cti tio on n Con Cons stru truc cti tio on n US Dry Gas Production Total Installed Compression HP & Approved & Approved Source: Spears & Associates The Upstream Gas Compression Market: October
2023; Kodiak Management estimates KODIAK GAS SERVICES J a n u a r y 2 0 2 4 I n v e s t o r P r e s e n t a t i o n | 25 Bcf/d million HP
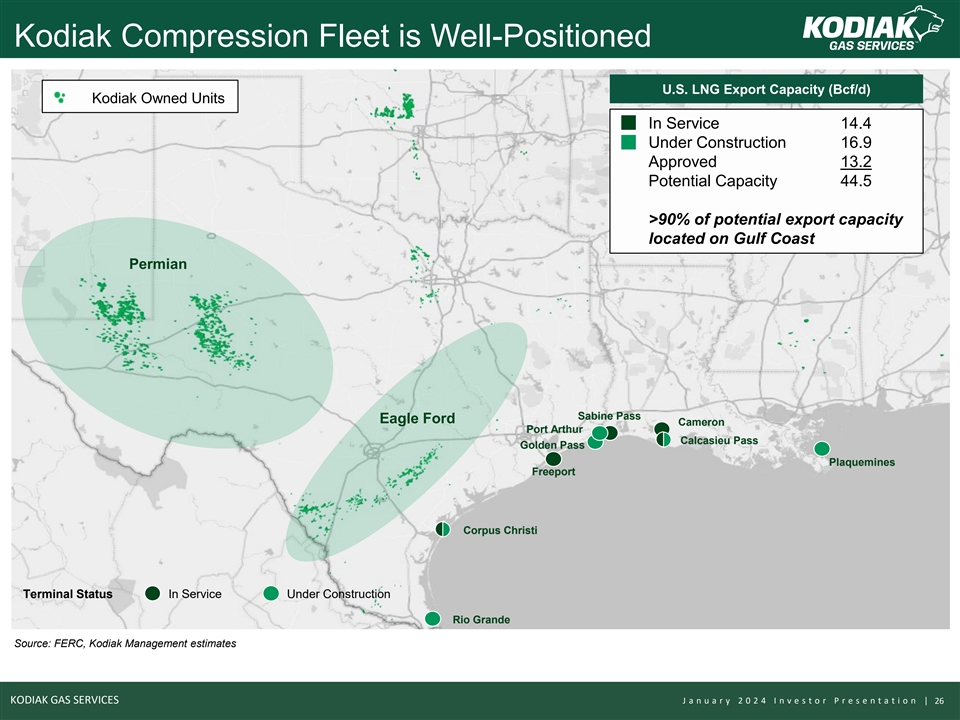
Kodiak Compression Fleet is Well-Positioned U.S. LNG Export Capacity
(Bcf/d) Kodiak Owned Units In Service 14.4 Under Construction 16.9 Approved 13.2 Potential Capacity 44.5 >90% of potential export capacity located on Gulf Coast Permian Sabine Pass Eagle Ford Cameron Port Arthur Calcasieu Pass Golden Pass
Plaquemines Freeport Corpus Christi Terminal Status In Service Under Construction Rio Grande Source: FERC, Kodiak Management estimates KODIAK GAS SERVICES J a n u a r y 2 0 2 4 I n v e s t o r P r e s e n t a t i o n | 26

Credit Highlights
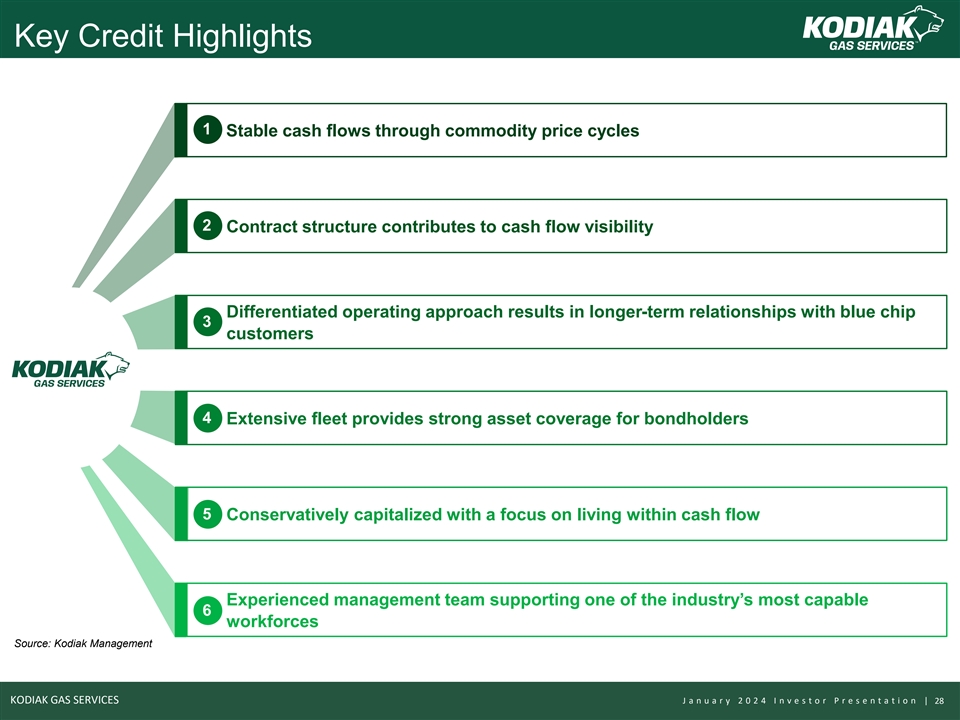
Key Credit Highlights 1 Stable cash flows through commodity price
cycles 2 Contract structure contributes to cash flow visibility Differentiated operating approach results in longer-term relationships with blue chip 3 customers 4 Extensive fleet provides strong asset coverage for bondholders 5 Conservatively
capitalized with a focus on living within cash flow Experienced management team supporting one of the industry’s most capable 6 workforces Source: Kodiak Management KODIAK GAS SERVICES J a n u a r y 2 0 2 4 I n v e s t o r P r e s e n t a t i
o n | 28
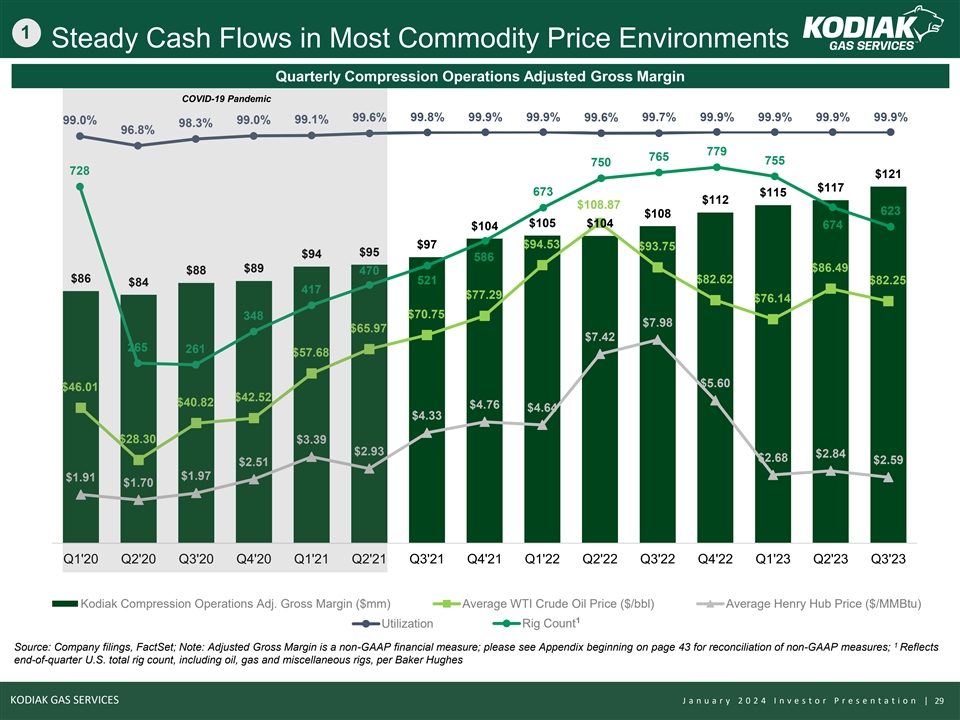
1 Steady Cash Flows in Most Commodity Price Environments Quarterly
Compression Operations Adjusted Gross Margin COVID-19 Pandemic 99.6% 99.8% 99.9% 99.9% 99.6% 99.7% 99.9% 99.9% 99.9% 99.9% 99.0% 99.0% 99.1% 900 98.3% 96.8% 1 1 1 779 765 1 755 750 1 728 $121 1 1 14.0 $117 120 673 $115 1 700 $112 1 $108.87 623 1
$108 1 $105 $104 674 $104 1 12.0 1 $94.53 $97 $93.75 10 1 0 $95 $94 1 586 1 $86.49 $89 $88 470 500 1 $86 521 $82.62 $82.25 $84 1 417 10.0 1 $77.29 $76.14 1 80 1 $70.75 348 1 $7.98 $65.97 1 1 $7.42 8.0 1 265 261 300 $57.68 1 0 60 0 0 $5.60 $46.01 0
6.0 $42.52 0 $40.82 $4.76 $4.64 0 $4.33 0 40 0 100 0 $28.30 $3.39 4.0 0 $2.93 0 $2.84 $2.68 $2.59 0 $2.51 0 $1.97 $1.91 0 $1.70 20 0 2.0 0 -100 0 0 0 0 0 0 - 0 0 Q1'20 Q2'20 Q3'20 Q4'20 Q1'21 Q2'21 Q3'21 Q4'21 Q1'22 Q2'22 Q3'22 Q4'22 Q1'23 Q2'23
Q3'23 0 0 -300 Kodiak Compression Operations Adj. Gross Margin ($mm) Average WTI Crude Oil Price ($/bbl) Average Henry Hub Price ($/MMBtu) 1 Utilization Rig Count 1 Source: Company filings, FactSet; Note: Adjusted Gross Margin is a non-GAAP
financial measure; please see Appendix beginning on page 43 for reconciliation of non-GAAP measures; Reflects end-of-quarter U.S. total rig count, including oil, gas and miscellaneous rigs, per Baker Hughes KODIAK GAS SERVICES J a n u a r y 2 0 2 4
I n v e s t o r P r e s e n t a t i o n | 29
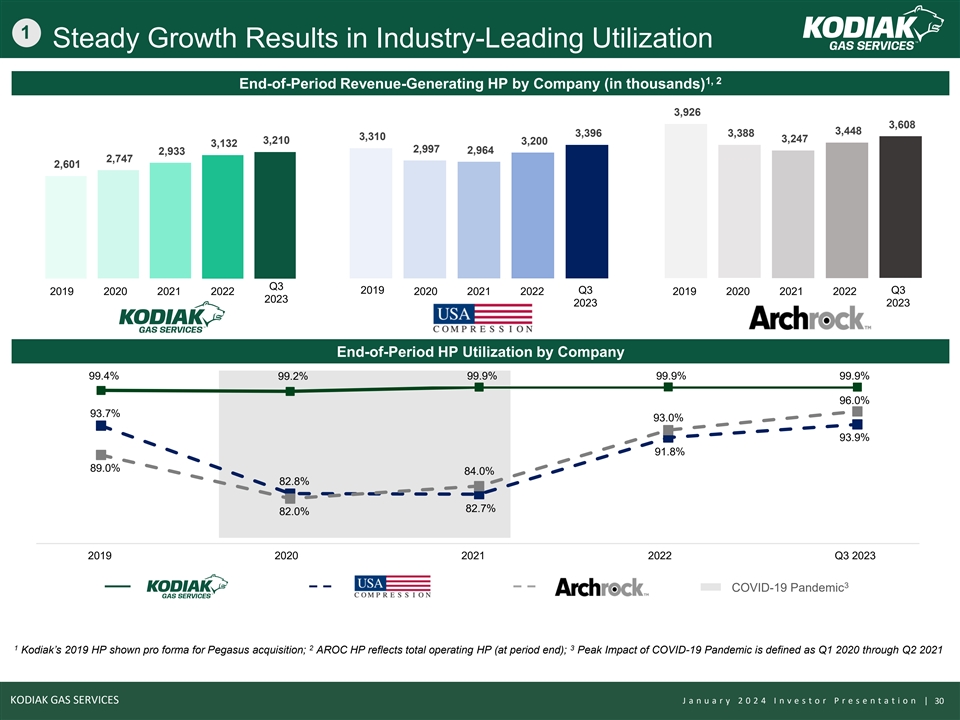
1 Steady Growth Results in Industry-Leading Utilization 1, 2
End-of-Period Revenue-Generating HP by Company (in thousands) 3,926 3,608 3,448 3,396 3,388 3,310 3,247 3,210 3,200 3,132 2,997 2,933 2,964 2,747 2,601 Q3 2019 Q3 Q3 2019 2020 2021 2022 2020 2021 2022 2019 2020 2021 2022 2023 2023 2023 End-of-Period
HP Utilization by Company 99.4% 99.2% 99.9% 99.9% 99.9% 96.0% 93.7% 93.0% 93.9% 91.8% 89.0% 84.0% 82.8% 82.7% 82.0% 2019 2020 2021 2022 Q3 2023 3 USAC AROC COVID-19 Pandemic 1 2 3 Kodiak’s 2019 HP shown pro forma for Pegasus acquisition; AROC
HP reflects total operating HP (at period end); Peak Impact of COVID-19 Pandemic is defined as Q1 2020 through Q2 2021 KODIAK GAS SERVICES J a n u a r y 2 0 2 4 I n v e s t o r P r e s e n t a t i o n | 30
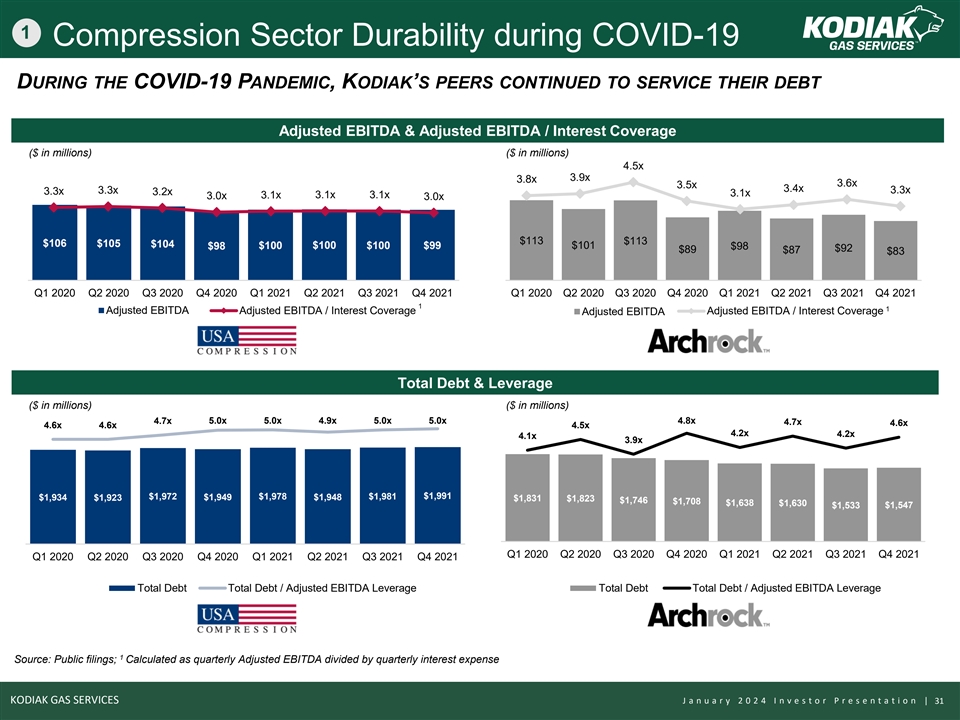
1 Compression Sector Durability during COVID-19 DURING THE COVID-19
PANDEMIC, KODIAK’S PEERS CONTINUED TO SERVICE THEIR DEBT Adjusted EBITDA & Adjusted EBITDA / Interest Coverage $200 0.6 $0.53 $0.53 $0.53 $0.53 $0.53 $0.53 $0.53 $0.53 0.16 $180 ($ in millions) ($ in millions) 0.5 0.14 4.5x $160 3.9x 3.8x
$140 0.12 $140 3.6x 3.5x 0.4 3.4x 3.3x 3.3x 3.3x 3.2x 3.1x 3.1x 3.1x 3.1x $120 3.0x 3.0x 0.1 0 $100 .3 0.08 $80 0.06 $70 0.2 $60 $113 $113 $106 $105 $104 $98 $100 $100 $100 $99 $101 $98 0.04 $92 $89 $87 $83 $40 0.1 0.02 $20 $0 0 $0 0 Q1 2020 Q2 2020
Q3 2020 Q4 2020 Q1 2021 Q2 2021 Q3 2021 Q4 2021 Q1 2020 Q2 2020 Q3 2020 Q4 2020 Q1 2021 Q2 2021 Q3 2021 Q4 2021 1 1 Adjusted EBITDA Adjusted EBITDA / Interest Coverage Adjusted EBITDA / Interest Coverage Adjusted EBITDA Total Debt & Leverage ($
in millions) ($ in millions) 4.7x 5.0x 5.0x 4.9x 5.0x 5.0x 4.8x $2,500 4.7x $2,500 4.6x 4.6x 4.6x 4.5x $5.0 $5.0 4.2x 4.2x 4.1x $4.5 3.9x $4.5 $2,000 $2,000 $4.0 $4.0 $3.5 $3.5 $1,500 $1,500 $3.0 $3.0 $2.5 $2.5 $1,000 $1,000 $1,972 $1,949 $1,978
$1,948 $1,981 $1,991 $2.0 $1,934 $1,923 $2.0 $1,831 $1,823 $1,746 $1,708 $1,638 $1,630 $1,547 $1,533 $1.5 $1.5 $500 $1.0 $500 $1.0 $0.5 $0.5 $0 $0.0 $0.0 $0 Q1 2020 Q2 2020 Q3 2020 Q4 2020 Q1 2021 Q2 2021 Q3 2021 Q4 2021 Q1 2020 Q2 2020 Q3 2020 Q4
2020 Q1 2021 Q2 2021 Q3 2021 Q4 2021 Total Debt Total Debt / Adjusted EBITDA Leverage Total Debt Total Debt / Adjusted EBITDA Leverage 1 Source: Public filings; Calculated as quarterly Adjusted EBITDA divided by quarterly interest expense KODIAK GAS
SERVICES J a n u a r y 2 0 2 4 I n v e s t o r P r e s e n t a t i o n | 31
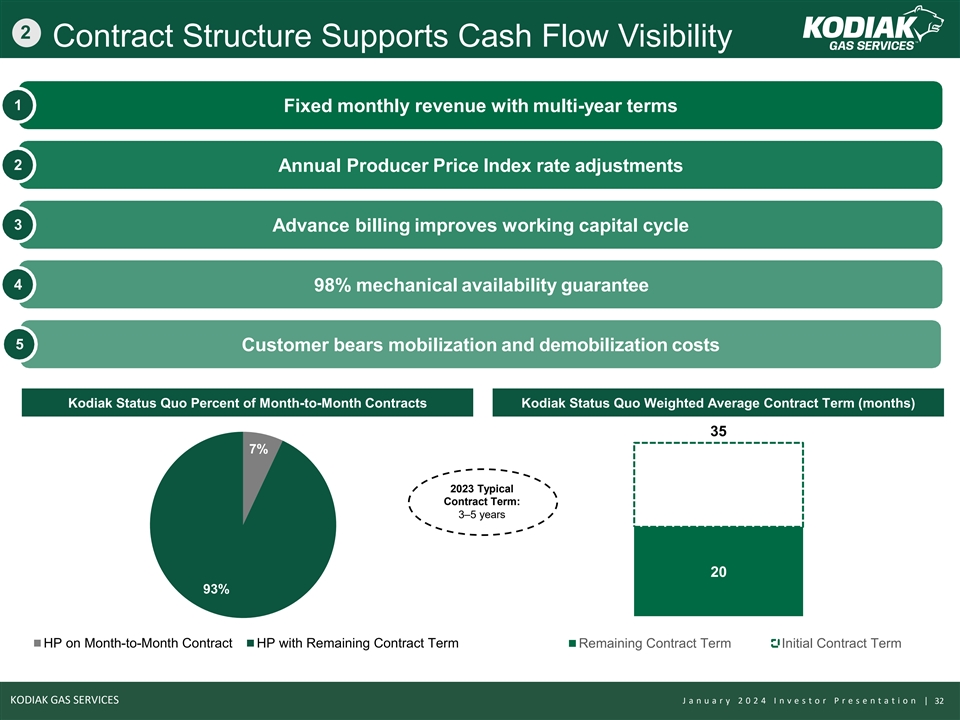
2 Contract Structure Supports Cash Flow Visibility 1 Fixed monthly
revenue with multi-year terms 2 Annual Producer Price Index rate adjustments 3 Advance billing improves working capital cycle 4 98% mechanical availability guarantee 5 Customer bears mobilization and demobilization costs Kodiak Status Quo Percent of
Month-to-Month Contracts Kodiak Status Quo Weighted Average Contract Term (months) 35 7% 2023 Typical Contract Term: 3–5 years 20 93% HP on Month-to-Month Contract HP with Remaining Contract Term Remaining Contract Term Initial Contract Term
KODIAK GAS SERVICES J a n u a r y 2 0 2 4 I n v e s t o r P r e s e n t a t i o n | 32

3 Kodiak's Operating Strategy Is Designed to Maximize Uptime
KODIAK’S RIGOROUS ENGINE AND COMPRESSOR MAINTENANCE PROGRAM, STRONG WORKFORCE AND DISTRIBUTED SPARE PARTS INVENTORY SYSTEM MATERIALLY DIFFERENTIATE ITS OPERATIONS ▪ Data-driven, preventative maintenance strategy ▪ Program
systemically ensures that unit engines are effectively “zero-houred” every ~10 years ▪ Standardized equipment optimizes efficiency of maintenance program Investing in the Capabilities of our Teammates Inventory System Designed to
Minimize Downtime ~19,000 ~1,000 Hours of Technical Hours of Professional Training in 2023 Training in 2023 ~1,800 ~13,500 Hours of Compliance Hours of EH&S Positioning spare parts in close proximity to units Training in 2023 Training in 2023
maximizes run-time Kodiak’s customer-centric operating model will be leveraged to create value across the CSI portfolio KODIAK GAS SERVICES J a n u a r y 2 0 2 4 I n v e s t o r P r e s e n t a t i o n | 33
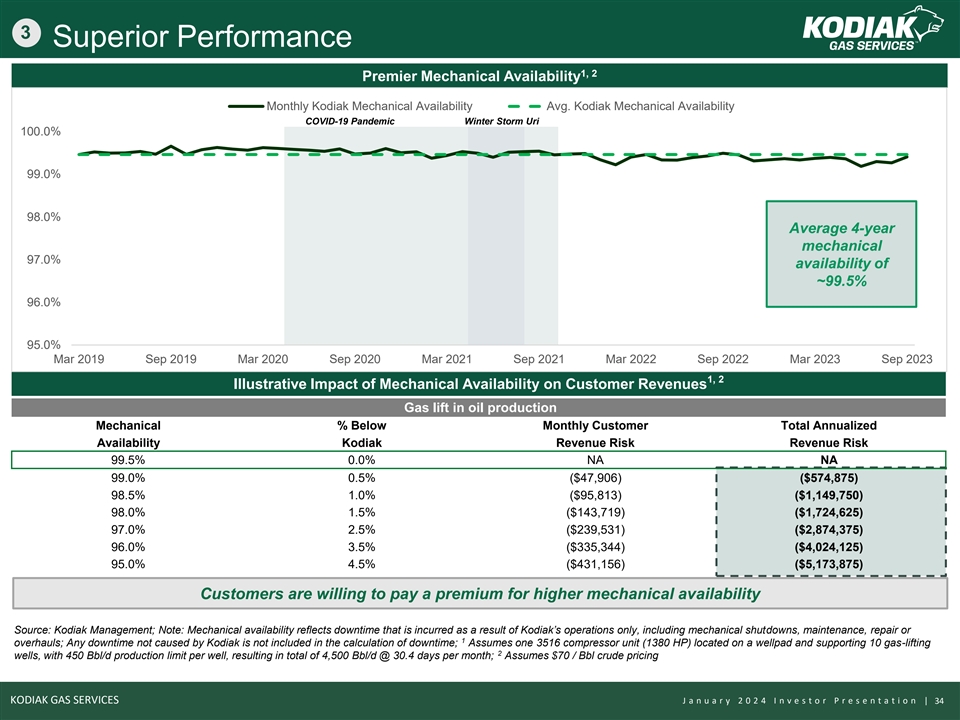
3 Superior Performance 1, 2 Premier Mechanical Availability Monthly
Kodiak Mechanical Availability Avg. Kodiak Mechanical Availability COVID-19 Pandemic Winter Storm Uri 100.0% 99.0% 98.0% Average 4-year mechanical 97.0% availability of ~99.5% 96.0% 95.0% Mar 2019 Sep 2019 Mar 2020 Sep 2020 Mar 2021 Sep 2021 Mar
2022 Sep 2022 Mar 2023 Sep 2023 1, 2 Illustrative Impact of Mechanical Availability on Customer Revenues Gas lift in oil production Mechanical % Below Monthly Customer Total Annualized Availability Kodiak Revenue Risk Revenue Risk 99.5% 0.0% NA NA
99.0% 0.5% ($47,906) ($574,875) 98.5% 1.0% ($95,813) ($1,149,750) 98.0% 1.5% ($143,719) ($1,724,625) 97.0% 2.5% ($239,531) ($2,874,375) 96.0% 3.5% ($335,344) ($4,024,125) 95.0% 4.5% ($431,156) ($5,173,875) Customers are willing to pay a premium for
higher mechanical availability Source: Kodiak Management; Note: Mechanical availability reflects downtime that is incurred as a result of Kodiak’s operations only, including mechanical shutdowns, maintenance, repair or 1 overhauls; Any
downtime not caused by Kodiak is not included in the calculation of downtime; Assumes one 3516 compressor unit (1380 HP) located on a wellpad and supporting 10 gas-lifting 2 wells, with 450 Bbl/d production limit per well, resulting in total of
4,500 Bbl/d @ 30.4 days per month; Assumes $70 / Bbl crude pricing KODIAK GAS SERVICES J a n u a r y 2 0 2 4 I n v e s t o r P r e s e n t a t i o n | 34
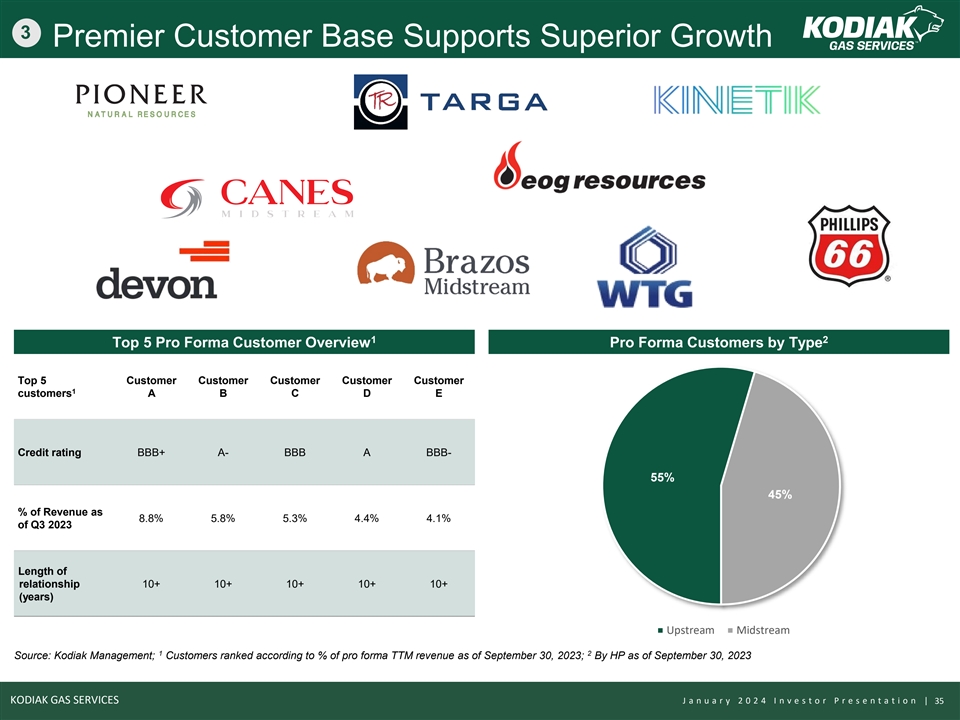
3 Premier Customer Base Supports Superior Growth 1 2 Top 5 Pro Forma
Customer Overview Pro Forma Customers by Type Top 5 Customer Customer Customer Customer Customer 1 customers A B C D E Credit rating BBB+ A- BBB A BBB- 55% 45% % of Revenue as 8.8% 5.8% 5.3% 4.4% 4.1% of Q3 2023 Length of relationship 10+ 10+ 10+
10+ 10+ (years) Upstream Midstream 1 2 Source: Kodiak Management; Customers ranked according to % of pro forma TTM revenue as of September 30, 2023; By HP as of September 30, 2023 KODIAK GAS SERVICES J a n u a r y 2 0 2 4 I n v e s t o r P r e s e n
t a t i o n | 35
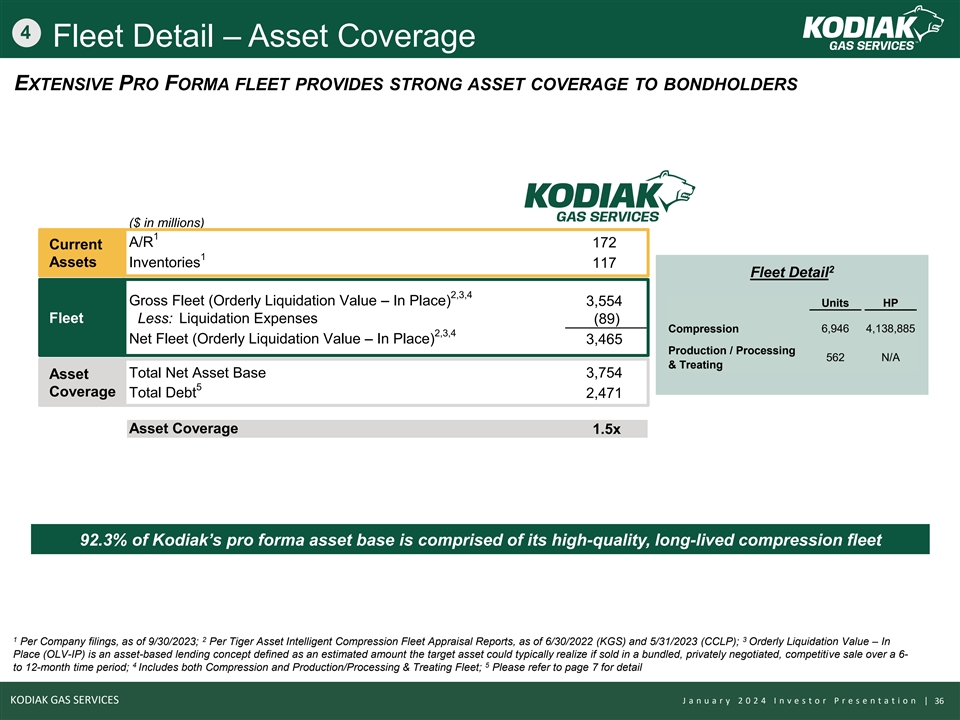
4 Fleet Detail – Asset Coverage EXTENSIVE PRO FORMA FLEET
PROVIDES STRONG ASSET COVERAGE TO BONDHOLDERS ($ in millions) 1 A/R 172 Current 1 Assets Inventories 117 2 Fleet Detail 2,3,4 Gross Fleet (Orderly Liquidation Value – In Place) 3,554 Units HP Fleet Less: Liquidation Expenses (89) 6,946
4,138,885 Compression 2,3,4 Net Fleet (Orderly Liquidation Value – In Place) 3,465 Production / Processing 562 N/A & Treating Total Net Asset Base 3,754 Asset 5 Coverage Total Debt 2,471 Asset Coverage 1.5x 92.3% of Kodiak’s pro
forma asset base is comprised of its high-quality, long-lived compression fleet 1 2 3 Per Company filings, as of 9/30/2023; Per Tiger Asset Intelligent Compression Fleet Appraisal Reports, as of 6/30/2022 (KGS) and 5/31/2023 (CCLP); Orderly
Liquidation Value – In Place (OLV-IP) is an asset-based lending concept defined as an estimated amount the target asset could typically realize if sold in a bundled, privately negotiated, competitive sale over a 6- 4 5 to 12-month time period;
Includes both Compression and Production/Processing & Treating Fleet; Please refer to page 7 for detail KODIAK GAS SERVICES J a n u a r y 2 0 2 4 I n v e s t o r P r e s e n t a t i o n | 36

5 Capital Allocation Framework Adjusted EBITDA 80% of pro forma debt
either Stable and growing cash flow base insulated from short-cycle commodity price swings fixed rate or swapped to fixed, large NOL balance and Cash Interest Cash Taxes Maintenance Capex predictable maintenance (-) capex 80% of pro forma debt
either fixed rate or ~$2B NOLs provide tax shield through Estimated ~5-8% of revenues; swapped to fixed 2030 predictable based on fleet age and hours Conservative, prudent, well- covered dividend, balanced Discretionary Cash Flow against investments
in (=) business and de-levering to target leverage ratio Cash Dividends (-) Expected dividend coverage of > 2x High-return capital deployment alongside blue- (-) Growth Capex chip customers within free cash flow (=) Cash Flow Positive
Publicly-announced leverage target of 3.5x by end of 2025 Target Leverage Ratio of 3.0 – 3.5x Contracted nature of Kodiak’s business enables Kodiak to halt dividend payments or capex to instead pay down debt in a downside market scenario
KODIAK GAS SERVICES J a n u a r y 2 0 2 4 I n v e s t o r P r e s e n t a t i o n | 37
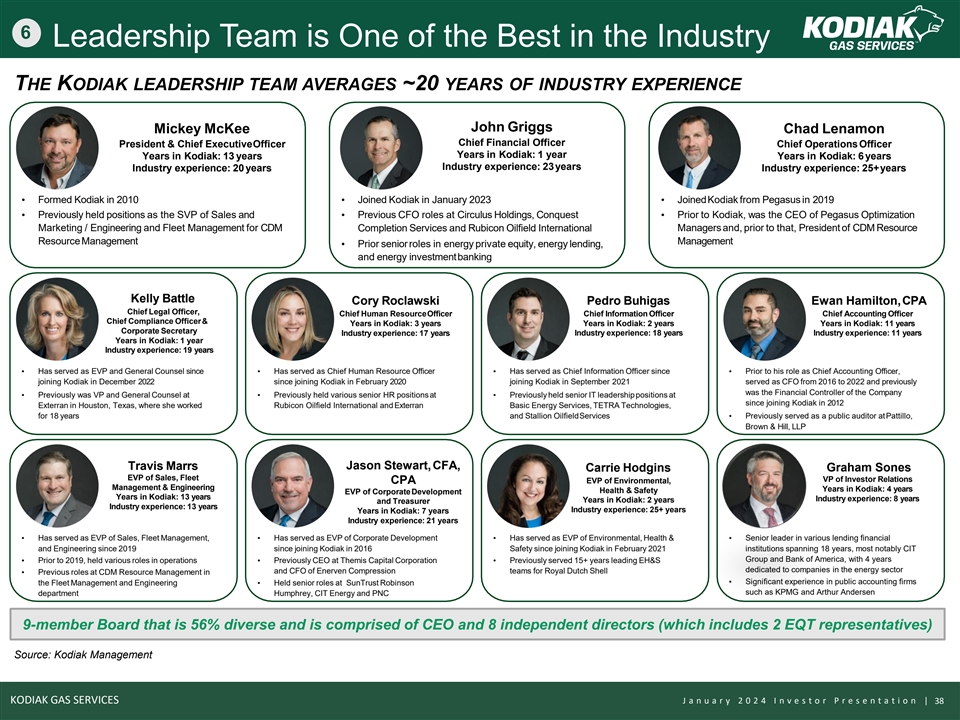
6 Leadership Team is One of the Best in the Industry THE KODIAK
LEADERSHIP TEAM AVERAGES ~20 YEARS OF INDUSTRY EXPERIENCE John Griggs Mickey McKee Chad Lenamon Chief Financial Officer President & Chief ExecutiveOfficer Chief OperationsOfficer Years in Kodiak: 1 year Years in Kodiak: 13 years Years in Kodiak:
6 years Industry experience: 23years Industry experience: 20 years Industry experience: 25+years • Formed Kodiak in 2010• Joined Kodiak in January 2023• JoinedKodiak from Pegasus in 2019 • Previously held positions as the SVP
of Sales and • Previous CFO roles at Circulus Holdings, Conquest • Prior to Kodiak, was the CEO of Pegasus Optimization Marketing / Engineering and Fleet Management for CDM Completion Services and Rubicon Oilfield International
Managersand, prior to that, President of CDM Resource ResourceManagement Management • Prior seniorroles in energy private equity, energy lending, and energy investmentbanking Kelly Battle Cory Roclawski Pedro Buhigas Ewan Hamilton,CPA Chief
Legal Officer, Chief Human ResourceOfficer Chief Information Officer Chief Accounting Officer Chief Compliance Officer& Years in Kodiak: 3 years Years in Kodiak: 2 years Years in Kodiak: 11 years Corporate Secretary Industry experience: 17 years
Industry experience: 18 years Industry experience: 11 years Years in Kodiak: 1 year Industry experience: 19 years • Has served as EVP and General Counsel since • Has served as Chief Human Resource Officer • Has served as Chief
Information Officer since • Prior to his role as Chief Accounting Officer, joining Kodiak in December 2022 since joining Kodiak in February 2020 joining Kodiak in September 2021 served as CFO from 2016 to 2022 and previously was the Financial
Controller of the Company • Previously was VP and General Counsel at • Previously held various senior HR positionsat • Previously held senior IT leadershippositions at since joining Kodiak in 2012 Exterran in Houston, Texas, where
she worked Rubicon Oilfield International and Exterran Basic Energy Services, TETRA Technologies, for 18 years and Stallion OilfieldServices• Previously served as a public auditor atPattillo, Brown & Hill, LLP Jason Stewart,CFA, Travis
Marrs Carrie Hodgins Graham Sones EVP of Sales, Fleet VP of Investor Relations CPA EVP of Environmental, Management & Engineering Years in Kodiak: 4 years Health & Safety EVP of CorporateDevelopment Years in Kodiak: 13 years Industry
experience: 8 years Years in Kodiak: 2 years and Treasurer Industry experience: 13 years Industry experience: 25+ years Years in Kodiak: 7 years Industry experience: 21 years • Has served as EVP of Sales, Fleet Management, • Has served
as EVP of Corporate Development • Has served as EVP of Environmental, Health & • Senior leader in various lending financial and Engineering since 2019 since joining Kodiak in 2016 Safety since joining Kodiak in February 2021
institutions spanning 18 years, most notably CIT Group and Bank of America, with 4 years • Prior to 2019, held various roles in operations• Previously CEO at Themis Capital Corporation • Previously served 15+ years leading EH&S
and CFO of Enerven Compression teams for Royal Dutch Shell dedicated to companies in the energy sector • Previous roles at CDM Resource Management in • Significant experience in public accounting firms the Fleet Management and
Engineering • Held senior roles at SunTrust Robinson such as KPMG and Arthur Andersen department Humphrey, CIT Energy and PNC 9-member Board that is 56% diverse and is comprised of CEO and 8 independent directors (which includes 2 EQT
representatives) Source: Kodiak Management KODIAK GAS SERVICES J a n u a r y 2 0 2 4 I n v e s t o r P r e s e n t a t i o n | 38

Financial Summary
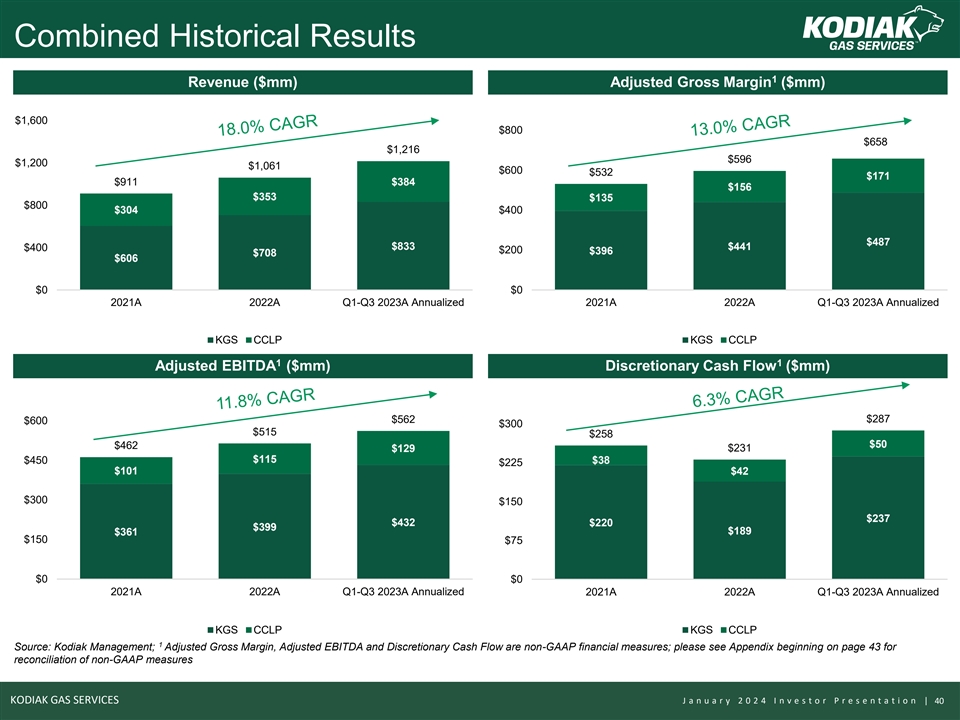
Combined Historical Results 1 Revenue ($mm) Adjusted Gross Margin ($mm)
$1,600 $800 $658 $1,216 $596 $1,200 $1,061 $600 $532 $171 $911 $384 $156 $353 $135 $800 $304 $400 $487 $400 $833 $441 $200 $396 $708 $606 $0 $0 2021A 2022A Q1-Q3 2023A Annualized 2021A 2022A Q1-Q3 2023A Annualized KGS CCLP KGS CCLP 1 1 Adjusted
EBITDA ($mm) Discretionary Cash Flow ($mm) $562 $287 $600 $300 $515 $258 $50 $462 $129 $231 $115 $450 $38 $225 $101 $42 $300 $150 $237 $432 $220 $399 $189 $361 $150 $75 $0 $0 2021A 2022A Q1-Q3 2023A Annualized 2021A 2022A Q1-Q3 2023A Annualized KGS
CCLP KGS CCLP 1 Source: Kodiak Management; Adjusted Gross Margin, Adjusted EBITDA and Discretionary Cash Flow are non-GAAP financial measures; please see Appendix beginning on page 43 for reconciliation of non-GAAP measures KODIAK GAS SERVICES J a n
u a r y 2 0 2 4 I n v e s t o r P r e s e n t a t i o n | 40
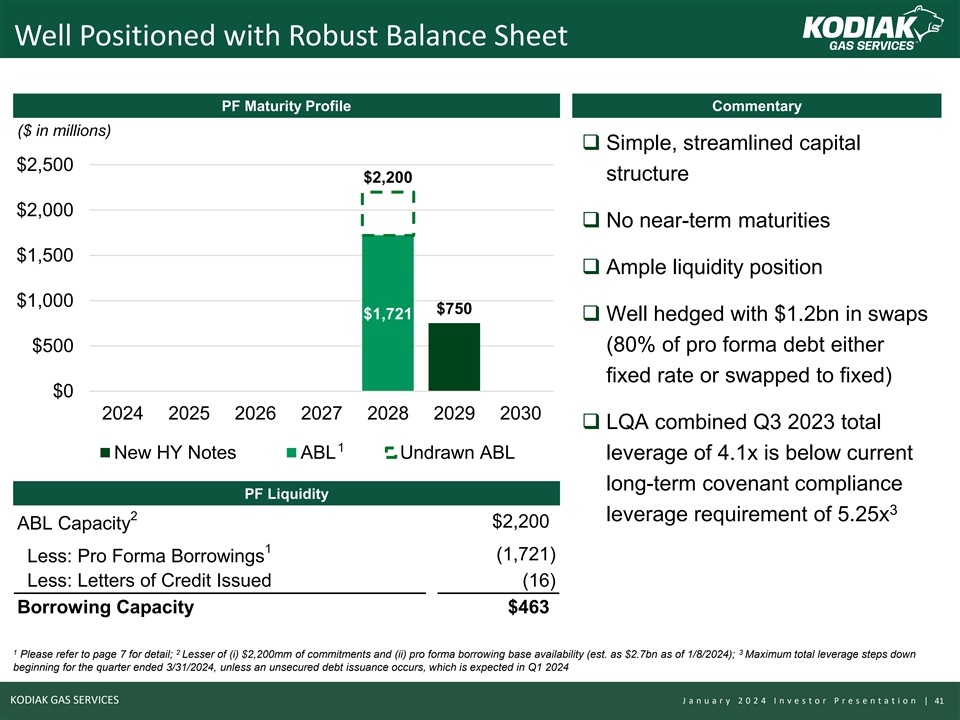
Well Positioned with Robust Balance Sheet PF Maturity Profile
Commentary ($ in millions) ❑ Simple, streamlined capital $2,500 structure $2,200 $2,000 ❑ No near-term maturities $1,500 ❑ Ample liquidity position $1,000 $750 $1,721 ❑ Well hedged with $1.2bn in swaps $500 (80% of pro
forma debt either fixed rate or swapped to fixed) $0 2024 2025 2026 2027 2028 2029 2030 ❑ LQA combined Q3 2023 total 1 New HY Notes ABL Undrawn ABL leverage of 4.1x is below current long-term covenant compliance PF Liquidity 3 2 leverage
requirement of 5.25x $2,200 ABL Capacity 1 (1,721) Less: Pro Forma Borrowings Less: Letters of Credit Issued (16) Borrowing Capacity $463 1 2 3 Please refer to page 7 for detail; Lesser of (i) $2,200mm of commitments and (ii) pro forma borrowing
base availability (est. as $2.7bn as of 1/8/2024); Maximum total leverage steps down beginning for the quarter ended 3/31/2024, unless an unsecured debt issuance occurs, which is expected in Q1 2024 KODIAK GAS SERVICES J a n u a r y 2 0 2 4 I n v e
s t o r P r e s e n t a t i o n | 41

Appendix
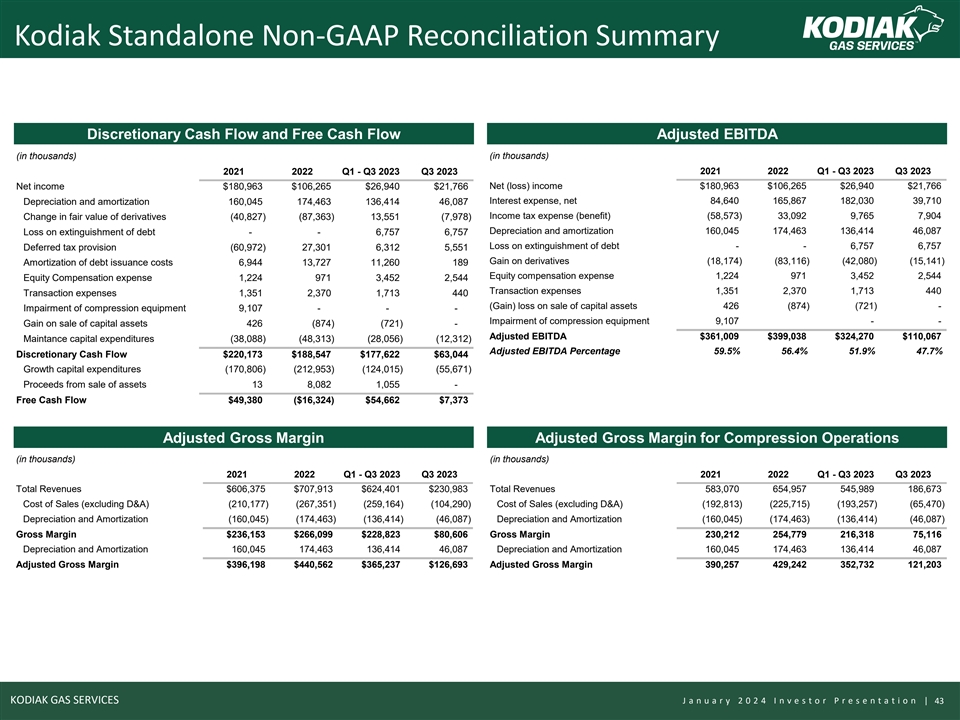
Kodiak Standalone Non-GAAP Reconciliation Summary Discretionary Cash
Flow and Free Cash Flow Adjusted EBITDA (in thousands) (in thousands) 2021 2022 Q1 - Q3 2023 Q3 2023 2021 2022 Q1 - Q3 2023 Q3 2023 Net income $180,963 $106,265 $26,940 $21,766 Net (loss) income $180,963 $106,265 $26,940 $21,766 Interest expense,
net 84,640 165,867 182,030 39,710 Depreciation and amortization 160,045 174,463 136,414 46,087 Income tax expense (benefit) (58,573) 33,092 9,765 7,904 Change in fair value of derivatives ( 40,827) ( 87,363) 13,551 ( 7,978) Depreciation and
amortization 160,045 174,463 136,414 46,087 Loss on extinguishment of debt - - 6,757 6,757 Loss on extinguishment of debt - - 6,757 6,757 Deferred tax provision ( 60,972) 27,301 6,312 5,551 Gain on derivatives (18,174) (83,116) (42,080) (15,141)
Amortization of debt issuance costs 6,944 13,727 11,260 189 Equity compensation expense 1,224 971 3,452 2,544 Equity Compensation expense 1,224 971 3,452 2,544 Transaction expenses 1,351 2,370 1,713 440 Transaction expenses 1,351 2,370 1,713 440
(Gain) loss on sale of capital assets 426 (874) (721) - Impairment of compression equipment 9,107 - - - Impairment of compression equipment 9,107 - - Gain on sale of capital assets 426 ( 874) ( 721) - Adjusted EBITDA $361,009 $399,038 $324,270
$110,067 Maintance capital expenditures ( 38,088) ( 48,313) ( 28,056) ( 12,312) Adjusted EBITDA Percentage 59.5% 56.4% 51.9% 47.7% Discretionary Cash Flow $220,173 $188,547 $177,622 $63,044 Growth capital expenditures ( 170,806) ( 212,953) (
124,015) ( 55,671) Proceeds from sale of assets 13 8,082 1,055 - Free Cash Flow $49,380 ($16,324) $54,662 $7,373 Adjusted Gross Margin Adjusted Gross Margin for Compression Operations (in thousands) (in thousands) 2021 2022 Q1 - Q3 2023 Q3 2023 2021
2022 Q1 - Q3 2023 Q3 2023 Total Revenues $606,375 $707,913 $624,401 $230,983 Total Revenues 583,070 654,957 545,989 186,673 Cost of Sales (excluding D&A) (210,177) (267,351) (259,164) (104,290) Cost of Sales (excluding D&A) ( 192,813) (
225,715) ( 193,257) ( 65,470) Depreciation and Amortization (160,045) (174,463) (136,414) (46,087) Depreciation and Amortization ( 160,045) ( 174,463) ( 136,414) ( 46,087) Gross Margin $236,153 $266,099 $228,823 $80,606 Gross Margin 230,212 254,779
216,318 75,116 Depreciation and Amortization 160,045 174,463 136,414 46,087 Depreciation and Amortization 160,045 174,463 136,414 46,087 Adjusted Gross Margin $396,198 $440,562 $365,237 $126,693 Adjusted Gross Margin 390,257 429,242 352,732 121,203
KODIAK GAS SERVICES J a n u a r y 2 0 2 4 I n v e s t o r P r e s e n t a t i o n | 43
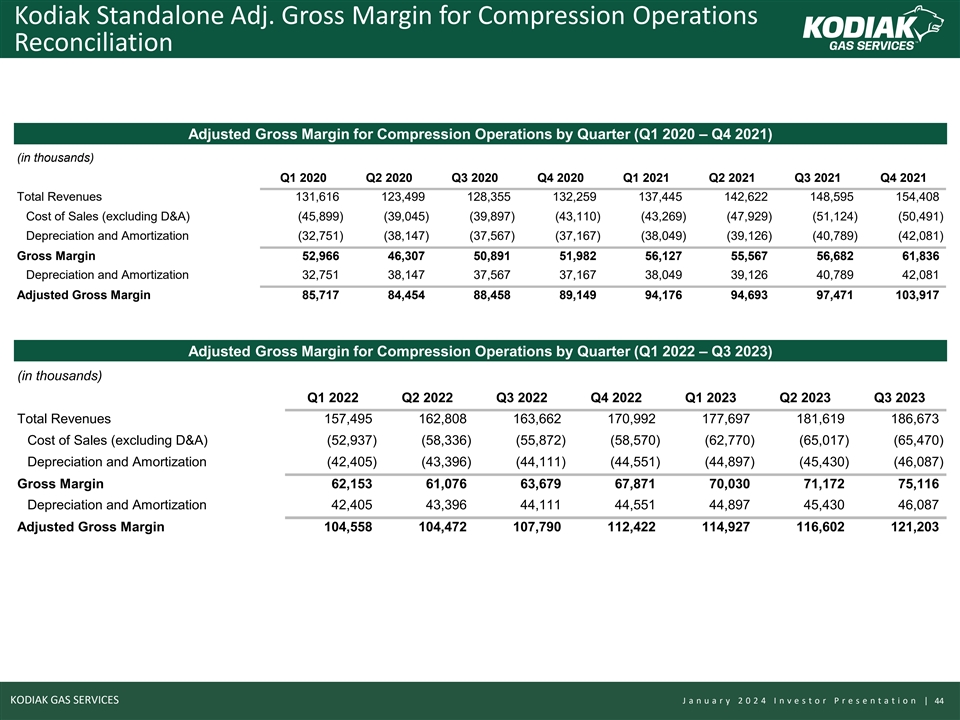
Kodiak Standalone Adj. Gross Margin for Compression Operations
Reconciliation Adjusted Gross Margin for Compression Operations by Quarter (Q1 2020 – Q4 2021) (in thousands) Q1 2020 Q2 2020 Q3 2020 Q4 2020 Q1 2021 Q2 2021 Q3 2021 Q4 2021 Total Revenues 131,616 123,499 128,355 132,259 137,445 142,622
148,595 154,408 Cost of Sales (excluding D&A) (45,899) (39,045) (39,897) (43,110) (43,269) (47,929) (51,124) (50,491) Depreciation and Amortization (32,751) (38,147) (37,567) (37,167) (38,049) (39,126) (40,789) (42,081) Gross Margin 52,966
46,307 50,891 51,982 56,127 55,567 56,682 61,836 Depreciation and Amortization 32,751 38,147 37,567 37,167 38,049 39,126 40,789 42,081 Adjusted Gross Margin 85,717 84,454 88,458 89,149 94,176 94,693 97,471 103,917 Adjusted Gross Margin for
Compression Operations by Quarter (Q1 2022 – Q3 2023) (in thousands) Q1 2022 Q2 2022 Q3 2022 Q4 2022 Q1 2023 Q2 2023 Q3 2023 Total Revenues 157,495 162,808 163,662 170,992 177,697 181,619 186,673 Cost of Sales (excluding D&A) (52,937)
(58,336) (55,872) (58,570) (62,770) (65,017) (65,470) Depreciation and Amortization (42,405) (43,396) (44,111) (44,551) (44,897) (45,430) (46,087) Gross Margin 62,153 61,076 63,679 67,871 70,030 71,172 75,116 Depreciation and Amortization 42,405
43,396 44,111 44,551 44,897 45,430 46,087 Adjusted Gross Margin 104,558 104,472 107,790 112,422 114,927 116,602 121,203 KODIAK GAS SERVICES J a n u a r y 2 0 2 4 I n v e s t o r P r e s e n t a t i o n | 44
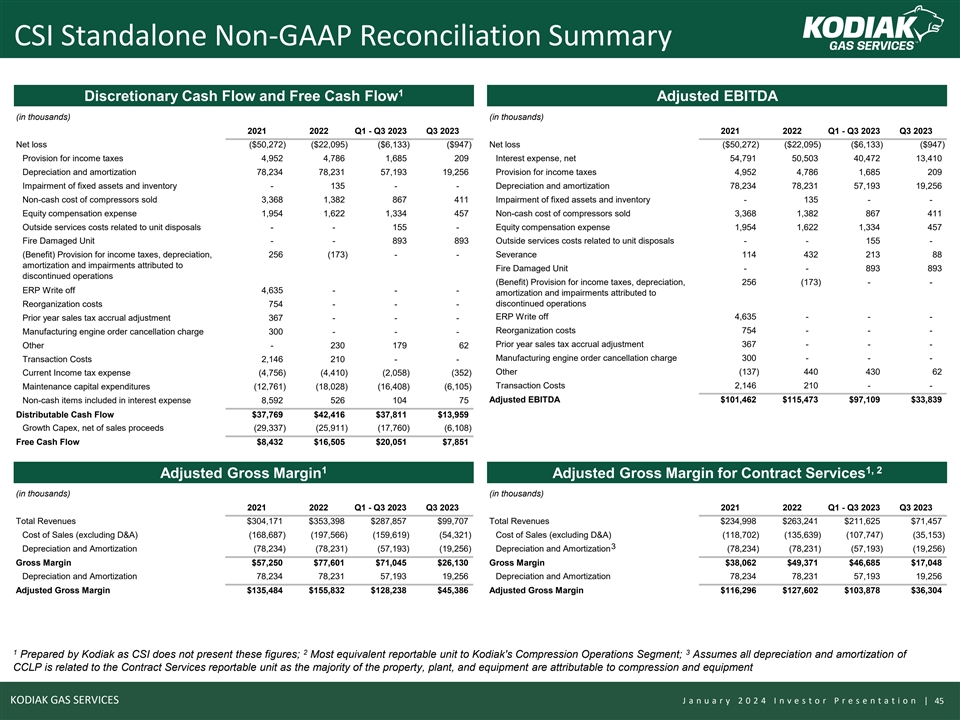
CSI Standalone Non-GAAP Reconciliation Summary 1 Discretionary Cash
Flow and Free Cash Flow Adjusted EBITDA (in thousands) (in thousands) 2021 2022 Q1 - Q3 2023 Q3 2023 2021 2022 Q1 - Q3 2023 Q3 2023 Net loss ($50,272) ($22,095) ($6,133) ($947) Net loss ($50,272) ($22,095) ($6,133) ($947) Provision for income taxes
4,952 4,786 1,685 209 Interest expense, net 54,791 50,503 40,472 13,410 Depreciation and amortization 78,234 78,231 57,193 19,256 Provision for income taxes 4,952 4,786 1,685 209 Impairment of fixed assets and inventory - 135 - - Depreciation and
amortization 78,234 78,231 57,193 19,256 Non-cash cost of compressors sold 3,368 1,382 867 411 Impairment of fixed assets and inventory - 135 - - Equity compensation expense 1,954 1,622 1,334 457 Non-cash cost of compressors sold 3,368 1,382 867 411
Outside services costs related to unit disposals - - 155 - Equity compensation expense 1,954 1,622 1,334 457 Fire Damaged Unit - - 893 893 Outside services costs related to unit disposals - - 155 - (Benefit) Provision for income taxes, depreciation,
256 ( 173) - - Severance 114 432 213 88 amortization and impairments attributed to Fire Damaged Unit - - 893 893 discontinued operations (Benefit) Provision for income taxes, depreciation, 256 ( 173) - - ERP Write off 4,635 - - - amortization and
impairments attributed to Reorganization costs 754 - - - discontinued operations ERP Write off 4,635 - - - Prior year sales tax accrual adjustment 367 - - - Reorganization costs 754 - - - Manufacturing engine order cancellation charge 300 - - -
Prior year sales tax accrual adjustment 367 - - - Other - 230 179 62 Manufacturing engine order cancellation charge 300 - - - Transaction Costs 2,146 210 - - Other ( 137) 440 430 62 Current Income tax expense ( 4,756) ( 4,410) ( 2,058) ( 352)
Transaction Costs 2,146 210 - - Maintenance capital expenditures ( 12,761) ( 18,028) ( 16,408) ( 6,105) Adjusted EBITDA $101,462 $115,473 $97,109 $33,839 Non-cash items included in interest expense 8,592 526 104 75 Distributable Cash Flow $37,769
$42,416 $37,811 $13,959 Growth Capex, net of sales proceeds ( 29,337) ( 25,911) ( 17,760) ( 6,108) Free Cash Flow $8,432 $16,505 $20,051 $7,851 1 1, 2 Adjusted Gross Margin Adjusted Gross Margin for Contract Services (in thousands) (in thousands)
2021 2022 Q1 - Q3 2023 Q3 2023 2021 2022 Q1 - Q3 2023 Q3 2023 Total Revenues $304,171 $353,398 $287,857 $99,707 Total Revenues $234,998 $263,241 $211,625 $71,457 Cost of Sales (excluding D&A) ( 168,687) ( 197,566) ( 159,619) ( 54,321) Cost of
Sales (excluding D&A) ( 118,702) ( 135,639) ( 107,747) ( 35,153) 3 Depreciation and Amortization ( 78,234) ( 78,231) ( 57,193) ( 19,256) Depreciation and Amortization ( 78,234) ( 78,231) ( 57,193) ( 19,256) Gross Margin $57,250 $77,601 $71,045
$26,130 Gross Margin $38,062 $49,371 $46,685 $17,048 Depreciation and Amortization 78,234 78,231 57,193 19,256 Depreciation and Amortization 78,234 78,231 57,193 19,256 Adjusted Gross Margin $135,484 $155,832 $128,238 $45,386 Adjusted Gross Margin
$116,296 $127,602 $103,878 $36,304 1 2 3 Prepared by Kodiak as CSI does not present these figures; Most equivalent reportable unit to Kodiak's Compression Operations Segment; Assumes all depreciation and amortization of CCLP is related to the
Contract Services reportable unit as the majority of the property, plant, and equipment are attributable to compression and equipment KODIAK GAS SERVICES J a n u a r y 2 0 2 4 I n v e s t o r P r e s e n t a t i o n | 45
v3.24.0.1
| X |
- DefinitionBoolean flag that is true when the XBRL content amends previously-filed or accepted submission.
| Name: |
dei_AmendmentFlag |
| Namespace Prefix: |
dei_ |
| Data Type: |
xbrli:booleanItemType |
| Balance Type: |
na |
| Period Type: |
duration |
|
| X |
- DefinitionFor the EDGAR submission types of Form 8-K: the date of the report, the date of the earliest event reported; for the EDGAR submission types of Form N-1A: the filing date; for all other submission types: the end of the reporting or transition period. The format of the date is YYYY-MM-DD.
| Name: |
dei_DocumentPeriodEndDate |
| Namespace Prefix: |
dei_ |
| Data Type: |
xbrli:dateItemType |
| Balance Type: |
na |
| Period Type: |
duration |
|
| X |
- DefinitionThe type of document being provided (such as 10-K, 10-Q, 485BPOS, etc). The document type is limited to the same value as the supporting SEC submission type, or the word 'Other'.
| Name: |
dei_DocumentType |
| Namespace Prefix: |
dei_ |
| Data Type: |
dei:submissionTypeItemType |
| Balance Type: |
na |
| Period Type: |
duration |
|
| X |
- DefinitionAddress Line 1 such as Attn, Building Name, Street Name
| Name: |
dei_EntityAddressAddressLine1 |
| Namespace Prefix: |
dei_ |
| Data Type: |
xbrli:normalizedStringItemType |
| Balance Type: |
na |
| Period Type: |
duration |
|
| X |
- DefinitionAddress Line 2 such as Street or Suite number
| Name: |
dei_EntityAddressAddressLine2 |
| Namespace Prefix: |
dei_ |
| Data Type: |
xbrli:normalizedStringItemType |
| Balance Type: |
na |
| Period Type: |
duration |
|
| X |
- Definition
+ References
+ Details
| Name: |
dei_EntityAddressCityOrTown |
| Namespace Prefix: |
dei_ |
| Data Type: |
xbrli:normalizedStringItemType |
| Balance Type: |
na |
| Period Type: |
duration |
|
| X |
- DefinitionCode for the postal or zip code
| Name: |
dei_EntityAddressPostalZipCode |
| Namespace Prefix: |
dei_ |
| Data Type: |
xbrli:normalizedStringItemType |
| Balance Type: |
na |
| Period Type: |
duration |
|
| X |
- DefinitionName of the state or province.
| Name: |
dei_EntityAddressStateOrProvince |
| Namespace Prefix: |
dei_ |
| Data Type: |
dei:stateOrProvinceItemType |
| Balance Type: |
na |
| Period Type: |
duration |
|
| X |
- DefinitionA unique 10-digit SEC-issued value to identify entities that have filed disclosures with the SEC. It is commonly abbreviated as CIK. Reference 1: http://www.xbrl.org/2003/role/presentationRef
-Publisher SEC
-Name Exchange Act
-Number 240
-Section 12
-Subsection b-2
| Name: |
dei_EntityCentralIndexKey |
| Namespace Prefix: |
dei_ |
| Data Type: |
dei:centralIndexKeyItemType |
| Balance Type: |
na |
| Period Type: |
duration |
|
| X |
- DefinitionIndicate if registrant meets the emerging growth company criteria. Reference 1: http://www.xbrl.org/2003/role/presentationRef
-Publisher SEC
-Name Exchange Act
-Number 240
-Section 12
-Subsection b-2
| Name: |
dei_EntityEmergingGrowthCompany |
| Namespace Prefix: |
dei_ |
| Data Type: |
xbrli:booleanItemType |
| Balance Type: |
na |
| Period Type: |
duration |
|
| X |
- DefinitionCommission file number. The field allows up to 17 characters. The prefix may contain 1-3 digits, the sequence number may contain 1-8 digits, the optional suffix may contain 1-4 characters, and the fields are separated with a hyphen.
| Name: |
dei_EntityFileNumber |
| Namespace Prefix: |
dei_ |
| Data Type: |
dei:fileNumberItemType |
| Balance Type: |
na |
| Period Type: |
duration |
|
| X |
- DefinitionTwo-character EDGAR code representing the state or country of incorporation.
| Name: |
dei_EntityIncorporationStateCountryCode |
| Namespace Prefix: |
dei_ |
| Data Type: |
dei:edgarStateCountryItemType |
| Balance Type: |
na |
| Period Type: |
duration |
|
| X |
- DefinitionThe exact name of the entity filing the report as specified in its charter, which is required by forms filed with the SEC. Reference 1: http://www.xbrl.org/2003/role/presentationRef
-Publisher SEC
-Name Exchange Act
-Number 240
-Section 12
-Subsection b-2
| Name: |
dei_EntityRegistrantName |
| Namespace Prefix: |
dei_ |
| Data Type: |
xbrli:normalizedStringItemType |
| Balance Type: |
na |
| Period Type: |
duration |
|
| X |
- DefinitionThe Tax Identification Number (TIN), also known as an Employer Identification Number (EIN), is a unique 9-digit value assigned by the IRS. Reference 1: http://www.xbrl.org/2003/role/presentationRef
-Publisher SEC
-Name Exchange Act
-Number 240
-Section 12
-Subsection b-2
| Name: |
dei_EntityTaxIdentificationNumber |
| Namespace Prefix: |
dei_ |
| Data Type: |
dei:employerIdItemType |
| Balance Type: |
na |
| Period Type: |
duration |
|
| X |
- DefinitionLocal phone number for entity.
| Name: |
dei_LocalPhoneNumber |
| Namespace Prefix: |
dei_ |
| Data Type: |
xbrli:normalizedStringItemType |
| Balance Type: |
na |
| Period Type: |
duration |
|
| X |
- DefinitionBoolean flag that is true when the Form 8-K filing is intended to satisfy the filing obligation of the registrant as pre-commencement communications pursuant to Rule 13e-4(c) under the Exchange Act. Reference 1: http://www.xbrl.org/2003/role/presentationRef
-Publisher SEC
-Name Exchange Act
-Number 240
-Section 13e
-Subsection 4c
| Name: |
dei_PreCommencementIssuerTenderOffer |
| Namespace Prefix: |
dei_ |
| Data Type: |
xbrli:booleanItemType |
| Balance Type: |
na |
| Period Type: |
duration |
|
| X |
- DefinitionBoolean flag that is true when the Form 8-K filing is intended to satisfy the filing obligation of the registrant as pre-commencement communications pursuant to Rule 14d-2(b) under the Exchange Act. Reference 1: http://www.xbrl.org/2003/role/presentationRef
-Publisher SEC
-Name Exchange Act
-Number 240
-Section 14d
-Subsection 2b
| Name: |
dei_PreCommencementTenderOffer |
| Namespace Prefix: |
dei_ |
| Data Type: |
xbrli:booleanItemType |
| Balance Type: |
na |
| Period Type: |
duration |
|
| X |
- DefinitionTitle of a 12(b) registered security. Reference 1: http://www.xbrl.org/2003/role/presentationRef
-Publisher SEC
-Name Exchange Act
-Number 240
-Section 12
-Subsection b
| Name: |
dei_Security12bTitle |
| Namespace Prefix: |
dei_ |
| Data Type: |
dei:securityTitleItemType |
| Balance Type: |
na |
| Period Type: |
duration |
|
| X |
- DefinitionName of the Exchange on which a security is registered. Reference 1: http://www.xbrl.org/2003/role/presentationRef
-Publisher SEC
-Name Exchange Act
-Number 240
-Section 12
-Subsection d1-1
| Name: |
dei_SecurityExchangeName |
| Namespace Prefix: |
dei_ |
| Data Type: |
dei:edgarExchangeCodeItemType |
| Balance Type: |
na |
| Period Type: |
duration |
|
| X |
- DefinitionBoolean flag that is true when the Form 8-K filing is intended to satisfy the filing obligation of the registrant as soliciting material pursuant to Rule 14a-12 under the Exchange Act. Reference 1: http://www.xbrl.org/2003/role/presentationRef
-Publisher SEC
-Name Exchange Act
-Section 14a
-Number 240
-Subsection 12
| Name: |
dei_SolicitingMaterial |
| Namespace Prefix: |
dei_ |
| Data Type: |
xbrli:booleanItemType |
| Balance Type: |
na |
| Period Type: |
duration |
|
| X |
- DefinitionTrading symbol of an instrument as listed on an exchange.
| Name: |
dei_TradingSymbol |
| Namespace Prefix: |
dei_ |
| Data Type: |
dei:tradingSymbolItemType |
| Balance Type: |
na |
| Period Type: |
duration |
|
| X |
- DefinitionBoolean flag that is true when the Form 8-K filing is intended to satisfy the filing obligation of the registrant as written communications pursuant to Rule 425 under the Securities Act. Reference 1: http://www.xbrl.org/2003/role/presentationRef
-Publisher SEC
-Name Securities Act
-Number 230
-Section 425
| Name: |
dei_WrittenCommunications |
| Namespace Prefix: |
dei_ |
| Data Type: |
xbrli:booleanItemType |
| Balance Type: |
na |
| Period Type: |
duration |
|
Kodiak Gas Services (NYSE:KGS)
과거 데이터 주식 차트
부터 4월(4) 2024 으로 5월(5) 2024

Kodiak Gas Services (NYSE:KGS)
과거 데이터 주식 차트
부터 5월(5) 2023 으로 5월(5) 2024
