false
0001526113
0001526113
2023-11-07
2023-11-07
0001526113
us-gaap:CommonStockMember
2023-11-07
2023-11-07
0001526113
us-gaap:SeriesAPreferredStockMember
2023-11-07
2023-11-07
0001526113
us-gaap:SeriesBPreferredStockMember
2023-11-07
2023-11-07
0001526113
us-gaap:SeriesDPreferredStockMember
2023-11-07
2023-11-07
0001526113
us-gaap:SeriesEPreferredStockMember
2023-11-07
2023-11-07
iso4217:USD
xbrli:shares
iso4217:USD
xbrli:shares
UNITED STATES
SECURITIES AND EXCHANGE COMMISSION
WASHINGTON, D.C. 20549
FORM 8-K
CURRENT REPORT
PURSUANT TO SECTION 13 OR 15(d) OF THE
SECURITIES EXCHANGE ACT OF 1934
Date of Report (Date of earliest event reported):
November 7, 2023
Global Net Lease, Inc.
(Exact Name of Registrant as Specified in Charter)
| Maryland |
|
001-37390 |
|
45-2771978 |
|
(State or other jurisdiction
of incorporation) |
|
(Commission File Number) |
|
(I.R.S. Employer
Identification No.) |
| 650 Fifth Avenue, 30th Floor |
| New York, New York 10019 |
| (Address, including zip code, of Principal Executive Offices) |
Registrant’s telephone number,
including area code: (212) 415-6500
Check the appropriate box below if the Form 8-K filing is intended
to simultaneously satisfy the filing obligation of the registrant under any of the following provisions:
| ¨ |
Written communications pursuant to Rule 425 under the Securities Act (17 CFR 230.425) |
| |
|
| ¨ |
Soliciting material pursuant to Rule 14a-12 under the Exchange Act (17 CFR 240.14a-12) |
| |
|
| ¨ |
Pre-commencement communications pursuant to Rule 14d-2(b) under the Exchange Act (17 CFR 240.14d-2(b)) |
| |
|
| ¨ |
Pre-commencement communications pursuant to Rule 13e-4(c) under the Exchange Act (17 CFR 240.13e-4(c)) |
Securities registered pursuant to section 12(b) of the Act:
| Title of each class |
|
Trading
Symbols |
|
Name of each exchange on
which
registered |
| Common
Stock, $0.01 par value per share |
|
GNL |
|
New York Stock Exchange |
| 7.25%
Series A Cumulative Redeemable Preferred Stock, $0.01 par value per share |
|
GNL PR A |
|
New York Stock Exchange |
| 6.875%
Series B Cumulative Redeemable Perpetual Preferred Stock, $0.01 par value per share |
|
GNL PR B |
|
New York Stock Exchange |
| 7.50% Series D Cumulative Redeemable Perpetual Preferred Stock, $0.01 par value per share |
|
GNL PR D |
|
New York Stock Exchange |
| 7.375% Series E Cumulative Redeemable Perpetual Preferred Stock, $0.01 par value per share |
|
GNL PR E |
|
New York Stock Exchange |
Indicate
by check mark whether the registrant is an emerging growth company as defined in Rule 405 of the Securities Act of 1933 (§230.405
of this chapter) or Rule 12b-2 of the Securities Exchange Act of 1934 (§240.12b-2 of this chapter).
Emerging growth company ¨
If
an emerging growth company, indicate by check mark if the registrant has elected not to use the extended transition period for
complying with any new or revised financial accounting standards provided pursuant to Section 13(a) of the Exchange Act. ¨
Item 7.01. Regulation FD Disclosure.
Investor Presentation
On November 7, 2023, Global Net Lease, Inc. (the
“Company”) prepared an investor presentation that officers and other representatives of the Company intend to present at conferences
and meetings. A copy of the investor presentation is furnished as Exhibit 99.1 of this Current Report on Form 8-K. The information set
forth in Item 7.01 of this Current Report on Form 8-K and in the attached Exhibit 99.1 is deemed to be “furnished” and shall
not be deemed to be “filed” for purposes of Section 18 of the Securities Exchange Act of 1934, as amended (the “Exchange
Act”), or otherwise subject to the liabilities of that Section. The information set forth in Item 7.01 of this Current Report on
Form 8-K, including Exhibit 99.1, shall not be deemed incorporated by reference into any filing under the Exchange Act or the Securities
Act of 1933, as amended, regardless of any general incorporation language in such filing.
The statements in this current report on Form
8-K that are not historical facts may be forward-looking statements. These forward-looking statements involve risks and uncertainties
that could cause the outcome to be materially different. The words such as "may," "will," "seeks," "anticipates,"
"believes," "expects," "estimates," "projects," "plans," "intends," "should"
and similar expressions are intended to identify forward-looking statements, although not all forward-looking statements contain these
identifying words. These forward-looking statements are subject to a number of risks, uncertainties and other factors, many of which are
outside of GNL's control, which could cause actual results to differ materially from the results contemplated by the forward-looking statements.
These risks and uncertainties include the risks associated with the recently completed merger with The Necessity Retail REIT, Inc. and
the internalization of GNL's property management and advisory functions; the geopolitical instability due to the ongoing military conflict
between Russia and Ukraine and Israel and Hamas, including related sanctions and other penalties imposed by the U.S. and European Union,
and the related impact on GNL, GNL's tenants and the global economy and financial markets; that any potential future acquisition by GNL
is subject to market conditions and capital availability and may not be identified or completed on favorable terms, or at all; and those
risks and uncertainties set forth in the Risk Factors section of GNL's most recent Annual Report on Form 10-K for the year ended December
31, 2022, its Quarterly Reports on Form 10-Q for the fiscal quarters ended March 31, 2023 and June 30, 2023, and its Current Report on
Form 8-K filed on September 18, 2023, and all other filings with the Securities and Exchange Commission after that date, as such risks,
uncertainties and other important factors may be updated from time to time in GNL's subsequent reports. Further, forward-looking statements
speak only as of the date they are made, and GNL undertakes no obligation to update or revise any forward-looking statement to reflect
changed assumptions, the occurrence of unanticipated events or changes to future operating results over time, unless required by law.
Item 9.01. Financial Statements and Exhibits.
| Exhibit No |
|
Description |
| 99.1 |
|
Investor Presentation |
| 104 |
|
Cover Page Interactive Data File - the cover page XBRL tags are embedded within the Inline XBRL document. |
SIGNATURES
Pursuant to the requirements of the Securities
Exchange Act of 1934, the registrant has duly caused this report to be signed on its behalf by the undersigned hereunto duly authorized.
| |
GLOBAL NET LEASE, INC. |
| |
|
|
| Date: November 7, 2023 |
By: |
/s/ James L. Nelson |
| |
|
Name: James L. Nelson |
| |
|
Title: Co-Chief Executive Officer and President
(Co-Principal Executive Officer) |
Exhibit 99.1

Global Net Lease Third Quarter 2023 Investor Presentation Pictured – McLaren Campus in Woking, U.K.

FORWARD LOOKING STATEMENTS 1 This presentation does not constitute an offer to sell or a solicitation of an offer to purchase any securities of Global Net Lease, Inc. (“We” or the “Company”). Any offer or sale of securities will be made only by means of a prospectus and related documentation meeting the requirements of the Securities Act of 1933, as amended, and no offer to sell or solicitation of an offer to buy shall be made in any jurisdiction in which such offer, solicitation or sale would be unlawful. This presentation contains statements that are not historical facts and may be forward - looking statements, including statements regarding the intent, belief or current expectations of us, our operating partnership and members of our management team, as well as the assumptions on which such statements are based, and generally are identified by the use of words such as “may,” “will,” “seeks,” “anticipates,” “believes,” “estimates,” “projects,” “potential,” “predicts,” “expects,” “plans,” “intends,” “would,” “could,” “should” or similar expressions are intended to identify forward - looking statements, although not all forward - looking statements contain these identifying words. Actual results may differ materially from those contemplated by such forward - looking statements. Further, forward - looking statements speak only as of the date they are made, and we undertake no obligation to update or revise forward - looking statements to reflect changed assumptions, the occurrence of unanticipated events or changes to future operating results over time, unless required by law. These forward - looking statements are subject to risks, uncertainties, and other factors, many of which are outside of our control, which could cause actual results to differ materially from the results contemplated by the forward - looking statements. These risks and uncertainties include the risks associated with the recently completed merger with The Necessity Retail REIT, Inc. (“RTL”) and the internalization of our property management and advisory functions; the geopolitical instability due to the ongoing military conflict between Russia and Ukraine and Israel and Hamas, including related sanctions and other penalties imposed by the U.S. and European Union, and the related impact on us, our tenants and the global economy and financial markets; that any potential future acquisition by the Company is subject to market conditions and capital availability and may not be identified or completed on favorable terms, or at all. Some of the risks and uncertainties, although not all risks and uncertainties, that could cause our actual results to differ materially from those presented in our forward - looking statements are set forth under “Risk Factors” and “Quantitative and Qualitative Disclosures about Market Risk” in our Annual Report on Form 10 - K for the year ended December 31, 2022, this and our other Quarterly Reports on Form 10 - Q and our other filings with the U.S Securities and Exchange Commission (“SEC”) as such risks, uncertainties and other important factors may be updated from time to time in our subsequent reports. Further, forward - looking statements speak only as of the date they are made, and we undertake no obligation to update or revise any forward - looking statement to reflect changed assumptions, the occurrence of unanticipated events or changes to future operating results over time, unless required by law.

This presentation also includes estimated projections of future operating results. These projections are not prepared in accordance with published guidelines of the SEC or the guidelines established by the American Institute of Certified Public Accountants for preparation and presentation of financial projections. This information is not fact and should not be relied upon as being necessarily indicative of future results; the projections were prepared in good faith by management and are based on numerous assumptions that may prove to be wrong. All such statements, including but not limited to estimates of value accretion, synergies, run - rate or annualized figures and results of future operations after making adjustments to give effect to assumed future operations reflect assumptions as to certain business decisions and events that are subject to change. As a result, actual results may differ materially from those contained in the estimates. Accordingly, there can be no assurance that the estimates will be realized, or that the projections described in this presentation will be realized at all. This presentation also contains estimates and information concerning our industry and tenants, including market position, market size and growth rates of the markets in which we operate, that are based on industry publications and other third - party reports. This information involves a number of assumptions and limitations, and you are cautioned not to give undue weight to these estimates. We have not independently verified the accuracy or completeness of the data contained in these publications and reports. The industry in which we operate is subject to a high degree of uncertainty and risk due to a variety of factors, including those described in the “Risk Factors” and “Management’s Discussion and Analysis of Financial Condition and Results of Operations” sections of the Company’s Annual Report on Form 10 - K for the year ended December 31, 2022 filed with the SEC on February 23, 2023, and all other filings with the SEC after that date, as such risks, uncertainties and other important factors may be updated from time to time in the Company’s subsequent reports. Credit Ratings A securities rating is not a recommendation to buy, sell or hold securities and may be subject to revision or withdrawal at any time. Each rating agency has its own methodology of assigning ratings and, accordingly, each rating should be evaluated independently of any other rating. P R OJECTIONS 2

GLOBAL NET LEASE 3 Quality of Earnings GNL’s diversified net - lease portfolio includes 58% of investment - grade tenants, underpinning the stability and high - quality of its rental income Substantial Synergies GNL has already captured $56 million of annualized synergies from the previously disclosed $75 million, exceeding the initial estimate by $2 million (4) ; balance is expected to be completed by Q3 2024 Growth Prospects GNL executed on organic growth through its asset management platform, including increased occupancy, 5% renewal spreads and average annual rent increase of 1.3% across the portfolio Undervalued Relative to Peers GNL, now an internally managed REIT, is expected to trade to its peer average AFFO multiple given the quality of income and superior investment - grade worthy tenants in our portfolio (2)(3) Global Presence GNL’s global presence and diversified portfolio gives the Company the flexibility to pivot and take advantage of accretive opportunities in the US or abroad Proactive Asset Management GNL continues to successfully demonstrate strong asset management capabilities with increasing occupancy quarter - over - quarter, illustrating the high - quality of its assets Third largest publicly traded global net lease REIT with $9.2 billion of gross asset value (1) and the flexibility to invest in multiple markets and segments given its global presence and diversified portfolio 1. Defined as total assets plus accumulated depreciation and amortization as of September 30, 2023. 2. Please see Disclaimers at the back of this presentation for a definition of AFFO. While we consider AFFO a useful indicator of our performance, we do not consider AFFO as an alternative to net income (loss) or as a measure of liquidity. Furthermore, other REITs may define AFFO differently than we do. Projected AFFO per share data included in this presentation is for informational purposes only and should not be relied upon as indicative of future dividends or as a measure of future liquidity. 3. As used herein, Investment Grade includes both actual investment grade ratings of the tenant or guarantor, if available, or implied investment grade. Implied investment grade may include actual ratings of tenant parent, guarantor parent (regardless of whether or not the parent has guaranteed the tenant's obligation under the lease) or by using a proprietary Moody's analytical tool, which generates an implied rating by measuring a company's probability of default. The term "parent" for these purposes includes any entity, including any governmental entity, owning more than 50% of the voting stock in a tenant. Multi - tenant portfolio includes credit ratings for tenants who occupy 10,000 square feet or more. 4. $2.2 million in additional captured synergies reflects an incremental $114,000 of savings in GNL's General and Administrative expenses for the 19 - day period following the completion of the Merger and Internalization as compared to the previously anticipated General & Administrative expenses for such 19 - day period, annualized for a full fiscal year. Please see Projections disclaimers at the front of this presentation. There can be no assurance that projected synergies will be realized.

Earnings Summary ($mm) Q 3 ’ 2 3 Net Loss Attributable to Common Stockholders ( $142.5 ) NOI $104. 5 Cash NOI (7) $ 10 6.0 Core Funds from Operations (Core FFO) (7) $31.5 Adjusted Funds from Operations (AFFO )(7) $46. 9 Core Funds from Operations (Core FFO) per Share $0.24 Adjusted Funds from Operations (AFFO) per Share $0.36 Weighted Average Diluted Shares Outstanding 130.8 Q3 2023 $46.9 $42.0 AFFO (7) Common Stock Dividends THIRD QUARTER 2023 FINANCIAL HIGHLIGHTS liquidity. AFFO for the third quarter also contains a number of adjustments for items that the company believes were non - recurring, one - time items including adjustments for items that were settled in cash such as merger and proxy related expenses. 4 Key Capitalization Metrics ($mm) Q 3 ’ 2 3 Net Debt (3)(4) $5,20 7 Gross Asset Value (5) $9,18 8 Fixed Rate Debt 82.0% Liquidity (6) $31 9 Net Debt / Gross Asset Value 56.7% Debt Capitalization ($mm) Q 3 ’ 2 3 Total Secured Debt $2,7 3 0 3.75% Senior Notes $50 0 4.50% Senior Notes $50 0 Revolving Credit Facility $1,61 0 Total Unsecured Debt $2,610 Total Debt $5,3 4 0 Interest Coverage Ratio (1) 2.5x Weighted Average Interest Rate Cost (2) 4.7 % Third quarter financial results reflect 73 days of standalone pre - merger GNL and only 19 days of post - merger, internalized GNL and RTL results 1. The interest coverage ratio is calculated by dividing actual adjusted EBITDA for Q3 2023 by cash paid for interest (calculated based on the interest expense less non - cash portion of interest expense and amortization of mortgage (discount) premium, net). 2. The weighted average interest rate cost is based on the outstanding principal of the debt. 3. Represents total debt outstanding of $5.3 billion, less cash and cash equivalents of $133 million. 4. Excludes the effect of discounts and deferred financing costs, net. 5. Defined as total assets plus accumulated depreciation and amortization as of September 30, 2023. 6. Liquidity includes $186.0 million of availability under the credit facility and $133.4 million of cash and cash equivalents as of September 30, 2023. 7. Please see Disclaimers at the back of this presentation for a definition of Core FFO and AFFO. While we consider AFFO a useful indicator of our performance, we do not consider AFFO as an alternative to net income (loss) or as a measure of liquidity. Furthermore, other REITs may define AFFO differently than we do. Projected AFFO per share data included in this presentation is for informational purposes only and should not be relied upon as indicative of future dividends or as a measure of future

Category Estimated Annual Savings Description In te r n ali z ati o n Savings GNL recognized $ 56.2 (5) million in annualized cost savings compared to the $54 million estimated at transaction close ▪ Elimination of asset management fees, property management fees, incentive fees, equity issuance fees, and reimbursable expenses net of internalized employee compensation, rent and overhead, and retained 3 rd party services Merger Synergies Approximately $21 million run - rate realized over the next 12 months (2) ▪ Corporate consolidation, public company cost savings, and elimination of other duplicative services Net Savings Approximately $75 million (2) 1. Calculated using June 30, 2023 general and administrative (“G&A”) expense, annualized, divided by straight - line rent for GNL and annualized base rent for peers. GNL G&A represents estimated next twelve months G&A as of 09/30/2023E giving effect to the Merger and the Internalization. Please see Projection disclaimers at the front of this presentation. There can be no assurance that projected synergies will be realized. Please see Disclaimers at the front of this presentation for important information regarding as adjusted figures giving effect to the Merger and the Internalization. There can be no assurance that any of these projected synergies, value accretion estimates or combined future results of operations will be realized. Represents actual synergies recognized in Q3 2023 based on the 19 days in the quarter that were post merger. Represents the annualized amount of synergies based on the 19 days in the quarter that were post merger. $2.2 million in additional captured synergies reflects an incremental $114,000 of savings in GNL's General and Administrative expenses for the 19 - day period following the completion of the Merger and Internalization as compared to the previously anticipated General & 2. 3. 4. 5. SUBSTANTIAL MERGER SYNERGIES AND INTERNALIZATION SAVINGS G&A Operating Expense (1)(2) 4% 5% 6% 7% 7% 9% 9% 10% 11% 13% 15% 18% (2) Note: Balance sheets as of June 30, 2023, unless otherwise noted. Synergies Recognized in Q3 2023 (000’s) Elimination of RTL Asset Management Fee $1,591 Elimination of RTL Property Management Fee 483 Elimination of RTL Overhead Reimbursement 753 Elimination of GNL Asset Management Fee 1,629 Elimination of GNL Property Management Fee 271 Less: Internalized GNL G&A Overhead (1,799) Q3’23 Synergies Recognized (3) $2,927 Annualized Synergies (4) $56,229 Administrative expenses for such 19 - day period, annualized for a full fiscal year. Please see Projections disclaimers at the front of this presentation. There can be no assurance that projected synergies will be realized. 5 As a direct result of the Merger, GNL recognized $56.2 (5) million of annualized cost synergies exceeding the original $54 million that was estimated at transaction close

▪ Plan to maintain conservative financial and credit policies and expect to further de - lever the balance sheet through operating expense savings, potential non - core asset sales, organic NOI growth, and dividend policy revision ▪ Continue to focus on strategic dispositions in 2023, totaling $383 million (4) year - to - date, with the proceeds to be used to reduce outstanding debt and general corporate purposes ▪ Minimal debt maturity due in 2024 with only 7.3% of debt maturing in 2024 ▪ Comprehensive hedging program reduces adverse impacts from a volatile currency and interest rate environment ▪ Completed a 10 - year and interest - only (6.45%) $260 million CMBS loan encumbered by 29 multi - tenant properties GNL CAPITALIZATION AND BALANCE SHEET STRATEGY Q3’23 Debt Maturity Schedule ($mm) (2) Balance Sheet Highlights Net Debt to Adjusted Annualized EBITDA (1)(3)(5) 1. Please see Disclaimers at back of this presentation for a definition of all non - GAAP measures and a reconciliation to the Company's most directly comparable GAAP measure. 2. Excludes the effect of discounts and deferred financing costs, net. Current balances as of September 30, 2023 are shown in the year the debt matures. 3. Adjusted Annualized EBITDA based on the projected revenue less projected general and administrative expenses based on 19 - day period following completion of the Merger and Internalization, annualized for a full fiscal year. Please see Projections disclaimers at the front of this presentation. There can be no assurance that projected synergies will be realized. Net Debt represents total debt outstanding of $5.3 billion, less cash and cash equivalents of $133 million. 4. Inclusive of $185 million of closed transactions and $198 million of signed PSA and LOIs. Assumes signed PSA/LOIs lead to definitive sales on their contemplated terms, which is not assured. 5. The Q4'23 projected Adjusted Annualized EBITDA was calculated using projected revenue less projected general and administrative expenses. We are currently unable to calculate projected depreciation and amortization for the applicable period in accordance with GAAP, and 8.3x 7.6x Q2’23 Q4’23 $ 0.3 $391 $704 $ 11 5 $163 $533 $824 $ 1 ,6 1 0 $500 $500 202 3 2024 2025 Mortgage Debt 2026 Credit Facility 202 7 202 8 T he r ea fter Senior Notes 0.0% 7.3% 13.2% 32.3% 12.4% 19.4% 15.4% as such, we cannot produce a reconciliation of projected Adjusted Annualized EBITDA to net income (loss). We do not believe that depreciation and amortization is probable to be significant for the applicable period. 6 % of Total Debt Outstanding

Portfolio Overview Q3’23 Properties 1 ,3 0 4 Square Feet (millions) 66.8 % Leased 96% Weighted Average Remaining Lease Term (“WALT”) (1) 6.9 years % of SLR Derived from United States & Canada vs. Europe 81% | 19% Industries 96 Tenants 815 % of SLR derived from Investment Grade Tenants (“IG Rated”) (2)(3) 58% Top 10 Tenant Concentration 21% % of Leases with Contractual Rent Increases (4) 78% Average Annual Rental Increase (3) 1 .3% Metrics as of September 30, 2023. 1. Weighted average remaining lease term in years is based on square feet as of September 30, 2023. 2. Refer to Investment Grade Rating definition included in the footnotes on slide 3. Based on annualized SLR and as of September 30, 2023, GNL’s portfolio was 35.4% actual investment grade rated and 22.8% implied investment grade rated. 3. Calculated as of September 30, 2023, using annualized straight - line rent converted from local currency into USD as of September 30, 2023 for the in - place lease on the property on a straight - line basis, which includes tenant concessions such as free rent, as applicable. 4. The percentage of leases with rent increases is based on straight line rent as of September 30, 2023. Contractual cash base rent increases average 1.3% per year and include fixed percent or actual increases, or country CPI - indexed increases, which may include certain floors or caps on rental increases. As of September 30, 2023, and based on straight - line rent, approximately 59.7% are fixed - rate increases, 13.9% are based on the Consumer Price Index, 3.9% are based on other measures and 22.5% do not contain any PORTFOLIO SNAPSHOT escalation provisions. 7

$2 2 , 4 5 5 $10,112 $9,188 $7,647 $5 , 9 4 7 $4 , 8 2 0 $4 , 6 3 2 $3 , 0 6 0 $1 , 8 8 8 $1 , 8 2 8 SECTOR LEADING NET LEASE REIT Source: Company filings, company websites, FactSet, S&P Global. 1. Defined as total assets plus accumulated depreciation and amortization as of June 30, 2023 for peers. GNL gross asset value as of September 30, 2023. Third largest publicly - traded net lease REIT with a global presence (1) Gross Asset Value ($ in millions) REITs with Global Presence $59,466 (2) 2. Gross asset value does not reflect the pending merger with Spirit Realty Capital. 8

1. Metric based on annualized SLR as of September 30, 2023. Refer to SLR definition included in the footnotes on slide 7. 2. Based on Annualized Straight - Line Rent. Ratings information as of October 19, 2023. For GNL, 35.4% of the rated tenants were actual Investment Grade rated and 22.8% of the rated tenants were implied Investment Grade rated. Implied Investment Top ten tenants represent 21.0% of SLR with no single tenant accounting for more than 3.1% Top Ten Tenants Tenant Credit Rating Country Property Type % of SLR (1) Implied: Baa2 U.S. Single - Tenant Retail 3.1% Actual: Baa2 U.S. / Canda Industrial & Distribution 2.7% Actual: B - U.K. Industrial & Distribution 2.6% Actual: Baa3 U.S. Single - Tenant Retail 2.1% Actual: Baa1 U.S. / Italy Industrial & Distribution 2.0% Actual: Baa3 U.S. Industrial & Distribution 1.9% Actual: A2 U.S. Industrial & Distribution; Multi - Tenant Retail 1.9% Actual: A2 U.S. Single - Tenant Retail 1.7% Actual: Aaa U.S. Single - Tenant Office 1.5% Implied: B1 U.K. Single - Tenant Office 1.5% Top 10 Tenants 80.4% IG Rated (2) 21.0% HIGH - QUALITY INVESTMENT - GRADE TENANTS Grade includes ratings of the tenant’s parent (regardless of whether or not the parent has guaranteed the tenant’s obligation under the lease) or lease guarantor. Refer to Investment Grade Rating definition included in the footnotes on slide 3. 9

FL GA AL MS LA TX NM AZ CA NV UT OR WA ID MT WY CO ND SD NE KS OK AR MO IA MN WI MI IL IN OH KY TN NC SC VA WV PA NY VT ME NJ DE MD DC NH MA RI CT PACIFIC SOUTHW E ST SOUTHWEST MID - ATLA N T IC NEW BRUNS W ICK NB PACIFIC NOR THW E ST SO U TH EAST AK NOR TH E AST THIRD - LARGEST PUBLICLY TRADED NET LEASE REIT WITH A GLOBAL PRESENCE Geographic Presence SP FR UK I T L GER N E T H LUX FIN CI US / Canada Total – 80.9% of SLR Southeast – 23.6% of SLR Midwest – 20.6% of SLR Mid - Atlantic – 12.5% of SLR Southwest – 10.9% of SLR Pacific Southwest – 6.3% of SLR Northeast – 5.9% of SLR Pacific Northwest – 0.6% of SLR New Brunswick, – 0.4% of SLR Canada United States / Canada Europe Europe Total – 19.1% of SLR Note: Portfolio metrics as of September 30, 2023. 10 United Kingdom – 10.7% of SLR Netherlands – 2.2% of SLR Finland – 1.9% of SLR Germany – 1.4% of SLR France – 1.0% of SLR Channel Islands – 0.8% of SLR Luxembourg – 0.8% of SLR Italy – 0.3% of SLR Spain – 0.1% of SLR

1 4 . 3x 1 4 . 0x 1 3 . 2x 1 3 . 2x 1 2 . 8x 1 2 . 5x 1 2 . 3x 1 0 . 9x 1 0 . 2x 1 0 . 2x 9.3x 6 . 1x ATTRACTIVE YIELD WITH EMBEDDED POTENTIAL UPSIDE Source: Company filings, company websites, FactSet, S&P Global. Note: Market data as of September 30, 2023. 4. Refer to Investment Grade definition included in the footnotes on slide 3. 11 1. Please see Disclaimers at the front of this presentation for important information regarding as adjusted figures giving effect to the Merger and the Internalization. There can be no assurance that any of these projected synergies, value accretion estimates or combined future results of operations will be realized. 2023E AFFO multiples based on mean of consensus estimates. 2023E AFFO payout ratio based on most recent period dividend per share, annualized, divided by 2023E AFFO multiples. GNL 2023E AFFO multiple and payout based on estimated Q4’23 annualized dividend and AFFO per share. Please see Disclaimers at the back of this presentation for a definition of AFFO. While we consider AFFO a useful indicator of our performance, we do not consider AFFO as an alternative to net income (loss) or as a measure of liquidity. Furthermore, other REITs may define AFFO differently than we do. Projected AFFO per share data included in this presentation is for informational purposes only and should not be relied upon as indicative of future dividends or as a measure of future liquidity. AFFO for 3Q also contained adjustments including adjustments for items that were paid in cash but which the company believes were one - time non - recurring items. 2. 3. Attractive Upside Price to 2023E AFFO Multiples (1)(2) ▪ GNL, now an internally managed REIT, is expected to trade to our peer average AFFO multiple given the quality of income and superior investment - grade worthy tenants in our portfolio (3)(4) ▪ GNL’s post - merger quarterly dividend policy is $0.354 per share of common stock ($1.42 per share, annualized) Average: 12.1x

2.0% 6.0% 8. 1 % 6.8% 1 0.9% 1 3. 1 % 5 3.1 % 2023 2024 2025 2026 2027 2028 2029 + Lease Maturity Schedule by Property Type (% of Total SF) ATTRACTIVE LEASE MATURITY SCHEDULE Unique investment mix of strategically located suburban shopping centers and stable long - term single - tenant net - leased assets results in a favorable lease maturity schedule and a weighted average Remaining Lease Term of 6.9 years Mult i - Te n a n t Retail 1.0% 1.7% 3.0% 2.8% 2.2% 3.5% 8.8% Sin g le - Te n a n t Retail 0.0% 0.1% 1.3% 0.8% 1.0% 1.3% 7.5% Sin g le - Te n a n t Office 0.4% 1.6% 1.3% 1.7% 1.1% 1.1% 5.6% Industrial & Di s tributi o n 0.6% 2.6% 2.5% 1.5% 6.6% 7.2% 31.1% 6.9 Years Weighted Average Lease Term Multi - Tenant Retail Single - Tenant Retail Single - Tenant Office Note: Data as of September 30, 2023. 12 Industrial & Distribution

Leasing momentum continues in Q3 2023 with 100 lease renewals and new leases, over 1.8 million square feet and nearly $17 million of net straight - line rent Q3 2023 (1) Leasing and Renewal Activity Single - Tenant Portfolio Multi - Tenant Retail Portfolio New Leases + Renewals Completed 8 92 Q3 2023 Renewal Leasing Spread 7.0% 4.1% (2) Net Straight - Line Rent on New Leases + Renewals $5.0 million $11.8 million Square Feet on New Leases + Renewals 642,017 1,198,660 1. Leasing activity from 7/1/2023 through 9/30/2023. CONTINUED LEASING MOMENTUM DRIVEN BY STRONG ASSET MANAGEMENT CAPABILITIES Successful Asset Management Capabilities GNL continues to successfully demonstrate its asset management capabilities in Q3 2023 with an average annual rental increase of 1.3% across the portfolio, continued increase in occupancy and an attractive renewal leasing spread of 5% across the entire portfolio Recent Tenant Transactions 2. Calculated using Annual Base Rent. 13

WELL POSITIONED PORTFOLIO WITH KEY METRICS Note: Portfolio metrics as of September 30, 2023. 1. Calculated as of September 30, 2023, using annualized straight - line rent (“SLR”) converted from local currency into USD as of September 30, 2023 for the in - place lease on the property on a straight - line basis, includes tenant concessions such as free rent, as applicable. 2. Metric calculated based on square feet as of September 30, 2023. 3. Metric based on annualized SLR as of September 30, 2023. + + Number of Properties Square Feet (millions) SLR ($ millions) % Leased (2) WALT (3) % IG Rated T enant s (3)(4) + Industrial & Distribution 218 33.6 $229 100% 8.0 Years 56% 93% Multi - Tenant Retail 109 16.4 $199 90% 5.1 Years 38% 42% Single - Tenant Retail 886 7.9 $153 98% 8.4 Years 69% 85% Single - Tenant Office 91 8.9 $146 94% 5.1 Years 70% 94% Total Portfolio (1) 1,304 66.8 $728 96% 6.9 Years 58% 78% 4. Refer to Investment Grade definition included in the footnotes on slide 3. 14 Rent E s calation s (3) GNL’s competitive advantage of having a global presence and diversified portfolio gives the Company the flexibility to focus on attractive opportunities in multiple segments and markets that will contribute to long - term growth

Industrial & Distr ibu tion 32% Mu l t i - Tenant Retail 27% S ing le - Tena nt Retail 21% Singl e - Tena nt Office 20% Grocery A n c hored 21% Multi - Tenant Retail Portfolio Power Center 57% A ncho r ed Center 22% $728.3 mi ll ion S ing le - Tena nt Office 28 % Single - Tenant Portfolio Industrial & Distribution 43% Retail 29% Total Portfolio Annualized SLR by Segment Industry Exposure (1) Credit Rating (1)(2) Asset Diversification Note: Portfolio metrics as of September 30, 2023. 1. Metric based on annualized SLR as of September 30, 2023. Refer to SLR definition included in the footnotes on slide 7. 2. Refer to Investment Grade Rating definition included in the footnotes on slide 3. DIVERSIFIED AND STABLE TENANT BASE $528.9 mi ll i on $199.3 mi ll i on Healthcare, 6% Financial Services, 6% Auto Manufacturing, 6% Discount Retail, 5% Specialty Retail, 4% Gas/Convenience, 4% Freight, 3% Consumer Goods, 3% Home Improvement, 3% Retail Banking, 3% Quick Service Restaurant, 3% All Other, (3) 54% Sing l e - Tena nt 73% Investment Grade (2) 58% 3. “All Other” represents the aggregate of all industries with less than three percent exposure. 15 Non - In v est m e n t Grade 35% Not Rated 7%

0.6% 2.6% 2.5% 1 .5% 6.6% 7.2% 3 1 . 1 % 2023 2024 2025 2026 2027 2028 2029 + Segment Highlights Lease Maturity Schedule (% of Total SF) Geographic Breakdown (% of Total SLR) Top Five Tenants Tenant Credit Rating Country % of SLR Actual: Baa2 U.S. / Canada 2.7% Actual: B - U.K. 2.6% Actual: Baa1 U.S. / Italy 2.0% Actual: Baa3 U.S. 1.9% Implied: Baa2 U.S. 1.4% Top 5 Tenants 75.5% IG Rated 10.6% United States 77% United Kingdom 15% Eu rope 7% Ca n a da 1% 32% Total Portfolio (1) 218 Properties 33.6M Square Feet 18% CPI Increases (1) 10 0 % Leased 8.0 Years WALT 56% IG Tenants (1) 93% Rent Escalators (1) 1.6% Average Annual Rental Increase (1) Note: Portfolio metrics as of September 30, 2023. 1. Based on Annualized Straight - Line Rent. INDUSTRIAL & DISTRIBUTION OVERVIEW 8.0 Years Weighted Average Lease Term 16

1 .0% 1 .7% 3.0% 2.8% 2.2% 3. 5 % 8.8% 2023 2024 2025 2026 2027 2028 2029 + MULTI - TENANT RETAIL OVERVIEW Tenant Credit Rating Country % of SLR Actual: B1 U.S. 1.4% Actual: Baa3 U.S. 1.2% Actual: A3 U.S. 1.1% Actual: Ba2 U.S. 1.0% Actual: A2 U.S. 1.0% Top 5 Tenants 75.4% IG Rated 5.7% Segment Highlights Lease Maturity Schedule (% of Total SF) Leasing Pipeline (000’s) Top Five Tenants 27% Total Portfolio (1) 109 Properties 16.4M Square Feet $1 9 9M SLR 92.9% Leased + Pipeline 5.1 Years WALT 38% IG Tenants (1) 4.1% Leasing Spread (2) 61% Sunbelt (1) Note: Portfolio metrics as of September 30, 2023. Leasing Pipeline data as of November 1, 2023. Assumes executed leases commence and signed LOIs lead to definitive leases on their contemplated terms, which is not assured. 1. Based on Annualized Straight - Line Rent. 2. Calculated using Annual Base Rent. 5.1 Years Weighted Average Lease Term Anchor Tenants: 5.4 Years In - Line Tenants: 4.0 Years Multi - Tenant Leasing Is Expected To Increase Occupancy to 92.9% Q3’23 Occupancy Q3’23 Executed Occupancy Q3’23 Leasing Pipeline 92.9% 89.5% 90.0% 407 SF 76 SF 15,159 SF Q2'23 Occupancy (RTL Pre - Merger) Q3'23 Occupancy Q3’23 + Executed Occupancy & Leasing Pipeline 17

MULTI - TENANT RETAIL OVERVIEW Key Stats Number of Centers 56 Square Feet 9.9 million % of Multi - Tenant SLR 57% % Leased 89.9% Remaining Lease Term 4.7 Years Power Centers Anchored Centers ▪ Features centers that are typically leased to a national retail tenant and complementary in - line tenants that drive foot traffic to each ▪ Features centers that typically have a grocery anchored tenant Key Stats Grocery Centers ▪ Features centers with multiple big box layouts that are typically leased to national retail tenants Key Stats 18 Number of Centers 32 Square Feet 3.1 million % of Multi - Tenant SLR 21% % Leased 88.8% Remaining Lease Term 5.9 Years Number of Centers 21 Square Feet 3.4 million % of Multi - Tenant SLR 21% % Leased 91.3% Remaining Lease Term 5.7 Years

0.0% 0. 1 % 1 .3% 0.8% 1 .0% 1 .3% 7.5% 2023 2024 2025 2026 2027 2028 2029 + United States 89% Eu rope 4% United Kingdom 7% SINGLE - TENANT RETAIL OVERVIEW Tenant Credit Rating Country % of SLR Implied: Baa2 U.S. 3.1% Actual: Baa3 U.S. 2.1% Actual: A2 U.S. 1.7% Actual: Baa2 U.S. 1.3% Actual: Baa1 U.S. 0.9% Top 5 Tenants 100.0% IG Rated 9.1% Segment Highlights Lease Maturity Schedule (% of Total SF) Geographic Breakdown (% of Total SLR) Top Five Tenants 21% Total Portfolio (1) 886 Properties 7.9M Square Feet $1 5 3M SLR 98% Leased 8.4 Years WALT 69% IG Tenants (1) 85% Rent Escalators (1) 1.6% Average Annual Rental Increase (1) Note: Portfolio metrics as of September 30, 2023. 1. Based on Annualized Straight - Line Rent. 8.4 Years Weighted Average Lease Term 19

0.4% 1 .6% 1 .3% 1 .7% 1 .1 % 1 .1 % 5. 6 % 2023 2024 2025 2026 2027 2028 2029 + United States 50% Eu rope 27% United Kingdom 23% Note: Portfolio metrics as of September 30, 2023. 1. Based on Annualized Straight - Line Rent. SINGLE - TENANT OFFICE OVERVIEW Tenant Credit Rating Country % of SLR Actual: Aaa U.S. 1.5% Implied: B1 U.K. 1.5% Actual: Aa3 Netherlands 1.4% Actual: Baa2 U.S. 0.9% Implied: A - Luxembourg 0.8% Top 5 Tenants 75.4% IG Rated 6.1% Segment Highlights Lease Maturity Schedule (% of Total SF) 20% Total Portfolio (1) 91 Properties 8.9M Square Feet $1 4 6M SLR 94% Leased 70.3% IG Tenants (1) 1.6% Average Annual Rental Increase (1) 94% Rent Escalators (1) 70.7% Mission Critical (2) Geographic Breakdown (% of Total SLR) Top Five Tenants 5.1 Years Weighted Average Lease Term 2. Mission critical includes HQ, Lab, and R&D facilities. 20

Q3 2023 ACQUISITION ACTIVITY 21 Note: Ratings information is as of October 18, 2023. 1. Weighted Average Cap Rate is a rate of return on a real estate investment property based on the expected, annualized SLR that the property will generate under its existing lease or leases. Average Cap Rate is calculated by dividing the annualized SLR the property will generate (before debt service and depreciation and after fixed costs and variable costs) by the purchase price of the pr ope rty, excluding acquisition costs. The weighted Average Cap Rate is based upon square footage as of the date of acquisition. 2. Represents remaining lease term as of closing date, or expected closing date, and is weighted based on square feet. 3. Based on information as of November 1, 2023. The LOIs are non - binding and may not be completed on their contemplated terms, or at all. GNL will continue to evaluate the market for accretive acquisitions, but believe current risk - adjusted returns need to improve for the Company to be more active; GNL has simultaneously been reviewing and monitoring its portfolio for strategic dispositions that can create incremental proceeds to pay down debt while focusing on successful leasing and renewal initiatives Management continues to diligently evaluate domestic and international transactions focused on industrial, distribution and retail assets Acquisition Name Acquisition Status Credit Rating Property Type Purchase Price (in mm) Wtg. Avg. Cap Rate (1) Wtg. Avg. Lease Term Remaining (2) Closed Acquisitions FedEx Ground Marion, IL Closed: October 2023 B aa2 Industrial/ Distribution $52.7 6.5% 9.4 Total Closed Acquisitions $52.7 6.5% 9.4 Acquisition Pipeline (3) Dollar General 8 - Property Portfolio Signed PSA: In Due - Diligence Review B aa2 Di s c o u nt Retail $15.5 7.6% 15.0 Total Closed Plus Acquisition Pipeline $68.2 6.8% 10.9

GNL’s corporate governance is aligned with its industry peers GNL GOVERNANCE RELATIVE TO PEERS Source: Company filings, company websites, FactSet. 1. Market data reflects REITs that have made public announcements of opting out of the Maryland Unsolicited Takeovers Act (“MUTA”). 2. Market data reflects REITs that have made public announcements of requiring Managing Directors to sit on the Board. No Shareholder Rights Plan (No Poison Pill in force) Opted out of the Maryland Unsolicited Takeovers Act (“MUTA”) (1) Declassified Board No Managing Director Required on Board (2) Shareholders Can Call Special Meetings No Cumulative Voting 22

LEADERSHIP OVERVIEW Board of Directors Management Michael Weil , Director Refer to “Management” section for Michael Weil’s biography Michael Weil , Co - Chief Executive Officer Previously served as CEO of The Necessity Retail REIT Member of the Board of Directors of Global Net Lease, Inc. since 2012 Served as President of the Board of Directors of the Real Estate Investment Securities Association (n/k/a ADISA) James Nelson , Co - Chief Executive Officer Joined GNL Board in March 2017 Previously served as Chairman of the Board of Xerox Holdings Corporation. Also currently serves as an independent director and chair of the audit committee for Chewy, Inc. Chris Masterson , Chief Financial Officer Previously served as Chief Accounting Officer of GNL Past experience includes accounting positions with Goldman Sachs and KPMG Sue Perrotty , Non - Executive Chairperson of the Board of Directors James Nelson , Director Refer to “Management” section for James Nelson’s biography Previously served as the 45th Governor of the Commonwealth of Pennsylvania and as the Mayor of Philadelphia, and as a member of the board of directors of The Necessity Retail REIT Currently serves as President and Chief Executive Officer of AFM Financial Services and Tower Health Therese Antone , Independent Director Currently serves as the Chancellor of Salve Regina University since her appointment in 2009 Lisa Kabnick , Independent Director Currently serves as senior advisor for Troutman Pepper Hamilton Sanders LLP, and previously served as a member of the board of directors of The Necessity Retail REIT Leslie Michelson , Independent Director Currently serves as lead independent director of Franklin BSP Franklin Lending Corporation, and previously served as a member of the board of directors of The Necessity Retail REIT Stanley Perla , Independent Director Previously served as a member of the board of directors and the chair of the audit committee of Madison Harbor Balanced Strategies, Inc, and previously served as a member of the board of directors on the Necessity Retail REIT Edward Rendell , Independent Director Abby Wenzel , Independent Director Previously served as co - chair of Cozen O’Connor’s Real Estate Group Independent Directors Inside Directors Jesse Galloway , Executive Vice President & General Counsel Joined GNL in September 2023 25 years of legal experience representing large real estate companies and financial institutions, including 10 years as General Counsel and 15 years in private practice Jason Slear , Executive Vice President Responsible for sourcing, negotiating, and closing GNL’s real estate acquisitions and dispositions Oversaw the acquisition of over $3.5 billion of real estate assets and the lease - up of over 10 million square feet during professional career Ori Kravel , Senior Vice President Responsible for corporate development and business strategy Executed over $12 billion of capital market transactions and over $25 billion of M&A transactions 23

KEY TAKEAWAYS GNL continues to be undervalued compared to other internally managed REITs and should trade more in line with other net lease REITs on an AFFO multiple basis Global Presence With Scale E mb e dd e d Growth P r e d i c t a b le Income Proven Asset Man a g e m en t Capabilities I r r epl a ce a ble Real Estate Strategically Located Real Estate 24

FINANCIAL DEFINITIONS 25 Non - GAAP Financial Measures This section discusses non - GAAP financial measures we use to evaluate our performance, including Funds from Operations (“FFO”), Core Funds from Operations (“Core FFO”), Adjusted Funds from Operations (“AFFO”), Adjusted Earnings before Interest, Taxes, Depreciation and Amortization (“Adjusted EBITDA”), Net Operating Income (“NOI”) and Cash Net Operating Income (“Cash NOI”). While NOI is a property - level measure, AFFO is based on total Company performance and therefore reflects the impact of other items not specifically associated with NOI such as, interest expense, general and administrative expenses and operating fees to related parties. Additionally, NOI as defined herein, does not reflect an adjustment for straight - line rent but AFFO does include this adjustment. A description of these non - GAAP measures and reconciliations to the most directly comparable GAAP measure, which is net income, is provided below. Caution on Use of Non - GAAP Measures FFO, Core FFO, AFFO, Adjusted EBITDA, NOI, Cash NOI, and Constant Currency should not be construed to be more relevant or accurate than the current GAAP methodology in calculating net income or in its applicability in evaluating our operating performance. The method utilized to evaluate the value and performance of real estate under GAAP should be construed as a more relevant measure of operational performance and considered more prominently than the non - GAAP measures. Other REITs may not define FFO in accordance with the current National Association of Real Estate Investment Trusts (“NAREIT”) definition (as we do), or may interpret the current NAREIT definition differently than we do, or may calculate Core FFO or AFFO differently than we do. Consequently, our presentation of FFO, Core FFO and AFFO may not be comparable to other similarly - titled measures presented by other REITs. We consider FFO, Core FFO and AFFO useful indicators of our performance. Because FFO, Core FFO and AFFO calculations exclude such factors as depreciation and amortization of real estate assets and gain or loss from sales of operating real estate assets (which can vary among owners of identical assets in similar conditions based on historical cost accounting and useful - life estimates), FFO, Core FFO and AFFO presentations facilitate comparisons of operating performance between periods and between other REITs in our peer group.

Funds from Operations, Core Funds from Operations and Adjusted Funds from Operations Funds From Operations Due to certain unique operating characteristics of real estate companies, as discussed below, NAREIT, an industry trade group, has promulgated a measure known as FFO, which we believe to be an appropriate supplemental measure to reflect the operating performance of a REIT. FFO is not equivalent to net income or loss as determined under GAAP. We calculate FFO, a non - GAAP measure, consistent with the standards established over time by the Board of Governors of NAREIT, as restated in a White Paper approved by the Board of Governors of NAREIT effective in December 2018 (the “White Paper”). The White Paper defines FFO as net income or loss computed in accordance with GAAP, excluding depreciation and amortization related to real estate, gain and loss from the sale of certain real estate assets, gain and loss from change in control and impairment write - downs of certain real estate assets and investments in entities when the impairment is directly attributable to decreases in the value of depreciable real estate held by the entity. Adjustments for unconsolidated partnerships and joint ventures are calculated to exclude the proportionate share of the non - controlling interest to arrive at FFO, Core FFO, AFFO and NOI attributable to stockholders, as applicable. Our FFO calculation complies with NAREIT’s definition. The historical accounting convention used for real estate assets requires straight - line depreciation of buildings and improvements, and straight - line amortization of intangibles, which implies that the value of a real estate asset diminishes predictably over time. We believe that, because real estate values historically rise and fall with market conditions, including inflation, interest rates, unemployment and consumer spending, presentations of operating results for a REIT using historical accounting for depreciation and certain other items may be less informative. Historical accounting for real estate involves the use of GAAP. Any other method of accounting for real estate such as the fair value method cannot be construed to be any more accurate or relevant than the comparable methodologies of real estate valuation found in GAAP. Nevertheless, we believe that the use of FFO, which excludes the impact of real estate related depreciation and amortization, among other things, provides a more complete understanding of our performance to investors and to management, and, when compared year over year, reflects the impact on our operations from trends in occupancy rates, rental rates, operating costs, general and administrative expenses, and interest costs, which may not be imm ediately apparent from net income. FINANCIAL DEFINITIONS 26

Funds from Operations, Core Funds from Operations and Adjusted Funds from Operations (Cont’d) Core Funds From Operations In calculating Core FFO, we start with FFO, then we exclude certain non - core items such as merger, transaction and other costs, settlement costs related to our Blackwells/Related Parties litigation, as well as certain other costs that are considered to be non - core, such as debt extinguishment costs, fire loss and other costs related to damages at our properties. The purchase of properties, and the corresponding expenses associated with that process, is a key operational feature of our core business plan to generate operational income and cash flows in order to make dividend payments to stockholders. In evaluating investments in real estate, we differentiate the costs to acquire the investment from the subsequent operations of the investment. We also add back non - cash write - offs of deferred financing costs and prepayment penalties incurred with the early extinguishment of debt which are included in net income but are considered financing cash flows when paid in the statement of cash flows. We consider these write - offs and prepayment penalties to be capital transactions and not indicative of operations. By excluding expensed acquisition, transaction and other costs as well as non - core costs, we believe Core FFO provides useful supplemental information that is comparable for each type of real estate investment and is consistent with management’s analysis of the investing and operating performance of our properties. Adjusted Funds From Operations In calculating AFFO, we start with Core FFO, then we exclude certain income or expense items from AFFO that we consider more reflective of investing activities, other non - cash income and expense items and the income and expense effects of other activities or items including items that were paid in cash that are not a fundamental attribute of our business plan or were one time or non - recurring items. These items include early extinguishment of debt and other items excluded in Core FFO as well as unrealized gain and loss, which may not ultimately be realized, such as gain or loss on derivative instruments, gain or loss on foreign currency transactions, and gain or loss on investments. In addition, by excluding non - cash income and expense items such as amortization of above - market and below - market leases intangibles, amortization of deferred financing costs, straight - line rent and equity - based compensation from AFFO, we believe we provide useful information regarding income and expense items which have a direct impact on our ongoing operating performance. We also exclude revenue attributable to the reimbursement by third parties of financing costs that we originally incurred because these revenues are not, in our view, related to operating performance. We also include the realized gain or loss on foreign currency exchange contracts for AFFO as such items are part of our ongoing operations and affect our current operating performance. FINANCIAL DEFINITIONS 27

Funds from Operations, Core Funds from Operations and Adjusted Funds from Operations (Cont’d) Adjusted Funds From Operations (cont’d) In calculating AFFO, we exclude certain expenses which under GAAP are characterized as operating expenses in determining operating net income. All paid and accrued acquisition, transaction and other costs (including prepayment penalties for debt extinguishments and merger related expenses) and certain other expenses, including expenses incurred for the 2023 proxy contest and related Blackwells/Related Parties litigation, negatively impact our operating performance during the period in which expenses are incurred or properties are acquired and will also have negative effects on returns to investors, but are excluded by us as we believe they are not reflective of our on - going performance. Further, under GAAP, certain contemplated non - cash fair value and other non - cash adjustments are considered operating non - cash adjustments to net income. In addition, as discussed above, we view gain and loss from fair value adjustments as items which are unrealized and may not ultimately be realized and not reflective of ongoing operations and are therefore typically adjusted for when assessing operating performance. Excluding income and expense items detailed above from our calculation of AFFO provides information consistent with management’s analysis of our operating performance. Additionally, fair value adjustments, which are based on the impact of current market fluctuations and underlying assessments of general market conditions, but can also result from operational factors such as rental and occupancy rates, may not be directly related or attributable to our current operating performance. By excluding such changes that may reflect anticipated and unrealized gain or loss, we believe AFFO provides useful supplemental information. By providing AFFO, we believe we are presenting useful information that can be used to, among other things, assess our performance without the impact of transactions or other items that are not related to our portfolio of properties. AFFO presented by us may not be comparable to AFFO reported by other REITs that define AFFO differently. Furthermore, we believe that in order to facilitate a clear understanding of our operating results, AFFO should be examined in conjunction with net income (loss) calculated in accordance with GAAP and presented in our consolidated financial statements. AFFO should not be considered as an alternative to net income (loss) as an indication of our performance or to cash flows as a measure of our liquidity or ability to make distributions. FINANCIAL DEFINITIONS 28

Adjusted Earnings before Interest, Taxes, Depreciation and Amortization, Net Operating Income, and Cash Net Operating Income. We believe that Adjusted EBITDA, which is defined as earnings before interest, taxes, depreciation and amortization adjusted for acquisition, transaction and other costs, other non - cash items and including our pro - rata share from unconsolidated joint ventures, is an appropriate measure of our ability to incur and service debt. We also exclude revenue attributable to the reimbursement by third parties of financing costs that we originally incurred because these revenues are not, in our view, related to operating performance. All paid and accrued acquisition, transaction and other costs (including prepayment penalties for debt extinguishments) and certain other expenses, including general and administrative expenses incurred for the 2023 proxy contest and related Blackwells/Related Parties litigation, negatively impact our operating performance during the period in which expenses are incurred or properties are acquired and will also have negative effects on returns to investors, but are not reflective of on - going performance. Due to the increase in general and administrative expenses as a result of the 2023 proxy contest and related litigation as a portion of our total general and administrative expenses in the first quarter of 2023, we began including this adjustment to arrive at Adjusted EBITDA in order to better reflect our operating performance. Adjusted EBITDA should not be considered as an alternative to cash flows from operating activities, as a measure of our liquidity or as an alternative to net income as an indicator of our operating activities. Other REITs may calculate Adjusted EBITDA differently and our calculation should not be compared to that of other REITs. NOI is a non - GAAP financial measure equal to net income (loss), the most directly comparable GAAP financial measure, less discontinued operations, interest, other income and income from preferred equity investments and investment securities, plus corporate general and administrative expense, acquisition, transaction and other costs, depreciation and amortization, other noncash expenses and interest expense. We use NOI internally as a performance measure and believe NOI provides useful information to investors regarding our financial condition and results of operations because it reflects only those income and expense items that are incurred at the property level. Therefore, we believe NOI is a useful measure for evaluating the operating performance of our real estate assets and to make decisions about resource allocations. Further, we believe NOI is useful to investors as a performance measure because, when compared across periods, NOI reflects the impact on operations from trends in occupancy rates, rental rates, operating costs and acquisition activity on an unlevered basis, providing perspective not immediately apparent from net income. NOI excludes certain components from net income in order to provide results that are more closely related to a property’s results of operations. For example, interest expense is not necessarily linked to the operating performance of a real estate asset and is often incurred at the corporate level as opposed to the property level. In addition, depreciation and amortization, because of historical cost accounting and useful life estimates, may distort operating performance at the property level. NOI presented by us may not be comparable to NOI reported by other REITs that define NOI differently. We believe that in order to facilitate a clear understanding of our operating results, NOI should be examined in conjunction with net income (loss) as presented in our consolidated financial statements. NOI should not be considered as an alternative to net income (loss) as an indication of our performance or to cash flows as a measure of our liquidity. FINANCIAL DEFINITIONS 29

Adjusted Earnings before Interest, Taxes, Depreciation and Amortization, Net Operating Income, and Cash Net Operating Income (Cont’d) Cash NOI is a non - GAAP financial measure that is intended to reflect the performance of our properties. We define Cash NOI as net operating income (which is separately defined herein) excluding amortization of above/below market lease intangibles and straight - line adjustments that are included in GAAP lease revenues. We believe that Cash NOI is a helpful measure that both investors and management can use to evaluate the current financial performance of our properties and it allows for comparison of our operating performance between periods and to other REITs. Cash NOI should not be considered as an alternative to net income, as an indication of our financial performance, or to cash flows as a measure of liquidity or our ability to fund all needs. The method by which we calculate and present Cash NOI may not be directly comparable to the way other REITs calculate and present Cash NOI. Cash Paid for Interest is calculated based on the interest expense less non - cash portion of interest expense and amortization of mortgage (discount) premium, net. Management believes that Cash Paid for Interest provides useful information to investors to assess our overall solvency and financial flexibility. Cash Paid for Interest should not be considered as an alternative to interest expense as determined in accordance with GAAP or any other GAAP financial measures and should only be considered together with and as a supplement to our financial information prepared in accordance with GAAP. Constant currency results exclude any benefit or loss caused by foreign exchange fluctuations between foreign currencies and the United States dollar which would not have occurred if there had been a constant exchange rate. FINANCIAL DEFINITIONS 30

NON – GAAP RECONCILIATIONS 1. 31 Amounts relate to general and administrative expenses incurred for the 2023 proxy contest and related Blackwells Capital LLC, an affiliate of Blackwells Onshore I LLC, and certain others involved with the proxy solicitation (collectively, the “Blackwells/Related Parties”) litigation. The Company does not consider these expenses to be part of its normal operating performance. Due to the increase in these expenses as a portion of its general and administrative expenses in the quarter ended March 31, 2023, the Company began including this adjustment to arrive at Adjusted EBITDA in order to better reflect its operating performance. The third quarter of 2022 did not have any of these expenses. (Amounts in thousands) Three Months Ended 30 - Se p - 23 30 - Se p - 22 EBITDA: Net (loss) income $ ( 136,184 ) $14,83 8 Depreciation and amortization 49,232 37,791 Interest expense 41,161 24,207 Income tax expense 2,801 3 , 052 EBITDA ( 4 2,9 9 0 ) 79,8 8 8 Impairment charges 65,706 796 Equity - based compensation 10,444 3 , 132 Merger, transaction and other costs 43,765 103 Settlement Costs 14,643 – Loss (gain) on dispositions of real estate investments 684 (143) Gain on derivative instruments ( 3,217 ) ( 13,121 ) Loss on extinguishment of debt – 41 Other income ( 119 ) ( 10 ) Expenses attributable to 2023 proxy contest and related litigation (1) 14 – Adjusted EBITDA 88,9 3 0 70,6 8 6 Operating fees to related parties 8,652 10,088 General and administrative 6,977 4 , 060 Expenses attributable to 2023 proxy contest and related litigation (1) ( 14 ) – NOI $ 10 4,5 4 5 $84,8 3 4 Amortization of above - and below - market leases and ground lease intangibles and right - of - use assets, net 1,444 351 Straight - line rent ( 2 ) ( 2,314 ) Cash NOI $ 10 5,9 8 7 $82,8 7 1 Cash Paid for Interest: Interest Expense $41,16 1 $24,20 7 Non - cash portion of interest expense ( 2,046 ) ( 2,322 ) Amortization of mortgage discounts premiums, net ( 3,374 ) (225) Total Cash Paid for Interest $35,7 4 1 $2 1, 66 0
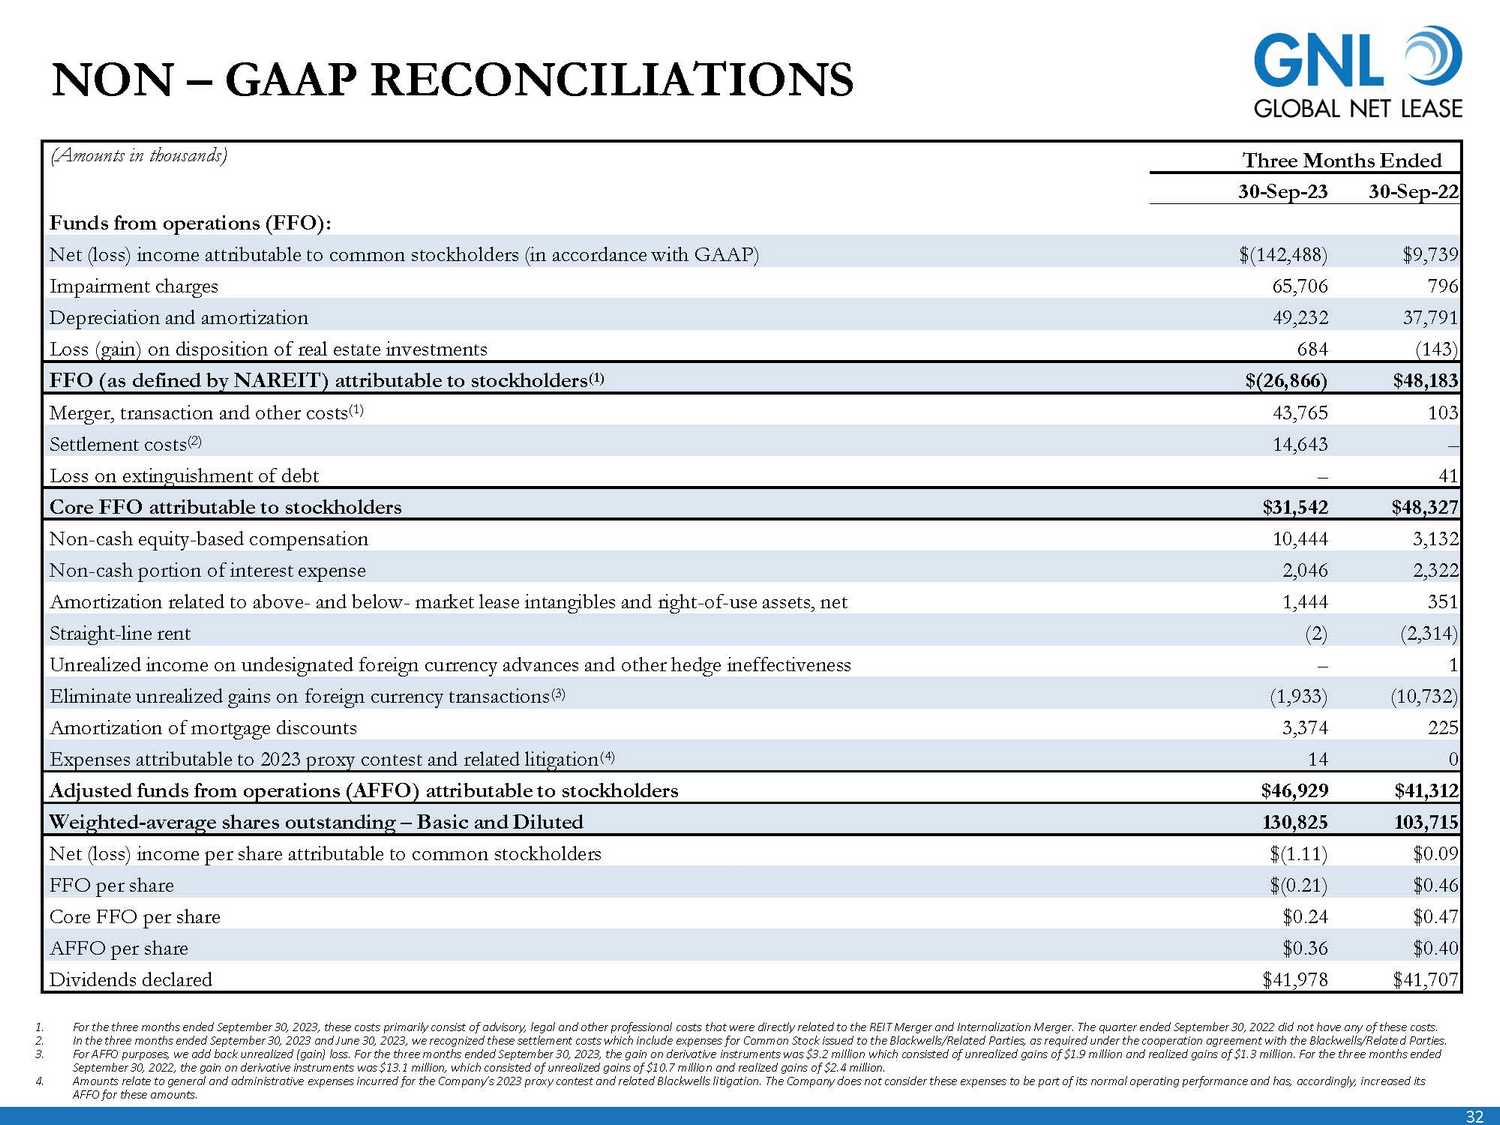
(Amounts in thousands) Funds from operations (FFO): Three Months Ended 30 - Sep - 23 30 - Sep - 22 Net (loss) income attributable to common stockholders (in accordance with GAAP) $ ( 142,488 ) $ 9, 739 Impairment charges 65,706 796 Depreciation and amortization 49,232 37 , 791 Loss (gain) on disposition of real estate investments 684 ( 143 ) FFO (as defined by NAREIT) attributable to stockholders (1) $ ( 2 6,8 6 6 ) $48, 1 8 3 Merger, transaction and other costs (1) 43,765 103 Settlement costs (2) 14,643 – Loss on extinguishment of debt – 41 Core FFO attributable to stockholders $3 1,5 4 2 $48,32 7 Non - cash equity - based compensation 10,444 3,132 Non - cash portion of interest expense 2,046 2,322 Amortization related to above - and below - market lease intangibles and right - of - use assets, net 1,444 351 Straight - line rent (2) (2, 3 1 4 ) Unrealized income on undesignated foreign currency advances and other hedge ineffectiveness – 1 Eliminate unrealized gains on foreign currency transactions (3) ( 1,933 ) ( 10,732 ) Amortization of mortgage discounts 3,374 225 Expenses attributable to 2023 proxy contest and related litigation (4) 14 0 Adjusted funds from operations (AFFO) attributable to stockholders $46,9 2 9 $41,312 Weighted - average shares outstanding – Basic and Diluted 13 0,8 2 5 103,715 Net (loss) income per share attributable to common stockholders $ ( 1.11 ) $0.0 9 FFO per share $ ( 0.21 ) $0.4 6 Core FFO per share $0.2 4 $0.4 7 AFFO per share $0.3 6 $0.4 0 Dividends declared $41,97 8 $41,70 7 NON – GAAP RECONCILIATIONS 1. 2. 3. AFFO for these amounts. 32 For the three months ended September 30, 2023, these costs primarily consist of advisory, legal and other professional costs that were directly related to the REIT Merger and Internalization Merger. The quarter ended September 30, 2022 did not have any of these costs. In the three months ended September 30, 2023 and June 30, 2023, we recognized these settlement costs which include expenses for Common Stock issued to the Blackwells/Related Parties, as required under the cooperation agreement with the Blackwells/Related Parties. For AFFO purposes, we add back unrealized (gain) loss. For the three months ended September 30, 2023, the gain on derivative instruments was $3.2 million which consisted of unrealized gains of $1.9 million and realized gains of $1.3 million. For the three months ended September 30, 2022, the gain on derivative instruments was $13.1 million, which consisted of unrealized gains of $10.7 million and realized gains of $2.4 million. Amounts relate to general and administrative expenses incurred for the Company’s 2023 proxy contest and related Blackwells litigation. The Company does not consider these expenses to be part of its normal operating performance and has, accordingly, increased its 4.
v3.23.3
Cover
|
Nov. 07, 2023 |
| Document Information [Line Items] |
|
| Document Type |
8-K
|
| Amendment Flag |
false
|
| Document Period End Date |
Nov. 07, 2023
|
| Entity File Number |
001-37390
|
| Entity Registrant Name |
Global Net Lease, Inc.
|
| Entity Central Index Key |
0001526113
|
| Entity Tax Identification Number |
45-2771978
|
| Entity Incorporation, State or Country Code |
MD
|
| Entity Address, Address Line One |
650 Fifth Avenue
|
| Entity Address, Address Line Two |
30th Floor
|
| Entity Address, City or Town |
New York
|
| Entity Address, State or Province |
NY
|
| Entity Address, Postal Zip Code |
10019
|
| City Area Code |
212
|
| Local Phone Number |
415-6500
|
| Written Communications |
false
|
| Soliciting Material |
false
|
| Pre-commencement Tender Offer |
false
|
| Pre-commencement Issuer Tender Offer |
false
|
| Entity Emerging Growth Company |
false
|
| Common Stock [Member] |
|
| Document Information [Line Items] |
|
| Title of 12(b) Security |
Common
Stock, $0.01 par value per share
|
| Trading Symbol |
GNL
|
| Security Exchange Name |
NYSE
|
| Series A Preferred Stock [Member] |
|
| Document Information [Line Items] |
|
| Title of 12(b) Security |
7.25%
Series A Cumulative Redeemable Preferred Stock, $0.01 par value per share
|
| Trading Symbol |
GNL PR A
|
| Security Exchange Name |
NYSE
|
| Series B Preferred Stock [Member] |
|
| Document Information [Line Items] |
|
| Title of 12(b) Security |
6.875%
Series B Cumulative Redeemable Perpetual Preferred Stock, $0.01 par value per share
|
| Trading Symbol |
GNL PR B
|
| Security Exchange Name |
NYSE
|
| Series D Preferred Stock [Member] |
|
| Document Information [Line Items] |
|
| Title of 12(b) Security |
7.50% Series D Cumulative Redeemable Perpetual Preferred Stock, $0.01 par value per share
|
| Trading Symbol |
GNL PR D
|
| Security Exchange Name |
NYSE
|
| Series E Preferred Stock [Member] |
|
| Document Information [Line Items] |
|
| Title of 12(b) Security |
7.375% Series E Cumulative Redeemable Perpetual Preferred Stock, $0.01 par value per share
|
| Trading Symbol |
GNL PR E
|
| Security Exchange Name |
NYSE
|
| X |
- DefinitionBoolean flag that is true when the XBRL content amends previously-filed or accepted submission.
| Name: |
dei_AmendmentFlag |
| Namespace Prefix: |
dei_ |
| Data Type: |
xbrli:booleanItemType |
| Balance Type: |
na |
| Period Type: |
duration |
|
| X |
- DefinitionFor the EDGAR submission types of Form 8-K: the date of the report, the date of the earliest event reported; for the EDGAR submission types of Form N-1A: the filing date; for all other submission types: the end of the reporting or transition period. The format of the date is YYYY-MM-DD.
| Name: |
dei_DocumentPeriodEndDate |
| Namespace Prefix: |
dei_ |
| Data Type: |
xbrli:dateItemType |
| Balance Type: |
na |
| Period Type: |
duration |
|
| X |
- DefinitionThe type of document being provided (such as 10-K, 10-Q, 485BPOS, etc). The document type is limited to the same value as the supporting SEC submission type, or the word 'Other'.
| Name: |
dei_DocumentType |
| Namespace Prefix: |
dei_ |
| Data Type: |
dei:submissionTypeItemType |
| Balance Type: |
na |
| Period Type: |
duration |
|
| X |
- DefinitionAddress Line 1 such as Attn, Building Name, Street Name
| Name: |
dei_EntityAddressAddressLine1 |
| Namespace Prefix: |
dei_ |
| Data Type: |
xbrli:normalizedStringItemType |
| Balance Type: |
na |
| Period Type: |
duration |
|
| X |
- DefinitionAddress Line 2 such as Street or Suite number
| Name: |
dei_EntityAddressAddressLine2 |
| Namespace Prefix: |
dei_ |
| Data Type: |
xbrli:normalizedStringItemType |
| Balance Type: |
na |
| Period Type: |
duration |
|
| X |
- Definition
+ References
+ Details
| Name: |
dei_EntityAddressCityOrTown |
| Namespace Prefix: |
dei_ |
| Data Type: |
xbrli:normalizedStringItemType |
| Balance Type: |
na |
| Period Type: |
duration |
|
| X |
- DefinitionCode for the postal or zip code
| Name: |
dei_EntityAddressPostalZipCode |
| Namespace Prefix: |
dei_ |
| Data Type: |
xbrli:normalizedStringItemType |
| Balance Type: |
na |
| Period Type: |
duration |
|
| X |
- DefinitionName of the state or province.
| Name: |
dei_EntityAddressStateOrProvince |
| Namespace Prefix: |
dei_ |
| Data Type: |
dei:stateOrProvinceItemType |
| Balance Type: |
na |
| Period Type: |
duration |
|
| X |
- DefinitionA unique 10-digit SEC-issued value to identify entities that have filed disclosures with the SEC. It is commonly abbreviated as CIK. Reference 1: http://www.xbrl.org/2003/role/presentationRef
-Publisher SEC
-Name Exchange Act
-Number 240
-Section 12
-Subsection b-2
| Name: |
dei_EntityCentralIndexKey |
| Namespace Prefix: |
dei_ |
| Data Type: |
dei:centralIndexKeyItemType |
| Balance Type: |
na |
| Period Type: |
duration |
|
| X |
- DefinitionIndicate if registrant meets the emerging growth company criteria. Reference 1: http://www.xbrl.org/2003/role/presentationRef
-Publisher SEC
-Name Exchange Act
-Number 240
-Section 12
-Subsection b-2
| Name: |
dei_EntityEmergingGrowthCompany |
| Namespace Prefix: |
dei_ |
| Data Type: |
xbrli:booleanItemType |
| Balance Type: |
na |
| Period Type: |
duration |
|
| X |
- DefinitionCommission file number. The field allows up to 17 characters. The prefix may contain 1-3 digits, the sequence number may contain 1-8 digits, the optional suffix may contain 1-4 characters, and the fields are separated with a hyphen.
| Name: |
dei_EntityFileNumber |
| Namespace Prefix: |
dei_ |
| Data Type: |
dei:fileNumberItemType |
| Balance Type: |
na |
| Period Type: |
duration |
|
| X |
- DefinitionTwo-character EDGAR code representing the state or country of incorporation.
| Name: |
dei_EntityIncorporationStateCountryCode |
| Namespace Prefix: |
dei_ |
| Data Type: |
dei:edgarStateCountryItemType |
| Balance Type: |
na |
| Period Type: |
duration |
|
| X |
- DefinitionThe exact name of the entity filing the report as specified in its charter, which is required by forms filed with the SEC. Reference 1: http://www.xbrl.org/2003/role/presentationRef
-Publisher SEC
-Name Exchange Act
-Number 240
-Section 12
-Subsection b-2
| Name: |
dei_EntityRegistrantName |
| Namespace Prefix: |
dei_ |
| Data Type: |
xbrli:normalizedStringItemType |
| Balance Type: |
na |
| Period Type: |
duration |
|
| X |
- DefinitionThe Tax Identification Number (TIN), also known as an Employer Identification Number (EIN), is a unique 9-digit value assigned by the IRS. Reference 1: http://www.xbrl.org/2003/role/presentationRef
-Publisher SEC
-Name Exchange Act
-Number 240
-Section 12
-Subsection b-2
| Name: |
dei_EntityTaxIdentificationNumber |
| Namespace Prefix: |
dei_ |
| Data Type: |
dei:employerIdItemType |
| Balance Type: |
na |
| Period Type: |
duration |
|
| X |
- DefinitionLocal phone number for entity.
| Name: |
dei_LocalPhoneNumber |
| Namespace Prefix: |
dei_ |
| Data Type: |
xbrli:normalizedStringItemType |
| Balance Type: |
na |
| Period Type: |
duration |
|
| X |
- DefinitionBoolean flag that is true when the Form 8-K filing is intended to satisfy the filing obligation of the registrant as pre-commencement communications pursuant to Rule 13e-4(c) under the Exchange Act. Reference 1: http://www.xbrl.org/2003/role/presentationRef
-Publisher SEC
-Name Exchange Act
-Number 240
-Section 13e
-Subsection 4c
| Name: |
dei_PreCommencementIssuerTenderOffer |
| Namespace Prefix: |
dei_ |
| Data Type: |
xbrli:booleanItemType |
| Balance Type: |
na |
| Period Type: |
duration |
|
| X |
- DefinitionBoolean flag that is true when the Form 8-K filing is intended to satisfy the filing obligation of the registrant as pre-commencement communications pursuant to Rule 14d-2(b) under the Exchange Act. Reference 1: http://www.xbrl.org/2003/role/presentationRef
-Publisher SEC
-Name Exchange Act
-Number 240
-Section 14d
-Subsection 2b
| Name: |
dei_PreCommencementTenderOffer |
| Namespace Prefix: |
dei_ |
| Data Type: |
xbrli:booleanItemType |
| Balance Type: |
na |
| Period Type: |
duration |
|
| X |
- DefinitionTitle of a 12(b) registered security. Reference 1: http://www.xbrl.org/2003/role/presentationRef
-Publisher SEC
-Name Exchange Act
-Number 240
-Section 12
-Subsection b
| Name: |
dei_Security12bTitle |
| Namespace Prefix: |
dei_ |
| Data Type: |
dei:securityTitleItemType |
| Balance Type: |
na |
| Period Type: |
duration |
|
| X |
- DefinitionName of the Exchange on which a security is registered. Reference 1: http://www.xbrl.org/2003/role/presentationRef
-Publisher SEC
-Name Exchange Act
-Number 240
-Section 12
-Subsection d1-1
| Name: |
dei_SecurityExchangeName |
| Namespace Prefix: |
dei_ |
| Data Type: |
dei:edgarExchangeCodeItemType |
| Balance Type: |
na |
| Period Type: |
duration |
|
| X |
- DefinitionBoolean flag that is true when the Form 8-K filing is intended to satisfy the filing obligation of the registrant as soliciting material pursuant to Rule 14a-12 under the Exchange Act. Reference 1: http://www.xbrl.org/2003/role/presentationRef
-Publisher SEC
-Name Exchange Act
-Section 14a
-Number 240
-Subsection 12
| Name: |
dei_SolicitingMaterial |
| Namespace Prefix: |
dei_ |
| Data Type: |
xbrli:booleanItemType |
| Balance Type: |
na |
| Period Type: |
duration |
|
| X |
- DefinitionTrading symbol of an instrument as listed on an exchange.
| Name: |
dei_TradingSymbol |
| Namespace Prefix: |
dei_ |
| Data Type: |
dei:tradingSymbolItemType |
| Balance Type: |
na |
| Period Type: |
duration |
|
| X |
- DefinitionBoolean flag that is true when the Form 8-K filing is intended to satisfy the filing obligation of the registrant as written communications pursuant to Rule 425 under the Securities Act. Reference 1: http://www.xbrl.org/2003/role/presentationRef
-Publisher SEC
-Name Securities Act
-Number 230
-Section 425
| Name: |
dei_WrittenCommunications |
| Namespace Prefix: |
dei_ |
| Data Type: |
xbrli:booleanItemType |
| Balance Type: |
na |
| Period Type: |
duration |
|
| X |
- Details
| Name: |
us-gaap_StatementClassOfStockAxis=us-gaap_CommonStockMember |
| Namespace Prefix: |
|
| Data Type: |
na |
| Balance Type: |
|
| Period Type: |
|
|
| X |
- Details
| Name: |
us-gaap_StatementClassOfStockAxis=us-gaap_SeriesAPreferredStockMember |
| Namespace Prefix: |
|
| Data Type: |
na |
| Balance Type: |
|
| Period Type: |
|
|
| X |
- Details
| Name: |
us-gaap_StatementClassOfStockAxis=us-gaap_SeriesBPreferredStockMember |
| Namespace Prefix: |
|
| Data Type: |
na |
| Balance Type: |
|
| Period Type: |
|
|
| X |
- Details
| Name: |
us-gaap_StatementClassOfStockAxis=us-gaap_SeriesDPreferredStockMember |
| Namespace Prefix: |
|
| Data Type: |
na |
| Balance Type: |
|
| Period Type: |
|
|
| X |
- Details
| Name: |
us-gaap_StatementClassOfStockAxis=us-gaap_SeriesEPreferredStockMember |
| Namespace Prefix: |
|
| Data Type: |
na |
| Balance Type: |
|
| Period Type: |
|
|
Global Net Lease (NYSE:GNL-B)
과거 데이터 주식 차트
부터 5월(5) 2024 으로 6월(6) 2024

Global Net Lease (NYSE:GNL-B)
과거 데이터 주식 차트
부터 6월(6) 2023 으로 6월(6) 2024
