0001600438
false
0001600438
2023-08-09
2023-08-09
iso4217:USD
xbrli:shares
iso4217:USD
xbrli:shares
UNITED STATES
SECURITIES AND
EXCHANGE COMMISSION
Washington,
D.C. 20549
FORM 8-K
CURRENT REPORT
Pursuant to Section 13
or 15(d) of the Securities Exchange Act of 1934
Date of Report (Date of
earliest event reported): August 9,
2023
GMS INC.
(Exact name of
registrant as specified in charter)
| Delaware |
|
001-37784 |
|
46-2931287 |
(State or Other Jurisdiction
of Incorporation) |
|
(Commission
File Number) |
|
(I.R.S. Employer
Identification No.) |
100 Crescent Centre Parkway, Suite 800
Tucker, Georgia |
|
30084 |
| (Address of Principal Executive Offices) |
|
(Zip Code) |
Registrant’s
telephone number, including area code: (800) 392-4619
Check the appropriate box below if
the Form 8-K filing is intended to simultaneously satisfy the filing obligation of the registrant under any of the following
provisions:
| ¨ | Written
communications pursuant to Rule 425 under the Securities Act (17 CFR 230.425) |
| ¨ | Soliciting
material pursuant to Rule 14a-12 under the Exchange Act (17 CFR 240.14a-12) |
| ¨ | Pre-commencement
communications pursuant to Rule 14d-2(b) under the Exchange Act (17 CFR 240.14d-2(b)) |
| ¨ | Pre-commencement
communications pursuant to Rule 13e-4(c) under the Exchange Act (17 CFR 240.13e-4(c)) |
Securities registered pursuant to Section 12(b) of
the Act:
| Title of each class |
|
Trading Symbol(s) |
|
Name of each exchanged on which registered |
| Common Stock, par value $0.01 per share |
|
GMS |
|
New York Stock Exchange |
Indicate by check mark whether the
registrant is an emerging growth company as defined in Rule 405 of the Securities Act of 1933 (§230.405 of this chapter)
or Rule 12b-2 of the Securities Exchange Act of 1934 (§240.12b-2 of this chapter).
Emerging
growth company ¨
If
an emerging growth company, indicate by check mark if the registrant has elected not to use the extended transition period for
complying with any new or revised financial accounting standards provided pursuant to Section 13(a) of the Exchange
Act ¨
Item 7.01. Regulation FD Disclosure.
The slide presentation furnished as Exhibit 99.1 hereto, and incorporated
herein by reference, will be presented to certain investors of GMS on August 9, 2023, and may be used by GMS in various other presentations
to investors on or after August 9, 2023.
In accordance with General Instruction B.2 of Form 8-K, the information
in this Item 7.01 of this Current Report on Form 8-K, including Exhibit 99.1 attached hereto, shall not be deemed “filed”
for purposes of Section 18 of the Securities Exchange Act of 1934, as amended (the “Exchange Act”), or otherwise subject
to the liabilities of that section, nor shall it be deemed incorporated by reference in any filing under the Securities Act of 1933, as
amended, or the Exchange Act, except as shall be expressly set forth by specific reference in such a filing.
Item 9.01. Financial Statements and Exhibits.
(d) Exhibits.
*Furnished herewith
SIGNATURES
Pursuant to the requirements of the Securities
Exchange Act of 1934, the Registrant has duly caused this report to be signed on its behalf by the undersigned hereunto duly authorized.
| |
GMS INC. |
| |
|
|
|
| |
|
|
|
| Date: August 9, 2023 |
By: |
/s/ Scott M. Deakin |
| |
|
Name: |
Scott M. Deakin |
| |
|
Title: |
Chief Financial Officer |
Exhibit 99.1

Investor Overview August 2023
2 Safe Harbor and B asis of Presentation Forward - Looking Statement Safe Harbor — This presentation includes “forward - looking statements” within the meaning of the Private Securities Litigation Reform Act of 1995. You can generally identify forward - looking statements by the Company’s use of forward - looking terminology such as “anticipate,” “bel ieve,” “confident,” “continue,” “could,” “estimate,” “expect,” “intend,” “may,” “might,” “plan,” “potential,” “predict,” “seek,” or “should,” or the negative thereof or other variations th ere on or comparable terminology. In particular, statements about the markets in which GMS operates and our products, including potential growth in those markets and products, the economy general ly, our ability to continue successfully navigating the evolving operating environment and executing our business, strategic initiatives and priorities and growth potential, future M&A and greenfields , product availability, inflation, capital structure, pricing, volumes, net sales, organic sales, gross margins, incremental EBITDA, Adjusted EBITDA, Adjusted EBITDA ma rgi n, interest expense, tax rates, capital expenditures, free cash flow, cash flow generation and working capital management, future financial performance and liquidity, the ability of the Company to grow stronger, the ability to deliver growth, value creation and long - term success, and the Company’s cost reduction initiatives and results thereof contained in this present ation may be considered forward - looking statements. Statements about our expectations, beliefs, plans, strategies, objectives, prospects, assumptions or future events or perform anc e may be considered forward - looking statements. The Company has based forward - looking statements on its current expectations, assumptions, estimates and projections. While the Comp any believes these expectations, assumptions, estimates and projections are reasonable, such forward - looking statements are only predictions and involve known and unknown ris ks and uncertainties, many of which are beyond its control, including current public health issues that may affect the Company’s business. Forward - looking statements involve risks and uncertainties, including, but not limited to, those described in the “Risk Factors” section in the Company’s most recent Annual Report on Form 10 - K, and in its other periodic repor ts filed with the SEC. In addition, the statements in this release are made as of August 9, 2023. The Company undertakes no obligation to update any of the forward - looking statements made herein, whether as a result of new information, future events, changes in expectation or otherwise. These forward - looking statements should not be relied upon as representing t he Company’s views as of any date subsequent to August 9, 2023. Use of Non - GAAP and Adjusted Financial Information — To supplement GAAP financial information, we use adjusted measures of operating results which are non - GAAP measures. This non - GAAP adjusted financial information is provided as additional information for investors. These adjusted results exclude certain costs, expenses, gains and losses, and we believe their exclusion can enhance an overall understanding of our past financial performance and also our prospects for the fu ture. These adjustments to our GAAP results are made with the intent of providing both management and investors a more complete understanding of our operating performance by excl udi ng non - recurring, infrequent or other non - cash charges that are not believed to be material to the ongoing performance of our business. The presentation of this additional inf ormation is not meant to be considered in isolation or as a substitute for GAAP measures of net income, diluted earnings per share or net cash provided by (used in) operating activities pr epared in accordance with generally accepted accounting principles in the United States. Please see the Appendix to this presentation for a further discussion on these non - GAAP measure s and a reconciliation of these non - GAAP measures to the most directly comparable GAAP measures.
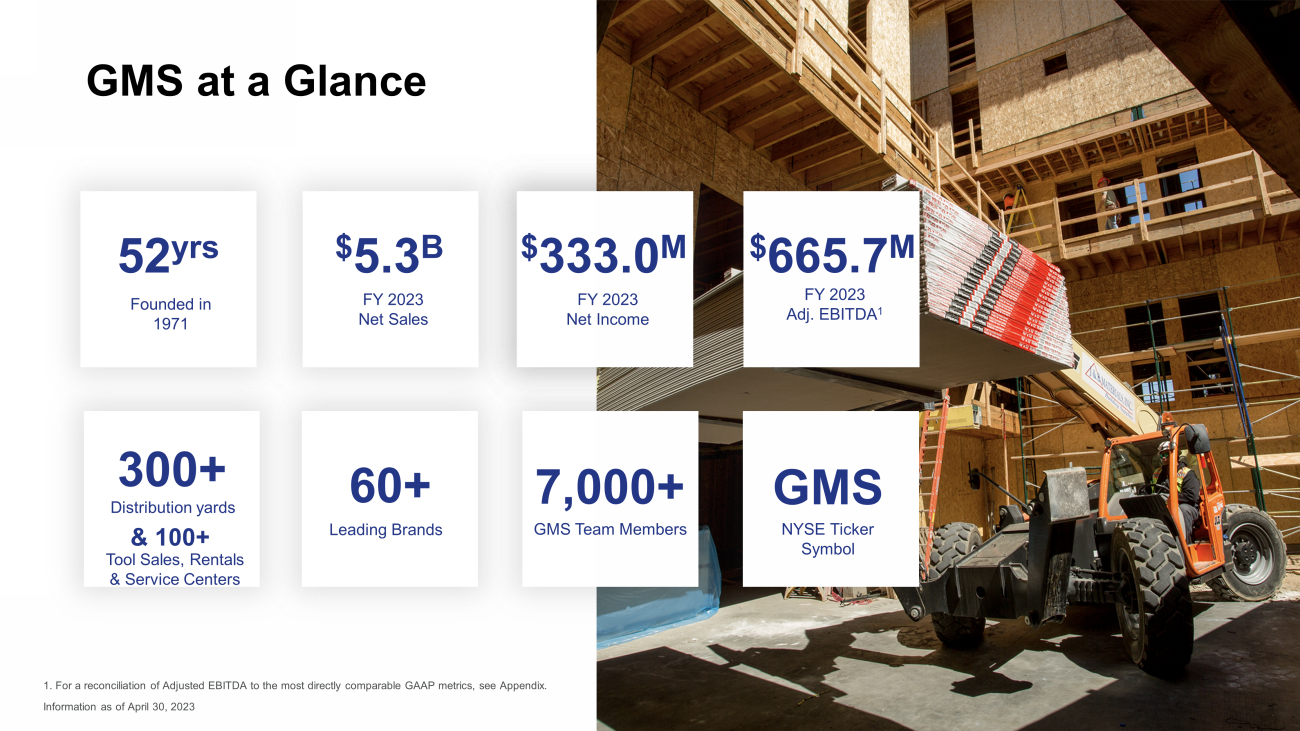
3 Fiscal 2022 Net Sales 52 yrs FY 2023 Net Sales $ 5.3 B 300+ Distribution yards GMS at a Glance 7,000+ GMS Team Members NYSE Ticker Symbol GMS & 100+ Tool Sales, Rentals & Service Centers 1. For a reconciliation of Adjusted EBITDA to the most directly comparable GAAP metrics, see Appendix. Information as of April 30, 2023 FY 2023 Net Income $ 333.0 M Founded in 1971 Leading Brands 60+ FY 2023 Adj. EBITDA 1 $ 665.7 M
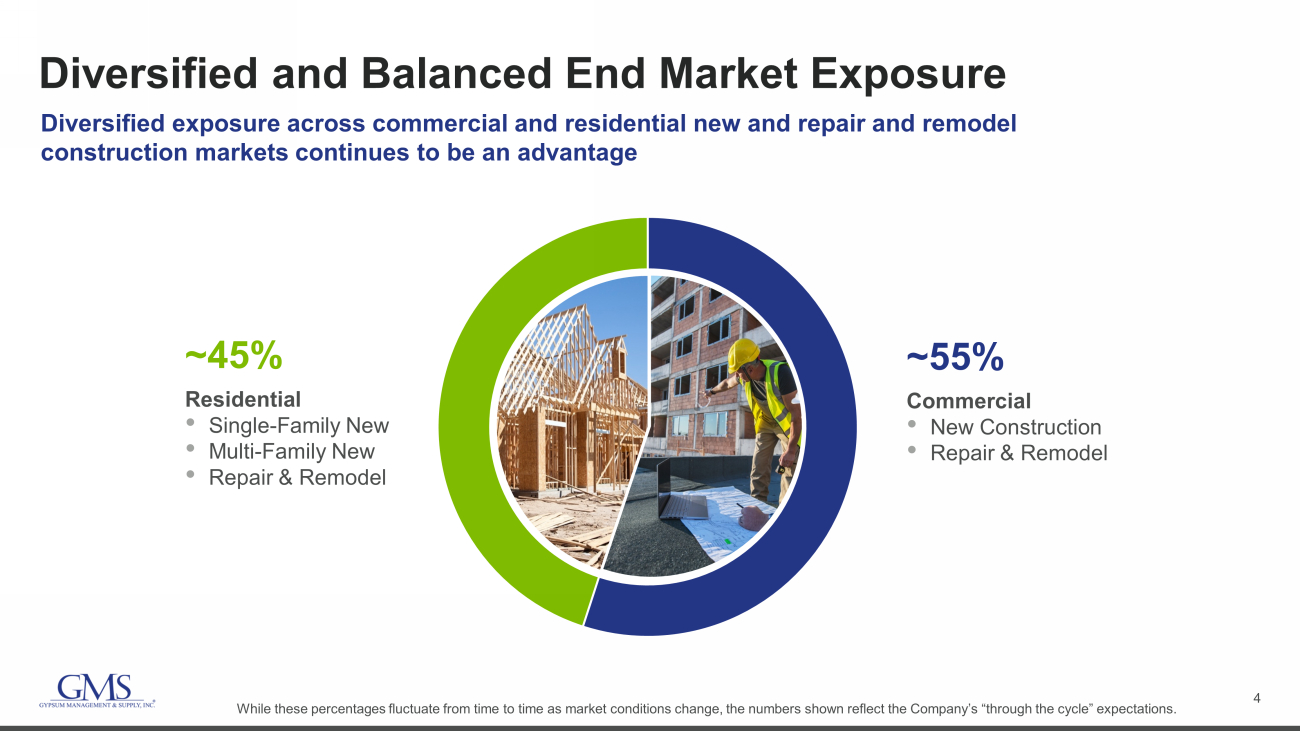
4 Diversified and Balanced End Market Exposure Diversified exposure across commercial and residential new and repair and remodel construction markets continues to be an advantage Residential • Single - Family New • Multi - Family New • Repair & Remodel ~45% Commercial • New Construction • Repair & Remodel ~55% While these percentages fluctuate from time to time as market conditions change, the numbers shown reflect the Company’s “thr oug h the cycle” expectations.
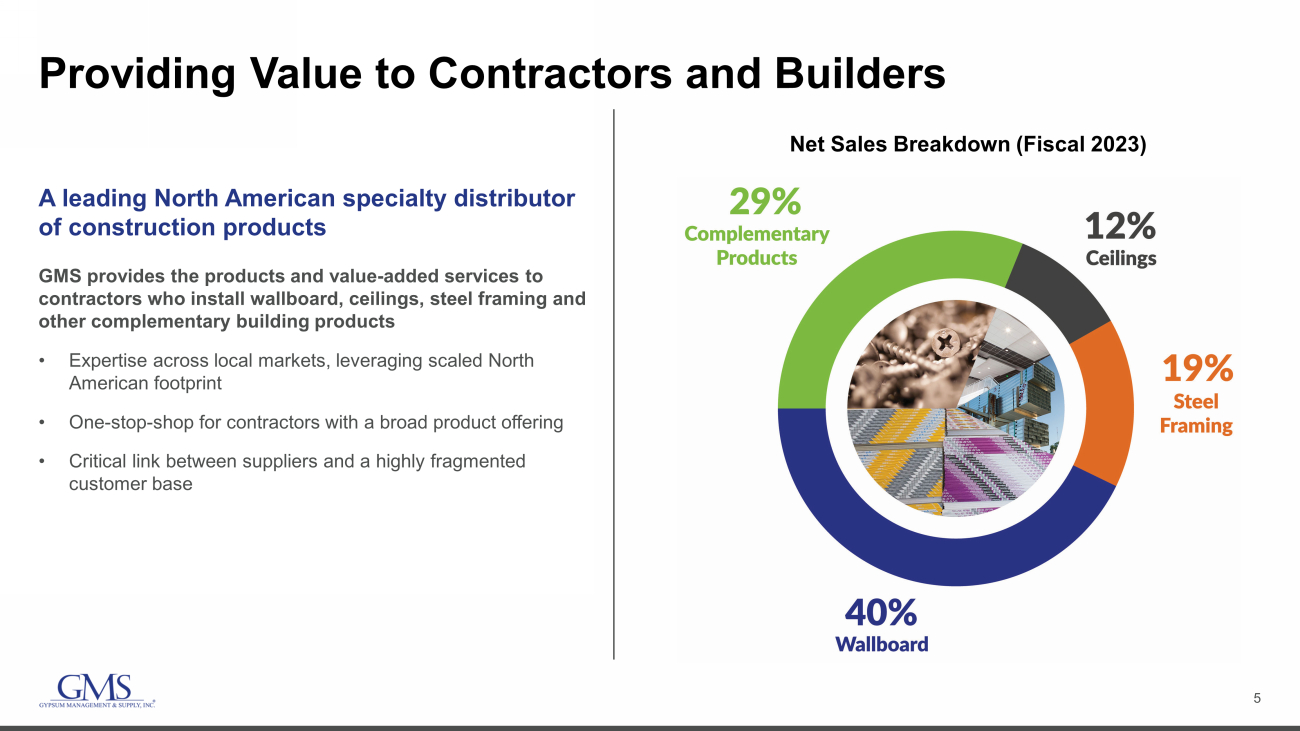
5 Providing Value to Contractors and Builders A leading North American specialty distributor of construction products GMS provides the products and value - added services to contractors who install wallboard, ceilings, steel framing and other complementary building products • Expertise across local markets, leveraging scaled North American footprint • One - stop - shop for contractors with a broad product offering • Critical link between suppliers and a highly fragmented customer base Net Sales Breakdown (Fiscal 2023)
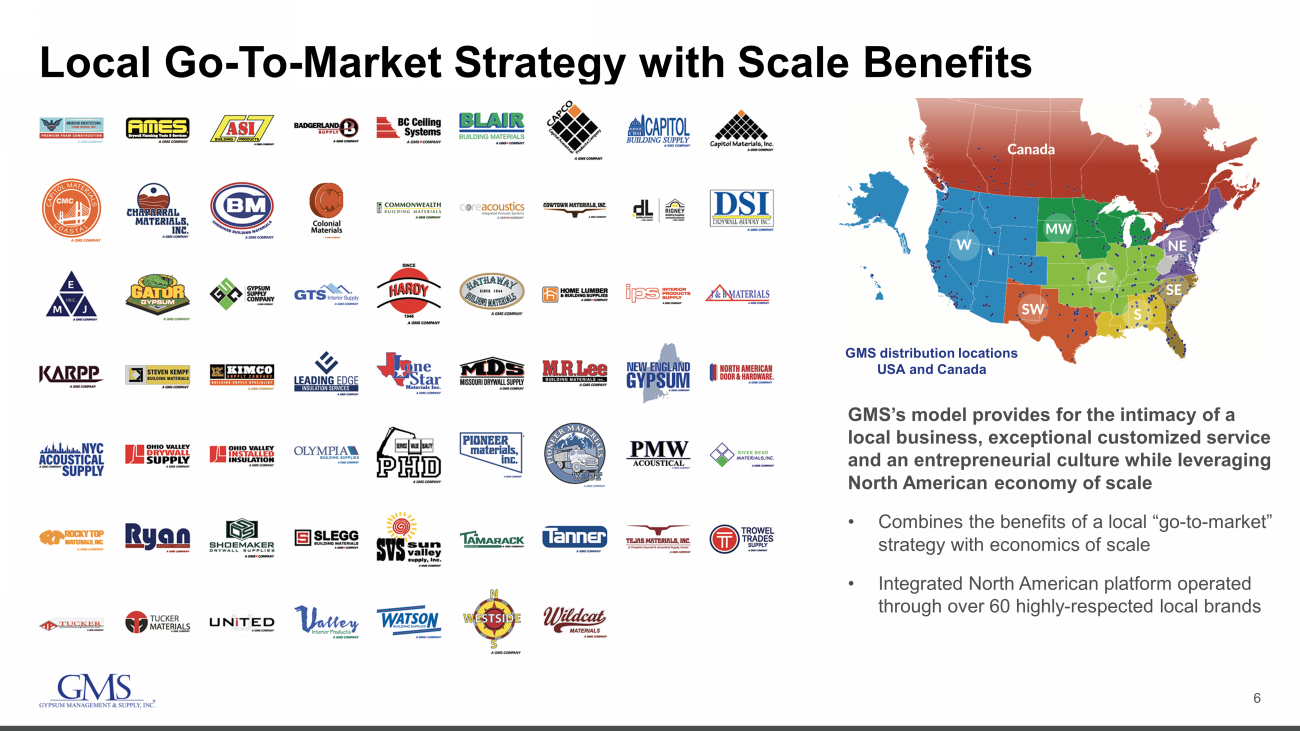
6 Local Go - To - Market Strategy with Scale Benefits GMS distribution locations USA and Canada GMS’s model provides for the intimacy of a local business, exceptional customized service and an entrepreneurial culture while leveraging North American economy of scale • Combines the benefits of a local “go - to - market” strategy with economics of scale • Integrated North American platform operated through over 60 highly - respected local brands

7 FY23 Net Income $ 333 M FY23 Cash from Operations GMS – FY2023 Highlights FY23 Free Cash Flow* *For a reconciliation of Adjusted EBITDA or Free Cash Flow to the most directly comparable GAAP metrics, see Appendix. Unless indicated otherwise, comparisons are to full year fiscal 2022. FY23 Adj. EBITDA* $ 665.7 M FY23 Net Sales $ 5.3 B Up 15% Up 22% Up 17% $ 441.7 M Up 146% $ 389.1 M Up 181% 6.2% FY23 Net Income Margin Up 30 bps Despite a pullback in single - family demand and lower steel prices, GMS delivered solid results for Q423 with year - over - year increases in net sales and Adjusted EBITDA * . $1,858 $2,319 $2,511 $3,116 $3,241 $3,299 $4,635 $5,329 7.4% 8.1% 7.9% 9.5% 9.2% 9.7% 12.2% 12.5% FY-16 FY-17 FY-18 FY-19 FY-20 FY-21 FY-22 FY-23 Net Sales Adj. EBITDA Margin* $ millions Record Full Year Results 12.5% FY23 Adj. EBITDA Margin* Up 30 bps

8 Strategic Growth Priorities – Q4 Fiscal 2023 Update Capitalize on existing fixed investments in locations and equipment where we are underpenetrated or below expected share Grow Complementary Products opportunities outside of core products to diversify and profitably expand our offerings Expand the platform through accretive acquisition and greenfield opportunities Leverage our scale and employ technology and best practices to deliver a best - in - class customer experience and further profit improvement • Industry data indicates that we are maintaining or growing share in each of our core product categories • We have strengthened relationships and successfully won business in all of our end markets • Solid growth in Architectural Specialty Ceilings • Benefits of scale and our commitment to service provide value to our customers and confidence for continued growth in our core products • 4.0% per day net sales growth • 1.5% per day organic sales growth • 12 th straight quarter of growth for this category • The Complementary Products Taskforce facilitates the sharing of best practices, identifies areas of opportunity, leverages our scale and consolidates vendors where sensible. • During the 4 th quarter we: • Acquired EMJ in Chicago and Blair Building Materials in Toronto • Opened a greenfield yard in Ontario, Canada • Opened two new AMES store locations • For the full year, we completed four acquisitions and opened six new greenfield yards and 11 AMES stores • Enhancing our role as a valuable partner by providing customers with the ability to easily transact with us. • Building our “Yard of the Future” to improve efficiency, productivity and profitability while delivering greater value to our customers and stakeholders • Organization - wide effort to reduce complexity cost • Driving purchasing and operational efficiencies and helping to offset operational cost increases Expand Share in Core Products Grow Complementary Products Platform Expansion Drive Improved Productivity & Profitability As we’ve leveraged inflationary dynamics in the business, our productivity initiatives, along with growth in Complementary Products and expansion of scale, have enabled us to expand our Adjusted EBITDA margin from the upper single - digits in the years leading up to Covid to now consistently reporting these returns at double - digit levels for the past two fiscal years.

9 20% 19% 16% 45% 29% 12% 19% 40% Continuing to Diversify and Profitably Expand Offerings Successfully Growing Complementary Products Complementary Products 2014 Net Sales: $1.4B NET SALES BREAKDOWN (FISCAL 2014) 2023 Net Sales: $5.3B NET SALES BREAKDOWN (FISCAL 2023) Complementary Products Ceilings Steel Framing Wallboard Up from 20% to 29% of sales from FY2014 to FY2023 Net Sales by Product Category Core Products: • Wallboard: Used to finish the interior walls and ceilings in residential, commercial and institutional construction projects • Ceilings: Suspended ceiling systems comprised primarily of acoustical solutions for commercial spaces including mineral fiber tiles and grid as well as architectural specialties such as wood, steel and other unique finishes • Steel Framing: Steel framing products sold into commercial applications, typically as part of a package with wallboard, ceilings and other products *

10 Track Record of Successful Platform Expansion Date Acquisition/Greenfield Locations Strategic Rationale May - 23 ▪ 1 Location – Victoria, BC ▪ Margin - accretive Complementary Products acquisition in desirable Vancouver Island market Apr - 23 ▪ 1 Location – Toronto, ON area ▪ Margin - accretive Complementary Products acquisition adding new product lines in the Greater Toronto area Apr - 23 ▪ 4 Locations – Chicago, Atlanta, Charlotte ▪ Strategic Chicago area acquisition to increase market serviceability and gain access to key vendor relationships Mar - 23 Ottawa ▪ Ottawa, ON ▪ New location for D.L. Building Materials expansion in Ottawa Jan - 23 New York City ▪ Brooklyn, NY ▪ Inaugural location focused on Ceilings products in the New York City market Nov - 22 South Richmond ▪ Chester, VA ▪ Expands market service coverage in the Richmond, VA market for Commonwealth Building Materials Completed 90+ acquisitions and greenfields since May 2014. All U.S. yard locations are fully integrated into the GMS platform Since August 2014, GMS has acquired 45 companies representing a total of ~126 distribution locations Since August 2014, GMS has opened an additional ~49 organic greenfield locations , complementing acquisition strategy Since acquiring AMES Taping Tools in December 2021, GMS has opened 14 new AMES store locations Select Recent GMS Expansion As of June 2023
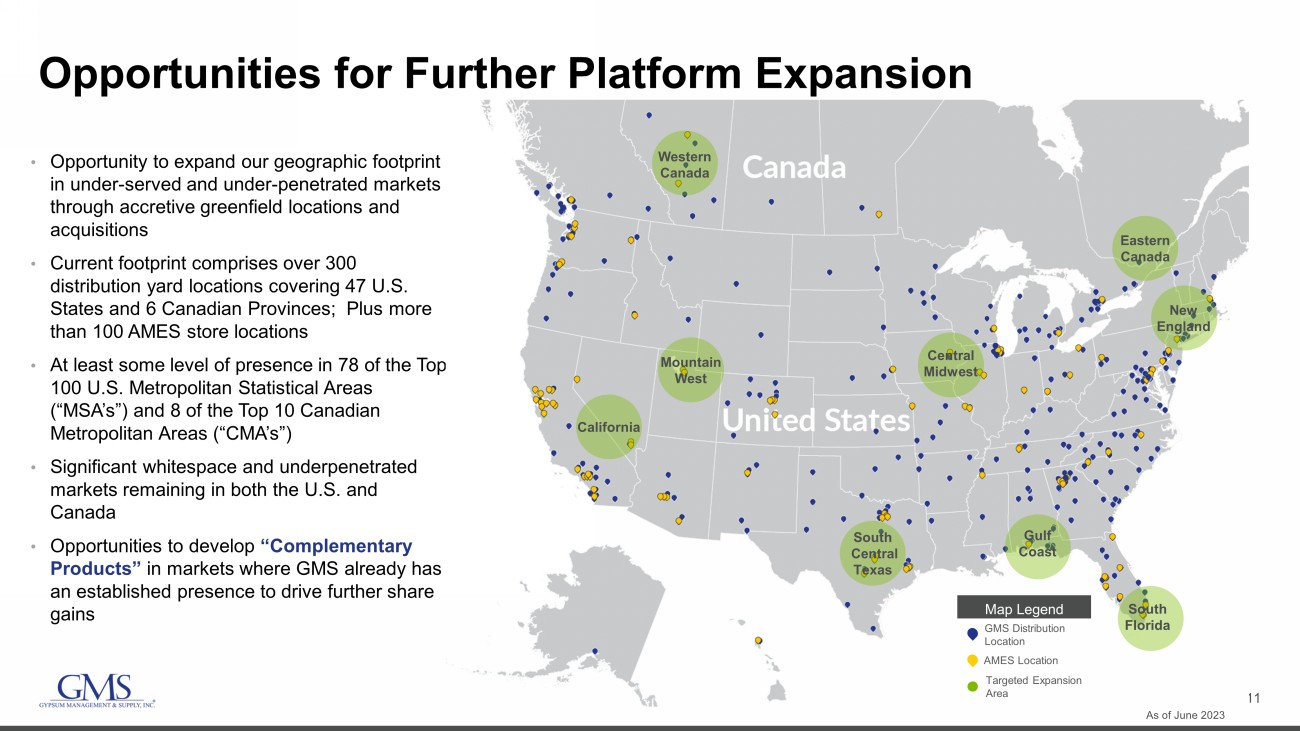
11 Opportunities for Further Platform Expansion • Opportunity to expand our geographic footprint in under - served and under - penetrated markets through accretive greenfield locations and acquisitions • Current footprint comprises over 300 distribution yard locations covering 47 U.S. States and 6 Canadian Provinces; Plus more than 100 AMES store locations • At least some level of presence in 78 of the Top 100 U.S. Metropolitan Statistical Areas (“MSA’s”) and 8 of the Top 10 Canadian Metropolitan Areas (“CMA’s”) • Significant whitespace and underpenetrated markets remaining in both the U.S. and Canada • Opportunities to develop “Complementary Products” in markets where GMS already has an established presence to drive further share gains As of June 2023 GMS Distribution Location Map Legend Targeted Expansion Area California Mountain West Western Canada South Central Texas Central Midwest Gulf Coast New England Eastern Canada South Florida AMES Location

12 Attractive Capital Structure Supports Strategic Priorities Repurchased 2.3 million shares for $110.6 million during FY23; $100.2 million of repurchase authorization remaining at 4/30/23 $89.9 1.8x 1.8x 1.6x 1.6x 1.4x 4/30/2022 7/31/2022 10/31/2022 1/31/2023 4/30/2023 $52 $38 $31 $25 $128 $831 FY24 FY25 FY26 FY27 FY28 Thereafter LTM Net Debt / PF Adjusted EBITDA 2 Debt 3 Maturity Schedule as of 04/30/23 Adjusted for Amended Term Loan $ in millions 1. For a reconciliation of free cash flow to cash used in operating activities, the most directly comparable GAAP metric, see Ap pen dix. 2. For detail, including a reconciliation of Pro Forma Adjusted EBITDA to net income, the most directly comparable GAAP metric, see Appendix. 3. Debt includes First Lien Term Loan, ABL Facility, Senior Notes, Finance Leases & Installment Notes. 4. Includes cash used for Capital Expenditures, Acquisitions, Share Repurchases, Payments on Principal on Long - Term Debt and Paymen ts on Principal on Finance Lease Obligations for fiscal years 2021, 2022 and 2023 Increased Share Repurchase Activity FY23 Cash from Operations $ 441.7 M Up 146% Higher capital expenditures due to opportunistic purchases of off - lease equipment and certain building and leasehold improvements FY23 Free Cash Flow 1 $ 389.1 M Down 3.2% Substantial Liquidity $164.7 million of cash on hand and $759.2 million available under our revolving credit facilities at 4/30/23 Acquisitions 53% Share Repurchases 18% Capital Expenditures 15% Debt/Lease Payments 14% 3 - Year Historical Use of Cash 4 Up 181%

13 GMS is Well Positioned across Commercial and Residential Markets with Scale and Balanced Product Mix • Continue to see near - term high levels of multi - family residential activity • While varying by region, we expect single - family demand levels to continue to improve from lows experienced over the last ~8 - 12 months. We expect continued near - term YOY declines as we roll over challenging comparisons, but we also expect those to improve over the balance of the fiscal year as our current run rates and comments from some large builders continue to provide encouraging signs for the single - family end market. • Year - over - year improvement in commercial construction activity expected in near - term • Favorable demographics in an underbuilt industry provides support for the medium - to long - term • Opened 32 greenfield locations and completed 15 strategic acquisitions* since the start of fiscal 2020 to enhance customer service, drive growth in product offerings and improve efficiencies, all while reducing our net debt leverage ratio from 3.6x at April 30, 2019 to 1.4x at April 30, 2023 • Continuing to modernize and upgrade fleet, adding safety features to protect employees and customers and for risk management benefits • Technology investments to automate work has led to increased productivity, making us better operators • Lowering complexity costs in the business Strategic Investments Position GMS for Near - Term Industry Dynamics & Long - Term Success Industry Fundamentals Support Outlook *Greenfield and acquisition totals are calculated since the start of fiscal 2020 through April 30, 2023. Therefore, excluded fr om these totals is the acquisition of Jawl Lumber Corporation on Vancouver Island, which was completed just after the end of fiscal 2023.
14 Appendix
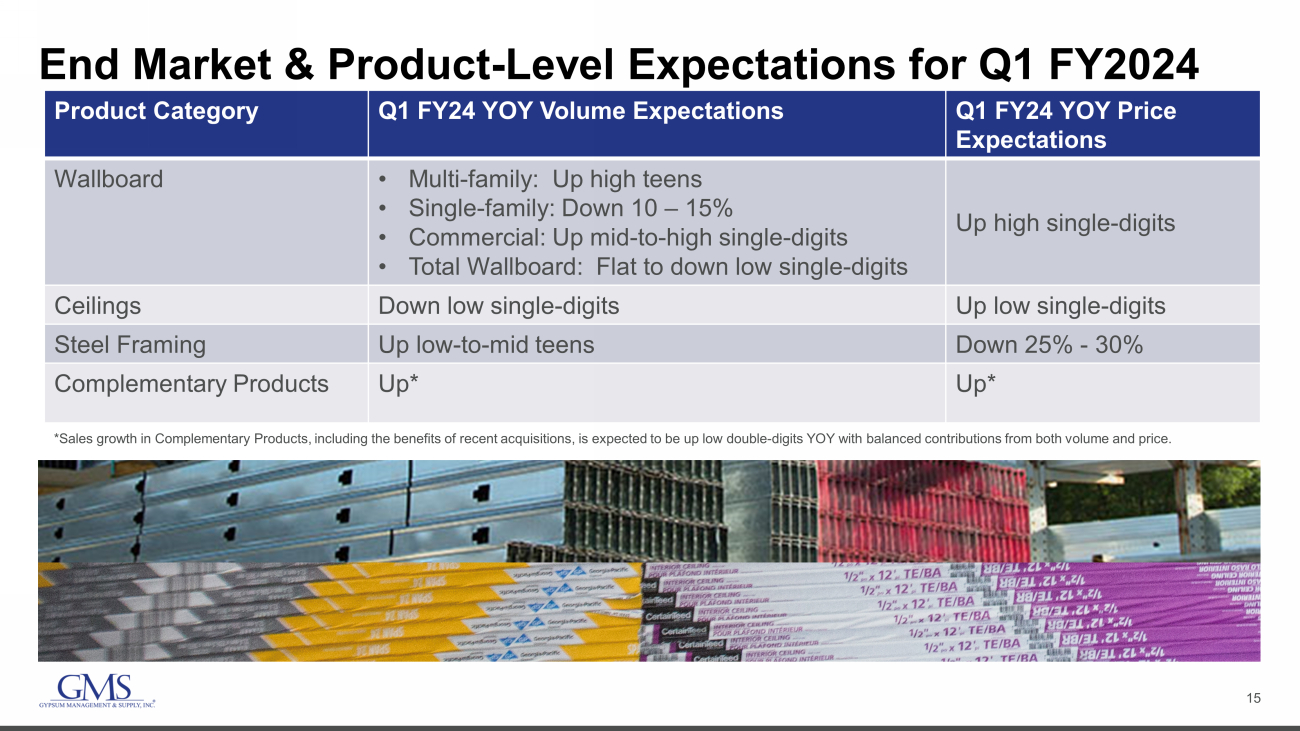
15 End Market & Product - Level Expectations for Q1 FY2024 Product Category Q1 FY24 YOY Volume Expectations Q1 FY24 YOY Price Expectations Wallboard • Multi - family: Up high teens • Single - family: Down 10 – 15% • Commercial: Up mid - to - high single - digits • Total Wallboard: Flat to down low single - digits Up high single - digits Ceilings Down low single - digits Up low single - digits Steel Framing Up low - to - mid teens Down 25% - 30% Complementary Products Up* Up* *Sales growth in Complementary Products, including the benefits of recent acquisitions, is expected to be up low double - digits Y OY with balanced contributions from both volume and price.
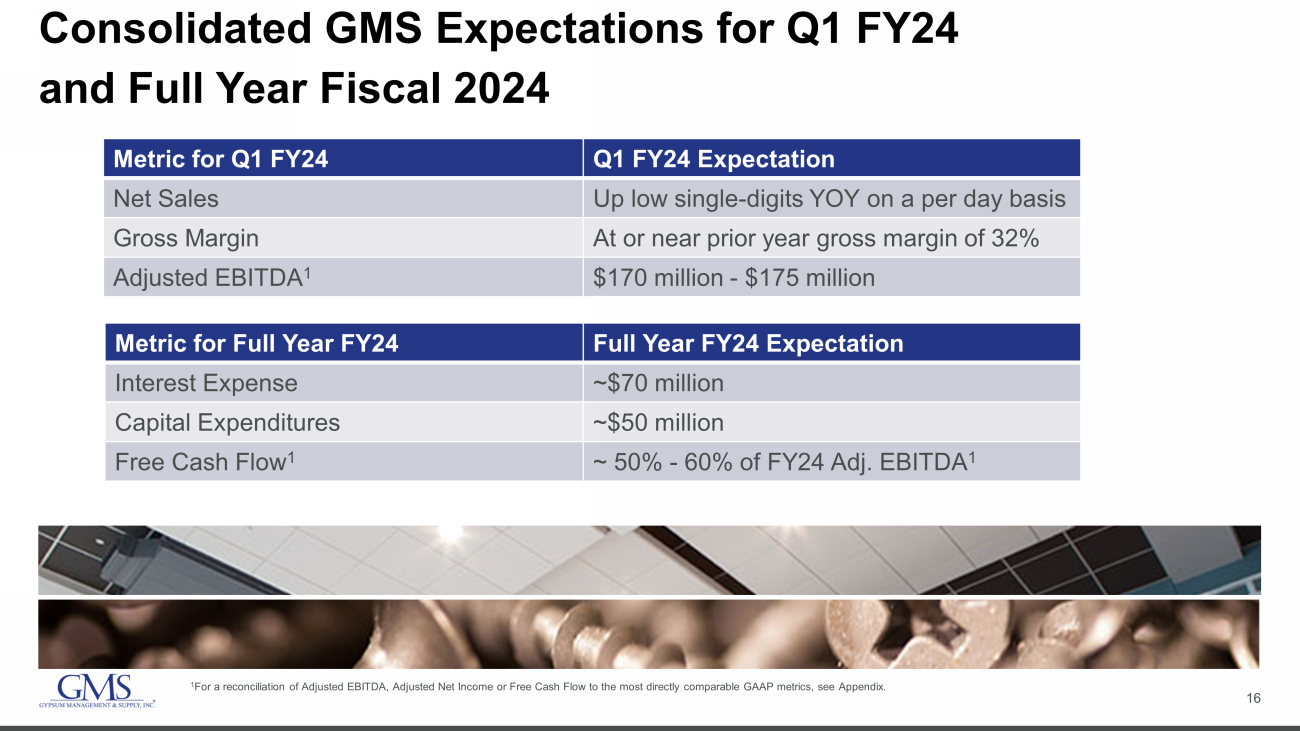
16 Consolidated GMS Expectations for Q1 FY24 and Full Year Fiscal 2024 Metric for Q1 FY24 Q1 FY24 Expectation Net Sales Up low single - digits YOY on a per day basis Gross Margin At or near prior year gross margin of 32% Adjusted EBITDA 1 $170 million - $175 million Metric for Full Year FY24 Full Year FY24 Expectation Interest Expense ~$70 million Capital Expenditures ~$50 million Free Cash Flow 1 ~ 50% - 60% of FY24 Adj. EBITDA 1 1 For a reconciliation of Adjusted EBITDA, Adjusted Net Income or Free Cash Flow to the most directly comparable GAAP metrics, see Appendix.
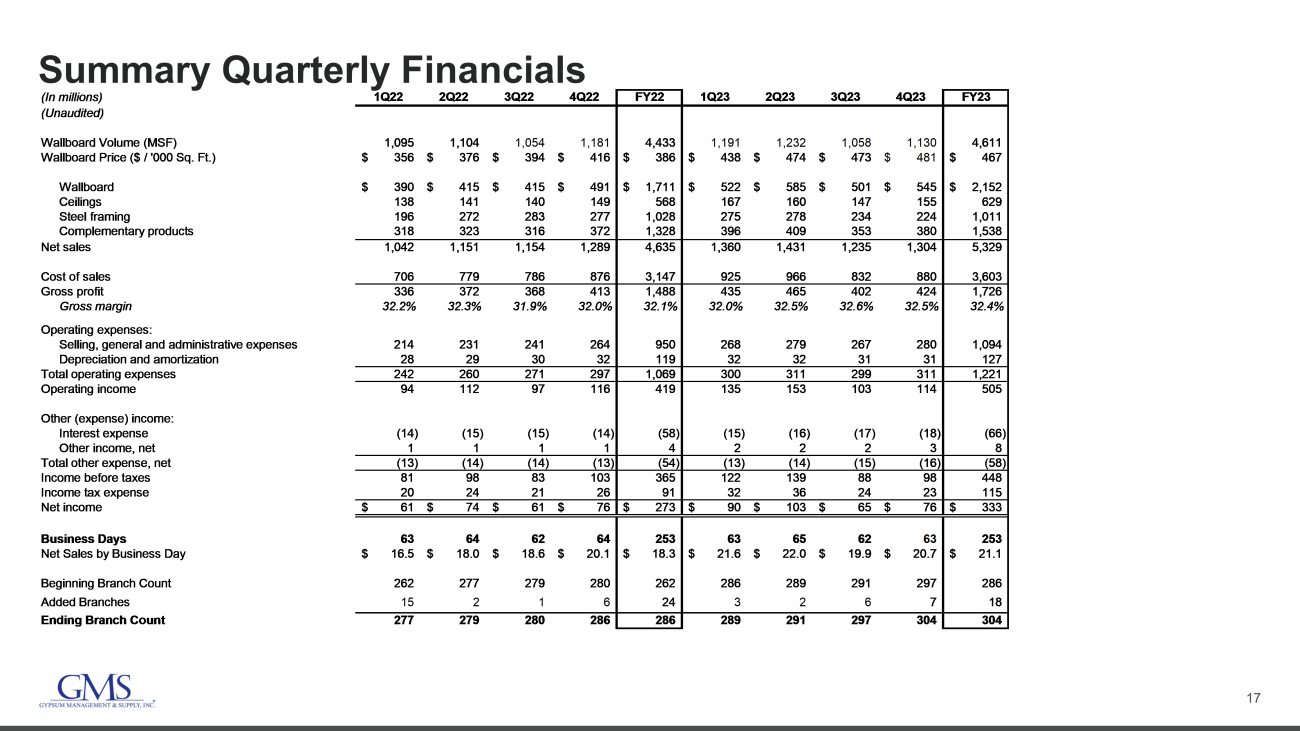
17 Summary Quarterly Financials (In millions) 1Q22 2Q22 3Q22 4Q22 FY22 1Q23 2Q23 3Q23 4Q23 FY23 (Unaudited) Wallboard Volume (MSF) 1,095 1,104 1,054 1,181 4,433 1,191 1,232 1,058 1,130 4,611 Wallboard Price ($ / '000 Sq. Ft.) 356$ 376$ 394$ 416$ 386$ 438$ 474$ 473$ 481$ 467$ Wallboard 390$ 415$ 415$ 491$ 1,711$ 522$ 585$ 501$ 545$ 2,152$ Ceilings 138 141 140 149 568 167 160 147 155 629 Steel framing 196 272 283 277 1,028 275 278 234 224 1,011 Complementary products 318 323 316 372 1,328 396 409 353 380 1,538 Net sales 1,042 1,151 1,154 1,289 4,635 1,360 1,431 1,235 1,304 5,329 Cost of sales 706 779 786 876 3,147 925 966 832 880 3,603 Gross profit 336 372 368 413 1,488 435 465 402 424 1,726 Gross margin 32.2% 32.3% 31.9% 32.0% 32.1% 32.0% 32.5% 32.6% 32.5% 32.4% Operating expenses: Selling, general and administrative expenses 214 231 241 264 950 268 279 267 280 1,094 Depreciation and amortization 28 29 30 32 119 32 32 31 31 127 Total operating expenses 242 260 271 297 1,069 300 311 299 311 1,221 Operating income 94 112 97 116 419 135 153 103 114 505 Other (expense) income: Interest expense (14) (15) (15) (14) (58) (15) (16) (17) (18) (66) Other income, net 1 1 1 1 4 2 2 2 3 8 Total other expense, net (13) (14) (14) (13) (54) (13) (14) (15) (16) (58) Income before taxes 81 98 83 103 365 122 139 88 98 448 Income tax expense 20 24 21 26 91 32 36 24 23 115 Net income 61$ 74$ 61$ 76$ 273$ 90$ 103$ 65$ 76$ 333$ Business Days 63 64 62 64 253 63 65 62 63 253 Net Sales by Business Day 16.5$ 18.0$ 18.6$ 20.1$ 18.3$ 21.6$ 22.0$ 19.9$ 20.7$ 21.1$ Beginning Branch Count 262 277 279 280 262 286 289 291 297 286 Added Branches 15 2 1 6 24 3 2 6 7 18 Ending Branch Count 277 279 280 286 286 289 291 297 304 304
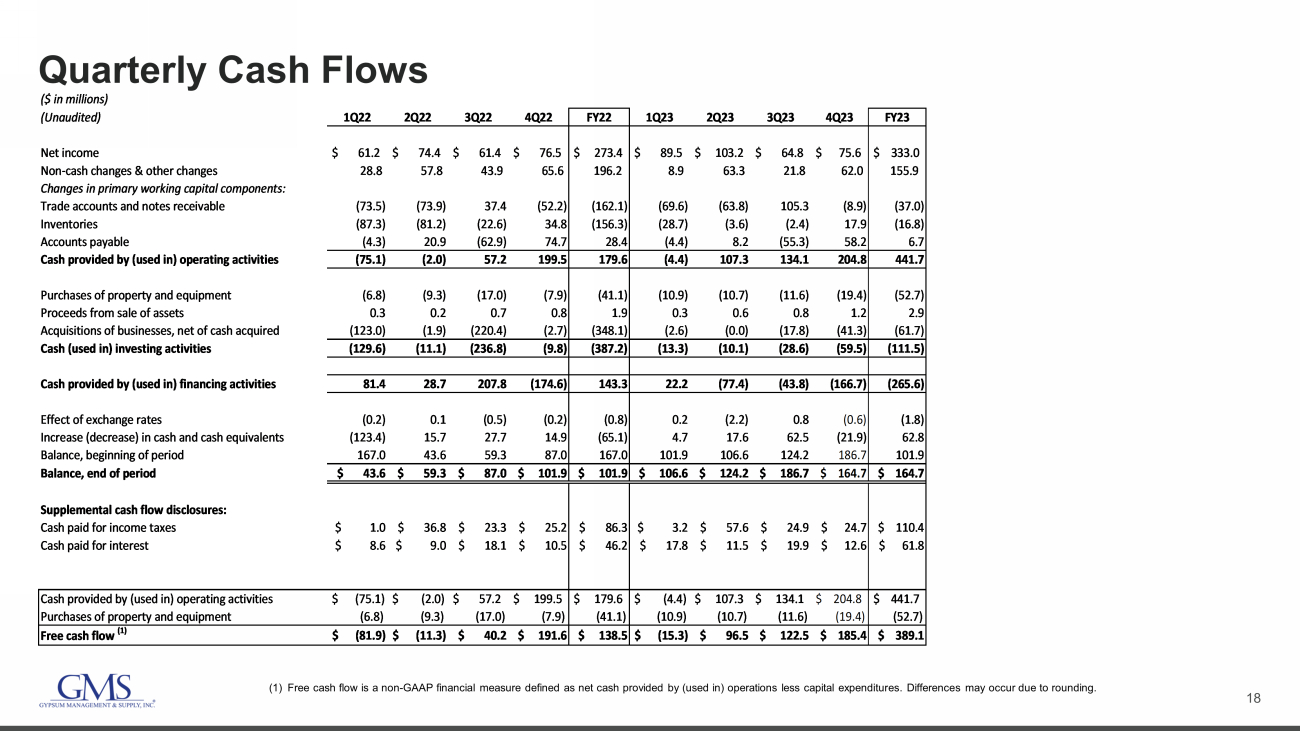
18 Quarterly Cash Flows (1) Free cash flow is a non - GAAP financial measure defined as net cash provided by (used in) operations less capital expenditures. D ifferences may occur due to rounding. ($ in millions) (Unaudited) 1Q22 2Q22 3Q22 4Q22 FY22 1Q23 2Q23 3Q23 4Q23 FY23 Net income $ 61.2 $ 74.4 $ 61.4 $ 76.5 $ 273.4 $ 89.5 $ 103.2 $ 64.8 $ 75.6 $ 333.0 Non-cash changes & other changes 28.8 57.8 43.9 65.6 196.2 8.9 63.3 21.8 62.0 155.9 Changes in primary working capital components: Trade accounts and notes receivable (73.5) (73.9) 37.4 (52.2) (162.1) (69.6) (63.8) 105.3 (8.9) (37.0) Inventories (87.3) (81.2) (22.6) 34.8 (156.3) (28.7) (3.6) (2.4) 17.9 (16.8) Accounts payable (4.3) 20.9 (62.9) 74.7 28.4 (4.4) 8.2 (55.3) 58.2 6.7 Cash provided by (used in) operating activities (75.1) (2.0) 57.2 199.5 179.6 (4.4) 107.3 134.1 204.8 441.7 Purchases of property and equipment (6.8) (9.3) (17.0) (7.9) (41.1) (10.9) (10.7) (11.6) (19.4) (52.7) Proceeds from sale of assets 0.3 0.2 0.7 0.8 1.9 0.3 0.6 0.8 1.2 2.9 Acquisitions of businesses, net of cash acquired (123.0) (1.9) (220.4) (2.7) (348.1) (2.6) (0.0) (17.8) (41.3) (61.7) Cash (used in) investing activities (129.6) (11.1) (236.8) (9.8) (387.2) (13.3) (10.1) (28.6) (59.5) (111.5) Cash provided by (used in) financing activities 81.4 28.7 207.8 (174.6) 143.3 22.2 (77.4) (43.8) (166.7) (265.6) Effect of exchange rates (0.2) 0.1 (0.5) (0.2) (0.8) 0.2 (2.2) 0.8 (0.6) (1.8) Increase (decrease) in cash and cash equivalents (123.4) 15.7 27.7 14.9 (65.1) 4.7 17.6 62.5 (21.9) 62.8 Balance, beginning of period 167.0 43.6 59.3 87.0 167.0 101.9 106.6 124.2 186.7 101.9 Balance, end of period $ 43.6 $ 59.3 $ 87.0 $ 101.9 $ 101.9 $ 106.6 $ 124.2 $ 186.7 $ 164.7 $ 164.7 Supplemental cash flow disclosures: Cash paid for income taxes $ 1.0 $ 36.8 $ 23.3 $ 25.2 $ 86.3 $ 3.2 $ 57.6 $ 24.9 $ 24.7 $ 110.4 Cash paid for interest $ 8.6 $ 9.0 $ 18.1 $ 10.5 $ 46.2 $ 17.8 $ 11.5 $ 19.9 $ 12.6 $ 61.8 Cash provided by (used in) operating activities $ (75.1) $ (2.0) $ 57.2 $ 199.5 $ 179.6 $ (4.4) $ 107.3 $ 134.1 $ 204.8 $ 441.7 Purchases of property and equipment (6.8) (9.3) (17.0) (7.9) (41.1) (10.9) (10.7) (11.6) (19.4) (52.7) Free cash flow (1) $ (81.9) $ (11.3) $ 40.2 $ 191.6 $ 138.5 $ (15.3) $ 96.5 $ 122.5 $ 185.4 $ 389.1
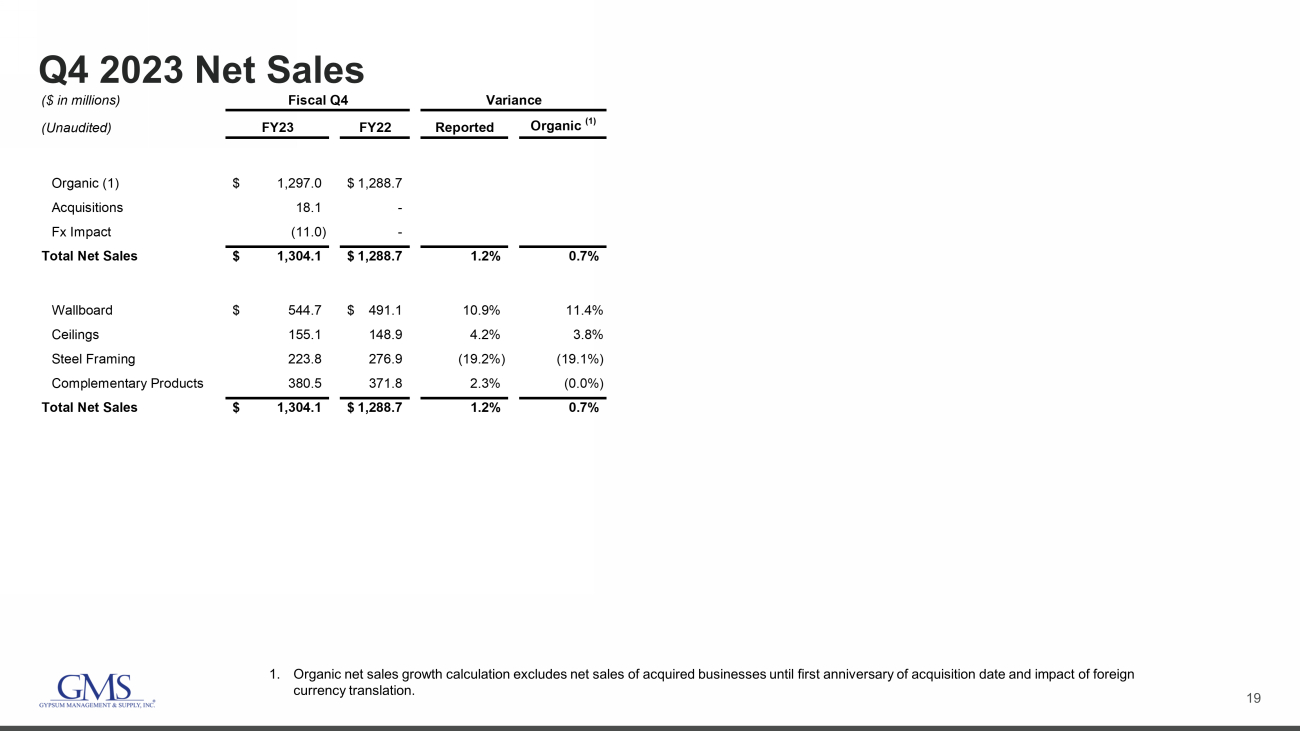
19 Q4 2023 Net Sales 1. Organic net sales growth calculation excludes net sales of acquired businesses until first anniversary of acquisition date an d i mpact of foreign currency translation. ($ in millions) (Unaudited) FY23 FY22 Reported Organic (1) Organic (1) 1,297.0$ 1,288.7$ Acquisitions 18.1 - Fx Impact (11.0) - Total Net Sales 1,304.1$ 1,288.7$ 1.2% 0.7% Wallboard 544.7$ 491.1$ 10.9% 11.4% Ceilings 155.1 148.9 4.2% 3.8% Steel Framing 223.8 276.9 (19.2%) (19.1%) Complementary Products 380.5 371.8 2.3% (0.0%) Total Net Sales 1,304.1$ 1,288.7$ 1.2% 0.7% Fiscal Q4 Variance
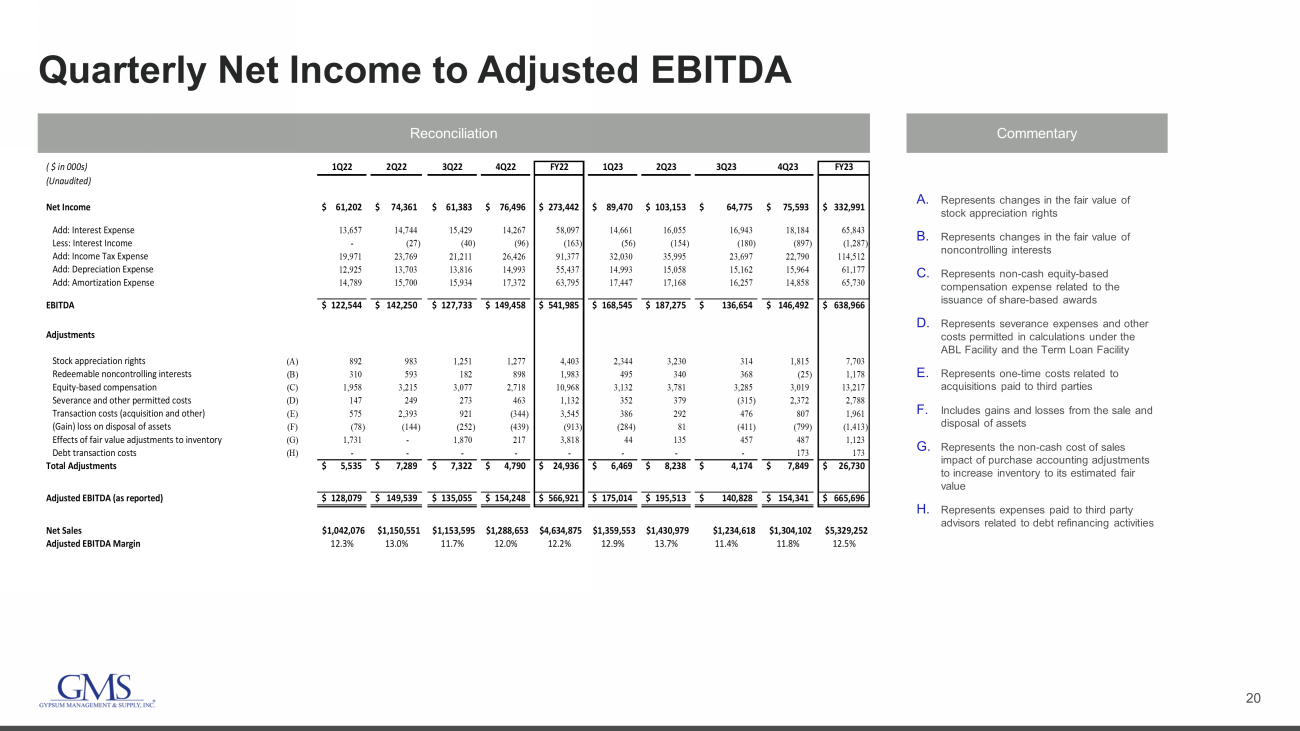
20 Quarterly Net Income to Adjusted EBITDA Reconciliation Commentary A. Represents changes in the fair value of stock appreciation rights B. Represents changes in the fair value of noncontrolling interests C. Represents non - cash equity - based compensation expense related to the issuance of share - based awards D. Represents severance expenses and other costs permitted in calculations under the ABL Facility and the Term Loan Facility E. Represents one - time costs related to acquisitions paid to third parties F. Includes gains and losses from the sale and disposal of assets G. Represents the non - cash cost of sales impact of purchase accounting adjustments to increase inventory to its estimated fair value H. Represents expenses paid to third party advisors related to debt refinancing activities ( $ in 000s) 1Q22 2Q22 3Q22 4Q22 FY22 1Q23 2Q23 3Q23 4Q23 FY23 (Unaudited) Net Income 61,202$ 74,361$ 61,383$ 76,496$ 273,442$ 89,470$ 103,153$ 64,775$ 75,593$ 332,991$ Add: Interest Expense 13,657 14,744 15,429 14,267 58,097 14,661 16,055 16,943 18,184 65,843 Less: Interest Income - (27) (40) (96) (163) (56) (154) (180) (897) (1,287) Add: Income Tax Expense 19,971 23,769 21,211 26,426 91,377 32,030 35,995 23,697 22,790 114,512 Add: Depreciation Expense 12,925 13,703 13,816 14,993 55,437 14,993 15,058 15,162 15,964 61,177 Add: Amortization Expense 14,789 15,700 15,934 17,372 63,795 17,447 17,168 16,257 14,858 65,730 EBITDA 122,544$ 142,250$ 127,733$ 149,458$ 541,985$ 168,545$ 187,275$ 136,654$ 146,492$ 638,966$ Adjustments Stock appreciation rights (A) 892 983 1,251 1,277 4,403 2,344 3,230 314 1,815 7,703 Redeemable noncontrolling interests (B) 310 593 182 898 1,983 495 340 368 (25) 1,178 Equity-based compensation (C) 1,958 3,215 3,077 2,718 10,968 3,132 3,781 3,285 3,019 13,217 Severance and other permitted costs (D) 147 249 273 463 1,132 352 379 (315) 2,372 2,788 Transaction costs (acquisition and other) (E) 575 2,393 921 (344) 3,545 386 292 476 807 1,961 (Gain) loss on disposal of assets (F) (78) (144) (252) (439) (913) (284) 81 (411) (799) (1,413) Effects of fair value adjustments to inventory (G) 1,731 - 1,870 217 3,818 44 135 457 487 1,123 Debt transaction costs (H) - - - - - - - - 173 173 Total Adjustments 5,535$ 7,289$ 7,322$ 4,790$ 24,936$ 6,469$ 8,238$ 4,174$ 7,849$ 26,730$ Adjusted EBITDA (as reported) 128,079$ 149,539$ 135,055$ 154,248$ 566,921$ 175,014$ 195,513$ 140,828$ 154,341$ 665,696$ Net Sales $1,042,076 $1,150,551 $1,153,595 $1,288,653 $4,634,875 $1,359,553 $1,430,979 $1,234,618 $1,304,102 $5,329,252 Adjusted EBITDA Margin 12.3% 13.0% 11.7% 12.0% 12.2% 12.9% 13.7% 11.4% 11.8% 12.5%
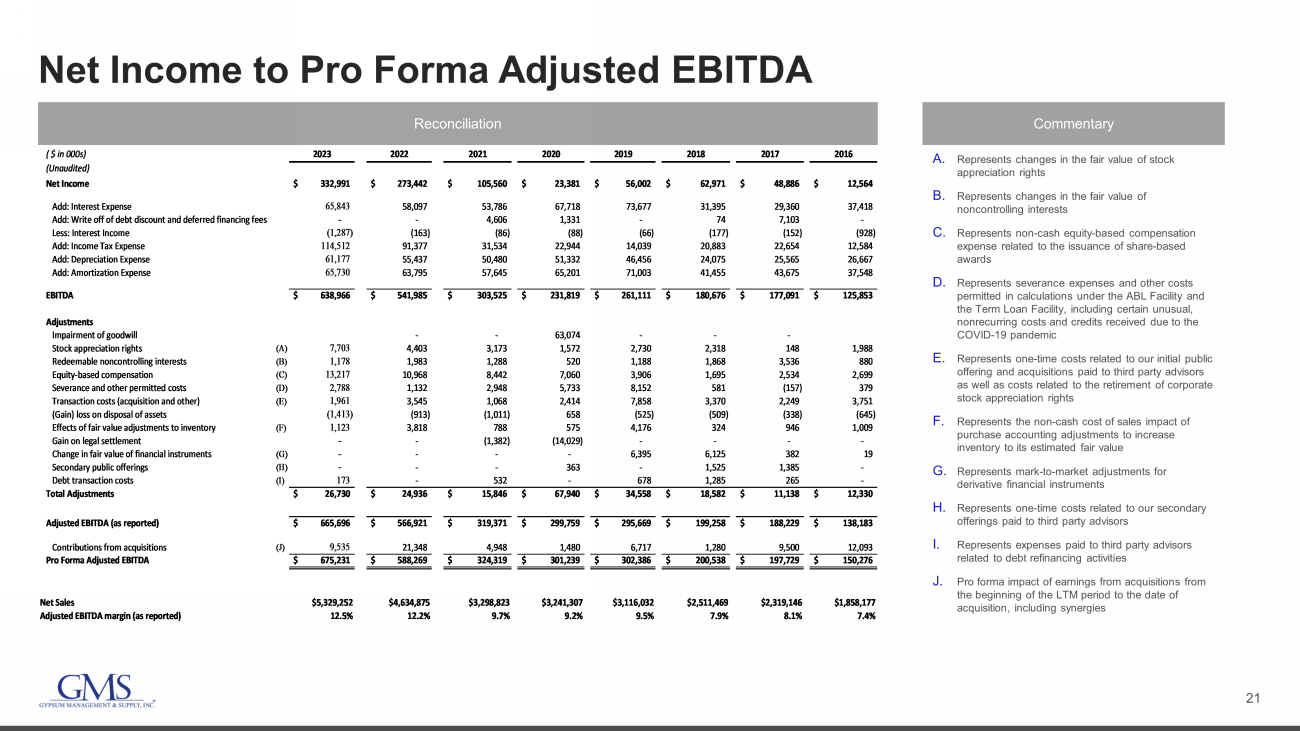
21 Net Income to Pro Forma Adjusted EBITDA Reconciliation Commentary A. Represents changes in the fair value of stock appreciation rights B. Represents changes in the fair value of noncontrolling interests C. Represents non - cash equity - based compensation expense related to the issuance of share - based awards D. Represents severance expenses and other costs permitted in calculations under the ABL Facility and the Term Loan Facility, including certain unusual, nonrecurring costs and credits received due to the COVID - 19 pandemic E. Represents one - time costs related to our initial public offering and acquisitions paid to third party advisors as well as costs related to the retirement of corporate stock appreciation rights F. Represents the non - cash cost of sales impact of purchase accounting adjustments to increase inventory to its estimated fair value G. Represents mark - to - market adjustments for derivative financial instruments H. Represents one - time costs related to our secondary offerings paid to third party advisors I. Represents expenses paid to third party advisors related to debt refinancing activities J. Pro forma impact of earnings from acquisitions from the beginning of the LTM period to the date of acquisition, including synergies ( $ in 000s) 2023 2022 2021 2020 2019 2018 2017 2016 (Unaudited) Net Income 332,991$ 273,442$ 105,560$ 23,381$ 56,002$ 62,971$ 48,886$ 12,564$ Add: Interest Expense 65,843 58,097 53,786 67,718 73,677 31,395 29,360 37,418 Add: Write off of debt discount and deferred financing fees - - 4,606 1,331 - 74 7,103 - Less: Interest Income (1,287) (163) (86) (88) (66) (177) (152) (928) Add: Income Tax Expense 114,512 91,377 31,534 22,944 14,039 20,883 22,654 12,584 Add: Depreciation Expense 61,177 55,437 50,480 51,332 46,456 24,075 25,565 26,667 Add: Amortization Expense 65,730 63,795 57,645 65,201 71,003 41,455 43,675 37,548 EBITDA 638,966$ 541,985$ 303,525$ 231,819$ 261,111$ 180,676$ 177,091$ 125,853$ Adjustments Impairment of goodwill - - 63,074 - - - Stock appreciation rights (A) 7,703 4,403 3,173 1,572 2,730 2,318 148 1,988 Redeemable noncontrolling interests (B) 1,178 1,983 1,288 520 1,188 1,868 3,536 880 Equity-based compensation (C) 13,217 10,968 8,442 7,060 3,906 1,695 2,534 2,699 Severance and other permitted costs (D) 2,788 1,132 2,948 5,733 8,152 581 (157) 379 Transaction costs (acquisition and other) (E) 1,961 3,545 1,068 2,414 7,858 3,370 2,249 3,751 (Gain) loss on disposal of assets (1,413) (913) (1,011) 658 (525) (509) (338) (645) Effects of fair value adjustments to inventory (F) 1,123 3,818 788 575 4,176 324 946 1,009 Gain on legal settlement - - (1,382) (14,029) - - - - Change in fair value of financial instruments (G) - - - - 6,395 6,125 382 19 Secondary public offerings (H) - - - 363 - 1,525 1,385 - Debt transaction costs (I) 173 - 532 - 678 1,285 265 - Total Adjustments 26,730$ 24,936$ 15,846$ 67,940$ 34,558$ 18,582$ 11,138$ 12,330$ Adjusted EBITDA (as reported) 665,696$ 566,921$ 319,371$ 299,759$ 295,669$ 199,258$ 188,229$ 138,183$ Contributions from acquisitions (J) 9,535 21,348 4,948 1,480 6,717 1,280 9,500 12,093 Pro Forma Adjusted EBITDA 675,231$ 588,269$ 324,319$ 301,239$ 302,386$ 200,538$ 197,729$ 150,276$ Net Sales $5,329,252 $4,634,875 $3,298,823 $3,241,307 $3,116,032 $2,511,469 $2,319,146 $1,858,177 Adjusted EBITDA margin (as reported) 12.5% 12.2% 9.7% 9.2% 9.5% 7.9% 8.1% 7.4%
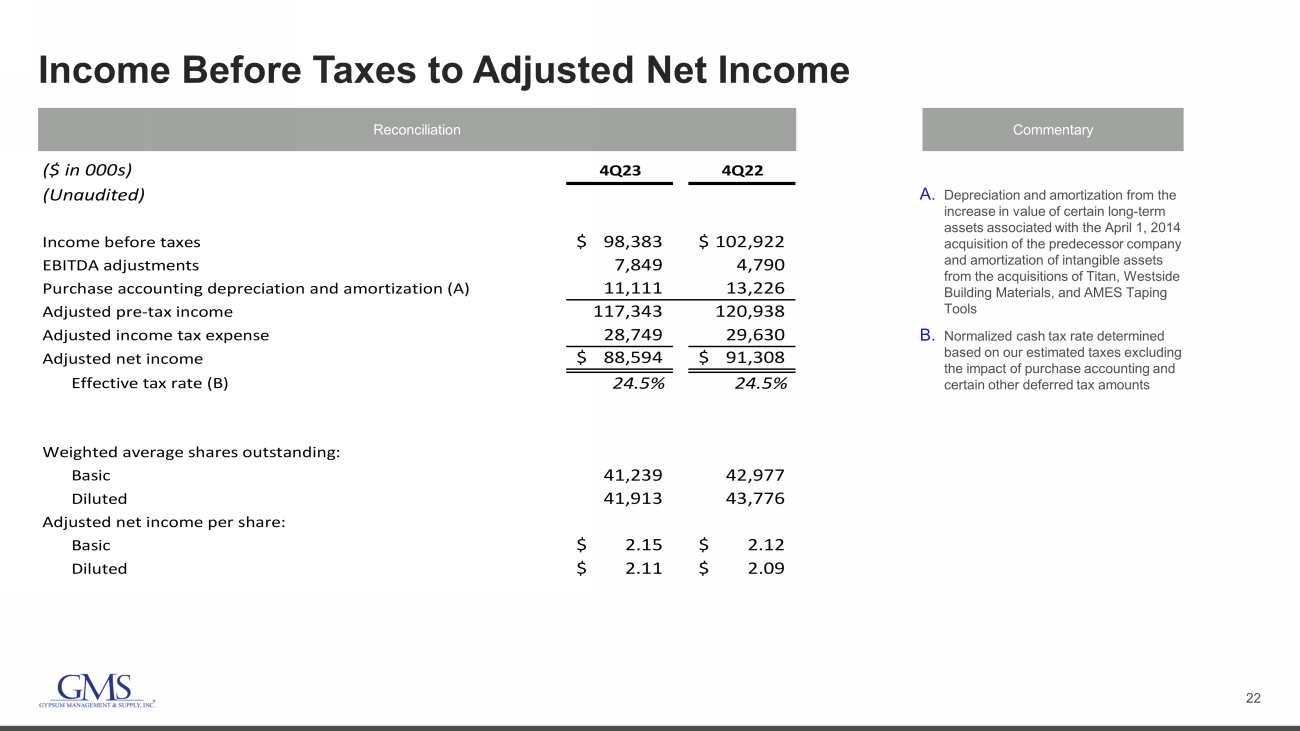
22 Income Before Taxes to Adjusted Net Income Reconciliation Commentary A. Depreciation and amortization from the increase in value of certain long - term assets associated with the April 1, 2014 acquisition of the predecessor company and amortization of intangible assets from the acquisitions of Titan, Westside Building Materials, and AMES Taping Tools B. Normalized cash tax rate determined based on our estimated taxes excluding the impact of purchase accounting and certain other deferred tax amounts ($ in 000s) 4Q23 4Q22 (Unaudited) Income before taxes 98,383$ 102,922$ EBITDA adjustments 7,849 4,790 Purchase accounting depreciation and amortization (A) 11,111 13,226 Adjusted pre-tax income 117,343 120,938 Adjusted income tax expense 28,749 29,630 Adjusted net income 88,594$ 91,308$ Effective tax rate (B) 24.5% 24.5% Weighted average shares outstanding: Basic 41,239 42,977 Diluted 41,913 43,776 Adjusted net income per share: Basic 2.15$ 2.12$ Diluted 2.11$ 2.09$
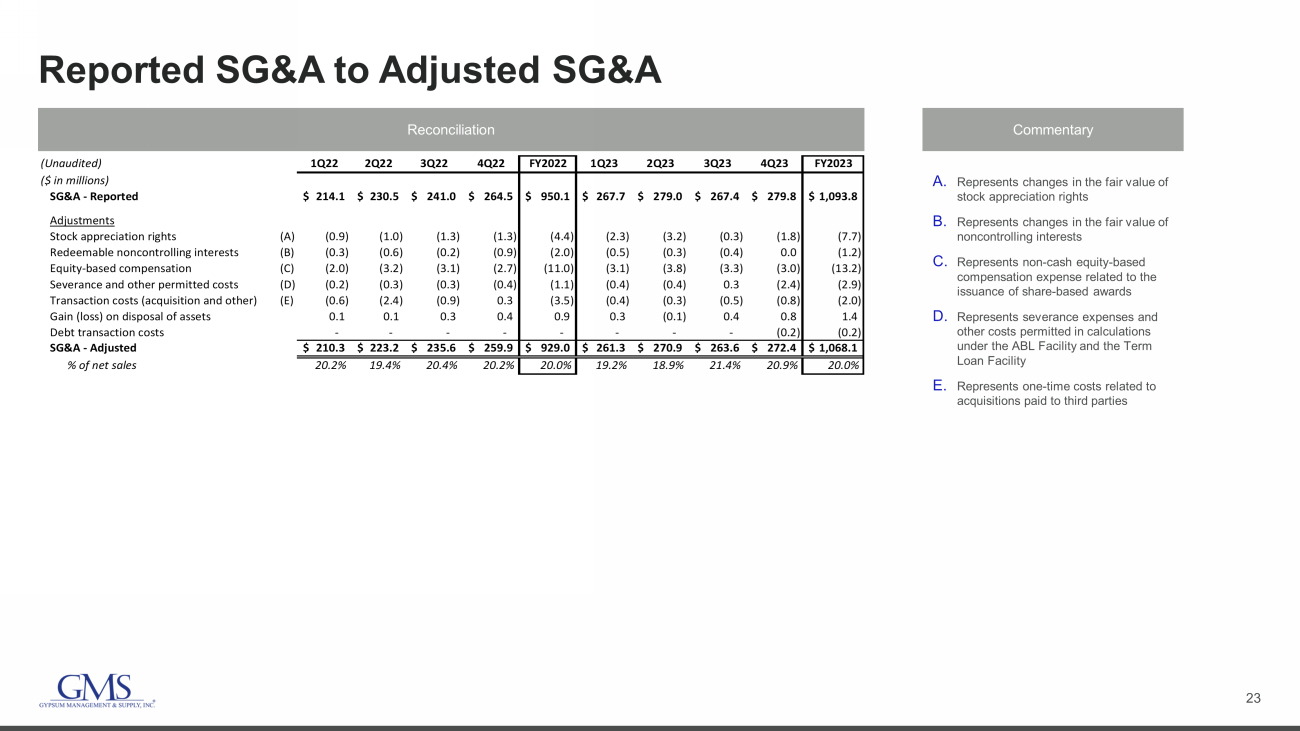
23 Reported SG&A to Adjusted SG&A Reconciliation Commentary A. Represents changes in the fair value of stock appreciation rights B. Represents changes in the fair value of noncontrolling interests C. Represents non - cash equity - based compensation expense related to the issuance of share - based awards D. Represents severance expenses and other costs permitted in calculations under the ABL Facility and the Term Loan Facility E. Represents one - time costs related to acquisitions paid to third parties (Unaudited) 1Q22 2Q22 3Q22 4Q22 FY2022 1Q23 2Q23 3Q23 4Q23 FY2023 ($ in millions) SG&A - Reported 214.1$ 230.5$ 241.0$ 264.5$ 950.1$ 267.7$ 279.0$ 267.4$ 279.8$ 1,093.8$ Adjustments Stock appreciation rights (A) (0.9) (1.0) (1.3) (1.3) (4.4) (2.3) (3.2) (0.3) (1.8) (7.7) Redeemable noncontrolling interests (B) (0.3) (0.6) (0.2) (0.9) (2.0) (0.5) (0.3) (0.4) 0.0 (1.2) Equity-based compensation (C) (2.0) (3.2) (3.1) (2.7) (11.0) (3.1) (3.8) (3.3) (3.0) (13.2) Severance and other permitted costs (D) (0.2) (0.3) (0.3) (0.4) (1.1) (0.4) (0.4) 0.3 (2.4) (2.9) Transaction costs (acquisition and other) (E) (0.6) (2.4) (0.9) 0.3 (3.5) (0.4) (0.3) (0.5) (0.8) (2.0) Gain (loss) on disposal of assets 0.1 0.1 0.3 0.4 0.9 0.3 (0.1) 0.4 0.8 1.4 Debt transaction costs - - - - - - - - (0.2) (0.2) SG&A - Adjusted 210.3$ 223.2$ 235.6$ 259.9$ 929.0$ 261.3$ 270.9$ 263.6$ 272.4$ 1,068.1$ % of net sales 20.2% 19.4% 20.4% 20.2% 20.0% 19.2% 18.9% 21.4% 20.9% 20.0%
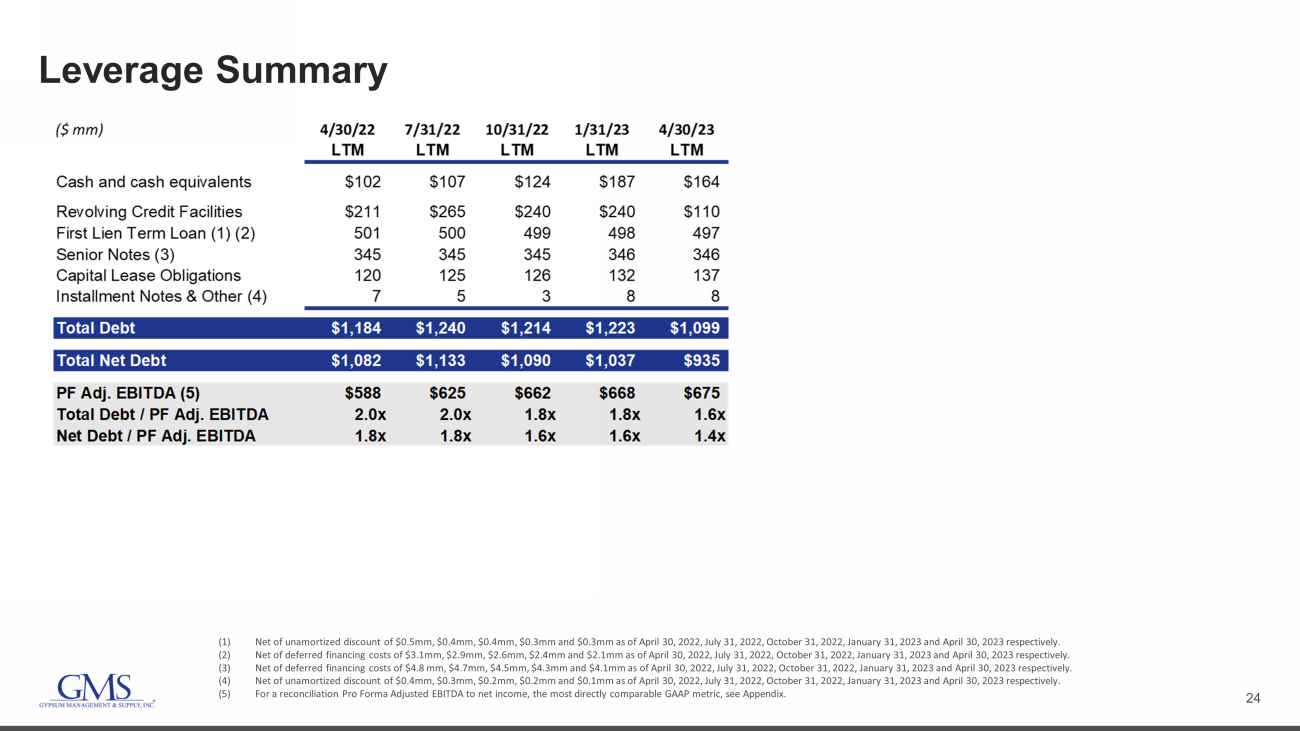
24 Leverage Summary (1) Net of unamortized discount of $0.5mm, $0.4mm, $0.4mm, $0.3mm and $0.3mm as of April 30, 2022, July 31, 2022, October 31, 202 2, January 31, 2023 and April 30, 2023 respectively. (2) Net of deferred financing costs of $3.1mm, $2.9mm, $2.6mm, $2.4mm and $2.1mm as of April 30, 2022, July 31, 2022, October 31, 20 22, January 31, 2023 and April 30, 2023 respectively. (3) Net of deferred financing costs of $4.8 mm, $4.7mm, $4.5mm, $4.3mm and $4.1mm as of April 30, 2022, July 31, 2022, October 31 , 2 022, January 31, 2023 and April 30, 2023 respectively. (4) Net of unamortized discount of $0.4mm, $0.3mm, $0.2mm, $0.2mm and $0.1mm as of April 30, 2022, July 31, 2022, October 31, 202 2, January 31, 2023 and April 30, 2023 respectively. (5) For a reconciliation Pro Forma Adjusted EBITDA to net income, the most directly comparable GAAP metric, see Appendix.
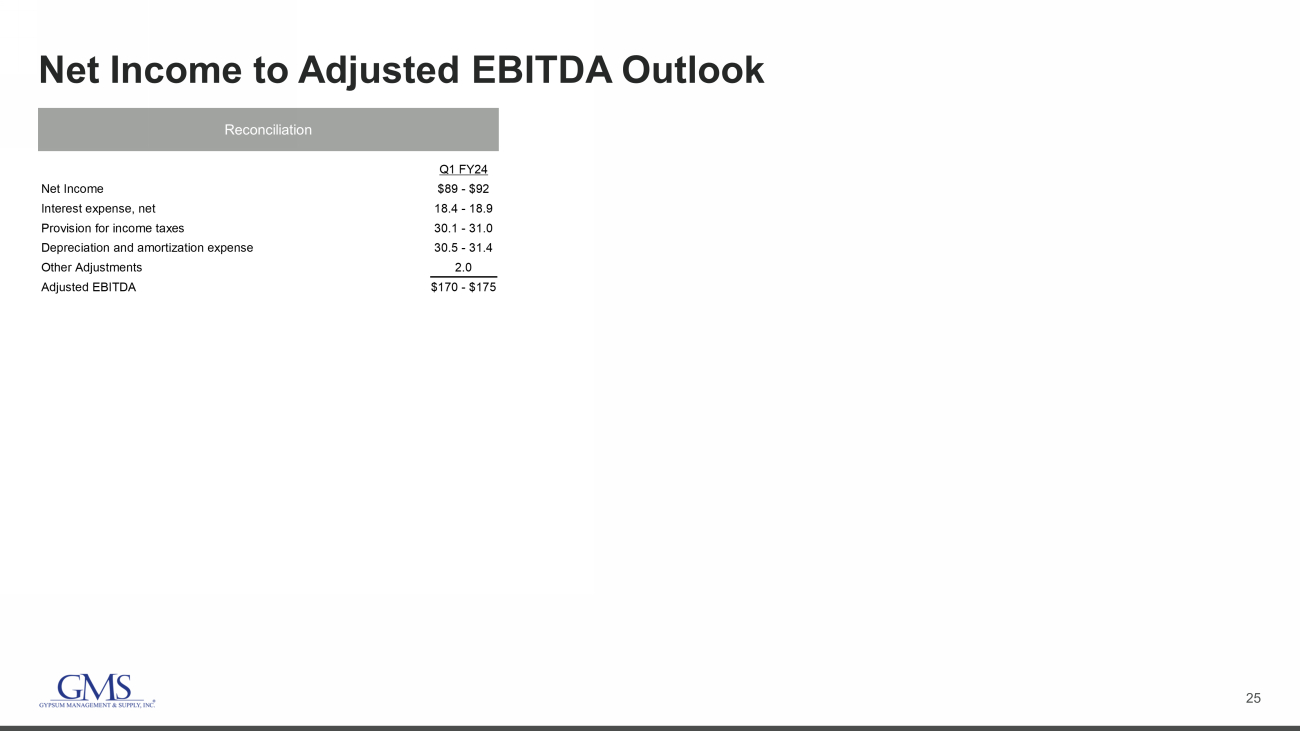
25 Net Income to Adjusted EBITDA Outlook Q1 FY24 Net Income $89 - $92 Interest expense, net 18.4 - 18.9 Provision for income taxes 30.1 - 31.0 Depreciation and amortization expense 30.5 - 31.4 Other Adjustments 2.0 Adjusted EBITDA $170 - $175 Reconciliation
v3.23.2
| X |
- DefinitionBoolean flag that is true when the XBRL content amends previously-filed or accepted submission.
| Name: |
dei_AmendmentFlag |
| Namespace Prefix: |
dei_ |
| Data Type: |
xbrli:booleanItemType |
| Balance Type: |
na |
| Period Type: |
duration |
|
| X |
- DefinitionFor the EDGAR submission types of Form 8-K: the date of the report, the date of the earliest event reported; for the EDGAR submission types of Form N-1A: the filing date; for all other submission types: the end of the reporting or transition period. The format of the date is YYYY-MM-DD.
| Name: |
dei_DocumentPeriodEndDate |
| Namespace Prefix: |
dei_ |
| Data Type: |
xbrli:dateItemType |
| Balance Type: |
na |
| Period Type: |
duration |
|
| X |
- DefinitionThe type of document being provided (such as 10-K, 10-Q, 485BPOS, etc). The document type is limited to the same value as the supporting SEC submission type, or the word 'Other'.
| Name: |
dei_DocumentType |
| Namespace Prefix: |
dei_ |
| Data Type: |
dei:submissionTypeItemType |
| Balance Type: |
na |
| Period Type: |
duration |
|
| X |
- DefinitionAddress Line 1 such as Attn, Building Name, Street Name
| Name: |
dei_EntityAddressAddressLine1 |
| Namespace Prefix: |
dei_ |
| Data Type: |
xbrli:normalizedStringItemType |
| Balance Type: |
na |
| Period Type: |
duration |
|
| X |
- DefinitionAddress Line 2 such as Street or Suite number
| Name: |
dei_EntityAddressAddressLine2 |
| Namespace Prefix: |
dei_ |
| Data Type: |
xbrli:normalizedStringItemType |
| Balance Type: |
na |
| Period Type: |
duration |
|
| X |
- Definition
+ References
+ Details
| Name: |
dei_EntityAddressCityOrTown |
| Namespace Prefix: |
dei_ |
| Data Type: |
xbrli:normalizedStringItemType |
| Balance Type: |
na |
| Period Type: |
duration |
|
| X |
- DefinitionCode for the postal or zip code
| Name: |
dei_EntityAddressPostalZipCode |
| Namespace Prefix: |
dei_ |
| Data Type: |
xbrli:normalizedStringItemType |
| Balance Type: |
na |
| Period Type: |
duration |
|
| X |
- DefinitionName of the state or province.
| Name: |
dei_EntityAddressStateOrProvince |
| Namespace Prefix: |
dei_ |
| Data Type: |
dei:stateOrProvinceItemType |
| Balance Type: |
na |
| Period Type: |
duration |
|
| X |
- DefinitionA unique 10-digit SEC-issued value to identify entities that have filed disclosures with the SEC. It is commonly abbreviated as CIK. Reference 1: http://www.xbrl.org/2003/role/presentationRef
-Publisher SEC
-Name Exchange Act
-Number 240
-Section 12
-Subsection b-2
| Name: |
dei_EntityCentralIndexKey |
| Namespace Prefix: |
dei_ |
| Data Type: |
dei:centralIndexKeyItemType |
| Balance Type: |
na |
| Period Type: |
duration |
|
| X |
- DefinitionIndicate if registrant meets the emerging growth company criteria. Reference 1: http://www.xbrl.org/2003/role/presentationRef
-Publisher SEC
-Name Exchange Act
-Number 240
-Section 12
-Subsection b-2
| Name: |
dei_EntityEmergingGrowthCompany |
| Namespace Prefix: |
dei_ |
| Data Type: |
xbrli:booleanItemType |
| Balance Type: |
na |
| Period Type: |
duration |
|
| X |
- DefinitionCommission file number. The field allows up to 17 characters. The prefix may contain 1-3 digits, the sequence number may contain 1-8 digits, the optional suffix may contain 1-4 characters, and the fields are separated with a hyphen.
| Name: |
dei_EntityFileNumber |
| Namespace Prefix: |
dei_ |
| Data Type: |
dei:fileNumberItemType |
| Balance Type: |
na |
| Period Type: |
duration |
|
| X |
- DefinitionTwo-character EDGAR code representing the state or country of incorporation.
| Name: |
dei_EntityIncorporationStateCountryCode |
| Namespace Prefix: |
dei_ |
| Data Type: |
dei:edgarStateCountryItemType |
| Balance Type: |
na |
| Period Type: |
duration |
|
| X |
- DefinitionThe exact name of the entity filing the report as specified in its charter, which is required by forms filed with the SEC. Reference 1: http://www.xbrl.org/2003/role/presentationRef
-Publisher SEC
-Name Exchange Act
-Number 240
-Section 12
-Subsection b-2
| Name: |
dei_EntityRegistrantName |
| Namespace Prefix: |
dei_ |
| Data Type: |
xbrli:normalizedStringItemType |
| Balance Type: |
na |
| Period Type: |
duration |
|
| X |
- DefinitionThe Tax Identification Number (TIN), also known as an Employer Identification Number (EIN), is a unique 9-digit value assigned by the IRS. Reference 1: http://www.xbrl.org/2003/role/presentationRef
-Publisher SEC
-Name Exchange Act
-Number 240
-Section 12
-Subsection b-2
| Name: |
dei_EntityTaxIdentificationNumber |
| Namespace Prefix: |
dei_ |
| Data Type: |
dei:employerIdItemType |
| Balance Type: |
na |
| Period Type: |
duration |
|
| X |
- DefinitionLocal phone number for entity.
| Name: |
dei_LocalPhoneNumber |
| Namespace Prefix: |
dei_ |
| Data Type: |
xbrli:normalizedStringItemType |
| Balance Type: |
na |
| Period Type: |
duration |
|
| X |
- DefinitionBoolean flag that is true when the Form 8-K filing is intended to satisfy the filing obligation of the registrant as pre-commencement communications pursuant to Rule 13e-4(c) under the Exchange Act. Reference 1: http://www.xbrl.org/2003/role/presentationRef
-Publisher SEC
-Name Exchange Act
-Number 240
-Section 13e
-Subsection 4c
| Name: |
dei_PreCommencementIssuerTenderOffer |
| Namespace Prefix: |
dei_ |
| Data Type: |
xbrli:booleanItemType |
| Balance Type: |
na |
| Period Type: |
duration |
|
| X |
- DefinitionBoolean flag that is true when the Form 8-K filing is intended to satisfy the filing obligation of the registrant as pre-commencement communications pursuant to Rule 14d-2(b) under the Exchange Act. Reference 1: http://www.xbrl.org/2003/role/presentationRef
-Publisher SEC
-Name Exchange Act
-Number 240
-Section 14d
-Subsection 2b
| Name: |
dei_PreCommencementTenderOffer |
| Namespace Prefix: |
dei_ |
| Data Type: |
xbrli:booleanItemType |
| Balance Type: |
na |
| Period Type: |
duration |
|
| X |
- DefinitionTitle of a 12(b) registered security. Reference 1: http://www.xbrl.org/2003/role/presentationRef
-Publisher SEC
-Name Exchange Act
-Number 240
-Section 12
-Subsection b
| Name: |
dei_Security12bTitle |
| Namespace Prefix: |
dei_ |
| Data Type: |
dei:securityTitleItemType |
| Balance Type: |
na |
| Period Type: |
duration |
|
| X |
- DefinitionName of the Exchange on which a security is registered. Reference 1: http://www.xbrl.org/2003/role/presentationRef
-Publisher SEC
-Name Exchange Act
-Number 240
-Section 12
-Subsection d1-1
| Name: |
dei_SecurityExchangeName |
| Namespace Prefix: |
dei_ |
| Data Type: |
dei:edgarExchangeCodeItemType |
| Balance Type: |
na |
| Period Type: |
duration |
|
| X |
- DefinitionBoolean flag that is true when the Form 8-K filing is intended to satisfy the filing obligation of the registrant as soliciting material pursuant to Rule 14a-12 under the Exchange Act. Reference 1: http://www.xbrl.org/2003/role/presentationRef
-Publisher SEC
-Name Exchange Act
-Section 14a
-Number 240
-Subsection 12
| Name: |
dei_SolicitingMaterial |
| Namespace Prefix: |
dei_ |
| Data Type: |
xbrli:booleanItemType |
| Balance Type: |
na |
| Period Type: |
duration |
|
| X |
- DefinitionTrading symbol of an instrument as listed on an exchange.
| Name: |
dei_TradingSymbol |
| Namespace Prefix: |
dei_ |
| Data Type: |
dei:tradingSymbolItemType |
| Balance Type: |
na |
| Period Type: |
duration |
|
| X |
- DefinitionBoolean flag that is true when the Form 8-K filing is intended to satisfy the filing obligation of the registrant as written communications pursuant to Rule 425 under the Securities Act. Reference 1: http://www.xbrl.org/2003/role/presentationRef
-Publisher SEC
-Name Securities Act
-Number 230
-Section 425
| Name: |
dei_WrittenCommunications |
| Namespace Prefix: |
dei_ |
| Data Type: |
xbrli:booleanItemType |
| Balance Type: |
na |
| Period Type: |
duration |
|
GMS (NYSE:GMS)
과거 데이터 주식 차트
부터 4월(4) 2024 으로 5월(5) 2024

GMS (NYSE:GMS)
과거 데이터 주식 차트
부터 5월(5) 2023 으로 5월(5) 2024
