UNITED STATES
SECURITIES AND EXCHANGE COMMISSION
Washington, D.C. 20549
FORM N-CSR
CERTIFIED SHAREHOLDER REPORT
OF REGISTERED
MANAGEMENT INVESTMENT COMPANIES
Investment Company Act file number 811-05410
Saba Capital Income & Opportunities Fund
(Exact name of registrant as specified
in charter)
405 Lexington Avenue, 58th Floor
New York, New York 10174
(Address of principal executive offices) (Zip code)
Michael D’Angelo
Saba Capital Income & Opportunities Fund
405 Lexington Avenue
New York, New York 10174
(Name and address of agent for service)
Copies to:
Schulte Roth & Zabel LLP
Kimberly L. Broder, Esq.
919 Third Avenue
New York, New York 10022
Registrant’s telephone number, including area
code: (212) 542-4644
Date of fiscal year end: October 31
Date of reporting period: November 1, 2022 –
October 31, 2023
Item 1. Reports to Stockholders.
Managed Distribution Policy: Beginning
with the distributions for which the declaration date is December 29, 2023, the Fund will make monthly distributions to shareholders at
a fixed amount of $0.085 per share.
The Fund will generally distribute amounts necessary
to satisfy the Fund’s plan and the requirements prescribed by excise tax rules and Subchapter M of the Internal Revenue Code. The
plan is intended to provide shareholders with a constant, but not guaranteed, fixed minimum rate of distribution each month and is intended
to narrow the discount between the market price and the net asset value of the Fund’s common shares, but there is no assurance that
the plan will be successful in doing so.
Under the managed distribution plan, to the extent
that sufficient investment income is not available on a monthly basis, the Fund will distribute capital gains and/or return of capital
in order to maintain its managed distribution rate. No conclusions should be drawn about the Fund’s investment performance from
the amount of the Fund’s distributions or from the terms of the Fund’s managed distribution plan. The Board may amend the
terms of the plan or terminate the plan at any time without prior notice to Fund shareholders; however, at this time there are no reasonably
foreseeable circumstances that might cause the termination of the plan. The amendment or termination of the plan could have an adverse
effect on the market price of the Fund’s common shares. The plan will be subject to the periodic review by the Board, including
a yearly review of the annual minimum fixed rate to determine if an adjustment should be made.
Table of Contents
| Shareholder Letter |
1 |
| Performance Update |
4 |
| Material Risk Factors |
6 |
| Report of Indepencent Registered Public Accounting Firm |
18 |
| Consolidated Schedule of Investments |
19 |
| Consolidated Statement of Assets and Liabilities |
43 |
| Consolidated Statement of Operations |
44 |
| Statements of Changes in Net Assets |
45 |
| Consolidated Statement of Cash Flows |
46 |
| Financial Highlights |
47 |
| Notes to Consolidated Financial Statements |
49 |
| Additional Information |
63 |
| Trustees and Officers |
64 |
| Saba Capital Income & Opportunities Fund (Unaudited) |
Shareholder Letter |
| |
October 31, 2023 |
December 21, 2023
Dear Shareholders,
Thank you for your continued interest in the Saba
Capital Income & Opportunities Fund (the “Fund”). We are pleased to provide you with a review of the Fund’s performance
and financial markets over the last year.
Performance Summary1
We are pleased with the results of the Fund during
the reporting period. The Fund significantly outperformed its primary benchmark, the iBoxx USD Liquid High Yield Index, as well as the
S-Network Composite Closed-End Fund Index. Moreover, the Fund generated these returns while employing a defensive posture.
| Security2 November 1, 2022 – October 31, 2023 |
Total Return3 |
Annualized Volatility |
| Saba Capital Income & Opportunities Fund |
9.63% |
8.85% |
| iBoxx USD Liquid High Yield Index |
5.11% |
6.40% |
| S-Network Composite Closed-End Fund Index |
-0.56% |
10.35% |
The primary contributor to the Fund’s strong
returns was the exposure to closed-end funds trading at significant discounts, as well as long/short credit investments in loans/bonds/CDS/CDX.
The main performance detractors were agency mortgages and long equity volatility positions.
Markets Review and Forecast
Today, market participants, policymakers and forecasters
appear to be in broad alignment that global GDP growth and inflation should slow in 2024 and central banks will pivot by the second half
of the year. In contrast, prior to the mid-November CPI report, markets had been suggesting a chance of at least one more rate hike ahead.
We believe that plenty of uncertainty remains. The dot plots in recent years have proven to be wildly inaccurate, yet the market, as evidenced
by low credit spreads and low implied volatility is ascribing near certainty to soft or no landing scenarios despite mixed economic data.
Accordingly, in the Fund, we remain defensively positioned
from a net exposure perspective. At the same time, the Fund has grown its exposure to what we believe to be mispriced relative value investments,
such as MBS spreads vs. IG spreads, rate volatility compared to equity/credit volatility and closed-end funds relative to their net asset
value (“NAV”).
Investment Objective
The Fund’s investment objective is to seek to
provide shareholders with a high level of current income, with a secondary goal of capital appreciation. The Fund seeks to achieve this
objective by investing globally in debt and equity securities of public and private companies, which includes, among other things, investing
in closed-end funds, special purpose acquisition companies (“SPACs”), public and private debt instruments, as well as derivatives,
including total return swaps, credit default swaps, options and futures, where the Fund seeks to enhance returns and/or to reduce portfolio
risk. From time to time, in pursuit of its investment objective, the Fund may also invest up to 15% of its total assets in private funds
on a discretionary basis.
Current Portfolio and Strategy
In the Fund’s 2022 Annual Report, we expressed
our concern about elevated uncertainty in financial markets due to high inflation, potential recession, geopolitical risks and central
banks’ aggressive policy rate increases. Although risk assets have generally rallied over the last year, there have been bouts of
volatility, most notably during the regional banking crisis in March 2023.
Over the past year, the Fund maintained increased
exposure to more traditional long investments, such as closed-end funds, high-yield and investment-grade bonds, equities and distressed
assets. These performed well up to the banking crisis and since then, we have kept a measured stance in terms of net exposure by hedging
through CDX indices. The Fund also identified new opportunities in reinsurance at the beginning of the year and through agency mortgages
during the regional banking crisis.
| Annual Report | October 31, 2023 |
1 |
| Saba Capital Income & Opportunities Fund (Unaudited) |
Shareholder Letter |
| |
October 31, 2023 |
Below is an overview of the Fund’s portfolio performance in 2023:
Closed-End Funds –
Closed-end funds were a distinct contributor to the Fund’s strong performance over the last year. The Fund primarily benefited from
the discount tightening in crypto based closed-end funds, which appeared to be driven by potential SEC approval for ETF conversion. The
discounts, however, of many other closed-end funds continued to widen in 2023, which provide a rich opportunity set for future investments.
U.S. and non-U.S. closed-end funds have grown from 20% of AUM to 60% of AUM during the reporting period and are now the largest single
asset exposure in the Fund, with an average discount of approximately 15.6%.
Long /Short Credit –
The Fund’s long exposure to bonds and loans along with tactical hedges through CDX served as contributors to the Fund’s performance
during the Reporting Period. The Fund has opportunistically increased its allocation to long fixed income securities through investments
in U.S. high-yield and investment-grade bonds and credit derivatives.
Reinsurance – The
catastrophic reinsurance market became dislocated at end of 2022 (with premiums increasing by 50%+ YoY) which in our view was driven by
1) back-to-back natural disasters in 2021/22, 2) poor reinsurance returns, compounded by losses against insufficient premiums and weakened
covenants, and 3) flight of reinsurance capital driven by weakened insurer balance sheets from higher rates. The Fund invested in reinsurance
at the end of 2022 to take advantage of the dislocation. The premium increase vs 2022 is expected to remain attractive going into 2024.
Agency Mortgages – During
the depths of the regional banking crisis in Q1 2023, interest rate volatility was significantly elevated and was dislocated compared
to both equity and credit volatility. As a result, we invested in rate hedged MBS TBA (agency mortgage futures), which has a short rate
volatility exposure and we purchased equity volatility through VIX futures to monetize the dislocation. Although the dislocation has persisted
thus far and led to a moderate detraction – with the VIX at the lows since COVID and rate volatility at highs – we believe
that as inflation slows and the Fed readies to cut rates in 2024, this dislocation will likely dissipate.
SPACs – SPACs
have performed as designed over the last fiscal year, providing gains with limited downside because of the redemption at trust value feature.
Given the practical shutdown in the SPAC IPO market, the weighting of SPACs in the portfolio has decreased from approximately 85% to 5%
over the reporting period.
Equities – The Fund’s public equity
investments benefited from the market rally and produced gains which were offset by the losses in PIPEs. The position size has been consistent
at around 10% of NAV.
Conclusion
We will continue to leave no stone unturned in our search for investment
opportunities that create long-term value for shareholders.
If you have any questions about the Fund, please visit
www.sabacef.com. We are grateful for your trust and support.
Boaz R. Weinstein
Founder and Chief Investment Officer
Saba Capital Management, LP
The foregoing reflects our views, analysis and opinions as of December
21, 2023.
| 1 | Past performance is no guarantee of future results and shares of the Fund, when sold, may be worth
less than their original cost. |
| Saba Capital Income & Opportunities Fund (Unaudited) |
Shareholder Letter |
| |
October 31, 2023 |
| 2 | The iBoxx USD Liquid High Yield Index consists of liquid USD high yield bonds, selected to provide
a balanced representation of the USD high yield corporate bond universe. The S-Network Composite Closed-End Fund Index is a fund index
designed to serve as a benchmark for closed-end funds listed in the US that principally engage in asset management processes seeking to
produce taxable annual yield. Any indices and other financial benchmarks are provided for illustrative purposes only – and do not
imply that any fund will achieve similar performance, returns or volatility or invest in any specific investments that compromise any
such index. Comparisons to indices have limitations and material characteristics that may differ from any fund. Any index information
contained herein is included merely to show general trends in the markets in the periods indicated, is not meant to imply that these indices
are the only relevant indices, and is not intended to imply that any portfolio managed by Saba was similar to the index either in composition
or element of risk. There is no guarantee that such portfolios will meet or exceed any index. Indices referenced in the foregoing letter
were selected by us in good faith, but there is no guarantee that such indices are appropriate or suitable for comparison with the Fund’s
performance. No assurance is made as to the accuracy of such indices and all information above is subject to revision. In addition, the
composition of each of these indices is not under our control and may change over time in the discretion of the respective provider of
such index, which may affect the results of the performance comparisons. |
| 3 | Total investment return is calculated assuming a purchase of the referenced security/index at the opening on November 1, 2022 and
a sale at October 31, 2023 and includes an assumption that dividends/distributions, if any, are reinvested. |
| Annual Report | October 31, 2023 |
3 |
| Saba Capital Income & Opportunities Fund (Unaudited) |
Performance Update |
| |
October 31, 2023 |
Average Annual Total Returns (as
of October 31, 2023)
| |
1 Year |
3 Year |
5 Year |
10 Year |
| Returns at NAV |
9.63% |
5.58% |
2.21% |
3.46% |
| Returns at Market Value |
7.31% |
5.82% |
3.23% |
2.05% |
| iShares iBoxx $ High Yield Corporate Bond ETF (HYG)(2) |
4.79% |
0.12% |
2.05% |
2.71% |
Average annual returns for the period since Saba Capital
Management began managing the Fund on June 4, 2021 are at NAV 4.76% and at market value 3.63%.
Comparison of the Change in Value of a $10,000 Investment
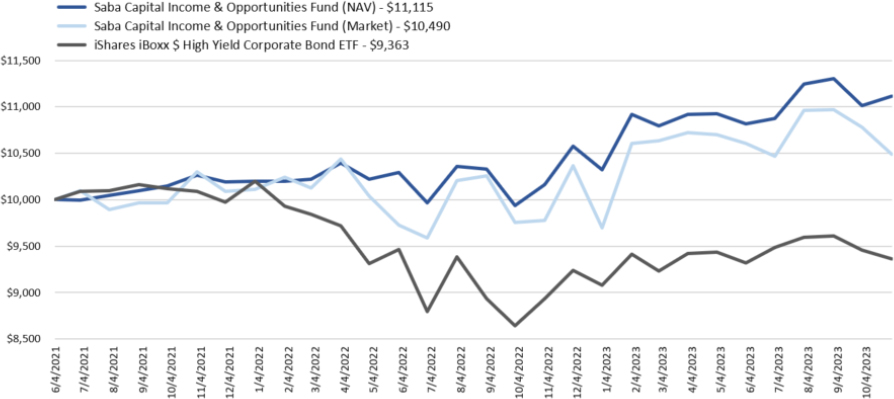
The performance data quoted above represents
past performance. Past performance is not a guarantee of future results. Investment return and value of the Fund shares will fluctuate
so that a shareholder's shares, when sold, may be worth more or less than their original cost. Performance may be lower or higher than
performance data quoted. Fund performance current to the most recent month-end is available by visiting www.sabacef.com.
| Saba Capital Income & Opportunities Fund (Unaudited) |
Performance Update |
| |
October 31, 2023 |
Top Ten Holdings by Issuer (as
a % of Net Assets)(a)
| Stone Ridge Opportunities Fund Feeder LP |
10.57% |
| European Opportunities Trust PLC |
3.48% |
| The GEO Group, Inc. |
3.45% |
| R.R. Donnelley & Sons Co. |
2.86% |
| Grayscale Ethereum Classic Trust |
2.83% |
| Sculptor Capital Management, Inc. |
2.53% |
| Grayscale Ethereum Trust |
2.17% |
| Altria Group, Inc. |
2.05% |
| Bitwise 10 Crypto Index Fund |
1.88% |
| Pershing Square Holdings, Ltd. |
1.76% |
| Top Ten Holdings |
33.58% |
Portfolio Composition (as
a % of Net Assets)(a)
| Closed End Funds |
22.72% |
| Private Fund |
10.57% |
| Corporate Bonds |
10.38% |
| Senior Loans |
9.98% |
| Investment Trust |
7.56% |
| Common Stock |
6.29% |
| Unit Trust |
5.01% |
| Special Purpose Acquisition Companies |
4.70% |
| Sovereign Debt Obligations |
2.84% |
| Credit Default Swap Contracts |
2.05% |
| Simple agreement for future equity contracts |
1.82% |
| Mortgage-Backed Securities |
1.11% |
| Preferred Stock |
0.87% |
| Short Term Investments |
0.64% |
| Options |
0.31% |
| Convertible Corporate Bond |
0.30% |
| Total Return Swap Contracts |
0.30% |
| Futures Contracts |
0.29% |
| Participation Agreement |
0.27% |
| Warrants |
0.14% |
| Rights |
0.04% |
| Forward Foreign Currency Contracts |
-0.01% |
| Preferred Stock |
-0.01% |
| To-be-announced Mortgage-backed Securities Forward Contracts |
-0.74% |
| Exchange Traded Funds |
-4.54% |
| Common Stock |
-6.52% |
| Sovereign Debt Obligations |
-47.61% |
| Total Investment |
28.76% |
| Other Assets in Excess of Liabilities |
71.24% |
| Net Assets |
100.00% |
| (a) | Holdings are subject to change, and may not reflect the current or future position of the portfolio.
Tables present indicative values only. |
| Annual Report | October 31, 2023 |
5 |
| Saba Capital Income & Opportunities Fund (Unaudited) |
Material Risk Factors |
| |
October 31, 2023 |
General Risk Factors
Dependence on Key Individuals. Investors
have no authority to make decisions on behalf of the Fund. The success of the Fund depends upon the ability of key members of the investment
team to develop and implement investment strategies that achieve the Fund’s investment objectives. If the Fund were to lose the
services of these members, the consequence to the Fund could be material and adverse.
Dependence on Service Providers. The
Fund is also dependent upon their counterparties and the businesses that are not controlled by the Investment Manager that provide services
to the Fund (the “Service Providers”). Examples of Service Providers include the administrator, custodian, legal counsel,
auditors, Principal Financial Officer, and Chief Compliance Officer. Errors are inherent in the business and operations of any business,
and although the Investment Manager will adopt measures to prevent and detect errors by, and misconduct of, counterparties and Service
Providers, and transact with counterparties and Service Providers it believes to be reliable, such measures may not be effective in all
cases. Errors or misconduct could have a material adverse effect on the Fund and the Investor’s investments therein.
Indemnification. The Fund will indemnify
the Investment Manager and other Service Providers for liabilities incurred in connection with the affairs of the Fund. Such liabilities
may be material and have an adverse effect on the returns to the investors. The indemnification obligations of the Fund would be payable
from the assets of the Fund.
Third Party Managers. The Fund
has and may in the future invest in public and/ private funds managed by third party managers, or may allocate portions of its assets
to third party managers to manage on a discretionary basis, if the Investment Manager determines that such an arrangement represents the
best way to access a particular investment opportunity or otherwise expand the investment expertise available to the Fund. The Fund will
be subject to various costs relating to such investments, including performance-based and/or fixed asset-based fees or allocations payable
to such third party managers. Any such fees and allocations will not reduce the Management Fee.
Risks Relating to Market Conditions Generally
General Economic and Market Conditions.
The success of the Fund’s activities will be affected by general economic and market conditions, such as interest rates, availability
of credit, credit defaults, inflation rates, economic uncertainty, changes in laws (including laws relating to taxation of the Fund’s
investments), trade barriers, currency exchange controls, and national and international political circumstances (including wars, terrorist
acts or security operations). These factors may affect the level and volatility of the prices and the liquidity of the Fund’s investments.
Volatility or illiquidity could impair the Fund’s profitability or result in losses. The Fund may maintain substantial trading positions
that can be adversely affected by the level of volatility in the financial markets.
Market Disruption and Geopolitical:
The Fund is subject to the risk that geopolitical events may disrupt securities markets and adversely affect global economies and markets.
Due to the increasing interdependence among global economies and markets, conditions in one country, market, or region might adversely
impact markets, issuers and/or foreign exchange rates in other countries, including the U.S. War, terrorism, global health crises and
pandemics, and other geopolitical events have led, and in the future may lead, to increased market volatility and may have adverse short-
or long-term effects on U.S. and world economies and markets generally. Natural and environmental disasters and systemic market dislocations
are also highly disruptive to economies and markets. Those events as well as other changes in non-U.S. and domestic economic, social,
and political conditions also could adversely affect individual issuers or related groups of issuers, securities markets, interest rates,
credit ratings, inflation, investor sentiment, and other factors affecting the value of the investments of the Fund and the Fund. Any
of these occurrences could disrupt the operations of the Fund and of the Fund’s service providers.
Potential Interest Rate Increases. The
United States has experienced a sustained period of historically low interest rate levels. In recent years, however, short-term and long-term
interest rates have risen. The uncertainty of the U.S. and global economy, changes in U.S. government policy, and changes in the federal
funds rate, increase the risk that interest rates will remain volatile in the future. Sustained future interest rate volatility may cause
the value of the fixed-income securities held by the Fund to decrease.
Volatile Markets. The prices of financial
instruments in which the Fund may invest can be volatile. Price movements of forward and other derivative contracts in which the Fund’s
assets may be invested are influenced by, among other things, interest rates, changing supply and demand relationships, trade, fiscal,
monetary and exchange control programs and policies of governments, and national and international political and economic events and policies.
The Fund is subject to the risk of failure of any of the exchanges on which its positions trade or of their clearinghouses.
| Saba Capital Income & Opportunities Fund (Unaudited) |
Material Risk Factors |
| |
October 31, 2023 |
Investment Strategy Risk Factors
An investor should be aware that it may lose
money. All investments involve the risk of loss of capital. The Investment Manager believes that the Fund’s investment program
and research techniques moderate this risk through a careful selection of investments, the use of short and long positions and other financial
instruments. However, no guarantee or representation is made that the Fund’s investment program will be successful. The Fund’s
investment program is expected to utilize leverage and may utilize such investment techniques as option transactions, short sales, limited
diversification and forward contracts, which can, in certain circumstances, increase the adverse impact to which the Fund’s portfolio
may be subject.
Leverage Risks. The use of leverage
will, in certain instances, enable the Fund to achieve a higher rate of return than would be otherwise possible. Leverage may take the
form of, without limitation, any of the financial instruments described herein, including derivative instruments which are inherently
leveraged and trading in products with embedded leverage such as options, short sales, swaps and forwards. The instruments and borrowings
utilized by the Fund to leverage investments may be collateralized by the Fund’s portfolio, respectively.
The use of leverage will magnify the volatility of
changes in the value of the investments of the Fund. Accordingly, any event which adversely affects the value of an investment would be
magnified to the extent the investment is leveraged. The cumulative effect of the use of leverage by the Fund in a market that moves adversely
to its investments could result in substantial losses to the Fund, which would be greater than if the Fund was not leveraged.
While leverage increases the buying power of the Fund
and presents opportunities for increasing total returns, it has the effect of potentially increasing losses as well. For example, funds
borrowed for leveraging will be subject to interest, transaction and other costs, and other types of leverage also involve transaction
and other costs. Any such costs may or may not be recovered by the return on the Fund’s portfolio. Leverage will increase the investment
return of the Fund if an investment purchased with or utilizing leverage earns a greater return than the cost to the Fund of such leverage.
The use of leverage will decrease the investment return if the Fund fails to recover the cost of such leverage.
Equity Securities Generally. The Fund
expects to buy and sell private and public equity securities. The value of equity securities of public and private, listed and unlisted
companies and equity derivatives generally varies with the performance of the issuer and movements in the equity markets. As a result,
the Fund may suffer losses if it invests in equity instruments of issuers whose performance diverges from the Investment Manager’s
expectations or if equity markets generally move in a single direction and the Fund has not hedged against such a general move. The Fund
also may be exposed to risks that issuers will not fulfill contractual obligations such as, in the case of convertible securities or private
placements, delivering marketable common stock upon conversions of convertible securities and registering restricted securities for public
resale.
Debt Securities Generally. The Fund
expects to buy and sell private and government debt securities and instruments. The Fund may buy or sell debt instruments that are unrated,
and whether or not rated, the debt instruments may have speculative characteristics. The issuers of such instruments (including sovereign
issuers) may face significant ongoing uncertainties and exposure to adverse conditions that may undermine the issuer’s ability to
make timely payment of interest and principal. Such instruments are regarded as predominantly speculative with respect to the issuer’s
capacity to pay interest and repay principal in accordance with the terms of the obligations and involve major risk exposure to adverse
conditions.
Sovereign Debt. The Fund expects to
buy and sell sovereign debt. Several factors may affect (i) the ability of a government, its agencies, instrumentalities or its central
bank to make payments on the debt it has issued (“Sovereign Debt”), including securities that the Investment Manager believes
are likely to be included in restructurings of the external debt obligations of the issuer in question, (ii) the market value of such
debt and (iii) the inclusion of Sovereign Debt in future restructurings, including such issuer’s (x) balance of trade and access
to international financing, (y) cost of servicing such obligations, which may be affected by changes in international interest rates,
and (z) level of international currency reserves, which may affect the amount of non-U.S. exchange available for external debt payments.
Significant ongoing uncertainties and exposure to adverse conditions may undermine the issuer’s ability to make timely payment of
interest and principal, and issuers may default on their Sovereign Debt.
Distressed Securities. The Fund expects
to invest in “below investment grade” securities and obligations of issuers in weak financial condition, experiencing poor
operating results, having substantial capital needs or negative net worth, facing special competitive or product obsolescence problems,
including companies involved in bankruptcy or other reorganization and liquidation proceedings. It is anticipated that certain debt instruments
purchased by the Investment Manager for the Fund may be non-performing and possibly in default. Furthermore, the obligor or relevant guarantor
may also be in bankruptcy or liquidation. There can be no assurance as to the amount and timing of payments, if any, with respect to the
loans. These securities are likely to be particularly risky investments although they also may offer the potential for correspondingly
high returns. Among the risks inherent in investments in troubled entities is the fact that it frequently may be difficult to obtain information
as to the true condition of such issuers. Such investments may also be adversely affected by laws relating to, among other things, fraudulent
transfers and other voidable transfers or payments, lender liability and the bankruptcy court’s power to disallow, reduce, subordinate
or disenfranchise particular claims. Such companies’ securities may be considered speculative, and the ability of such companies
to pay their debts on schedule could be affected by adverse interest rate movements, changes in the general economic climate, economic
factors affecting a particular industry or specific developments within such companies. In addition, there is no minimum credit standard
that is a prerequisite to the Fund’s investment in any instrument, and a significant portion of the obligations and securities in
which the Fund invests may be less than investment grade. The level of analytical sophistication, both financial and legal, necessary
for successful investment in companies experiencing significant business and financial difficulties is unusually high. There is no assurance
that the Investment Manager will correctly evaluate the value of the assets underlying the Fund’s investments or the prospects for
a successful reorganization or similar action. In any reorganization or liquidation proceeding relating to a company in which the Fund
invests, the Fund may lose its entire investment, may be required to accept cash or securities with a value less than the Fund’s
original investment and/or may be required to accept payment over an extended period of time. Under such circumstances, the returns generated
from the Fund’s investments may not compensate the investors adequately for the risks assumed.
| Annual Report | October 31, 2023 |
7 |
| Saba Capital Income & Opportunities Fund (Unaudited) |
Material Risk Factors |
| |
October 31, 2023 |
In liquidation (both in and out of bankruptcy) and
other forms of corporate reorganization, there exists the risk that the reorganization either will be unsuccessful (due to, for example,
failure to obtain requisite approvals), will be delayed (for example, until various liabilities, actual or contingent, have been satisfied)
or will result in a distribution of cash or a new security the value of which will be less than the purchase price to the Fund of the
security in respect to which such distribution was made.
In certain transactions, the Fund may not be “hedged”
against market fluctuations, or, in liquidation situations, may not accurately value the assets of the company being liquidated. This
can result in losses, even if the proposed transaction is consummated.
High-Yield Securities. The Fund expects
to invest in bonds or other fixed income securities, including, without limitation, “higher yielding” (including non-investment
grade) debt securities, and may take short positions in these securities. Such securities are generally not exchange traded and, as a
result, these financial instruments trade in the over-the-counter marketplace, which is less transparent and has wider bid/ask spreads
than the exchange-traded marketplace. The Fund may invest in these securities when they offer opportunities for capital appreciation (or
capital depreciation in the case of short positions) and may also invest in these securities for temporary defensive purposes and to maintain
liquidity. High-yield securities include, among other securities: bonds, notes and debentures issued by U.S. and non-U.S. corporations
and U.S. Government securities or debt securities issued or guaranteed by a non-U.S. government. These securities may pay fixed, variable
or floating rates of interest, and may include zero coupon obligations.
In addition, the Fund may invest in bonds of issuers
that do not have publicly traded equity securities, making it more difficult to hedge the risks associated with such investments. Also,
the market for credit spreads is often inefficient and illiquid, making it difficult to accurately calculate discounting spreads for valuing
financial instruments. High-yield securities face ongoing uncertainties and exposure to adverse business, financial or economic conditions
which could lead to the issuer’s inability to meet timely interest and principal payments. High-yield securities are subject to
the risk of the issuer’s inability to meet principal and interest payments on its obligations (i.e., credit risk) and are subject
to price volatility resulting from, among other things, interest rate sensitivity, market perception of the creditworthiness of the issuer
and general market liquidity (i.e., market risk). High-yield securities may or may not be subordinated to certain other outstanding securities
and obligations of the issuer, which may be secured by substantially all of the issuer’s assets. High-yield securities may also
not be protected by financial covenants or limitations on additional indebtedness.
The market values of certain of these lower-rated
and unrated debt securities tend to reflect individual corporate developments to a greater extent than do higher-rated securities which
react primarily to fluctuations in the general level of interest rates, and tend to be more sensitive to economic conditions than are
higher-rated securities. Companies that issue such securities are often highly leveraged and may not have available to them more traditional
methods of financing. It is possible that a major economic recession could severely disrupt the market for such securities and may have
an adverse impact on the value of such securities. In addition, it is possible that any such economic downturn could adversely affect
the ability of the issuers of such securities to repay principal and pay interest thereon and increase the incidence of default of such
securities.
Bank Loans. The Fund’s investment
program may include investments in significant amounts of bank loans and participations. These obligations are subject to unique risks,
including: (i) the possible invalidation of an investment transaction as a fraudulent conveyance under relevant creditors’ rights
laws; (ii) so-called lender-liability claims by the issuer of the obligations; (iii) environmental liabilities that may arise with respect
to collateral securing the obligations; and (iv) limitations on the ability of the Fund to directly enforce its rights with respect to
participations. In analyzing each bank loan or participation, the Investment Manager attempts to compare the relative significance of
the risks against the expected benefits of the investment. Successful claims by third parties arising from these and other risks will
be borne by the Fund.
| Saba Capital Income & Opportunities Fund (Unaudited) |
Material Risk Factors |
| |
October 31, 2023 |
As secondary market trading volumes increase, new
loans are frequently adopting standardized documentation to facilitate loan trading, which may improve market liquidity. There can be
no assurance, however, that future levels of supply and demand in loan trading will provide an adequate degree of liquidity or that the
current level of liquidity will continue. Because of the provision to holders of such loans of confidential information relating to the
borrower, the unique and customized nature of the loan agreement, and the private syndication of the loan, loans are not as easily purchased
or sold as a publicly traded security, and historically the trading volume in the loan market has been small relative to the high-yield
debt market.
Non-Investment Grade and Unrated Instruments.
A portion of the Fund’s assets may be invested in instruments that are unrated or have a credit quality rating below investment
grade by internationally recognized credit rating organizations, such as Moody’s Investors Service Inc. and S&P Global Ratings.
The market prices of those securities may fluctuate more than higher-rated securities, and may decline significantly in periods of general
economic difficulty. Those securities generally are considered to have extremely poor prospects of ever attaining any real investment
grade standing and to have a current identifiable vulnerability to default. The issuers or guarantors of those securities are considered
to be less likely to have the capacity to pay interest and repay principal when due in the event of adverse business, financial or economic
conditions. Alternatively, such issuers may be in default or not current in the payment of interest or principal. Adverse changes in economic
conditions or developments regarding the individual issuer are more likely to cause price volatility and weaken the capacity of the issuers
of non-investment grade debt securities to make principal and interest payments than issuers of higher grade debt securities. An economic
downturn affecting an issuer of non-investment grade debt securities may result in an increased incidence of default. In addition, the
market for lower grade debt securities may be less liquid and less active than for higher grade debt securities.
Inflation Risks. The value of assets
or income from investments may be less in the future as inflation decreases the value of money. As inflation increases, the value of the
Fund’s assets can decline as can the value of the Fund’s distributions. This risk is significantly greater if the Fund invests
a significant portion of its assets in fixed-income securities with longer maturities.
Credit Risk. An issuer or guarantor
of a fixed-income security, or the counterparty to a derivatives or other contract, may be unable or unwilling to make timely payments
of interest or principal, or to otherwise honor its obligations. The issuer or guarantor may default causing a loss of the full principal
amount of a security. The degree of risk for a particular security may be reflected in its credit rating. There is the possibility that
the credit rating of a fixed-income security may be downgraded after purchase, which may adversely affect the value of the security.
Interest Rate Risk. Changes in interest
rates will affect the value of the Fund’s investments in fixed-income securities. When interest rates rise, the value of investments
in fixed-income securities tends to fall and this decrease in value may not be offset by higher income from new investments. Interest
rate risk is generally greater for fixed-income securities with longer maturities or durations.
Credit Default Swaps. The Fund expects
to invest in credit default swaps. A credit default swap is a contract between two parties which transfers the risk of loss if a company
fails to pay principal or interest on time or files for bankruptcy. In essence, an institution which owns corporate debt instruments can
purchase a limited form of default protection by entering into a credit default swap with another bank, broker-dealer or financial intermediary.
Upon an event of default, the swap may be terminated in one of two ways: (i) by the purchaser of credit protection delivering the referenced
instrument to the swap counterparty and receiving a payment of par value, or (ii) by the parties pairing off payments, with the purchaser
of the protection receiving a payment equal to the par value of the reference security less the price at which the reference security
trades subsequent to default. The first way is the more common form of credit default swap termination.
In the manner described above, credit default swaps
can be used to hedge a portion of the default risk on a single corporate bond or a portfolio of bonds. Credit default swaps can be used
to implement the Investment Manager’s view that a particular credit, or group of credits, will experience credit improvement. In
the case of expected credit improvement, the Fund may sell credit default protection in which it receives a premium to take on the risk.
In such an instance, the obligation of the Fund to make payments upon the occurrence of a credit event creates leveraged exposure to the
credit risk of the referenced entity. The Fund may also “purchase” credit default protection even in the case in which it
does not own the referenced instrument if, in the judgment of the Investment Manager, there is a high likelihood of credit deterioration.
The credit default swap market in high-yield securities
is evolving compared to the credit default swap market for more seasoned and liquid investment grade securities. Swap transactions dependent
upon credit events are priced incorporating many variables including the pricing and volatility of the common stock, potential loss upon
default and the shape of the U.S. Treasury Yield curve, among other factors. As such, there are many factors upon which market participants
may have divergent views. The Investment Manager may also enter into credit default swap transactions, even if the credit outlook is positive,
if it believes that participants in the marketplace have incorrectly valued the components which determine the value of a swap.
| Annual Report | October 31, 2023 |
9 |
| Saba Capital Income & Opportunities Fund (Unaudited) |
Material Risk Factors |
| |
October 31, 2023 |
Widening and Narrowing Credit Spreads.
The Fund will be impacted by the widening or narrowing of credit spreads. If credit spreads were to narrow, it may result in an increase
in the cost to the Fund of buying securities to cover the short position or resulting in the inability of the Fund to cover the short
position.
Index or Index Options. The Fund may
also purchase and sell indices as well as call and put options on indices, whether or not stock indices are listed on securities exchanges
or traded in the over-the-counter market. An index or index option fluctuates with changes in the market values of the securities included
in the index. Specifically, investments in the CDX and iBoxx indices will fluctuate based upon the value of the underlying components
of the index. In addition, because the value of an index or index option depends upon movements in the level of the index rather than
the price of a particular asset, whether the Fund will realize gains or losses from the purchase or writing of options on indices depends
upon movements in the level of instrument prices in the assets generally or, in the case of certain indices, in an industry or market
segment, rather than movements in the price of particular assets.
Trading of Swaps. The Fund expects to
enter into swap transactions. A swap transaction is an individually negotiated, non-standardized derivative agreement between two parties
to exchange cash flows (and sometimes principal amounts) measured by different interest rates, currency exchange rates, securities, commodities
or other items, indices, or prices, with payments generally calculated by reference to a principal (“notional”) amount or
quantity. Swap contracts are not traded on exchanges and are not otherwise regulated, and as a consequence investors in such contracts
do not benefit from regulatory protections. Swap trading is similar to the spot and forward markets in that banks, broker-dealers or their
affiliates generally act as principals in the swap markets, and the Fund is subject to risks similar to those described in the discussion
of the spot and forward markets.
Catastrophe Bonds. The Fund expects
to invest in catastrophe bonds. Event-linked or catastrophe bonds carry material uncertainties and risk exposures to adverse conditions.
If a trigger event, as defined within the terms of the bond, involves losses or other metrics exceeding a specific magnitude in the geographic
region and time period specified therein, the Fund may lose a portion or all of its investment in such security, including accrued interest
and/or principal invested in such security. Because Catastrophe Bonds cover “catastrophic” events that, if they occur, will
result in significant losses, Catastrophe Bonds carry a high degree of risk of loss and are considered “high yield” or “junk
bonds”. The rating, if any, primarily reflects the rating agency’s calculated probability that a predefined trigger event
will occur. Thus, lower-rated bonds have a greater likelihood of a triggering event occurring and loss to the Fund.
Catastrophe Bonds are also subject to extension risk.
The sponsor of such an investment might have the right to extend the maturity of the bond or note to verify that the trigger event did
occur or to process and audit insurance claims. The typical duration of mandatory and optional extensions of maturity for reinsurance-related
securities currently is between three months to two years. In certain circumstances, the extension may exceed two years. An extension
to verify the potential occurrence of a trigger event will reduce the value of the bond or note due to the uncertainty of the occurrence
of the trigger event and will hinder the Fund’s ability to sell the bond or note. Even if it is determined that the trigger event
did not occur, such an extension will delay the Fund’s receipt of the bond’s or note’s principal and prevent the reinvestment
of such proceeds in other, potentially higher yielding securities.
Quota Share Notes, Excess of Loss Notes and
ILW Notes. The Fund may invest, directly or indirectly, in reinsurance contracts through shares or notes issued in connection
with quota shares and / or may gain exposure to reinsurance contracts through excess of loss notes and/or industry loss warranties (collectively,
“Reinsurance Notes”). As Reinsurance Notes represent an interest, either proportional or non-proportional, in one or more
underlying reinsurance contracts, the Fund has limited transparency into the individual underlying contract(s) and, therefore, must rely
upon the risk assessment and sound underwriting practices of the sponsor. Accordingly, it may be more difficult to fully evaluate the
underlying risk profile of Reinsurance Notes, which may place the Fund’s assets at greater risk of loss than if the Investment Manager
had more complete information. The lack of transparency may also make the valuation of such investments more difficult and potentially
result in mispricing that could result in losses to the Fund. In Reinsurance Notes, the Fund cannot lose more than the amount invested.
Reinsurance Industry Risk. The performance
of reinsurance-related securities and the reinsurance industry itself are tied to the occurrence of various triggering events, including
weather, natural disasters (hurricanes, earthquakes, etc.), non-natural large catastrophes and other specified events causing physical
and/or economic loss. If the likelihood and severity of natural and other large disasters increase, the risk of significant losses to
reinsurers may also increase. Typically, one significant triggering event (even in a major metropolitan area) will not result in financial
failure to a reinsurer. However, a series of major triggering events could cause the failure of a reinsurer. Similarly, to the extent
the Fund invests in reinsurance-related securities for which a triggering event occurs, losses associated with such event could result
in losses to the Fund’s investment, and a series of major triggering events affecting a large portion of the reinsurance-related
securities held by the Fund could result in substantial losses to the Fund’s investment. In addition, unexpected events such as
natural disasters or terrorist attacks could lead to government intervention. Political, judicial and legal developments affecting the
reinsurance industry could also create new and expanded theories of liability or regulatory or other requirements; such changes could
have a material adverse effect on the Fund’s investment.
| Saba Capital Income & Opportunities Fund (Unaudited) |
Material Risk Factors |
| |
October 31, 2023 |
Duration of Reinsurance-Related Securities.
The determination of the level of losses under a reinsurance-related security may be a protracted process and the realizable value of
these reinsurance-related securities, particularly those with respect to which a loss event has occurred, will be delayed until the related
collateral, if any, is released to the Fund and any remaining associated liabilities are finally determined.
Modeling Risk. The Investment Manager,
in selecting certain investments for the Fund, may consider risk models created in-house or by third parties that are based, in part,
on prior transactions, quantitative analysis and industry knowledge. Risk models are designed to assist investors, governments and businesses
to understand the potential impact of a wide variety of events and allow such parties to analyze the probability of loss. Risk models
are created using historical, scientific and other related data and may incorporate quantitative methods. Because such risk models are
based in part upon historical data and averages, there is no guarantee that such information will accurately predict the future occurrence
or severity of any particular event and thus may fail to accurately calculate the probability of an event and may underestimate the likelihood
of an event. Securities or other investments selected using such methods may perform differently from the market as a whole or from their
expected performance for many reasons, including factors used in building the analytical framework, the weights placed on each factor,
and changing sources of market returns, among others. In addition, any errors or imperfections in a risk model (quantitative or otherwise),
analyses, the data on which they are based or any technical issues with the construction of the models (including, for example, data problems
and/or software or other implementation issues) could adversely affect the ability of the Investment Manager to use such analyses or models
effectively, which in turn could adversely affect the Fund’s performance. Risk models are used by the Investment Manager as one
input in its risk analysis process for Fund investments. There can be no assurance that these methodologies will help the Fund to achieve
its investment objective.
Unrated Securities Risk. The Fund may
have exposure to securities that are unrated. Accordingly, the Fund’s unrated investments could constitute a risky and speculative
investment. In addition, such investments may be subject to greater risks than other investments, including greater levels of risk related
to changes in interest rates, credit risk (including a greater risk of default), and illiquidity risk. Unrated investments may be more
susceptible to real or perceived adverse economic and competitive industry or business conditions than higher-grade investments. Yields
on such investments will fluctuate and may, therefore, cause the Fund’s value to be more volatile.
When-Issued and Forward Commitment Securities.
The purchase of securities on a “when-issued” basis involves a commitment by the Fund to purchase or sell securities at a
future date (typically one or two months later). No income accrues on securities that have been purchased on a when-issued basis prior
to delivery to the Fund. When-issued securities may be sold prior to the settlement date. If the Fund disposes of the right to acquire
a when-issued security prior to its acquisition, it may generate a gain or loss. In addition, there is a risk that securities purchased
on a when-issued basis may not be delivered to the Fund. In such cases, the Fund may incur a loss. One type of security which the Fund
is permitted to acquire on a “when-issued” basis is a forward-settling agency MBS where the pool is “to-be-announced”,
known as a “TBA”. Pursuant to these TBAs, the Fund will agree to purchase, for future delivery, agency MBS with certain principal
and interest terms and certain types of underlying collateral, but where the specific agency MBS to be delivered will not be identified
until shortly before the TBA settlement date. In the case of TBAs there is an additional risk that, when the actual terms of the underlying
mortgage pool become known, the Fund may be exposed to greater risk than anticipated.
Illiquid Investments. The Fund may invest
in securities, bank debt, private funds and companies, other assets and/or third-party managers and other claims, which are subject to
legal or other restrictions on transfer or for which no liquid market exists. The market prices, if any, for such investments tend to
be volatile and may not be readily ascertainable, and the Fund may not be able to execute a buy or sell order on exchanges at the desired
price or to liquidate an open position due to market conditions, including the operation of daily price fluctuation limits. The sale of
restricted and illiquid securities often requires more time and results in higher brokerage charges or dealer discounts and other selling
expenses than does the sale of securities eligible for trading on national securities exchanges or in the over-the-counter markets. The
Fund may not be able to readily dispose of such illiquid investments and, in some cases, may be contractually prohibited from disposing
of such investments for a specified period of time. If trading on an exchange is suspended or restricted, the Fund may not be able to
execute trades or close out positions on terms that the Investment Manager believes are desirable. Realization of value from such investments
may be difficult in the short-term, or may have to be made at a substantial discount compared to other freely tradable investments. An
investment in the Fund is suitable only for certain sophisticated investors who do not require immediate liquidity for their investments.
Valuation. Securities which the Investment
Manager believes are fundamentally undervalued or overvalued may not ultimately be valued in the capital markets at prices and/or within
the time frame the Investment Manager anticipates. In particular, purchasing securities at prices which the Investment Manager believes
to be distressed or below fair value is no guarantee that the price of such securities will not decline even further.
| Annual Report | October 31, 2023 |
11 |
| Saba Capital Income & Opportunities Fund (Unaudited) |
Material Risk Factors |
| |
October 31, 2023 |
Derivative Investments. The prices of
derivative instruments, including futures and options, are volatile. Payments made pursuant to swap agreements may also be volatile. Price
movements of futures and options contracts and payments pursuant to swap agreements are influenced by, among other things, interest rates,
changing supply and demand relationships, trade, fiscal, monetary and exchange control programs and policies of governments, and national
and international political and economic events and policies. The value of futures, options and swap agreements also depends upon the
price of the commodities underlying them. In addition, the Fund’s assets are subject to the risk of the failure of any of the exchanges
on which its positions trade or of its clearinghouses or counterparties.
The Fund may buy or sell (write) both call options
and put options, and when it writes options, it may do so on a “covered” or an “uncovered” basis. A call option
is “covered” when the writer owns securities of the same class and amount as those to which the call option applies. A put
option is covered when the writer has an open short position in securities of the relevant class and amount. The Fund’s option transactions
may be part of a hedging strategy (i.e., offsetting the risk involved in another securities position) or a form of leverage, in which
the Fund has the right to benefit from price movements in a large number of securities with a small commitment of capital. These activities
involve risks that can be substantial, depending on the circumstances.
In general, without taking into account other positions
or transactions the Fund may enter into, the principal risks involved in options trading can be described as follows: When the Fund buys
an option, a decrease (or inadequate increase) in the price of the underlying security in the case of a call, or an increase (or inadequate
decrease) in the price of the underlying security in the case of a put, could result in a total loss of the Fund’s investment in
the option (including commissions). The Fund could mitigate those losses by selling short, or buying puts on, the securities for which
it holds call options, or by taking a long position (e.g., by buying the securities or buying calls on them) in securities for which it
holds put options.
When the Fund sells (writes) an option, the risk can
be substantially greater than when it buys an option. The seller of an uncovered call option bears the risk of an increase in the market
price of the underlying security above the exercise price. The risk is theoretically unlimited unless the option is “covered”.
If it is covered, the Fund would forego the opportunity for profit on the underlying security should the market price of the security
rise above the exercise price. If the price of the underlying security were to drop below the exercise price, the premium received on
the option (after transaction costs) would provide profit that would reduce or offset any loss the Fund might suffer as a result of owning
the security.
Swaps and certain options and other customized instruments
are subject to the risk of non-performance by the swap counterparty, including risks relating to the creditworthiness of the swap counterparty,
market risk, liquidity risk and operations risk.
Hedging Transactions. The Fund may utilize
financial instruments, both for investment purposes and for risk management purposes in order to (i) protect against possible changes
in the market value of the Fund’s investment portfolio resulting from fluctuations in the securities markets and changes in interest
rates; (ii) protect the Fund’s unrealized gains in the value of the Fund’s investment portfolio; (iii) facilitate the sale
of any such investments; (iv) enhance or preserve returns, spreads or gains on any investment in the Fund’s portfolio; (v) hedge
the interest rate or currency exchange rate on any of the Fund’s liabilities or assets; (vi) protect against any increase in the
price of any securities the Fund anticipates purchasing at a later date or (vii) for any other reason that the Investment Manager deems
appropriate.
The success of the Fund’s hedging strategy will
depend, in part, upon the Investment Manager’s ability to correctly assess the degree of correlation between the performance of
the instruments used in the hedging strategy and the performance of the portfolio investments being hedged. Since the characteristics
of many securities change as markets change or time passes, the success of the Fund’s hedging strategy will also be subject to the
Investment Manager’s ability to continually recalculate, readjust and execute hedges in an efficient and timely manner. While the
Fund may enter into hedging transactions to seek to reduce risk, such transactions may result in a poorer overall performance for the
Fund than if it had not engaged in such hedging transactions. For a variety of reasons, the Investment Manager may not seek to establish
a perfect correlation between the hedging instruments utilized and the portfolio holdings being hedged. Such an imperfect correlation
may prevent the Fund from achieving the intended hedge or expose the Fund to risk of loss. The Investment Manager may not hedge against
a particular risk because it does not regard the probability of the risk occurring to be sufficiently high as to justify the cost of the
hedge, or because it does not foresee the occurrence of the risk. The successful utilization of hedging and risk management transactions
requires skills complementary to those needed in the selection of the Fund’s portfolio holdings.
Closed-End Funds. The Fund does invest
globally in CEFs that are operated by a diversified group of U.S. and non-U.S. closed-end fund managers (“CEF Managers”).
To the extent that such CEFs invest in financial instruments similar to those invested in by the Fund, the risk factors that are set forth
herein with respect to such instruments will also apply to the CEFs in which the Fund invests, and thus indirectly apply to the Fund.
Risks Relating to Underlying CEF Managers.
CEF Managers are subject to various risks, including, but not limited to, operational risks such as the ability to provide the adequate
operating environment for a CEF such as back office functions, trade processing, accounting, administration, risk management, valuation
services and reporting. CEF Managers may also face competition from other investment managers, which may be more established and have
larger capital bases and have larger numbers of qualified management and technical personnel. Additionally, certain CEF Managers may pursue
over time different investment strategies which may limit the Fund’s ability to assess a CEF Manager’s ability to achieve
its longterm investment objective. Furthermore, a CEF Manager may face additional risks as the assets of a CEF increase over time. In
such instances, a CEF Manager may not be able to handle properly the operating volumes of a CEF with an increased capital basis. Also,
a CEF Manager may be unable to manage a CEF’s increased assets effectively because it may be unable to maintain such CEF’s
current investment strategy or find the types of investments better suited for a CEF with an increased capital basis.
| Saba Capital Income & Opportunities Fund (Unaudited) |
Material Risk Factors |
| |
October 31, 2023 |
Independent CEF Managers. CEF Managers
generally invest wholly independently of one another and may at times hold economically offsetting positions. To the extent that such
CEF Managers do, in fact, hold offsetting positions, the Fund, considered as a whole, may not achieve any gains or losses despite incurring
investment expenses, including, without limitation, performance-based compensation. In addition, there may often be times when a particular
CEF Manager may receive performance-based compensation in respect of the Fund’s investments for a period even though the Fund’s
overall portfolio depreciated during such period. Some CEF Managers also may compete with each other from time to time for the same positions
in certain markets. Such competition may adversely affect the performance of CEFs managed by such CEF Managers. In addition, although
the Investment Manager receives detailed information from each CEF Manager regarding its investment performance and investment strategy,
the Investment Manager may have little or no means of independently verifying this information. A CEF Manager may use proprietary investment
strategies that are not fully disclosed to the Investment Manager, which may involve risks that are not anticipated by the Investment
Manager. In addition, the Fund will still face the risk of CEF Manager misrepresentation, material strategy alteration or poor judgment.
Although CEF Managers are required to adhere to the offering documents for the respective funds, the Investment Manager cannot control
the investments made by a CEF Manager. The Investment Manager’s sole remedy in the event of a deviation by a CEF Manager from its
offering documents (such as in the case of “style drift”) may be to cause the Fund to withdraw capital from a CEF Manager’s
fund, subject to any applicable withdrawal restrictions.
Style Drift. The Investment Manager
relies primarily on information provided by CEF Managers in assessing a CEF Manager’s defined investment strategy, the underlying
risks of such a strategy and, ultimately, determining whether, and to what extent, it will allocate the Fund’s assets to particular
CEF Managers. “Style drift” is the risk that a CEF Manager may deviate from his or her stated or expected investment strategy.
Style drift can occur abruptly if a CEF Manager believes it has identified an investment opportunity for higher returns from a different
approach (and the manager disposes of an interest quickly to pursue this approach) or it can occur gradually, such as if, for instance,
a “value”-oriented CEF Manager gradually increases a CEF’s investments in “growth” stocks. Style drift can
also occur if a CEF Manager focuses on factors it had deemed immaterial in its offering documents --such as particular statistical information
or returns relative to certain benchmarks. Additionally, style drift may result in a manager pursuing investment opportunities in an area
in which it has a competitive disadvantage or is outside the manager’s area of expertise (e.g., a large-cap manager focusing on
small-cap investment opportunities). Moreover, style drift poses a particular risk for multiple-manager structures since, as a consequence,
the Fund may be exposed to particular markets or strategies to a greater extent than was anticipated by the Investment Manager when it
assessed the portfolio’s risk-return characteristics and allocated assets to a CEF Manager (and which may, in turn, result in overlapping
investment strategies among various CEF Managers).
Special Purpose Acquisition Companies.
A SPAC is a publicly traded company formed for the purpose of raising capital through an initial public offering to fund the acquisition,
through a merger, capital stock exchange, asset acquisition or other similar business combination, of one or more operating businesses
that are typically not publicly-listed. Following the acquisition of a target company, a SPAC’s management team may exercise control
over the management of the combined company in an effort to increase its value. Often now, though, management of the target company will
continue to manage the now publicly-traded business subsequent to completion of its business combination with the SPAC. Capital raised
through the initial public offering of securities of a SPAC is typically placed into a trust account until acquired business combination
is completed or a predetermined period of time (typically 24 months) elapses. Investors in a SPAC would receive a return on their investment
in the event that a target company is acquired and the combined publicly-traded company’s shares trade above the SPAC’s initial
public offering (“IPO”) price, or alternatively, the market price at which an investor acquired a SPAC’s shares
subsequent to its IPO. In the event that a SPAC is unable to locate and acquire a target business by the timeframe established at the
time of its IPO, the SPAC would be forced to liquidate its assets, which may result in losses due to the expenses and liabilities of the
SPAC, to the extent third-parties are permitted to bring claims against IPO proceeds held in the SPAC’s trust account. Investors
in a SPAC are subject to the risk that, among other things, (i) such SPAC may not be able to complete a qualifying business combination
by the deadline established at the time of its IPO, (ii) assets in the trust account may become subject to third-party claims against
such SPAC, which may reduce the per share liquidation value received by the investors in the SPAC in the event it fails to complete a
business combination within the required time period, (iii) such SPAC may be exempt from the rules promulgated by the SEC to protect investors
in “blank check” companies, such as Rule 419 promulgated under the Securities Act of 1933, as amended (the “Securities
Act”), so that investors in such SPAC may not be afforded the benefits or protections of those rules, (iv) such SPAC will likely
only complete one business combination, which will cause its returns and future prospects to be solely dependent on the performance of
a single acquired business, (v) the value of any target business, including its stock price as a public company, may decrease following
its acquisition by such SPAC, (vi) the value of the funds invested and held in the trust account may decline, (vii) the inability to redeem
due to the failure to hold the securities in the SPAC on the applicable record date to do so, and (viii) if the SPAC is unable to consummate
a business combination, public stockholders will be forced to wait until the deadline before liquidating distributions are made. The Fund
may invest in a SPAC that, at the time of investment, has not selected or approached any prospective target businesses with respect to
a business combination. In such circumstances, there may be limited basis for the Fund to evaluate the possible merits or risks of such
SPAC’s investment in any particular target business. In addition, to the extent that a SPAC completes a business combination, it
may be affected by numerous risks inherent in the business operations of the acquired company or companies. For these and additional reasons,
investments in SPACs are speculative and involve a high degree of risk.
| Annual Report | October 31, 2023 |
13 |
| Saba Capital Income & Opportunities Fund (Unaudited) |
Material Risk Factors |
| |
October 31, 2023 |
Further, SPACs are structured as publicly-traded blank
check companies. Accordingly, the Fund will also be subject to risks that arise from investments in vehicles that are managed by independent
third parties, as well as the risk that the underlying business combinations being pursued by the SPACs in which the Fund invests will
not be consummated or will not be successful.
Founder’s Equity and Sponsor Vehicle Investments.
The Fund may invest in founder’s equity, consisting of founder’s shares and/or private placement warrants issued by a SPAC
in connection with its formation and IPO, either directly or indirectly through equity interests in a related sponsor vehicle which holds
such founders equity instruments. Founder’s shares are similar to the shares of stock issued by a SPAC in its IPO, but have no right
to receive any proceeds from a SPAC’s trust account pursuant to redemption or liquidation of the SPAC. Similarly, private placement
warrants have terms that mirror those of the warrants issued by a SPAC in connection with its IPO, but expire worthless if the SPAC fails
to consummate a qualifying business combination within the required time period. As a result, an investment in founder’s equity
of a SPAC poses a risk of total loss of investment in the event the SPAC is unsuccessful in completing a business combination. In addition,
the Fund may be required to agree to certain terms, including with respect to the acquisition, holding and/or voting of its liquid position
in a SPAC, in order to receive exposure to a SPAC’s founder’s equity. Any founders shares distributed to the Fund will also
typically be subject to a lock-up period subsequent to completion of a business combination, which will restrict the Fund’s ability
to dispose of such shares for up to one year after a SPAC completes its business combination. Similar to SPAC PIPE shares, founder’s
shares, private placement warrants, and any shares issued upon exercise of such private placement warrants, will also be restricted securities,
which further limit their liquidity absent registration under the Securities Act.
Risks Relating to Investments In Exchange Traded
Funds/Trusts that invest in cryptocurrencies or similar assets that utilize blockchain technology. Consistent with the Fund’s
closed-end fund investment approach, where the Fund seeks to capitalize on the difference between a closed-end fund’s aggregate
asset value and its net asset value, the Fund has and may in the future invest in exchange traded investment funds/trusts that invest
in cryptocurrencies or similar assets that utilize blockchain technology (such as, the Grayscale Bitcoin Trust) and the Fund may hedge
such investments through the use of other securities (including other exchange trade funds that own virtual currencies) and derivatives
of virtual currencies, in each case, to the extent permitted by, and in accordance with, any future law, regulation, guidance, or exemptive
relief provided by the SEC or its staff or other regulatory agency or body having jurisdiction. The Fund expects that any such investments
are likely to constitute only a small proportion of its portfolio.
The following Risk Factors relate to investment held by exchange traded
investment funds/trusts that invest in cryptocurrencies or similar assets:
Virtual currencies are relatively new, evolving products
based upon new and evolving technologies. An investment in any virtual currency is subject to a variety of risks, including technological,
security and regulatory risks as well as associated uncertainties over the future existence, support and development of such virtual currency.
Virtual currencies may also experience unusual volatility. Any such investment is highly speculative and subject to the risk that the
entirety or a material portion of such investment or its value may be lost. Virtual currency derivatives, such as futures or options on
futures on a virtual currency, are also a relatively new asset class, and trading in these instruments, like trading in the virtual currencies
themselves, carries a high level of risk. Investments in virtual currency derivatives, like direct investments in virtual currencies,
should be considered speculative and may to result in a total loss of capital. Virtual currencies are not legal tender, but a type of
highly decentralized electronic commodity that is not typically backed by any intermediating authority, such as a central bank or a national,
supra-national or quasi-national organization, or any hard assets, human capital, or other form of credit. Rather, their value is based
on (and fluctuates frequently according to) supply and demand factors, the number of merchants that accept the currency, and the value
that various market participants place on it through their mutual agreement, barter or transactions.
The creation of new units of the virtual currency,
as well recordation of ownership and transactions in the currency, is typically driven by an algorithmic system distributed over a very
large computer network with many participants. Typically, an individual virtual currency unit exists as a record in a digital file, based
upon a mathematical proof, and is comprised of a public key that encrypts a transaction value and a private key that decrypts it. Virtual
currencies allow users to send payments within a decentralized, peer-to-peer network, and do not require a central clearinghouse or financial
institution clearing transactions.
| Saba Capital Income & Opportunities Fund (Unaudited) |
Material Risk Factors |
| |
October 31, 2023 |
Cybersecurity Risk. Because of
the cryptographic characteristics of virtual currency networks and their large number of users, direct attacks on the integrity of a virtual
currency network (such as to change ownership, the number of units of the virtual currency in circulation, or the history of transactions)
are generally considered impractical, but new technological developments or unforeseen technical flaws in a virtual currency’s algorithm
could create opportunities for disruption. If the basic algorithm of a virtual currency were compromised, the value of the virtual currency
itself, and derivatives thereupon, could be severely affected. Note, also, that the electronic exchanges and third-party custodians that
facilitate trading in virtual currencies may experience, and have experienced, cybersecurity incidents of their own. As described below,
depending upon the electronic custody arrangements used by an exchange, a compromise of its systems can result in an irreversible loss
of virtual currency for users even if the algorithm of the virtual currency itself remains technically sound. Hackers or malicious actors
may launch attacks to steal, compromise, or secure virtual currencies, such as by attacking virtual currency network source code, exchange
servers, third-party platforms, cold and hot storage locations or software, or virtual currency transaction history, or by other means.
Depending upon the scale of such an incident, it could have systemic effects upon the value and liquidity of a virtual currency. Although
virtual currency derivatives may not be directly exposed to this latter so-called “wallet risk”, major disruptions to one
or more virtual currency exchanges could have valuation effects on a virtual currency that would negatively impact the value of its derivatives
in turn.
Risks Associated With “Digital Wallets”.
Exchange traded funds and trusts may use digital currency “wallets” (a “virtual currency wallet” being a programmatic
record system that contains virtual currency units) provided by exchanges or other third-parties to hold all or a portion of such exchange
traded fund’s and trust’s virtual currencies. Such funds may be unable to conduct detailed information technology diligence
on such third-party wallet providers and, as a result, may not be aware of all security vulnerabilities and risks. Certain third-party
wallet providers might not indemnify the exchange traded fund or trust against any losses of virtual currencies. Certain virtual currencies
are intended to be controllable only by the possessor of both the unique public and private keys relating to the local or online digital
wallet in which such virtual currencies are held. If private keys relating to such exchange traded fund’s or trust’s virtual
currency holdings are lost, destroyed or otherwise compromised and such private keys are not capable of being restored by a virtual currency
network, such exchange traded fund or trust may be unable to access the related virtual currencies. Further, virtual currencies are typically
transferred digitally, through electronic media not controlled or regulated by any entity. If a virtual currency transfers to the wrong
destination, the exchange traded fund or trust may be unable to recover the virtual currency or its value.
Price Volatility Risks. A principal
risk in trading virtual currencies and virtual currency derivatives is the rapid fluctuation of their market price. Virtual currencies
experience significant price volatility, which may result in substantial changes in the value of a derivative contract on the underlying
virtual commodity. The price of virtual currencies may be affected generally by a wide variety of complex and difficult to predict factors
such as virtual currency supply and demand; rewards and transaction fees for the recording of transactions; availability and access to
virtual currency service providers (such as payment processors), exchanges or other virtual currency users and market participants; perceived
or actual virtual currency network or virtual currency security vulnerability; inflation levels; fiscal policy; interest rates; and political,
natural and economic events. Additionally, the highly distributed nature of virtual currency trading can complicate efficient price discovery
for a virtual currency in the marketplace, an effect compounded by the fact that the distributed network responsible for processing virtual
currency transactions may have a relatively limited transaction volume.
Fluctuations in the underlying virtual currency’s
value between the time that a trade is placed for a virtual currency futures contract and the time that an attempt is made to it liquidate
it will affect the value of a futures contract and the potential profit and losses related to it.
Like futures generally, virtual currency futures are
also traded using initial margin, which permits positions to be established in these instruments whose value exceeds the initial investment.
Because the initial margin of a virtual currency derivative may be set as a percentage of the value of the contract, margin requirements
for a long position may significantly increase if price of the contract rises. Additionally, due to the leverage effect provided by initial
margin, unfavorable movements in the price of a virtual currency future can produce substantial losses compared to the size of the size
of the initial investment. These risks are enhanced in the context of increased price volatility. There is no guarantee that the exchange
traded fund or trust will be able to achieve a better than average market price for virtual currencies in owns through such exchange traded
fund or trust or virtual currency derivatives or will purchase such assets at the most favorable price available.
Virtual Currencies are Speculative Investments.
To date, speculators and investors seeking to profit from either short- or long-term holding of virtual currencies have driven much of
the demand for these products. Virtual currencies typically have a very limited commercial and retail market application, thus contributing
to price volatility that could adversely affect an investment. Virtual currencies are not yet widely adopted as a means of payment for
goods and services, and banks and other established financial institutions may refuse to process funds for virtual currency transactions,
process wire transfers to or from their exchanges, as well as virtual currency-related companies or service providers, or maintain accounts
for persons or entities transacting in virtual currencies. Accordingly, investments in virtual currencies and virtual currency derivatives
should be considered highly speculative.
| Annual Report | October 31, 2023 |
15 |
| Saba Capital Income & Opportunities Fund (Unaudited) |
Material Risk Factors |
| |
October 31, 2023 |
Risk of Competition. As purely algorithmic
constructs, virtual currencies present a relatively low barrier to entry for new financial products, and competitive products for a particular
virtual currency may readily develop and vie for market share.
Fees Associated With Virtual Currency Networks.
Virtual currency network participants may charge a fee for effectuating certain essential services, such as transaction recording. These
fees are sensitive to prevailing market conditions and may increase during periods of high volume.
Risks Associated With Virtual Currency Exchanges.
The virtual currency exchanges on which virtual currencies trade are relatively new and largely unregulated and may therefore be more
exposed to theft, fraud and failure than established, regulated exchanges for other products. Liquidity for a virtual currency may be
inconsistent or limited, particularly during periods of market stress. Virtual currency exchanges may impose daily, weekly, monthly or
customer-specific transaction or distribution limits or suspend redemptions entirely, rendering the exchange of virtual currency difficult
or impossible. Virtual currency exchanges are appealing targets for cybercrime, hackers and malware. It is possible that any such exchange
may cease operations due to theft, fraud, security breach, liquidity issues, anti-money laundering issues or government investigation.
While the virtual currency spot trading market is relatively unregulated, investors should note that both U.S.-domestic and foreign regulators
have applied serious sanctions, including trading bans, to virtual currency exchanges that were found derelict under applicable laws.
In addition, banks may refuse to process wire transfers to or from exchanges. Over the past several years, many exchanges have, indeed,
closed due to fraud, theft, government or regulatory involvement, failure or security breaches, or banking issues. The exchange traded
fund and trust may be unable to replace missing virtual currencies or seek reimbursement for any theft of virtual currencies.
While virtual currencies have been determined to be
commodities under the U.S. Commodity Exchange Act, as amended, the CFTC’s regulatory oversight authority over commodity cash markets
is limited. The CFTC maintains general anti-fraud and manipulation enforcement authority over virtual currency cash markets as a commodity
in interstate commerce. However, recourse for recovery of any fiat currency lost as a result of participating in a virtual currency exchange
may be limited in practice due to technological considerations. The spot and underlying markets for virtual currency are relatively opaque
systems in which the ultimate beneficial owners of units of virtual currency may be difficult or impossible to identify, complicating
antitheft and antifraud measures by virtual currency exchanges or regulators.
Risks Associated With Virtual Currency Derivatives
Exchanges. Futures exchanges subject to U.S. jurisdiction that trade in virtual currency derivatives are responsible for regulating
their activities with CFTC oversight; certain exchanges have also contracted with the NFA to implement monitoring and rule compliance
in furtherance of the CFTC’s rules. Exchange-traded virtual currency derivatives that are subject to CFTC jurisdiction mitigate
some of the risks of direct participation in virtual currency trading by interposing regulated facilities and contracts between traders
and the underlying virtual currency market. Nevertheless, to the extent that disruptions in the exchanges of an underlying virtual currency
affect the value of that commodity, derivatives in that virtual currency may be negatively impacted as well.
Futures commission merchants may impose enhanced trading
restrictions upon virtual currency derivatives due to their novel and highly speculative nature. Virtual currency derivatives contracts
may be subject to additional margin, dynamic price limits, position limits, or prohibitions on trading strategies such as certain forms
of short selling or give-up/give-in transactions. Designated contract markets for virtual currency derivatives may impose trading halts
that may restrict a market participant’s ability to exit a position during a period of high volatility. Such features could affect
the ability of the Investment Manager to expand or exit a position in virtual currency derivatives at the most financially opportune moment,
potentially resulting in losses to the Fund.
Additional Regulatory Considerations.
The regulatory schemes affecting virtual currencies may not be fully developed. Government action or regulation may directly or indirectly
affect a virtual currency market or network, influencing virtual currency use or prices. It is possible that any jurisdiction may, in
the near or distant future, adopt laws, regulations, policies or rules directly or indirectly affecting a virtual currency network, generally,
or restricting the right to acquire, own, hold, sell, convert, trade, use or exchange virtual currencies. Like virtual currencies themselves,
virtual currency derivatives exist within an evolving regulatory landscape and could also become subject to new regulations with valuation
consequences for these instruments. Such changes could be difficult or impossible to predict.
Additional Tax Considerations. Many
significant aspects of the tax treatment of investments in cryptocurrency are uncertain, and a direct or indirect investment in cryptocurrency
may produce income that if directly earned by a regulated investment company like the Fund, would be treated as non-qualifying income
for purposes of the income test applicable to regulated investment companies. Accordingly, to the extent the Fund invests in cryptocurrencies
futures, or investment vehicles that invest in cryptocurrencies, it will do so through a subsidiary.
| Saba Capital Income & Opportunities Fund (Unaudited) |
Material Risk Factors |
| |
October 31, 2023 |
In 2014, the IRS released a notice (the “Notice”)
discussing certain aspects of “convertible virtual currency” (that is, digital assets that have an equivalent value in fiat
currency or that act as a substitute for fiat currency) for U.S. federal income tax purposes and, in particular, stating that such a digital
asset (i) is “property,” (ii) is not “currency” for purposes of the rules relating to foreign currency gain or
loss and (iii) may be held as a capital asset. In 2019, the IRS released a revenue ruling and a set of “Frequently Asked Questions”
(the “Ruling & FAQs”) that provide some additional guidance. However, the Notice and the Ruling & FAQs do not address
other significant aspects of the U.S. federal income tax treatment of digital assets.
Other tax issues include the income and withholding
taxation of incidental rights received through a fork in the blockchain, airdrops offered to bitcoin holders and other similar events,
including situations where such rights are disclaimed, as is expected with respect to Grayscale Bitcoin Trust’s intended treatment
of such events. There is limited guidance from the IRS with respect to the treatment of bitcoin for tax purposes. In any event, there
can be no assurance that the IRS will not alter its positions or otherwise provide further guidance, potentially retroactive in effect,
with respect to digital assets in the future or that a court would uphold the treatment set forth in the Notice and the Ruling & FAQs
or in other guidance.
It is unclear what additional guidance on the treatment
of digital assets for U.S. federal, state and local income tax purposes may be issued or when such guidance may be issued. Because of
the evolving nature of digital assets, it is not possible to predict potential future developments that may arise with respect to digital
assets. Any future guidance on the treatment of digital assets for federal, state or local tax purposes could result in adverse tax consequences
for the Fund or the subsidiary and could have an adverse effect on the value of bitcoin, ether and other cryptocurrencies.
The foregoing list of material risk factors does
not purport to be a complete enumeration or explanation of the risks involved in an investment in the Fund. The Fund opportunistically
implements strategies it believes from time to time will be best suited to prevailing market conditions and to the Investment Manager’s
investment experience. Such strategies or approaches may involve higher levels of risk than the ones discussed herein. There can be no
assurance that the Investment Manager will be successful in applying any strategy or discretionary approach to the Fund’s investments.
Investors and prospective investors should read
this entire risk disclosure as well as the more complete list of Fund Risk Factors and other materials set forth on the Fund’s website
(https://www.sabacef.com), the definitive proxy describing the Fund’s investment program (as amended), and the Fund’s Prospectus.
Investors and prospective investors should consult with their own advisors before deciding whether to invest in the Fund. In addition,
prospective and current investors should note that the Prospectus is and may become outdated and/or inaccurate as the Fund’s investment
program may develop and change over time. An investment in the Fund may be subject to additional and different risk factors that are not
outlined above.
| Annual Report | October 31, 2023 |
17 |
| Saba Capital Income & Opportunities Fund |
Report of Independent Registered Public Accounting Firm |
To the Shareholders and Board of Trustees of Saba Capital Income &
Opportunities Fund
Opinion on the Financial Statements
We have audited the accompanying consolidated statement
of assets and liabilities of Saba Capital Income & Opportunities Fund (the “Fund”), including the consolidated schedule
of investments, as of October 31, 2023, and the related consolidated statements of operations and cash flows for the year then ended,
the statements of changes in net assets for each of the two years in period then ended, the financial highlights for each of the two years
in the period ended October 31, 2023, the period from March 1, 2021 to October 31, 2021 and each of the two years in the period ended
February 28, 2021 and the related notes (collectively referred to as the “consolidated financial statements”). In our opinion,
the consolidated financial statements present fairly, in all material respects, the financial position of the Fund at October 31, 2023,
and the results of its operations and its cash flows for the year then ended, the changes in its net assets for each of the two years
in the period then ended and its financial highlights for each of the two years in the period ended October 31, 2023, the period from
March 1, 2021 to October 31, 2021 and each of the two years in the period ended February 28, 2021, in conformity with U.S. generally accepted
accounting principles.
The financial highlights for the year ended February
28, 2019 was audited by other auditors whose report dated April 26, 2019, expressed an unqualified opinion on those consolidated financial
statements and financial highlights.
Basis for Opinion
These financial statements are the responsibility
of the Fund’s management. Our responsibility is to express an opinion on the Fund’s financial statements based on our audits.
We are a public accounting firm registered with the Public Company Accounting Oversight Board (United States) ("PCAOB") and
are required to be independent with respect to the Fund in accordance with the U.S. federal securities laws and the applicable rules and
regulations of the Securities and Exchange Commission and the PCAOB.
We conducted our audits in accordance with the standards
of the PCAOB. Those standards require that we plan and perform the audit to obtain reasonable assurance about whether the financial statements
are free of material misstatement, whether due to error or fraud. The Fund is not required to have, nor were we engaged to perform, an
audit of the Fund’s internal control over financial reporting. As part of our audits, we are required to obtain an understanding
of internal control over financial reporting but not for the purpose of expressing an opinion on the effectiveness of the Fund’s
internal control over financial reporting. Accordingly, we express no such opinion.
Our audits included performing procedures to assess
the risks of material misstatement of the financial statements, whether due to error or fraud, and performing procedures that respond
to those risks. Such procedures included examining, on a test basis, evidence regarding the amounts and disclosures in the financial statements.
Our procedures included confirmation of securities owned as of October 31, 2023, by correspondence with the custodian and others or by
other appropriate auditing procedures where replies from others were not received. Our audits also included evaluating the accounting
principles used and significant estimates made by management, as well as evaluating the overall presentation of the financial statements.
We believe that our audits provide a reasonable basis for our opinion.

We have served as the auditor of Saba Capital Income and Opportunities
Fund since 2019.
New York, New York
December 21, 2023
| Annual Report | October 31, 2023 |
18 |
| Saba Capital Income & Opportunities Fund |
Consolidated Schedule of Investments |
| |
October 31, 2023 |
| | |
Principal Amount | | |
Fair Value | |
| CORPORATE BONDS - 10.38% | |
| | | |
| | |
| Communications - 0.85% | |
| | | |
| | |
| | |
| | | |
| | |
| Charter Communications Operating Capital, 3.500%, 03/01/2042 | |
$ | 5,000,000 | | |
$ | 2,954,127 | |
| Diamond Sports Group LLC / Diamond Sports Finance Co., 5.375%, 08/15/2026(a) | |
| 4,000,000 | | |
| 60,000 | |
| | |
| | | |
| 3,014,127 | |
| Consumer Discretionary - 2.57% | |
| | | |
| | |
| | |
| | | |
| | |
| Adtalem Global Education, Inc., 5.500%, 03/01/2028(a) | |
| 6,195,000 | | |
| 5,683,912 | |
| RR Donnelley & Sons Co., 8.250%, 07/01/2027(a) | |
| 935,000 | | |
| 953,550 | |
| RR Donnelley & Sons Co., 9.750%, 07/31/2028(a) | |
| 2,494,000 | | |
| 2,444,120 | |
| | |
| | | |
| 9,081,582 | |
| Consumer Staples - 2.58% | |
| | | |
| | |
| | |
| | | |
| | |
| Altria Group, Inc., 4.250%, 08/09/2042 | |
| 10,614,000 | | |
| 7,255,385 | |
| BAT Capital Corp., 3.7340%, 09/25/2040 | |
| 3,000,000 | | |
| 1,886,399 | |
| | |
| | | |
| 9,141,784 | |
| Energy - 0.88% | |
| | | |
| | |
| | |
| | | |
| | |
| Transocean Inc., 7.450%, 04/15/2027 | |
| 3,573,000 | | |
| 3,130,091 | |
| | |
| | | |
| | |
| Financials - 1.53% | |
| | | |
| | |
| | |
| | | |
| | |
| Credit Suisse AG, 0.000% (Variable Rate), 07/31/2030(h) | |
| 10,000 | | |
| 7,140 | |
| Credit Suisse AG, 0.000% (Variable Rate), 10/30/2030(h) | |
| 420,000 | | |
| 285,012 | |
| Morgan Stanley, 0.000% (Variable Rate), 04/30/2030(h) | |
| 25,000 | | |
| 15,885 | |
| Morgan Stanley, 0.000% (Variable Rate), 07/31/2030(h) | |
| 80,000 | | |
| 50,095 | |
| Morgan Stanley, 0.000% (Variable Rate), 10/30/2030(h) | |
| 80,000 | | |
| 49,170 | |
| Morgan Stanley, 0.000% (Variable Rate), 09/26/2033(h) | |
| 428,000 | | |
| 229,707 | |
| Morgan Stanley, 0.000% (Variable Rate), 10/31/2033(h) | |
| 266,000 | | |
| 150,163 | |
| Morgan Stanley, 0.000% (Variable Rate), 02/28/2034(h) | |
| 478,000 | | |
| 264,860 | |
| Morgan Stanley, 0.000% (Variable Rate), 03/31/2034(h) | |
| 302,000 | | |
| 153,931 | |
| Morgan Stanley, 0.000% (Variable Rate), 04/30/2034(h) | |
| 66,000 | | |
| 34,395 | |
| Morgan Stanley, 0.000% (Variable Rate), 05/30/2034(h) | |
| 89,000 | | |
| 49,281 | |
| Morgan Stanley, 0.000% (Variable Rate), 06/30/2034(h) | |
| 460,000 | | |
| 261,796 | |
| Morgan Stanley, 0.000% (Variable Rate), 07/31/2034(h) | |
| 25,000 | | |
| 13,776 | |
| Morgan Stanley, 0.000% (Variable Rate), 08/29/2034(h) | |
| 171,000 | | |
| 90,215 | |
| Morgan Stanley, 0.000% (Variable Rate), 09/30/2034(h) | |
| 319,000 | | |
| 171,391 | |
| Morgan Stanley, 0.000% (Variable Rate), 10/08/2034(h) | |
| 32,000 | | |
| 19,567 | |
| Morgan Stanley, 0.000% (Variable Rate), 10/31/2034(h) | |
| 641,000 | | |
| 355,665 | |
| Morgan Stanley, 0.000% (Variable Rate), 11/28/2034(h) | |
| 256,000 | | |
| 137,785 | |
| Morgan Stanley, 0.000% (Variable Rate), 01/30/2035(h) | |
| 244,000 | | |
| 134,635 | |
| Morgan Stanley, 0.000% (Variable Rate), 02/27/2035(h) | |
| 36,000 | | |
| 20,361 | |
| Morgan Stanley, 0.000% (Variable Rate), 03/31/2035(h) | |
| 641,000 | | |
| 335,802 | |
| Morgan Stanley, 0.000% (Variable Rate), 02/29/2036(h) | |
| 61,000 | | |
| 33,429 | |
| Morgan Stanley, 0.000% (Variable Rate), 04/28/2036(h) | |
| 10,000 | | |
| 5,688 | |
| Morgan Stanley, 0.000% (Variable Rate), 06/30/2036(h) | |
| 40,000 | | |
| 22,667 | |
| Morgan Stanley, 0.000% (Variable Rate), 08/31/2036(h) | |
| 2,289,000 | | |
| 1,340,887 | |
| Morgan Stanley, 0.000% (Variable Rate), 09/30/2036(h) | |
| 40,000 | | |
| 24,558 | |
| Morgan Stanley, 0.000% (Variable Rate), 11/29/2036(h) | |
| 103,000 | | |
| 58,776 | |
| Morgan Stanley, 0.000% (Variable Rate), 01/31/2037(h) | |
| 224,000 | | |
| 127,605 | |
| Morgan Stanley, 0.000% (Variable Rate), 03/31/2037(h) | |
| 747,000 | | |
| 463,117 | |
| Morgan Stanley, 0.000% (Variable Rate), 04/28/2037(h) | |
| 40,000 | | |
| 24,112 | |
| Annual Report | October 31, 2023 |
19 |
| Saba Capital Income & Opportunities Fund |
Consolidated Schedule of Investments |
| |
October 31, 2023 |
| | |
Principal Amount | | |
Fair Value | |
| Morgan Stanley, 0.000% (Variable Rate), 05/31/2037(h) | |
$ | 25,000 | | |
$ | 15,121 | |
| Morgan Stanley, 0.000% (Variable Rate), 08/31/2037(h) | |
| 58,000 | | |
| 27,796 | |
| PRA Group, Inc., 8.3750%, 02/01/2028(a) | |
| 500,000 | | |
| 413,125 | |
| | |
| | | |
| 5,387,513 | |
| Leisure Facilities & Services - 0.23% | |
| | | |
| | |
| | |
| | | |
| | |
| Selina Hospitality PLC, 6.000%, 11/01/2026(a) | |
| 7,539,000 | | |
| 818,962 | |
| | |
| | | |
| | |
| Materials - 0.24% | |
| | | |
| | |
| | |
| | | |
| | |
| Cleveland-Cliffs Steel Corp., 7.000%, 03/15/2027 | |
| 880,000 | | |
| 859,100 | |
| | |
| | | |
| | |
| Real Estate - 1.12% | |
| | | |
| | |
| | |
| | | |
| | |
| China Evergrande Group, 8.250%, 03/23/2022(b)(e) | |
| 13,307,000 | | |
| 299,408 | |
| China Evergrande Group, 9.500%, 04/11/2022(b)(e) | |
| 2,253,000 | | |
| 50,693 | |
| China Evergrande Group, 11.500%, 01/22/2023(b)(e) | |
| 6,500,000 | | |
| 146,250 | |
| China Evergrande Group, 10.000%, 04/11/2023(b)(e) | |
| 7,018,000 | | |
| 157,905 | |
| China Evergrande Group, 7.500%, 06/28/2023(b)(e) | |
| 15,065,000 | | |
| 338,963 | |
| China Evergrande Group, 12.000%, 01/22/2024(b)(e) | |
| 1,800,000 | | |
| 40,500 | |
| China Evergrande Group, 9.500%, 03/29/2024(b)(e) | |
| 10,811,000 | | |
| 243,248 | |
| China Evergrande Group, 10.500%, 04/11/2024(b)(e) | |
| 17,000,000 | | |
| 382,500 | |
| China Evergrande Group, 8.750%, 06/28/2025(b)(e) | |
| 102,308,000 | | |
| 2,301,930 | |
| | |
| | | |
| 3,961,397 | |
| Technology - 0.38% | |
| | | |
| | |
| | |
| | | |
| | |
| RRD Parent Inc., 10.000%, 10/15/2031(a) | |
| 192,992 | | |
| 330,341 | |
| Commscope Tech LLC, 5.000%, 03/15/2027(a) | |
| 2,217,000 | | |
| 820,290 | |
| UNISYS Corp, 6.875%, 11/01/2027(a) | |
| 249,000 | | |
| 183,949 | |
| | |
| | | |
| 1,334,580 | |
| | |
| | | |
| | |
| TOTAL CORPORATE BONDS | |
| | | |
| 36,729,136 | |
| (Cost $64,019,725) | |
| | | |
| | |
| | |
Principal Amount | | |
Fair Value | |
| SENIOR LOANS - 9.98% | |
| | | |
| | |
| Commercial Services - 0.07% | |
| | | |
| | |
| | |
| | | |
| | |
| Travel Port Finance (Luxembourg) S.A R.L, TL, First Lien Term Loan, TSFR3M + 7.5%, 05/29/2026 | |
| 396,348 | | |
| 254,653 | |
| | |
| | | |
| 254,653 | |
| Communications - 0.65% | |
| | | |
| | |
| | |
| | | |
| | |
| Lumen Technologies Inc., Term A-1 Loan, TSFR1M + 2.115%, 01/31/2025 | |
| 2,462,121 | | |
| 2,302,083 | |
| | |
| | | |
| | |
| Consumer Discretionary - 8.82% | |
| | | |
| | |
| | |
| | | |
| | |
| NPC International, Inc., Second Lien Term Loan, 3M US L + 7.5%, 04/18/2025(i) | |
| 605,000 | | |
| - | |
| 24 Hour Fitness Worldwide, Inc., First Lien Term Loan, TSFR3M + 5.000%, 12/29/2025(b) | |
| 289,810 | | |
| 94,188 | |
| R.R. Donnelley & Sons Company, First Lien Term B Loan, TSR1M + 7.250%, 03/17/2028(a) | |
| 10,122,947 | | |
| 10,138,131 | |
| Chinos Intermediate 2 LLC, Term Loan, TSFR3M + 10% + 8%, 09/10/2027 | |
| 4,993,072 | | |
| 4,983,086 | |
| The GEO Group, Inc., Term Loan, TSFR1M + 7.125%, 3/23/2027 | |
| 9,819,405 | | |
| 10,021,930 | |
| Saba Capital Income & Opportunities Fund |
Consolidated Schedule of Investments |
| |
October 31, 2023 |
| | |
Principal Amount | | |
Fair Value | |
| Wok Holdings Inc., First Lien Term Loan, TSFR3M + 6.5%, 03/01/2026 | |
$ | 4,161,719 | | |
$ | 3,968,512 | |
| Peloton Interactive, First Lien Term Loan, TSFR1M + 7.100%, 05/25/2027 | |
| 1,979,950 | | |
| 1,991,503 | |
| | |
| | | |
| 31,197,350 | |
| Consumer Staples - 0.42% | |
| | | |
| | |
| | |
| | | |
| | |
| Moran Foods LLC, First Lien Term Loan, TSFR3M + 7.250%, 06/30/2026 | |
| 927,417 | | |
| 839,313 | |
| Moran Foods 1st Lien A&R 2023 FLFO PIK Term Loan, TSFR3M +7.250%, 06/30/2026(i) | |
| 464,334 | | |
| - | |
| Moran Foods 1st Lien A&R 2023 FLSO PIK Term Loan, TSFR3M + 7.250%, 12/31/2026 | |
| 851,923 | | |
| 617,644 | |
| | |
| | | |
| 1,456,957 | |
| Energy - 0.00%(d) | |
| | | |
| | |
| | |
| | | |
| | |
| GMP Borrower LLC, First Lien Term Loan, TSFR3M + 4.500%, 10/28/2027 | |
| 15,052 | | |
| 13,500 | |
| | |
| | | |
| | |
| Materials - 0.02% | |
| | | |
| | |
| | |
| | | |
| | |
| CPC Acquisition Corp., Second Lien Term Loan, TSFR3M + 7.750%, 12/29/2028 | |
| 175,000 | | |
| 86,042 | |
| | |
| | | |
| | |
| TOTAL SENIOR LOANS | |
| | | |
| 35,310,585 | |
| (Cost $36,568,232) | |
| | | |
| | |
| | |
Principal Amount | | |
Fair Value | |
| CONVERTIBLE CORPORATE BOND - 0.30% | |
| | | |
| | |
| Communications - 0.30% | |
| | | |
| | |
| | |
| | | |
| | |
| Delivery Hero SE, 1.000%, 04/30/2026(e) | |
| 300,000 | | |
| 264,588 | |
| Delivery Hero SE, 2.1250%, 03/10/2029(e) | |
| 1,100,000 | | |
| 789,620 | |
| | |
| | | |
| | |
| TOTAL CONVERTIBLE CORPORATE BOND | |
| | | |
| 1,054,208 | |
| (Cost $964,807) | |
| | | |
| | |
| | |
Principal Amount | | |
Fair Value | |
| SOVEREIGN DEBT OBLIGATIONS - 2.84% | |
| | | |
| | |
| Sovereign - 2.84% | |
| | | |
| | |
| | |
| | | |
| | |
| Ukraine Government International Bond, 7.750%, 09/01/2025(b)(e) | |
| 5,592,000 | | |
| 1,761,480 | |
| Ukraine Government International Bond, 7.750%, 09/01/2026(b)(e) | |
| 635,000 | | |
| 184,175 | |
| Ukraine Government International Bond, 7.750%, 09/01/2027(b)(e) | |
| 2,820,000 | | |
| 803,700 | |
| Ukraine Government International Bond, 6.750%, 06/20/2028(b)(e) | |
| 805,000 | | |
| 214,948 | |
| Ukraine Government International Bond, 7.750%, 09/01/2028(b)(e) | |
| 3,462,000 | | |
| 986,670 | |
| Ukraine Government International Bond, 7.750%, 09/01/2029(b)(e) | |
| 11,534,000 | | |
| 3,287,190 | |
| Ukraine Government International Bond, 9.750%, 11/01/2030(b)(e) | |
| 4,146,000 | | |
| 1,211,171 | |
| Ukraine Government International Bond, 6.876%, 05/21/2031(b)(e) | |
| 1,464,000 | | |
| 365,546 | |
| Ukraine Government International Bond, 7.375%, 09/25/2034(b)(e) | |
| 2,011,000 | | |
| 507,154 | |
| Ukraine Government International Bond, 7.253%, 03/15/2035(b)(e) | |
| 2,239,000 | | |
| 573,744 | |
| Ukraine Government International Bond, 0.000%, 08/01/2041(b)(e) | |
| 364,000 | | |
| 151,970 | |
| | |
| | | |
| | |
| TOTAL SOVEREIGN DEBT OBLIGATIONS | |
| | | |
| 10,047,748 | |
| (Cost $9,684,355) | |
| | | |
| | |
| | |
Principal Amount | | |
Fair Value | |
| MORTGAGE-BACKED SECURITIES - 1.11% | |
| | | |
| | |
| Federal National Mortgage Association (FNMA) - 1.11% | |
| | | |
| | |
| | |
| | | |
| | |
| FNMA, 3.000%, 06/25/2052 | |
| 6,146,911 | | |
| 939,146 | |
| FNMA, 3.000%, 07/25/2052 | |
| 7,438,787 | | |
| 946,394 | |
| Annual Report | October 31, 2023 |
21 |
| Saba Capital Income & Opportunities Fund |
Consolidated Schedule of Investments |
| |
October 31, 2023 |
| | |
Principal Amount | | |
Fair Value | |
| FNMA, 3.000%, 10/25/2052 | |
$ | 2,486,237 | | |
$ | 429,839 | |
| FNMA, 3.000%, 10/25/2052 | |
| 8,966,128 | | |
| 1,630,068 | |
| |
| | | |
| | |
| TOTAL MORTGAGE-BACKED SECURITIES | |
| | | |
| 3,945,447 | |
| (Cost $3,767,220) | |
| | | |
| | |
| | |
Shares | | |
Fair Value | |
| COMMON STOCK - 6.29% | |
| | | |
| | |
| Consumer Discretionary - 0.11% | |
| | | |
| | |
| | |
| | | |
| | |
| 24 Hour Fitness Worldwide(f) | |
| 306,005 | | |
| 2,448 | |
| Arbe Robotics, Ltd.(f) | |
| 68,769 | | |
| 132,724 | |
| e.GO Mobile SE | |
| 5,900 | | |
| 4,963 | |
| Everyware Global(i) | |
| 43,777 | | |
| - | |
| Polestar Automotive Holding UK PLC | |
| 116,698 | | |
| 234,563 | |
| | |
| | | |
| 374,698 | |
| Consumer Staples - 0.01% | |
| | | |
| | |
| | |
| | | |
| | |
| Benson Hill, Inc.(f) | |
| 136,711 | | |
| 21,053 | |
| Moran Foods LLC(i) | |
| 3,699,885 | | |
| - | |
| | |
| | | |
| 21,053 | |
| Energy - 0.06% | |
| | | |
| | |
| | |
| | | |
| | |
| Drilling Tools International Corp(f) | |
| 6,049 | | |
| 22,563 | |
| Granite Ridge Resources Inc | |
| 33,264 | | |
| 204,906 | |
| | |
| | | |
| 227,469 | |
| Financials - 2.53% | |
| | | |
| | |
| | |
| | | |
| | |
| Sculptor Capital Management, Inc. | |
| 708,589 | | |
| 8,963,651 | |
| | |
| | | |
| | |
| Health Care - 0.41% | |
| | | |
| | |
| | |
| | | |
| | |
| Compass Pathways PLC(f) | |
| 81,444 | | |
| 466,674 | |
| SomaLogic, Inc.(f) | |
| 437,676 | | |
| 976,017 | |
| | |
| | | |
| 1,442,691 | |
| Industrials - 0.84% | |
| | | |
| | |
| | |
| | | |
| | |
| Harvey Gulf Intl. Marine | |
| 24,044 | | |
| 781,430 | |
| The GEO Group, Inc.(f) | |
| 250,019 | | |
| 2,185,166 | |
| | |
| | | |
| 2,966,596 | |
| Materials - 0.86% | |
| | | |
| | |
| | |
| | | |
| | |
| Covia Holdings | |
| 169,353 | | |
| 2,257,985 | |
| Northgate Minerals Corp. | |
| 23,563 | | |
| 782,409 | |
| | |
| | | |
| 3,040,394 | |
| Real Estate - 0.54% | |
| | | |
| | |
| | |
| | | |
| | |
| Star Holdings(f) | |
| 165,561 | | |
| 1,895,673 | |
| | |
| | | |
| | |
| Technology - 0.70% | |
| | | |
| | |
| | |
| | | |
| | |
| Bitcoin Depot Inc.(f) | |
| 7,151 | | |
| 18,522 | |
| IQOR(f) | |
| 4,941 | | |
| 4,324 | |
| Pagseguro Digital, Ltd.(f) | |
| 351,350 | | |
| 2,480,531 | |
| | |
| | | |
| 2,503,377 | |
| Saba Capital Income & Opportunities Fund |
Consolidated Schedule of Investments |
| |
October 31, 2023 |
| | |
Shares | | |
Fair Value | |
| Utilities - 0.23% | |
| | | |
| | |
| | |
| | | |
| | |
| Longview Power LLC | |
| 61,813 | | |
$ | 819,022 | |
| | |
| | | |
| | |
| TOTAL COMMON STOCK | |
| | | |
| 22,254,624 | |
| (Cost $20,678,600) | |
| | | |
| | |
| | |
Shares | | |
Fair Value | |
| CLOSED END FUNDS - 22.72% | |
| | | |
| | |
| Alternative - 2.79% | |
| | | |
| | |
| | |
| | | |
| | |
| Blackrock ESG Capital Allocation Trust | |
| 410,267 | | |
| 5,866,818 | |
| Destra Multi-Alternative Fund(f) | |
| 56,768 | | |
| 345,717 | |
| VGI Partners Global Investments, Ltd. | |
| 3,653,052 | | |
| 3,661,348 | |
| | |
| | | |
| 9,873,883 | |
| Equity - 10.08% | |
| | | |
| | |
| | |
| | | |
| | |
| abrdn Emerging Markets Equity Income Fund, Inc. | |
| 1,818 | | |
| 8,036 | |
| Aberdeen Global Dynamic Dividend Fund | |
| 634 | | |
| 5,326 | |
| Aberdeen Japan Equity Fund, Inc. | |
| 46,838 | | |
| 237,469 | |
| abrdn Standard Global Infrastructure Income Fund | |
| 2,761 | | |
| 42,547 | |
| Adams Diversified Equity Fund, Inc. | |
| 42,645 | | |
| 689,996 | |
| BlackRock Health Services Term Trust | |
| 19,805 | | |
| 259,247 | |
| BlackRock Science & Technology Trust II | |
| 9,706 | | |
| 140,155 | |
| BlackRock Innovation & Growth Trust | |
| 330,506 | | |
| 2,088,798 | |
| ClearBridge MLP & Midstream Fund, Inc. | |
| 17,796 | | |
| 612,716 | |
| ClearBridge Energy Midstream Opportunity Fund, Inc. | |
| 68,686 | | |
| 2,137,508 | |
| ClearBridge Energy MLP Total Return Fund Inc. | |
| 69,138 | | |
| 2,130,142 | |
| GAMCO Natural Resources Gold & Income Trust | |
| 17,606 | | |
| 80,988 | |
| Japan Smaller Capitalization Fund, Inc. | |
| 7,794 | | |
| 53,545 | |
| Kayne Anderson NextGen Energy & Infrastructure, Inc. | |
| 103,652 | | |
| 711,053 | |
| Korea Fund, Inc. | |
| 26,272 | | |
| 487,871 | |
| Macquarie/First Trust Global Infrastructure/Utilities Dividend & Income Fund(f) | |
| 745 | | |
| 5,148 | |
| MainStay CBRE Global Infrastructure Megatrends Term Fund | |
| 63,285 | | |
| 698,666 | |
| Miller/Howard High Dividend Fund | |
| 333,513 | | |
| 3,198,390 | |
| Neuberger Berman MLP & Energy Income Fund, Inc. | |
| 264,242 | | |
| 1,693,791 | |
| Neuberger Berman Next Generation Connectivity Fund, Inc. | |
| 165,408 | | |
| 1,577,992 | |
| Platinum Capital, Ltd. | |
| 505,958 | | |
| 409,216 | |
| Nuveen Real Asset Income and Growth Fund | |
| 25 | | |
| 250 | |
| Principal Real Estate Income Fund | |
| 51,780 | | |
| 449,968 | |
| Taiwan Fund, Inc. | |
| 3,223 | | |
| 91,308 | |
| Tekla Healthcare Investors(f) | |
| 22,254 | | |
| 325,131 | |
| Tekla Life Sciences Investors(f) | |
| 37,835 | | |
| 438,508 | |
| Templeton Emerging Markets Fund | |
| 1,314 | | |
| 14,099 | |
| Tortoise Energy Infrastructure Fund, Inc. | |
| 14,818 | | |
| 409,421 | |
| Tortoise Midstream Energy Fund, Inc. | |
| 56,207 | | |
| 1,863,262 | |
| Tortoise Pipeline & Energy Fund, Inc. | |
| 7,795 | | |
| 216,623 | |
| Tortoise Energy Independence Fund, Inc. | |
| 17,997 | | |
| 557,367 | |
| Voya Emerging Markets High Dividend Equity Fund | |
| 55,378 | | |
| 252,524 | |
| Voya Infrastructure Industrials and Materials Fund | |
| 29,715 | | |
| 262,978 | |
| MFF Capital Investments, Ltd. | |
| 3,139,201 | | |
| 5,416,467 | |
| WCM Global Growth, Ltd. | |
| 392,373 | | |
| 272,547 | |
| Annual Report | October 31, 2023 |
23 |
| Saba Capital Income & Opportunities Fund |
Consolidated Schedule of Investments |
| |
October 31, 2023 |
| | |
Shares | | |
Fair Value | |
| WAM Global Ltd | |
| 3,577,961 | | |
$ | 4,130,808 | |
| Hearts and Minds Investments, Ltd. | |
| 836,372 | | |
| 1,135,380 | |
| Pengana International Equities, Ltd. | |
| 4,054,812 | | |
| 2,559,304 | |
| | |
| | | |
| 35,664,545 | |
| Fixed Income - 6.88% | |
| | | |
| | |
| | |
| | | |
| | |
| AllianceBernstein National Municipal Income Fund | |
| 396 | | |
| 3,592 | |
| BNY Mellon Municipal Income, Inc. | |
| 4,164 | | |
| 22,611 | |
| BlackRock Virginia Municipal Bond Trust | |
| 125 | | |
| 1,124 | |
| BlackRock California Municipal Income Trust | |
| 173,997 | | |
| 1,729,530 | |
| BlackRock Municipal Income Trust | |
| 927 | | |
| 8,065 | |
| BlackRock New York Municipal Income Trust | |
| 2,297 | | |
| 20,168 | |
| BlackRock Municipal Income Trust II | |
| 1,418 | | |
| 12,634 | |
| BlackRock MuniHoldings Fund, Inc. | |
| 2,264 | | |
| 22,912 | |
| BlackRock MuniVest Fund Inc | |
| 18 | | |
| 109 | |
| BlackRock MuniVest Fund II Inc | |
| 151 | | |
| 1,374 | |
| BlackRock MuniHoldings Quality Fund II | |
| 1,024 | | |
| 8,847 | |
| BlackRock MuniHoldings California Quality Fund, Inc. | |
| 19,672 | | |
| 181,769 | |
| BlackRock MuniYield Michigan Quality Fund, Inc. | |
| 3,742 | | |
| 35,811 | |
| BlackRock MuniHoldings New Jersey Quality Fund, Inc. | |
| 3,842 | | |
| 38,305 | |
| BlackRock MuniHoldings New York Quality Fund, Inc. | |
| 1,803 | | |
| 16,047 | |
| BlackRock MuniYield New York Quality Fund, Inc. | |
| 401 | | |
| 3,457 | |
| BlackRock MuniYield Pennsylvania Quality Fund, Inc. | |
| 4,708 | | |
| 47,174 | |
| Blackstone Long-Short Credit Income Fund | |
| 1,574 | | |
| 17,613 | |
| BNY Mellon High Yield Strategies Fund | |
| 3,977 | | |
| 8,312 | |
| BNY Mellon Strategic Municipal Bond Fund, Inc. | |
| 200 | | |
| 952 | |
| Brookfield Real Assets Income Fund Inc | |
| 2,629 | | |
| 32,048 | |
| DWS Municipal Income Trust | |
| 4,456 | | |
| 33,331 | |
| DWS Strategic Municipal Income Trust | |
| 228 | | |
| 1,662 | |
| Eaton Vance California Municipal Income Trust | |
| 14,728 | | |
| 130,932 | |
| Eaton Vance New York Municipal Bond Fund | |
| 54,699 | | |
| 429,934 | |
| Eaton Vance California Municipal Bond Fund | |
| 59,833 | | |
| 458,919 | |
| Ellsworth Growth and Income Fund, Ltd. | |
| 85,750 | | |
| 623,403 | |
| Federated Hermes Premier Municipal Income Fund | |
| 13,266 | | |
| 121,915 | |
| Flaherty & Crumrine Total Return Fund | |
| 5 | | |
| 65 | |
| Flaherty & Crumrine Preferred and Income Fund | |
| 271 | | |
| 2,390 | |
| Invesco Trust for Investment Grade New York Municipals | |
| 407 | | |
| 3,492 | |
| Invesco Municipal Opportunity Trust | |
| 20 | | |
| 161 | |
| Invesco California Value Municipal Income Trust | |
| 311 | | |
| 2,513 | |
| Invesco Pennsylvania Value Municipal Income Trust | |
| 3,256 | | |
| 28,164 | |
| MFS Investment Grade Municipal Trust | |
| 54,614 | | |
| 363,183 | |
| MFS High Income Municipal Trust | |
| 2,100 | | |
| 6,384 | |
| MFS High Yield Municipal Trust | |
| 94,067 | | |
| 269,032 | |
| Morgan Stanley Emerging Markets Domestic Debt Fund, Inc. | |
| 604,015 | | |
| 2,615,385 | |
| Neuberger Berman Municipal Fund Inc. | |
| 1,548 | | |
| 13,715 | |
| New America High Income Fund, Inc. | |
| 27,003 | | |
| 172,819 | |
| Nuveen Massachusetts Quality Municipal Income Fund | |
| 788 | | |
| 7,273 | |
| Nuveen Arizona Quality Municipal Income Fund | |
| 1 | | |
| 9 | |
| Nuveen AMT-Free Quality Municipal Income Fund | |
| 2,404 | | |
| 22,766 | |
| Nuveen New York Quality Municipal Income Fund | |
| 1,105 | | |
| 10,177 | |
| Nuveen California Quality Municipal Income Fund | |
| 39,251 | | |
| 368,174 | |
| Nuveen New Jersey Quality Municipal Income Fund | |
| 24,656 | | |
| 250,505 | |
| Nuveen Municipal Credit Income Fund | |
| 219 | | |
| 2,212 | |
| Nuveen Preferred & Income Securities Fund | |
| 2,598 | | |
| 15,458 | |
| Saba Capital Income & Opportunities Fund |
Consolidated Schedule of Investments |
| |
October 31, 2023 |
| | |
Shares | | |
Fair Value | |
| Nuveen Credit Strategies Income Fund | |
| 70,814 | | |
$ | 346,280 | |
| Nuveen Preferred and Income Fund | |
| 1 | | |
| 15 | |
| Nuveen Core Plus Impact Fund | |
| 196,587 | | |
| 1,769,283 | |
| Nuveen Variable Rate Preferred and Income Fund | |
| 20 | | |
| 298 | |
| Nuveen Pennsylvania Quality Municipal Income Fund | |
| 47,256 | | |
| 461,691 | |
| PIMCO Energy & Tactical Credit Opportunities Fund | |
| 254,162 | | |
| 4,829,078 | |
| Pioneer Municipal High Income Opportunities Fund, Inc. | |
| 22,790 | | |
| 213,998 | |
| Pioneer Municipal High Income Advantage Fund, Inc. | |
| 961 | | |
| 6,189 | |
| Pioneer Municipal High Income Fund, Inc. | |
| 108,304 | | |
| 757,045 | |
| Templeton Global Income Fund | |
| 826,356 | | |
| 3,272,370 | |
| Tortoise Power and Energy Infrastructure Fund, Inc. | |
| 42,068 | | |
| 562,449 | |
| Western Asset Managed Municipals Fund Inc. | |
| 3,022 | | |
| 26,503 | |
| Western Asset Intermediate Muni Fund Inc. | |
| 18,474 | | |
| 129,687 | |
| NB Global Corporate Income Trust | |
| 4,322,827 | | |
| 3,811,630 | |
| | |
| | | |
| 24,352,943 | |
| Mixed Allocation - 2.97% | |
| | | |
| | |
| | |
| | | |
| | |
| Blackrock Capital Allocation Trust | |
| 67,260 | | |
| 940,295 | |
| Ecofin Sustainable and Social Impact Term Fund | |
| 37,011 | | |
| 419,668 | |
| Guggenheim Active Allocation Fund | |
| 862 | | |
| 11,284 | |
| Nuveen Multi-Asset Income Fund | |
| 272,673 | | |
| 2,923,055 | |
| Tekla Healthcare Opportunities | |
| 207 | | |
| 3,242 | |
| Thornburg Income Builder Opportunities Trust | |
| 502 | | |
| 7,023 | |
| Pershing Square Holdings, Ltd. | |
| 175,609 | | |
| 6,216,558 | |
| Voya Global Advantage and Premium Opportunity Fund | |
| 444 | | |
| 3,515 | |
| | |
| | | |
| 10,524,640 | |
| | |
| | | |
| | |
| TOTAL CLOSED END FUNDS | |
| | | |
| 80,416,011 | |
| (Cost $83,734,579) | |
| | | |
| | |
| | |
Shares | | |
Fair Value | |
| INVESTMENT TRUST - 7.56% | |
| | |
| |
| Alternative - 1.88% | |
| | |
| |
| | |
| | |
| |
| Bitwise 10 Crypto Index Fund(g)(f) | |
| 374,794 | | |
| 6,652,594 | |
| | |
| | | |
| | |
| Equity - 5.48% | |
| | | |
| | |
| | |
| | | |
| | |
| European Opportunities Trust PLC | |
| 1,328,993 | | |
| 12,324,934 | |
| JPMorgan Mid Cap Investment Trust PLC | |
| 3,263 | | |
| 31,332 | |
| Herald Investment Trust PLC(f) | |
| 2,610 | | |
| 51,201 | |
| Schroder UK Mid Cap Fund PLC | |
| 570,790 | | |
| 3,441,085 | |
| BlackRock Smaller Companies Trust PLC | |
| 71,210 | | |
| 1,009,199 | |
| Henderson Opportunities Trust PLC | |
| 111,656 | | |
| 1,173,912 | |
| The European Smaller Companies Turst PLC | |
| 2,626 | | |
| 4,421 | |
| JPMorgan European Discovery Trust PLC | |
| 14,209 | | |
| 61,741 | |
| Schroder British Opportunities Trust PLC(f) | |
| 1,453,746 | | |
| 1,289,879 | |
| | |
| | | |
| 19,387,704 | |
| Mixed Allocation - 0.20% | |
| | | |
| | |
| | |
| | | |
| | |
| Aberdeen Diversified Income and Growth Trust PLC | |
| 7,080 | | |
| 6,695 | |
| abrdn Smaller Companies Income Trust | |
| 161,889 | | |
| 462,405 | |
| Annual Report | October 31, 2023 |
25 |
| Saba Capital Income & Opportunities Fund |
Consolidated Schedule of Investments |
| |
October 31, 2023 |
| | |
Shares | | |
Fair Value | |
| Citadel Income Fund | |
| 110,020 | | |
$ | 247,530 | |
| | |
| | | |
| 716,630 | |
| | |
| | | |
| | |
| TOTAL INVESTMENT TRUST | |
| | | |
| 26,756,928 | |
| (Cost $25,598,229) | |
| | | |
| | |
| | |
Shares | | |
Fair Value | |
| PREFERRED STOCK - 0.87% | |
| | | |
| | |
| Consumer Discretionary - 0.28% | |
| | | |
| | |
| | |
| | | |
| | |
| HAAT Delivery Ltd. Preferred Seed-1(c)(f) | |
| 64,188 | | |
| 988,495 | |
| | |
| | | |
| | |
| Entertainment Facilities - 0.00%(d) | |
| | | |
| | |
| | |
| | | |
| | |
| 24 Hour Fitness Worldwide, Inc.(f) | |
| 407,959 | | |
| 4,080 | |
| | |
| | | |
| | |
| Transportation - 0.59% | |
| | | |
| | |
| | |
| | | |
| | |
| G-ILS Transportation Ltd. Preferred B-3 Shares(c)(f) | |
| 1,332 | | |
| 2,079,252 | |
| | |
| | | |
| | |
| TOTAL PREFERRED STOCK | |
| | | |
| 3,071,827 | |
| (Cost $3,709,436) | |
| | | |
| | |
| | |
Fair Value | |
| PARTICIPATION AGREEMENT - 0.27% | |
| | |
| | |
| | |
| Caesars Entertainment, Inc (Covid Insurance Claim)(c)(f)(g) | |
| 959,660 | |
| | |
| | |
| TOTAL PARTICIPATION AGREEMENT | |
| 959,660 | |
| (Cost $2,320,000) | |
| | |
| | |
Fair Value | |
| PRIVATE FUND - 10.57% | |
| | |
| Stone Ridge Opportunities Fund Feeder LP(f) | |
| 37,398,584 | |
| | |
| | |
| TOTAL PRIVATE FUND | |
| 37,398,584 | |
| (Cost $29,527,000) | |
| | |
| | |
Shares | | |
Fair Value | |
| UNIT TRUST - 5.01% | |
| | | |
| | |
| | |
| | | |
| | |
| Grayscale Ethereum Classic Trust(g)(f) | |
| 1,235,170 | | |
| 10,029,580 | |
| Grayscale Ethereum Trust(g) | |
| 555,071 | | |
| 7,693,284 | |
| | |
| | | |
| | |
| TOTAL UNIT TRUST | |
| | | |
| 17,722,864 | |
| (Cost $11,096,339) | |
| | | |
| | |
| | |
Shares | | |
Fair Value | |
| SPECIAL PURPOSE ACQUISITION COMPANIES - 4.70% | |
| | | |
| | |
| | |
| | | |
| | |
| Alpha Partners Technology Merger Corp.(f) | |
| 19,691 | | |
| 209,315 | |
| Artemis Strategic Investment Corp.(f) | |
| 142,048 | | |
| 1,515,652 | |
| Artemis Strategic Investment Corp., Class B(b)(f)(i) | |
| 12,038 | | |
| - | |
| Beard Energy Transition Acquisition Corp.(f) | |
| 120,587 | | |
| 1,295,104 | |
| Bellevue Life Sciences Acquisition Corp.(f) | |
| 14,638 | | |
| 153,260 | |
| Blue Ocean Acquisition Corp.(f) | |
| 34,956 | | |
| 376,127 | |
| Blue World Acquisition Corp.(f) | |
| 51,687 | | |
| 559,770 | |
| CF Acquisition Corp. VII(f) | |
| 21,449 | | |
| 230,148 | |
| Chenghe Acquisition Co.(f) | |
| 392 | | |
| 4,265 | |
| Saba Capital Income & Opportunities Fund |
Consolidated Schedule of Investments |
| |
October 31, 2023 |
| | |
Shares | | |
Fair Value | |
| Clean Earth Acquisitions Corp. | |
| 99,174 | | |
$ | 1,053,229 | |
| Deezer SA(f) | |
| 8,179 | | |
| 21,116 | |
| Digital World Acquisition Corp., Class B(c)(f) | |
| 25,893 | | |
| 282,233 | |
| Distoken Acquisition Corp.(f) | |
| 5,419 | | |
| 57,279 | |
| DUET Acquisition Corp.(f) | |
| 5,996 | | |
| 64,517 | |
| Everest Consolidator Acquisition Corp.(f) | |
| 53,159 | | |
| 578,370 | |
| Fat Projects Acquisition Corp., Class B(c)(f) | |
| 4,886 | | |
| 5,033 | |
| Fortune Rise Acquisition Corp.(f) | |
| 29,156 | | |
| 320,716 | |
| Four Leaf Acquisition Corp(f) | |
| 3,750 | | |
| 41,531 | |
| FutureTech II Acquisition Corp.(f) | |
| 52,279 | | |
| 572,455 | |
| Goldenstone Acquisition, Ltd.(f) | |
| 5,405 | | |
| 57,996 | |
| Gores Holdings IX, Inc.(f) | |
| 121,520 | | |
| 1,267,454 | |
| Integrated Rail and Resources Acquisition Corp.(f) | |
| 153,090 | | |
| 1,674,805 | |
| Integrated Wellness Acquisition Corp.(f) | |
| 58,193 | | |
| 640,123 | |
| Investcorp Europe Acquisition Corp. I(f) | |
| 55,193 | | |
| 603,811 | |
| Israel Acquisitions Corp.(f) | |
| 8,683 | | |
| 92,040 | |
| Kismet Acquisition Two Corp.(f) | |
| 39,461 | | |
| 427,955 | |
| L Catterton Asia Acquisition Corp.(f) | |
| 1,609 | | |
| 17,184 | |
| Mars Acquisition Corp.(f) | |
| 10,247 | | |
| 108,003 | |
| Nabors Energy Transition Corp. | |
| 152,733 | | |
| 1,670,135 | |
| Nogin, Inc.(f) | |
| 11,264 | | |
| 3,379 | |
| Pegasus Digital Mobility Acquisition Corp., Class B(c)(f) | |
| 4,456 | | |
| 5,169 | |
| Pono Capital Three Inc(f) | |
| 11,690 | | |
| 123,797 | |
| Pono Capital Two, Inc.(f) | |
| 9,738 | | |
| 104,099 | |
| Pyrophyte Acquisition Corp.(f) | |
| 59,259 | | |
| 645,923 | |
| RCF Acquisition Corp.(f) | |
| 9,504 | | |
| 104,354 | |
| Rigel Resource Acquisition Corp.(f) | |
| 17,835 | | |
| 194,937 | |
| Screaming Eagle Acquisition Corp.(f) | |
| 35,534 | | |
| 373,107 | |
| Slam Corp.(f) | |
| 26,398 | | |
| 286,154 | |
| Spring Valley Acquisition Corp. II(f) | |
| 26,917 | | |
| 289,089 | |
| Valuence Merger Corp. I(f) | |
| 54,174 | | |
| 602,414 | |
| | |
| | | |
| | |
| TOTAL SPECIAL PURPOSE ACQUISITION COMPANIES | |
| | | |
| 16,632,048 | |
| (Cost $15,253,104) | |
| | | |
| | |
| | |
Contracts | | |
Fair Value | |
| WARRANTS - 0.14% | |
| | | |
| | |
| | |
| | | |
| | |
| 10X Capital Venture Acquisition Corp. III, Expires 12/31/2027, Strike Price $11.50 | |
| 55,754 | | |
| 4,739 | |
| A SPAC I Acquisition Corp., Expires 05/21/2027, Strike Price $11.50(i) | |
| 1 | | |
| - | |
| A SPAC II Acquisition Corp., Expires 05/03/2027, Strike Price $11.50 | |
| 34,421 | | |
| 504 | |
| Achari Ventures Holdings Corp. I, Expires 08/05/2026, Strike Price $11.50 | |
| 38,384 | | |
| 1,348 | |
| Agrinam Acquisition Corp., Expires 06/30/2027, Strike Price $11.50 | |
| 19,798 | | |
| 396 | |
| Allurion Technologies Inc, Expires 08/02/2030, Strike Price $11.50 | |
| 16,492 | | |
| 11,936 | |
| Alset Capital Acquisition Corp., Expires 02/02/2027, Strike Price $11.50 | |
| 13,297 | | |
| 336 | |
| ALSP Orchid Acquisition Corp. I, Expires 11/30/2028, Strike Price $11.50 | |
| 52,397 | | |
| 1,556 | |
| Andretti Acquisition Corp., Expires 03/23/2028, Strike Price $11.50 | |
| 24,523 | | |
| 6,230 | |
| AP Acquisition Corp., Expires 12/07/2026, Strike Price $11.50 | |
| 9,857 | | |
| 345 | |
| APx Acquisition Corp. I, Expires 08/19/2028, Strike Price $11.50 | |
| 3,981 | | |
| 139 | |
| Arisz Acquisition Corp., Expires 11/16/2026, Strike Price $11.50 | |
| 34,348 | | |
| 426 | |
| Armada Acquisition Corp. I, Expires 08/13/2026, Strike Price $11.50 | |
| 19 | | |
| 1 | |
| Artemis Strategic Investment Corp., Expires 02/12/2023, Strike Price $11.50 | |
| 52,405 | | |
| 84 | |
| Athena Technology Acquisition Corp. II, Expires 10/17/2028, Strike Price $11.50 | |
| 36,968 | | |
| 2,083 | |
| Annual Report | October 31, 2023 |
27 |
| Saba Capital Income & Opportunities Fund |
Consolidated Schedule of Investments |
| |
October 31, 2023 |
| | |
Contracts | | |
Fair Value | |
| Atlantic Coastal Acquisition Corp. II, Expires 06/02/2028, Strike Price $11.50 | |
| 80,774 | | |
$ | 5,654 | |
| Ault Disruptive Technologies Corp., Expires 06/20/2028, Strike Price $11.50 | |
| 18,483 | | |
| 298 | |
| Aura FAT Projects Acquisition Corp., Expires 06/02/2027, Strike Price $11.50 | |
| 58,439 | | |
| 1,292 | |
| Aurora Technology Acquisition Corp., Expires 02/07/2028, Strike Price $11.50 | |
| 63,578 | | |
| 874 | |
| Banyan Acquisition Corp., Expires 09/30/2028, Strike Price $11.50 | |
| 45,560 | | |
| 6,149 | |
| Battery Future Acquisition Corp., Expires 05/26/2028, Strike Price $11.50 | |
| 36,968 | | |
| 1,386 | |
| Beard Energy Transition Acquisition Corp., Expires 12/31/2027, Strike Price $11.50 | |
| 60,293 | | |
| 1,495 | |
| Bellevue Life, Sciences Acquisi, Expires 02/10/2028, Strike Price $11.50 | |
| 14,638 | | |
| 515 | |
| BenevolentAI, Expires 06/30/2026, Strike Price $11.50 | |
| 7,014 | | |
| 74 | |
| Benson Hill Inc., Expires 03/25/2027, Strike Price $11.50(c) | |
| 187,607 | | |
| 5,628 | |
| Bitcoin Depot Inc, Expires 07/03/2028, Strike Price $11.50 | |
| 116,268 | | |
| 18,021 | |
| Black Mountain Acquisition Corp., Expires 10/15/2027, Strike Price $11.50 | |
| 46,279 | | |
| 1,273 | |
| Bleuacacia, Ltd., Expires 10/30/2026, Strike Price $11.50 | |
| 100,804 | | |
| 1,593 | |
| Blockchain Coinvestors Acquisition Corp. I, Expires 11/01/2028, Strike Price $11.50 | |
| 93,986 | | |
| 2,848 | |
| Blue Ocean Acquisition Corp., Expires 10/21/2028, Strike Price $11.50 | |
| 16,257 | | |
| 447 | |
| Blue World Acquisition Corp., Expires 01/10/2029, Strike Price $11.50 | |
| 23,302 | | |
| 1,884 | |
| BurTech Acquisition Corp., Expires 12/18/2026, Strike Price $11.50 | |
| 23,368 | | |
| 584 | |
| BYTE Acquisition Corp., Expires 12/31/2028, Strike Price $11.50 | |
| 20,143 | | |
| 1,753 | |
| Cactus Acquisition Corp. 1, Ltd., Expires 07/20/2023, Strike Price $11.50 | |
| 21,180 | | |
| 668 | |
| Canna-Global Acquisition Corp., Expires 02/09/2028, Strike Price $11.50 | |
| 154,766 | | |
| 991 | |
| Capitalworks Emerging Markets Acquisition Corp., Expires 04/27/2028, Strike Price $11.50 | |
| 69,120 | | |
| 2,163 | |
| Cardio Diagnostics Holdings, Inc., Expires 12/01/2026, Strike Price $11.50 | |
| 19,933 | | |
| 847 | |
| Carmell Therapeutics Corp, Expires 07/12/2028, Strike Price $11.50 | |
| 3,816 | | |
| 615 | |
| CARTESIAN GROWTH Corp. II, Expires 07/12/2028, Strike Price $11.50 | |
| 5,984 | | |
| 898 | |
| Cartica Acquisition Corp., Expires 04/30/2028, Strike Price $11.50 | |
| 74,354 | | |
| 2,982 | |
| CF Acquisition Corp. IV, Expires 12/14/2025, Strike Price $11.50 | |
| 13,333 | | |
| 706 | |
| CF Acquisition Corp. VII, Expires 03/15/2026, Strike Price $11.50 | |
| 4,928 | | |
| 346 | |
| Chain Bridge I, Expires 12/31/2028, Strike Price $11.50 | |
| 33,367 | | |
| 716 | |
| Chenghe Acquisition Co., Expires 04/28/2027, Strike Price $11.50 | |
| 400 | | |
| 23 | |
| Churchill Capital Corp. VII, Expires 02/29/2028, Strike Price $11.50 | |
| 26,731 | | |
| 4,945 | |
| Cineworld, Expires 11/23/2025, Strike Price $0.04(i) | |
| 88,914 | | |
| - | |
| Clean Earth Acquisitions Corp., Expires 02/24/2028, Strike Price $11.50 | |
| 49,587 | | |
| 2,080 | |
| ClimateRock, Expires 06/01/2027, Strike Price $11.50 | |
| 11,778 | | |
| 295 | |
| Concord Acquisition Corp. II, Expires 12/31/2028, Strike Price $11.50 | |
| 25,741 | | |
| 3,219 | |
| Concord Acquisition Corp. III, Expires 12/31/2028, Strike Price $11.50 | |
| 54,452 | | |
| 5,783 | |
| Conduit Pharmaceuticals Inc, Expires 02/03/2027, Strike Price $11.50 | |
| 51,468 | | |
| 1,979 | |
| Consilium Acquisition Corp. I, Ltd., Expires 06/01/2027, Strike Price $11.50 | |
| 38,488 | | |
| 1,678 | |
| Corner Growth Acquisition Corp., Expires 12/31/2027, Strike Price $11.50 | |
| 41,045 | | |
| 2,996 | |
| Crescera Capital Acquisition Corp., Expires 04/20/2028, Strike Price $11.50 | |
| 63,791 | | |
| 287 | |
| Deezer, SA, Expires 06/07/2027, Strike Price $11.50 | |
| 95,238 | | |
| 5,543 | |
| Denali Capital Acquisition Corp., Expires 04/07/2027, Strike Price $11.50 | |
| 27,621 | | |
| 1,658 | |
| DHC Acquisition Corp., Expires 12/31/2027, Strike Price $11.50 | |
| 25,249 | | |
| 1,511 | |
| Digital Health Acquisition Corp., Expires 10/14/2023, Strike Price $11.50 | |
| 17,736 | | |
| 554 | |
| Distoken Acquisition Corp., Expires 03/30/2028, Strike Price $11.50 | |
| 5,841 | | |
| 148 | |
| DUET Acquisition Corp., Expires 07/19/2028, Strike Price $11.50 | |
| 5,996 | | |
| 156 | |
| EG Acquisition Corp., Expires 05/28/2028, Strike Price $11.50 | |
| 27,981 | | |
| 3,482 | |
| Energem Corp., Expires 03/10/2023, Strike Price $11.50 | |
| 45,714 | | |
| 1,600 | |
| Energy Transition Partners BV, Expires 07/16/2026, Strike Price $11.50 | |
| 16,852 | | |
| 2,140 | |
| ESGEN Acquisition Corp., Expires 06/28/2023, Strike Price $11.50 | |
| 61,117 | | |
| 5,195 | |
| Eureking SA, Expires 05/12/2027, Strike Price $11.50 | |
| 59,955 | | |
| 3,806 | |
| EVe Mobility Acquisition Corp., Expires 05/12/2028, Strike Price $11.50 | |
| 27,110 | | |
| 1,763 | |
| Everest Consolidator Acquisition Corp., Expires 07/19/2028, Strike Price $11.50 | |
| 50,492 | | |
| 10,856 | |
| Evergreen Corp., Expires 02/15/2027, Strike Price $11.50 | |
| 70,092 | | |
| 2,460 | |
| Saba Capital Income & Opportunities Fund |
Consolidated Schedule of Investments |
| |
October 31, 2023 |
| | |
Contracts | | |
Fair Value | |
| ExcelFin Acquisition Corp., Expires 07/05/2023, Strike Price $11.50 | |
| 22,349 | | |
$ | 1,076 | |
| Fat Projects Acquisition Corp., Expires 12/16/2022, Strike Price $11.50 | |
| 37,947 | | |
| 721 | |
| FG Acquisition Corp., Expires 04/05/2030, Strike Price $11.50 | |
| 25,263 | | |
| 31,578 | |
| FG Merger Corp, Expires 05/15/2028, Strike Price $11.50(i) | |
| 1,112 | | |
| - | |
| Financial Strategies Acquisition Corp., Expires 03/31/2028, Strike Price $11.50 | |
| 6,820 | | |
| 1 | |
| Financials Acquisition Corp., Expires 04/04/2027, Strike Price $11.50 | |
| 28,696 | | |
| 1,046 | |
| Finnovate Acquisition Corp., Expires 04/15/2023, Strike Price $11.50 | |
| 71,462 | | |
| 1,579 | |
| FinServ Acquisition Corp. II, Expires 02/17/2026, Strike Price $11.50 | |
| 22,794 | | |
| 884 | |
| Fintech Ecosystem Development Corp., Expires 12/31/2028, Strike Price $11.50 | |
| 27,352 | | |
| 957 | |
| Flame Acquisition Corp., Expires 12/31/2028, Strike Price $11.50 | |
| 5,451 | | |
| 3,816 | |
| Forbion European Acquisition Corp., Expires 05/23/2028, Strike Price $11.50 | |
| 7,393 | | |
| 6,207 | |
| Fortune Rise Acquisition Corp., Expires 11/26/2023, Strike Price $11.50 | |
| 15,616 | | |
| 670 | |
| FTAC Emerald Acquisition Corp., Expires 08/22/2028, Strike Price $11.50 | |
| 27,108 | | |
| 1,457 | |
| Fusion Acquisition Corp. II, Expires 12/31/2027, Strike Price $11.50 | |
| 20,782 | | |
| 2 | |
| Future Health ESG Corp., Expires 02/19/2023, Strike Price $11.50 | |
| 37,402 | | |
| 727 | |
| FutureTech II Acquisition Corp., Expires 02/16/2027, Strike Price $11.50 | |
| 48,383 | | |
| 1,708 | |
| Gardiner Healthcare Acquisitions Corp., Expires 07/30/2028, Strike Price $11.50 | |
| 14,786 | | |
| 383 | |
| Genesis Growth Tech Acquisition Corp., Expires 05/19/2028, Strike Price $11.50 | |
| 6,030 | | |
| 29 | |
| GigCapital5, Inc., Expires 12/31/2028, Strike Price $11.50 | |
| 3,954 | | |
| 138 | |
| Global Blockchain Acquisition Corp., Expires 05/10/2027, Strike Price $11.50 | |
| 40,470 | | |
| 1,012 | |
| Global Technology Acquisition Corp. I, Expires 07/13/2023, Strike Price $11.50 | |
| 23,734 | | |
| 952 | |
| Globalink Investment, Inc., Expires 12/03/2026, Strike Price $11.50 | |
| 14,771 | | |
| 234 | |
| Gores Holdings IX, Inc., Expires 01/14/2029, Strike Price $11.50 | |
| 40,512 | | |
| 4,256 | |
| HCM ACQUISITION Corp., Expires 12/31/2027, Strike Price $11.50 | |
| 10,493 | | |
| 184 | |
| Healthcare AI Acquisition Corp., Expires 12/14/2026, Strike Price $11.50 | |
| 18,681 | | |
| 781 | |
| HHG Capital Corp., Expires 12/31/2027, Strike Price $11.50 | |
| 17,425 | | |
| 985 | |
| HNR Acquisition Corp., Expires 07/29/2028, Strike Price $11.50 | |
| 44,874 | | |
| 3,141 | |
| Inception Growth Acquisition, Ltd., Expires 10/15/2026, Strike Price $11.50 | |
| 2,402 | | |
| 133 | |
| Industrial Tech Acquisitions II, Inc., Expires 12/31/2028, Strike Price $11.50 | |
| 47,509 | | |
| 1,366 | |
| InFinT Acquisition Corp., Expires 05/19/2027, Strike Price $11.50 | |
| 55,058 | | |
| 903 | |
| Innovative International Acquisition Corp., Expires 04/03/2023, Strike Price $11.50 | |
| 71,433 | | |
| 3,104 | |
| Integrated Rail and Resources Acquisition Corp., Expires 05/21/2023, Strike Price $11.50 | |
| 48,874 | | |
| 5,865 | |
| Integrated Wellness Acquisition Corp., Expires 10/31/2028, Strike Price $11.50 | |
| 1,475 | | |
| 186 | |
| Investcorp Europe Acquisition Corp. I, Expires 11/23/2028, Strike Price $11.50 | |
| 24,645 | | |
| 4,443 | |
| Investcorp India Acquisition Corp., Expires 06/28/2027, Strike Price $11.50 | |
| 37,472 | | |
| 2,625 | |
| Iris Acquisition Corp., Expires 03/05/2026, Strike Price $11.50 | |
| 27,683 | | |
| 692 | |
| Israel Acquisitions Corp., Expires 02/28/2028, Strike Price $11.50 | |
| 8,683 | | |
| 641 | |
| IX Acquisition Corp., Expires 11/24/2026, Strike Price $11.50 | |
| 112 | | |
| 4 | |
| Jaguar Global Growth Corp. I, Expires 02/11/2027, Strike Price $11.50 | |
| 43,794 | | |
| 3,066 | |
| Jaws Mustang Acquisition Corp., Expires 01/30/2026, Strike Price $11.50 | |
| 19,820 | | |
| 513 | |
| Jupiter Acquisition Corp., Expires 08/17/2028, Strike Price $11.50 | |
| 1,531 | | |
| 54 | |
| Kairous Acquisition Corp. ltd, Expires 09/15/2026, Strike Price $11.50 | |
| 6,746 | | |
| 94 | |
| Kernel Group Holdings, Inc., Expires 01/31/2027, Strike Price $11.50 | |
| 1,326 | | |
| 66 | |
| Keyarch Acquisition Corp., Expires 07/25/2028, Strike Price $11.50 | |
| 24,350 | | |
| 731 | |
| KnightSwan Acquisition Corp., Expires 07/21/2028, Strike Price $11.50 | |
| 4,497 | | |
| 204 | |
| LAMF Global Ventures Corp. I, Expires 04/04/2023, Strike Price $11.50 | |
| 63,179 | | |
| 3,952 | |
| LatAmGrowth SPAC, Expires 01/25/2028, Strike Price $11.50 | |
| 37,849 | | |
| 1,892 | |
| Liberty Resources Acquisition Corp., Expires 10/31/2028, Strike Price $11.50 | |
| 22,928 | | |
| 802 | |
| Lifezone Metals Ltd, Expires 07/05/2028, Strike Price $11.50 | |
| 52,557 | | |
| 37,250 | |
| LIV Capital Acquisition Corp. II, Expires 02/16/2027, Strike Price $11.50 | |
| 43,759 | | |
| 1,238 | |
| Metal Sky Star Acquisition Corp., Expires 04/01/2027, Strike Price $11.50 | |
| 40,420 | | |
| 384 | |
| Metals Acquisition Ltd, Expires 06/16/2028, Strike Price $11.50 | |
| 8,612 | | |
| 16,708 | |
| Annual Report | October 31, 2023 |
29 |
| Saba Capital Income & Opportunities Fund |
Consolidated Schedule of Investments |
| |
October 31, 2023 |
| | |
Contracts | | |
Fair Value | |
| Monterey Bio Acquisition Corp., Expires 06/07/2023, Strike Price $11.50 | |
| 24,230 | | |
$ | 727 | |
| Mountain & Co. I Acquisition Corp., Expires 08/24/2023, Strike Price $11.50 | |
| 62,660 | | |
| 4,167 | |
| Nabors Energy Transition Corp., Expires 11/17/2026, Strike Price $11.50 | |
| 87,846 | | |
| 13,836 | |
| New Energy One Acquisition Corp. PLC, Expires 03/07/2027, Strike Price $11.50 | |
| 222,976 | | |
| 60,979 | |
| New Providence Acquisition Corp. II, Expires 12/31/2027, Strike Price $11.50 | |
| 21,526 | | |
| 1,022 | |
| Newcourt Acquisition Corp., Expires 04/12/2028, Strike Price $11.50 | |
| 30,398 | | |
| 585 | |
| Nogin Inc., Expires 08/26/2027 Strike Price $11.50 | |
| 8,372 | | |
| 103 | |
| NorthView Acquisition Corp., Expires 08/02/2027, Strike Price $11.50 | |
| 19,197 | | |
| 447 | |
| Nova Vision Acquisition Corp., Expires 12/31/2028, Strike Price $11.50 | |
| 31,088 | | |
| 413 | |
| Nubia Brand International Corp., Expires 11/16/2026, Strike Price $11.50 | |
| 29,262 | | |
| 2,634 | |
| Nvni Group Ltd, Expires 11/01/2028, Strike Price $11.50 | |
| 15,665 | | |
| 1,293 | |
| OmniLit Acquisition Corp., Expires 11/08/2026, Strike Price $11.50 | |
| 31,515 | | |
| 2,047 | |
| Onyx Acquisition Co. I, Expires 01/07/2023, Strike Price $11.50 | |
| 24,790 | | |
| 645 | |
| Oxus Acquisition Corp., Expires 01/27/2023, Strike Price $11.50 | |
| 20,287 | | |
| 2,232 | |
| Papaya Growth Opportunity Corp. I, Expires 12/31/2028, Strike Price $11.50 | |
| 76,584 | | |
| 2,121 | |
| Patria Latin American Opportunity Acquisition Corp., Expires 03/10/2027, Strike Price $11.50 | |
| 46,145 | | |
| 1,684 | |
| Pearl Holdings Acquisition Corp., Expires 12/15/2026, Strike Price $11.50 | |
| 18,484 | | |
| 479 | |
| PepperLime Health Acquisition Corp., Expires 03/28/2023, Strike Price $11.50 | |
| 11,876 | | |
| 360 | |
| Phoenix Biotech Acquisition Corp., Expires 09/01/2026, Strike Price $11.50 | |
| 21,939 | | |
| 819 | |
| Platinum Capital, Ltd., Expires 03/28/2024, Strike Price $11.50 | |
| 42,880 | | |
| 245 | |
| Pono Capital Three Inc, Expires 04/03/2028, Strike Price $11.50 | |
| 11,690 | | |
| 512 | |
| Pono Capital Two, Inc., Expires 09/23/2027, Strike Price $11.50 | |
| 9,738 | | |
| 351 | |
| Power & Digital Infrastructure Acquisition II Corp., Expires 12/14/2028, Strike Price $11.50 | |
| 87,961 | | |
| 7,903 | |
| PowerUp Acquisition Corp., Expires 02/18/2027, Strike Price $11.50 | |
| 70,545 | | |
| 4,339 | |
| PROOF Acquisition Corp. I, Expires 12/03/2028, Strike Price $11.50 | |
| 20,757 | | |
| 1,274 | |
| Prospector Capital Corp., Expires 01/01/2025, Strike Price $11.50 | |
| 21,521 | | |
| 1,205 | |
| RCF Acquisition Corp., Expires 04/25/2023, Strike Price $11.50 | |
| 31,463 | | |
| 2,596 | |
| Redwoods Acquisition Corp., Expires 03/15/2027, Strike Price $11.50 | |
| 32,327 | | |
| 1,503 | |
| Relativity Acquisition Corp., Expires 02/11/2027, Strike Price $11.50 | |
| 45,142 | | |
| 4 | |
| Revelstone Capital Acquisition Corp., Expires 05/24/2028, Strike Price $11.50 | |
| 53 | | |
| 2 | |
| RF Acquisition Corp., Expires 05/01/2028, Strike Price $11.50 | |
| 19,704 | | |
| 398 | |
| Rigel Resource Acquisition Corp., Expires 04/19/2023, Strike Price $11.50 | |
| 31,854 | | |
| 4,315 | |
| Roadzen Inc, Expires 11/30/2028, Strike Price $11.50 | |
| 55,430 | | |
| 1,801 | |
| Rose Hill Acquisition Corp., Expires 03/03/2023, Strike Price $11.50 | |
| 41,528 | | |
| 737 | |
| Ross Acquisition Corp. II, Expires 02/12/2026, Strike Price $11.50 | |
| 28,225 | | |
| 1,376 | |
| Screaming Eagle Acquisition Corp., Expires 12/15/2027, Strike Price $11.50 | |
| 22,674 | | |
| 2,948 | |
| Selina Hospitality PLC, Expires 10/25/2027, Strike Price $11.50 | |
| 218,500 | | |
| 1,311 | |
| ShoulderUp Technology Acquisition Corp., Expires 07/26/2023, Strike Price $11.50 | |
| 94,845 | | |
| 3,173 | |
| SHUAA Partners Acquisition Corp. I, Expires 03/02/2027, Strike Price $11.50 | |
| 22,958 | | |
| 1,150 | |
| Sizzle Acquisition Corp., Expires 03/12/2026, Strike Price $11.50 | |
| 43,590 | | |
| 3,725 | |
| SMX Security Matters PLC, Expires 03/07/2028, Strike Price $11.50 | |
| 36,580 | | |
| 624 | |
| Southport Acquisition Corp., Expires 05/24/2028, Strike Price $11.50 | |
| 6,161 | | |
| 262 | |
| Spectaire Holdings Inc, Expires 12/31/2028, Strike Price $11.50 | |
| 58,258 | | |
| 2,831 | |
| Spree Acquisition Corp. 1, Ltd., Expires 12/22/2028, Strike Price $11.50 | |
| 20,337 | | |
| 518 | |
| Spring Valley Acquisition Corp. II, Expires 02/25/2026, Strike Price $11.50 | |
| 13,573 | | |
| 1,371 | |
| SpringBig Holdings, Inc., Expires 06/14/2027, Strike Price $11.50 | |
| 24,279 | | |
| 137 | |
| Swiftmerge Acquisition Corp., Expires 06/17/2028, Strike Price $11.50 | |
| 132 | | |
| 8 | |
| Target Global Acquisition I Corp., Expires 12/31/2027, Strike Price $11.50 | |
| 18,073 | | |
| 553 | |
| Technology & Telecommunication Acquisition Corp., Expires 02/15/2027, Strike Price $11.50 | |
| 52,993 | | |
| 2,014 | |
| TKB Critical Technologies 1, Expires 01/08/2023, Strike Price $11.50 | |
| 48,884 | | |
| 2,268 | |
| TLGY Acquisition Corp., Expires 01/14/2028, Strike Price $11.50 | |
| 68,311 | | |
| 2,131 | |
| Transition SA, Expires 06/16/2026, Strike Price $11.50 | |
| 33,822 | | |
| 5,010 | |
| United Homes Group, Inc., Expires 01/28/2028, Strike Price $11.50 | |
| 11,333 | | |
| 9,095 | |
| Saba Capital Income & Opportunities Fund |
Consolidated Schedule of Investments |
| |
October 31, 2023 |
| | |
Contracts | | |
Fair Value | |
| Valuence Merger Corp. I, Expires 03/01/2027, Strike Price $11.50 | |
| 60,778 | | |
$ | 1,045 | |
| VAM Investments Spac BV, Expires 07/27/2026, Strike Price $11.50 | |
| 12,639 | | |
| 1,939 | |
| Verde Clean Fuels, Inc., Expires 12/31/2027, Strike Price $11.50 | |
| 327 | | |
| 62 | |
| Vision Sensing Acquisition Corp., Expires 03/24/2023, Strike Price $11.50 | |
| 49,182 | | |
| 738 | |
| Western Acquisition Ventures Corp., Expires 01/12/2027, Strike Price $11.50 | |
| 29,980 | | |
| 1,574 | |
| Yotta Acquisition Corp., Expires 03/15/2027, Strike Price $11.50 | |
| 47,369 | | |
| 549 | |
| Zapp Electric Vehicles Group L, Expires 03/03/2028, Strike Price $11.50 | |
| 11,642 | | |
| 84 | |
| ZyVersa Therapeutics Inc, Expires 12/20/2026, Strike Price $11.50 | |
| 7,100 | | |
| 1 | |
| | |
| | | |
| | |
| TOTAL WARRANTS | |
| | | |
| 478,695 | |
| (Cost $2,111,816) | |
| | | |
| | |
| | |
Contracts | | |
Fair Value | |
| RIGHTS - 0.04% | |
| | | |
| | |
| | |
| | | |
| | |
| A SPAC I Acquisition Corp., Expires 4/17/2024(i) | |
| 2 | | |
| - | |
| A SPAC II Acquisition Corp., Expires 12/31/2049 | |
| 68,843 | | |
| 7,229 | |
| Accretion Acquisition Corp., Expires 12/31/2049 | |
| 37,215 | | |
| 2,978 | |
| Agrinam Acquisition Corp., Expires 12/31/2049 | |
| 19,798 | | |
| 990 | |
| AIB Acquisition Corp., Expires 12/31/2049 | |
| 41,417 | | |
| 3,342 | |
| Alset Capital Acquisition Corp., Expires 12/31/2049 | |
| 26,594 | | |
| 2,792 | |
| Arisz Acquisition Corp., Expires 05/01/2023 | |
| 34,348 | | |
| 3,126 | |
| Aurora Technology Acquisition Corp., Expires 02/07/2028 | |
| 63,578 | | |
| 7,629 | |
| Bellevue Life Sciences Acquisition Corp., Expires 5/14/2024 | |
| 14,638 | | |
| 2,349 | |
| bleuacacia, Ltd., Expires 12/31/2049 | |
| 201,609 | | |
| 8,568 | |
| Blue World Acquisition Corp., Expires 12/31/2049 | |
| 46,604 | | |
| 10,020 | |
| Broad Capital Acquisition Corp., Expires 10/25/2022 | |
| 53,360 | | |
| 8,284 | |
| Clean Earth Acquisitions Corp., Expires 12/31/2049 | |
| 99,120 | | |
| 10,898 | |
| ClimateRock, Expires 06/01/2027 | |
| 23,557 | | |
| 3,180 | |
| Consilium Acquisition Corp. I, Ltd., Expires 06/01/2027 | |
| 76,977 | | |
| 9,237 | |
| Deep Medicine Acquisition Corp., Expires 12/09/2022 | |
| 15,116 | | |
| 2,800 | |
| Distoken Acquisition Corp., Expires 11/18/2024 | |
| 5,841 | | |
| 1,017 | |
| Financial Strategies Acquisition Corp., Expires 03/31/2028 | |
| 9,493 | | |
| 2 | |
| Fintech Ecosystem Development Corp., Expires 12/31/2028 | |
| 54,704 | | |
| 6,395 | |
| Global Blockchain Acquisition Corp., Expires 12/31/2049 | |
| 40,470 | | |
| 8,094 | |
| Globalink Investment, Inc., Expires 08/19/2023 | |
| 4,837 | | |
| 508 | |
| Inception Growth Acquisition, Ltd., Expires 05/08/2023 | |
| 7,394 | | |
| 1,183 | |
| Jaguar Global Growth Corp. I, Expires 12/31/2049 | |
| 87,589 | | |
| 14,785 | |
| Kairous Acquisition Corp. ltd, Expires 11/24/2023 | |
| 13,555 | | |
| 1,571 | |
| Keyarch Acquisition Corp., Expires 07/25/2028 | |
| 16,489 | | |
| 1,468 | |
| Mars Acquisition Corp., Expires 2/16/2024 | |
| 10,247 | | |
| 2,356 | |
| Metal Sky Star Acquisition Corp., Expires 12/31/2049 | |
| 40,420 | | |
| 5,861 | |
| Mountain Crest Acquisition Corp. V, Expires 12/31/2049 | |
| 8,917 | | |
| 1,293 | |
| NorthView Acquisition Corp., Expires 12/31/2049 | |
| 38,482 | | |
| 5,099 | |
| Redwoods Acquisition Corp., Expires 12/31/2049 | |
| 32,327 | | |
| 3,598 | |
| RF Acquisition Corp., Expires 12/31/2049 | |
| 19,704 | | |
| 2,183 | |
| Sagaliam Acquisition Corp., Expires 12/31/2049 | |
| 84,310 | | |
| 10,547 | |
| Spring Valley Acquisition Corp. II, Expires 1/17/2024 | |
| 27,147 | | |
| 3,682 | |
| Welsbach Technology Metals Acquisition Corp., Expires 12/31/2049 | |
| 29,572 | | |
| 2,809 | |
| Yotta Acquisition Corp., Expires 12/31/2049 | |
| 29,452 | | |
| 2,359 | |
| | |
| | | |
| | |
| TOTAL RIGHTS | |
| | | |
| 158,232 | |
| (Cost $245,256) | |
| | | |
| | |
| Annual Report | October 31, 2023 |
31 |
| Saba Capital Income & Opportunities Fund |
Consolidated Schedule of Investments |
| |
October 31, 2023 |
| | |
Contracts | | |
Fair Value | |
| OPTIONS - 0.31% | |
| | | |
| | |
| Call Option Contracts - 0.01% | |
| | | |
| | |
| | |
| | | |
| | |
| The GEO Group, Inc., Expires 11/17/23, Strike Price $9.000 | |
| 1,041 | | |
$ | 39,038 | |
| | |
| | | |
| | |
| Put Option Contracts - 0.30% | |
| | | |
| | |
| | |
| | | |
| | |
| S&P 500 Index, Expires 01/19/24, Strike Price $4.040 | |
| 2 | | |
| 13,720 | |
| S&P 500 Index, Expires 01/19/24, Strike Price $4.085 | |
| 4 | | |
| 31,800 | |
| S&P 500 Index, Expires 01/19/24, Strike Price $4.090 | |
| 78 | | |
| 629,850 | |
| S&P 500 Index, Expires 01/19/24, Strike Price $4.110 | |
| 24 | | |
| 206,760 | |
| S&P 500 Index, Expires 01/19/24, Strike Price $4.120 | |
| 18 | | |
| 160,290 | |
| The GEO Group, Inc., Expires 01/19/24, Strike Price $6.000 | |
| 1,680 | | |
| 16,800 | |
| | |
| | | |
| 1,059,220 | |
| | |
| | | |
| | |
| TOTAL OPTIONS | |
| | | |
| 1,098,258 | |
| (Premiums paid $1,371,262) | |
| | | |
| | |
| | |
Shares | | |
Fair Value | |
| SHORT TERM INVESTMENTS - 0.64% | |
| | | |
| | |
| | |
| | | |
| | |
| BNY Mellon U.S. Treasury Fund, 7 Day Yield 4.94%(g) | |
| 351,528 | | |
| 351,528 | |
| JPMorgan US Treasury Plus Money Market Fund, 7 Day Yield 5.19% | |
| 1,897,639 | | |
| 1,897,639 | |
| | |
| | | |
| | |
| TOTAL SHORT TERM INVESTMENTS | |
| | | |
| 2,249,167 | |
| (Cost $2,249,167) | |
| | | |
| | |
| | |
| | | |
| | |
| Total Investments in securities - 83.73% | |
| | | |
| 296,284,022 | |
| (Cost $312,899,127) | |
| | | |
| | |
| Other Assets in Excess of Liabilities - 16.27% | |
| | | |
| 57,583,241 | |
| | |
| | | |
| | |
| NET ASSETS - 100.00% | |
| | | |
$ | 353,867,263 | |
Amounts above are shown as a percentage of net assets as of October
31, 2023.
SCHEDULE OF SECURITIES SOLD SHORT
| | |
Principal Amount | | |
Fair Value | |
| SOVEREIGN DEBT OBLIGATIONS - (47.61%) | |
| | | |
| | |
| Sovereign - (47.61%) | |
| | | |
| | |
| | |
| | | |
| | |
| U.S. Treasury Bond, 3.380%, 05/15/2033 | |
| (9,087,000 | ) | |
| (8,024,957 | ) |
| U.S. Treasury Bond, 3.880%, 08/15/2033 | |
| (47,979,000 | ) | |
| (44,103,199 | ) |
| U.S. Treasury Bond, 3.630%, 09/30/2028 | |
| (117,538,000 | ) | |
| (116,360,328 | ) |
| | |
| | | |
| | |
| TOTAL SOVEREIGN DEBT OBLIGATIONS | |
| | | |
| (168,488,484 | ) |
| (Proceeds $170,787,576) | |
| | | |
| | |
| | |
Shares | | |
Fair Value | |
| COMMON STOCK - (6.52%) | |
| | | |
| | |
| Communications - (0.54%) | |
| | | |
| | |
| | |
| | | |
| | |
| Airbnb Inc.(f) | |
| (567 | ) | |
| (67,070 | ) |
| Alphabet, Inc.(f) | |
| (256 | ) | |
| (31,764 | ) |
| Delivery Hero SE(a)(f) | |
| (5,530 | ) | |
| (139,495 | ) |
| DoorDash Inc.(f) | |
| (2,486 | ) | |
| (186,326 | ) |
| Meta Platforms, Inc.(f) | |
| (562 | ) | |
| (169,314 | ) |
| Saba Capital Income & Opportunities Fund |
Consolidated Schedule of Investments |
| |
October 31, 2023 |
| | |
Shares | | |
Fair Value | |
| NetEase Inc. | |
| (2,396 | ) | |
$ | (256,180 | ) |
| Netflix, Inc.(f) | |
| (85 | ) | |
| (34,994 | ) |
| Pinterest Inc.(f) | |
| (2,480 | ) | |
| (74,102 | ) |
| ROBLOX Corp. | |
| (5,900 | ) | |
| (187,679 | ) |
| Spotify Technology SA.(f) | |
| (1,488 | ) | |
| (245,163 | ) |
| Uber Technologies Inc.(f) | |
| (1,375 | ) | |
| (59,510 | ) |
| Upwork Inc.(f) | |
| (19,049 | ) | |
| (199,062 | ) |
| Zillow Group Inc.(f) | |
| (8,516 | ) | |
| (308,705 | ) |
| | |
| | | |
| (1,959,364 | ) |
| Consumer Discretionary - (0.68%) | |
| | | |
| | |
| | |
| | | |
| | |
| Alibaba Group Holding, Ltd.(f) | |
| (37 | ) | |
| (3,054 | ) |
| Amazon.com, Inc.(f) | |
| (618 | ) | |
| (82,250 | ) |
| Brembo SpA.(f) | |
| (5,840 | ) | |
| (62,720 | ) |
| Chegg Inc. | |
| (14,927 | ) | |
| (112,400 | ) |
| Cie Financiere Richemont SA | |
| (776 | ) | |
| (91,194 | ) |
| CTS Eventim AG & Co. KGaA | |
| (378 | ) | |
| (22,758 | ) |
| Ferrari N.V.(f) | |
| (1,087 | ) | |
| (327,883 | ) |
| JD.com Inc.(f) | |
| (3,742 | ) | |
| (95,122 | ) |
| MercadoLibre Inc.(f) | |
| (639 | ) | |
| (792,832 | ) |
| NIO Inc.(f) | |
| (18,935 | ) | |
| (138,226 | ) |
| Pinduoduo Inc. | |
| (3,852 | ) | |
| (390,670 | ) |
| Rivian Automotive, Inc.(f) | |
| (911 | ) | |
| (14,776 | ) |
| Sanlorenzo SpA/Ameglia | |
| (8 | ) | |
| (284 | ) |
| Tesla, Inc.(f) | |
| (428 | ) | |
| (85,960 | ) |
| Wayfair Inc.(f) | |
| (3,110 | ) | |
| (132,516 | ) |
| Zalando SE(a)(f) | |
| (2,334 | ) | |
| (54,307 | ) |
| | |
| | | |
| (2,406,952 | ) |
| Consumer Staples - (0.11%) | |
| | | |
| | |
| | |
| | | |
| | |
| Heineken Holding NV | |
| (2,528 | ) | |
| (192,056 | ) |
| Heineken NV | |
| (1,749 | ) | |
| (156,820 | ) |
| HelloFresh SE(f) | |
| (2,395 | ) | |
| (52,000 | ) |
| | |
| | | |
| (400,876 | ) |
| Electric-Generation - (0.00%)(d) | |
| | | |
| | |
| | |
| | | |
| | |
| Constellation Energy Corp. | |
| (15 | ) | |
| (1,694 | ) |
| | |
| | | |
| | |
| Electric-Integrated - (0.07%) | |
| | | |
| | |
| | |
| | | |
| | |
| AES Corp. | |
| (1,507 | ) | |
| (22,454 | ) |
| Ameren Corp. | |
| (169 | ) | |
| (12,795 | ) |
| American Electric Power Co., Inc. | |
| (298 | ) | |
| (22,511 | ) |
| DTE Energy Co. | |
| (649 | ) | |
| (62,551 | ) |
| Duke Energy Corp. | |
| (608 | ) | |
| (54,045 | ) |
| NextEra Energy, Inc. | |
| (918 | ) | |
| (53,519 | ) |
| Xcel Energy, Inc. | |
| (429 | ) | |
| (25,426 | ) |
| | |
| | | |
| (253,301 | ) |
| Electricity Networks - (0.03%) | |
| | | |
| | |
| | |
| | | |
| | |
| CenterPoint Energy, Inc. | |
| (1,383 | ) | |
| (37,175 | ) |
| Eversource Energy | |
| (194 | ) | |
| (10,435 | ) |
| PPL Corp. | |
| (2,068 | ) | |
| (50,811 | ) |
| | |
| | | |
| (98,421 | ) |
| Annual Report | October 31, 2023 |
33 |
| Saba Capital Income & Opportunities Fund |
Consolidated Schedule of Investments |
| |
October 31, 2023 |
| | |
Shares | | |
Fair Value | |
| Energy - (2.26%) | |
| | | |
| | |
| | |
| | | |
| | |
| Antero Midstream Corp. | |
| (22,615 | ) | |
$ | (279,069 | ) |
| Archrock, Inc. | |
| (2,988 | ) | |
| (37,858 | ) |
| Chesapeake Energy Corp. | |
| (817 | ) | |
| (70,327 | ) |
| Civitas Resources, Inc. | |
| (386 | ) | |
| (29,116 | ) |
| ConocoPhillips | |
| (489 | ) | |
| (58,093 | ) |
| Denbury, Inc.(f) | |
| (706 | ) | |
| (62,756 | ) |
| DT Midstream, Inc. | |
| (8,833 | ) | |
| (476,717 | ) |
| Enbridge, Inc. | |
| (9,217 | ) | |
| (295,369 | ) |
| Energy Transfer LP | |
| (67,115 | ) | |
| (882,562 | ) |
| EnLink Midstream LLC | |
| (15,453 | ) | |
| (189,917 | ) |
| Enterprise Products Partners LP | |
| (43,801 | ) | |
| (1,140,578 | ) |
| Enviva, Inc.(f) | |
| (1,138 | ) | |
| (4,120 | ) |
| EQT Corp. | |
| (1,158 | ) | |
| (49,076 | ) |
| Exxon Mobil Corp. | |
| (248 | ) | |
| (26,251 | ) |
| Genesis Energy LP | |
| (1,072 | ) | |
| (11,878 | ) |
| Kinder Morgan, Inc. | |
| (9,040 | ) | |
| (146,448 | ) |
| Marathon Oil Corp. | |
| (1,727 | ) | |
| (47,164 | ) |
| MPLX LP | |
| (17,554 | ) | |
| (632,646 | ) |
| Neste Oyj | |
| (2,333 | ) | |
| (78,278 | ) |
| Occidental Petroleum Corp. | |
| (508 | ) | |
| (31,399 | ) |
| Pembina Pipeline Corp. | |
| (3,934 | ) | |
| (121,077 | ) |
| Pioneer Natural Resources Co. | |
| (583 | ) | |
| (139,337 | ) |
| Plains All American Pipeline LP | |
| (23,149 | ) | |
| (350,707 | ) |
| Plains GP Holdings LP | |
| (34,856 | ) | |
| (546,542 | ) |
| TC Energy Corp. | |
| (14,786 | ) | |
| (509,233 | ) |
| Western Midstream Partners LP | |
| (8,228 | ) | |
| (220,757 | ) |
| Williams Cos., Inc. | |
| (45,217 | ) | |
| (1,555,465 | ) |
| | |
| | | |
| (7,992,740 | ) |
| Financials - (0.12%) | |
| | | |
| | |
| | |
| | | |
| | |
| BFF Bank SpA.(a) | |
| (12,822 | ) | |
| (123,120 | ) |
| Credicorp Ltd.(f) | |
| (961 | ) | |
| (120,087 | ) |
| Deutsche Boerse AG | |
| (1,083 | ) | |
| (177,675 | ) |
| Van Lanschot Kempen N.V. | |
| (8 | ) | |
| (215 | ) |
| | |
| | | |
| (421,097 | ) |
| Health Care - (0.97%) | |
| | | |
| | |
| | |
| | | |
| | |
| 10X Genomics Inc.(f) | |
| (3,367 | ) | |
| (118,788 | ) |
| Alnylam Pharmaceuticals, Inc.(f) | |
| (5,010 | ) | |
| (760,518 | ) |
| Bayer AG | |
| (2,132 | ) | |
| (91,961 | ) |
| Denali Therapeutics Inc.(f) | |
| (556 | ) | |
| (10,469 | ) |
| DexCom Inc. | |
| (908 | ) | |
| (80,658 | ) |
| Exact Sciences Corp.(f) | |
| (6,763 | ) | |
| (416,533 | ) |
| Genmab A/S | |
| (376 | ) | |
| (106,077 | ) |
| Illumina, Inc. | |
| (121 | ) | |
| (13,240 | ) |
| Merck & Co Inc. | |
| (2,789 | ) | |
| (286,430 | ) |
| Moderna, Inc.(f) | |
| (835 | ) | |
| (63,427 | ) |
| Novo Nordisk A/S | |
| (6,106 | ) | |
| (586,038 | ) |
| Novocure Ltd.(f) | |
| (8,253 | ) | |
| (109,765 | ) |
| PACIRA BIOSCIENCES INC. | |
| (4,237 | ) | |
| (119,738 | ) |
| Saba Capital Income & Opportunities Fund |
Consolidated Schedule of Investments |
| |
October 31, 2023 |
| | |
Shares | | |
Fair Value | |
| Progyny Inc.(f) | |
| (4,555 | ) | |
$ | (140,567 | ) |
| Recursion Pharmaceuticals Inc.(f) | |
| (16,329 | ) | |
| (86,217 | ) |
| Shockwave Medical Inc.(f) | |
| (591 | ) | |
| (121,900 | ) |
| STAAR Surgical Co. | |
| (7,346 | ) | |
| (307,210 | ) |
| | |
| | | |
| (3,419,536 | ) |
| Industrials - (0.30%) | |
| | | |
| | |
| | |
| | | |
| | |
| Aalberts Industries NV.(f) | |
| (5,551 | ) | |
| (172,799 | ) |
| Aerovironment Inc.(f) | |
| (312 | ) | |
| (35,774 | ) |
| Arcadis NV. | |
| (127 | ) | |
| (5,364 | ) |
| Axon Enterprise, Inc.(f) | |
| (1,884 | ) | |
| (385,259 | ) |
| Bravida Holding AB(a) | |
| (3,360 | ) | |
| (20,980 | ) |
| Deere & Co. | |
| (261 | ) | |
| (95,359 | ) |
| Generac Holdings, Inc. | |
| (109 | ) | |
| (9,164 | ) |
| Hexpol AB.(f) | |
| (4,048 | ) | |
| (35,793 | ) |
| Interpump Group SpA | |
| (1,239 | ) | |
| (51,653 | ) |
| Prysmian SpA(f) | |
| (1,992 | ) | |
| (74,382 | ) |
| TKH Group NV | |
| (1,725 | ) | |
| (62,934 | ) |
| Trelleborg AB | |
| (2,535 | ) | |
| (63,952 | ) |
| Watsco Inc. | |
| (110 | ) | |
| (38,378 | ) |
| | |
| | | |
| (1,051,791 | ) |
| Renewable Energy Generation - (0.02%) | |
| | | |
| | |
| | |
| | | |
| | |
| Atlantica Sustainable Infrastructure PLC | |
| (81 | ) | |
| (1,467 | ) |
| NextEra Energy Partners LP | |
| (1,951 | ) | |
| (52,814 | ) |
| | |
| | | |
| (54,281 | ) |
| Technology - (1.42%) | |
| | | |
| | |
| | |
| | | |
| | |
| Advanced Micro Devices, Inc.(f) | |
| (84 | ) | |
| (8,274 | ) |
| Adyen NV(a)(f) | |
| (75 | ) | |
| (50,305 | ) |
| Analog Devices Inc. | |
| (313 | ) | |
| (49,244 | ) |
| Appian Corp.(f) | |
| (264 | ) | |
| (10,417 | ) |
| Apple, Inc. | |
| (97 | ) | |
| (16,565 | ) |
| Arista Networks Inc.(f) | |
| (402 | ) | |
| (80,549 | ) |
| ASML Holding NV | |
| (970 | ) | |
| (580,200 | ) |
| BE Semiconductor Industries NV | |
| (1,112 | ) | |
| (114,484 | ) |
| Blackline Inc.(f) | |
| (815 | ) | |
| (40,017 | ) |
| CentralNic Group PLC.(f) | |
| (9 | ) | |
| (14 | ) |
| Cloudflare, Inc.(f) | |
| (4,206 | ) | |
| (238,438 | ) |
| CoStar Group Inc.(f) | |
| (2,236 | ) | |
| (164,145 | ) |
| Crowdstrike Holdings Inc.(f) | |
| (473 | ) | |
| (83,612 | ) |
| Datadog Inc.(f) | |
| (1,033 | ) | |
| (84,159 | ) |
| Descartes Systems Group, Inc. | |
| (313 | ) | |
| (22,623 | ) |
| Doximity Inc.(f) | |
| (4,288 | ) | |
| (87,604 | ) |
| Duolingo Inc.(f) | |
| (1,314 | ) | |
| (191,910 | ) |
| Fabrinet.(f) | |
| (51 | ) | |
| (7,905 | ) |
| HashiCorp Inc. | |
| (5,297 | ) | |
| (104,298 | ) |
| HubSpot, Inc. | |
| (16 | ) | |
| (6,780 | ) |
| Infineon Technologies AG | |
| (3,491 | ) | |
| (101,617 | ) |
| Infosys Ltd. | |
| (8,959 | ) | |
| (147,107 | ) |
| KLA CORP. | |
| (151 | ) | |
| (70,925 | ) |
| MarketAxess Holdings, Inc. | |
| (1,305 | ) | |
| (278,944 | ) |
| Annual Report | October 31, 2023 |
35 |
| Saba Capital Income & Opportunities Fund |
Consolidated Schedule of Investments |
| |
October 31, 2023 |
| | |
Shares | | |
Fair Value | |
| MasterCard Inc. | |
| (152 | ) | |
$ | (57,205 | ) |
| Melexis NV | |
| (2,272 | ) | |
| (166,718 | ) |
| Microsoft Corp. | |
| (55 | ) | |
| (18,596 | ) |
| MongoDB Inc.(f) | |
| (83 | ) | |
| (28,601 | ) |
| Monolithic Power Systems Inc. | |
| (120 | ) | |
| (53,009 | ) |
| NVIDIA Corp. | |
| (244 | ) | |
| (99,503 | ) |
| ON Semiconductor Corp. | |
| (464 | ) | |
| (29,065 | ) |
| Palo Alto Networks, Inc. | |
| (43 | ) | |
| (10,450 | ) |
| Pegasystems Inc. | |
| (933 | ) | |
| (39,876 | ) |
| QUALCOMM Inc. | |
| (468 | ) | |
| (51,007 | ) |
| Relx Plc | |
| (9,362 | ) | |
| (326,004 | ) |
| Salesforce Inc.(f) | |
| (239 | ) | |
| (47,998 | ) |
| ServiceNow, Inc.(f) | |
| (9 | ) | |
| (5,237 | ) |
| Shopify Inc.(f) | |
| (5,268 | ) | |
| (248,534 | ) |
| Snowflake Inc. | |
| (1,913 | ) | |
| (277,634 | ) |
| SPS Commerce Inc.(f) | |
| (318 | ) | |
| (50,988 | ) |
| Super Micro Computer, Inc.(f) | |
| (1,124 | ) | |
| (269,164 | ) |
| Taiwan Semiconductor Manufacturing Co., Ltd. | |
| (4,546 | ) | |
| (392,365 | ) |
| Varonis Systems Inc. | |
| (1,416 | ) | |
| (47,634 | ) |
| Visa Inc. | |
| (236 | ) | |
| (55,484 | ) |
| Workday, Inc.(f) | |
| (985 | ) | |
| (208,534 | ) |
| | |
| | | |
| (5,023,742 | ) |
| | |
| | | |
| | |
| TOTAL COMMON STOCK | |
| | | |
| (23,083,795 | ) |
| (Proceeds $25,556,879) | |
| | | |
| | |
| | |
Shares | | |
Fair Value | |
| EXCHANGE TRADED FUNDS - (4.54%) | |
| | | |
| | |
| | |
| | | |
| | |
| ProShares Bitcoin Strategy ETF(f) | |
| (913,348 | ) | |
| (16,065,791 | ) |
| | |
| | | |
| | |
| TOTAL EXCHANGE TRADED FUNDS | |
| | | |
| (16,065,791 | ) |
| (Proceeds $15,997,985) | |
| | | |
| | |
| | |
Shares | | |
Fair Value | |
| PREFERRED STOCK - (0.01%) | |
| | | |
| | |
| Materials - (0.01%) | |
| | | |
| | |
| | |
| | | |
| | |
| Fuchs Petrolub SE(f) | |
| (1,103 | ) | |
| (44,723 | ) |
| | |
| | | |
| | |
| TOTAL PREFERRED STOCK | |
| | | |
| (44,723 | ) |
| (Proceeds $46,964) | |
| | | |
| | |
| | |
| | | |
| | |
| Total Securities Sold Short - (58.69%) | |
| | | |
| (207,682,793 | ) |
| (Proceeds $212,389,404) | |
| | | |
| | |
| (a) | Security exempt from registration under Rule 144A of the Securities Act
of 1933 (the "Securities Act"). Total market value of Rule 144A securities amounts to $21,458,173, which represented approximately
6.06% of net assets as of October 31, 2023. Such securities may normally be sold to qualified institutional buyers in transactions exempt
from registration. |
| (b) | Security is in default as of year-end and is therefore non-income producing. |
| (c) | Level 3 assets valued using significant unobservable inputs as a result
of unavailable quoted prices from an active market or the unavailability of other significant observable inputs. |
| (d) | Amount represents less than 0.005% of net assets. |
| Saba Capital Income & Opportunities Fund |
Consolidated Schedule of Investments |
| |
October 31, 2023 |
| (e) | Securities were originally issued pursuant to Regulation S under the
Securities Act of 1933, which exempts securities offered and sold outside of the United States from registration. Such securities cannot
be sold in the United States without either an effective registration statement filed pursuant to the Securities Act of 1933, or pursuant
to an exemption from registration. As of October 31, 2023, the aggregate market value of those securities was $15,063,353, which represents
approximately 4.27% of net assets. |
| (f) | Non-income producing security. |
| (g) | A portion or all of the security is owned by BRW SPV I, a wholly-owned
subsidiary of the Fund. |
| (h) | The security is a floating rate note which has an annual interest rate,
reset monthly, that is calculated by taking the product of a leverage multiplier and (USISDA30 - USISDA02). At October 31, 2023, the current
coupon rate for these notes is 0%. |
| (i) | On October 31, 2023 the value of these investments amounted to $0, representing
0.0% of the net assets of the Fund. |
Investment Abbreviations:
ESTRON - Euro Short-Term Rate
LIBOR - London Interbank Offered Rate
OBFR - United States Overnight Bank Funding Rate
RBACOR - RBA Interbank Overnight Cash Rate
SOFR - Secured Overnight Financing Rate
SONIA - Sterling Over Night Index Average
Reference Rates:
ESTRON - Euro Short-Term Rate as of October 31, 2023 was 3.88%
OBFR - United States Overnight Bank Funding Rate as of October 31, 2023
was 5.32%
RBACOR - RBA Interbank Overnight Cash Rate as of October 31, 2023 was 4.07%
SOFR - Secured Overnight Financing Rate as of October 31, 2023 was 5.35%
TSFR1M - CME Term SOFR 1 Month as of October 31, 2023 was 5.32%.
TSFR3M - CME Term SOFR 3 Month as of October 31, 2023 was 5.38%
SONIA - Sterling Overnight Index Average as of October 31, 2023 was
5.19%
PRIME - US Prime Rate as of October 31, 2023 was 8.5%
Counterparty Abbreviations:
JPM - JPMorgan Chase Bank, N.A.
GSI - Goldman Sachs International
MSCS - Morgan Stanley Capital Services
BARC - Barclays Bank PLC
MSCO – Morgan Stanley & Company
SIMPLE AGREEMENT FOR FUTURE EQUITY (SAFE) CONTRACTS
| | |
Cost | | |
Fair Value | |
| AEYE Health Inc.(a)(b) | |
$ | 1,000,000 | | |
$ | 1,062,333 | |
| Quantalx Neuroscience Ltd.(a)(b) | |
| 3,000,000 | | |
| 3,046,419 | |
| Real View Imaging Ltd.(a)(b) | |
| 2,000,000 | | |
| 2,320,563 | |
| | |
$ | 6,000,000 | | |
$ | 6,429,315 | |
| (a) | Level 3 assets valued using significant unobservable inputs as a result
of unavailable quoted prices from an active market or the unavailability of other significant observable inputs. |
| (b) | Non-income producing security. |
FORWARD FOREIGN CURRENCY CONTRACTS
| Counterparty | |
Settlement Date | |
Fund Receiving | |
Value | | |
Fund Delivering | |
Cost | | |
Unrealized Appreciation | |
| JPM | |
11/6/2023 | |
USD | |
$ | 364,306 | | |
CAD | |
$ | 360,573 | | |
$ | 3,733 | |
| JPM | |
11/6/2023 | |
USD | |
| 23,455,050 | | |
GBP | |
| 23,397,916 | | |
| 57,134 | |
| | |
| |
| |
| | | |
| |
| | | |
$ | 60,867 | |
| Annual Report | October 31, 2023 |
37 |
| Saba Capital Income & Opportunities Fund |
Consolidated Schedule of Investments |
| |
October 31, 2023 |
FORWARD FOREIGN CURRENCY CONTRACTS
| Counterparty | |
Settlement Date | |
Fund Receiving | |
Value | | |
Fund Delivering | |
Cost | | |
Unrealized Depreciation | |
| JPM | |
11/6/2023 | |
AUD | |
$ | 634,438 | | |
USD | |
$ | 634,991 | | |
$ | (553 | ) |
| JPM | |
11/6/2023 | |
EUR | |
| 3,968,500 | | |
USD | |
| 3,973,635 | | |
| (5,135 | ) |
| JPM | |
11/6/2023 | |
GBP | |
| 11,668,571 | | |
USD | |
| 11,690,766 | | |
| (22,195 | ) |
| JPM | |
11/6/2023 | |
USD | |
| 24,128,711 | | |
AUD | |
| 24,140,381 | | |
| (11,670 | ) |
| JPM | |
11/6/2023 | |
USD | |
| 7,686,213 | | |
EUR | |
| 7,725,347 | | |
| (39,134 | ) |
| | |
| |
| |
| | | |
| |
| | | |
$ | (78,687 | ) |
| | |
| |
| |
| | | |
| |
| | | |
$ | (17,820 | ) |
FUTURES CONTRACTS
| Description | |
Number of Contracts | |
Maturity Date | |
Notional Amount | | |
Unrealized Appreciation/ (Depreciation) | |
| Long Position Contracts | |
| |
| |
| | | |
| | |
| CBOE VIX FUTURE Nov23 | |
212 | |
11/30/2023 | |
$ | 3,651,181 | | |
$ | 191,700 | |
| CBOE VIX FUTURE Dec23 | |
191 | |
12/31/2023 | |
| 3,501,121 | | |
| 51,593 | |
| CBOE VIX FUTURE Jan24 | |
12 | |
1/17/2024 | |
| 254,345 | | |
| (17,954 | ) |
| | |
| |
| |
| | | |
$ | 225,339 | |
| Short Position Contracts | |
| |
| |
| | | |
| | |
| NASDAQ 100 E-MINI Dec23 | |
(40) | |
12/31/2023 | |
| 12,396,051 | | |
| 803,851 | |
| | |
| |
| |
| | | |
$ | 803,851 | |
| | |
| |
| |
| | | |
$ | 1,029,190 | |
TO-BE-ANNOUNCED (TBA) MORTGAGE-BACKED SECURITIES (MBS) FORWARD CONTRACTS
| Counterparty | |
Description | |
Maturity Date | |
Notional Amount | | |
Net Unrealized Depreciation | |
| MSCO | |
FNCL 5.5 11/23 | |
11/5/2023 | |
| 264,602,000 | | |
$ | (2,397,950 | ) |
| MSCO | |
FNCL 6 11/23 | |
11/6/2023 | |
| 105,628,000 | | |
| (232,694 | ) |
| | |
| |
| |
| | | |
$ | (2,630,644 | ) |
SINGLE NAME CREDIT DEFAULT SWAP CONTRACTS (CENTRALLY CLEARED)
| Buy/Sell Protection(a) | |
Reference Obligations | |
Annual Payment Rate Received (Paid) | |
Currency | |
Maturity Date | |
Notional Amount(b) | | |
Value | | |
Upfront Premiums Received/(Paid) | | |
Unrealized Appreciation/ (Depreciation) | |
| Buy | |
R.R. Donnelley & Sons Company | |
(5.00)% | |
USD | |
12/20/2026 | |
| 7,494,000 | | |
$ | (281,377 | ) | |
$ | 591,764 | | |
$ | 310,387 | |
| Buy | |
R.R. Donnelley & Sons Company | |
(5.00)% | |
USD | |
6/20/2028 | |
| 2,434,000 | | |
| (73,784 | ) | |
| 153,219 | | |
| 79,435 | |
| Buy | |
Transocean Inc. | |
(1.00)% | |
USD | |
6/20/2027 | |
| 1,632,000 | | |
| 194,805 | | |
| (135,500 | ) | |
| 59,305 | |
| | |
| |
| |
| |
| |
| | | |
$ | (160,356 | ) | |
$ | 609,483 | | |
$ | 449,127 | |
| Saba Capital Income & Opportunities Fund |
Consolidated Schedule of Investments |
| |
October 31, 2023 |
INDEX CREDIT DEFAULT SWAP CONTRACTS (CENTRALLY CLEARED)
| Buy/Sell Protection(a) | |
Reference Obligations | |
Annual Payment Rate Received (Paid) |
Currency | |
Maturity Date | |
Notional Amount(b) | | |
Value | | |
Upfront Premiums Received/(Paid) | | |
Unrealized Appreciation/ (Depreciation) | |
| Buy | |
Markit CDX High Yield Index, Series 41 | |
(5.00)% |
USD | |
12/20/2028 | |
| 276,983,000 | | |
$ | 229,527 | | |
$ | (2,331,921 | ) | |
$ | (2,102,394 | ) |
| Buy | |
Markit iTraxx Europe Subordinated Financials Index, Series 39 | |
(5.00)% |
USD | |
6/20/2028 | |
| 45,000,000 | | |
| 1,252,800 | | |
| (2,626,045 | ) | |
| (1,373,245 | ) |
| | |
| |
| |
| |
| |
| | | |
$ | 1,482,327 | | |
$ | (4,957,966 | ) | |
$ | (3,475,639 | ) |
SINGLE NAME CREDIT DEFAULT SWAP CONTRACTS (OVER THE COUNTER)
| Buy/Sell Protection(a) | |
Counterparty | |
Reference Obligations | |
Annual Payment Rate Received (Paid) | |
Currency | |
Maturity Date | |
Notional Amount(b) | | |
Value | | |
Upfront Premiums Received/(Paid) | | |
Unrealized Appreciation/ (Depreciation) | |
| Sell | |
GSI | |
AT&T Inc. | |
1.00% | |
USD | |
6/20/2024 | |
| 15,847,000 | | |
$ | 64,178 | | |
$ | (61,802 | ) | |
$ | 2,376 | |
| Sell | |
BARC | |
AT&T Inc. | |
1.00% | |
USD | |
6/20/2025 | |
| 2,249,000 | | |
| 12,311 | | |
| (11,224 | ) | |
| 1,087 | |
| Sell | |
GSI | |
Bristol-Myers Squibb Company | |
1.00% | |
USD | |
12/20/2027 | |
| 10,000,000 | | |
| 263,274 | | |
| (268,823 | ) | |
| (5,549 | ) |
| Sell | |
MSCS | |
Bristol-Myers Squibb Company | |
1.00% | |
USD | |
12/20/2027 | |
| 10,000,000 | | |
| 263,274 | | |
| (257,109 | ) | |
| 6,165 | |
| Sell | |
MSCS | |
Bristol-Myers Squibb Company | |
1.00% | |
USD | |
6/20/2028 | |
| 17,365,000 | | |
| 468,980 | | |
| (510,546 | ) | |
| (41,566 | ) |
| Sell | |
GSI | |
British American Tobacco p.l.c. | |
1.00% | |
GBP | |
12/20/2027 | |
| 2,381,000 | | |
| 29,940 | | |
| (10,976 | ) | |
| 18,964 | |
| Buy | |
GSI | |
CommScope, Inc. | |
(5.00)% | |
USD | |
12/20/2028 | |
| 1,650,000 | | |
| 908,570 | | |
| (523,215 | ) | |
| 385,355 | |
| Sell | |
GSI | |
Danone | |
1.00% | |
EUR | |
12/20/2027 | |
| 5,739,000 | | |
| 151,644 | | |
| (107,323 | ) | |
| 44,321 | |
| Sell | |
MSCS | |
Danone | |
1.00% | |
EUR | |
12/20/2027 | |
| 1,264,000 | | |
| 33,399 | | |
| (28,008 | ) | |
| 5,391 | |
| Sell | |
JPM | |
Danone | |
1.00% | |
EUR | |
12/20/2027 | |
| 6,169,000 | | |
| 163,006 | | |
| (142,740 | ) | |
| 20,266 | |
| Sell | |
GSI | |
International Business Machines Corporation | |
1.00% | |
USD | |
12/20/2027 | |
| 20,642,000 | | |
| 460,451 | | |
| (395,100 | ) | |
| 65,351 | |
| Sell | |
GSI | |
International Business Machines Corporation | |
1.00% | |
USD | |
6/20/2027 | |
| 1,000 | | |
| 21 | | |
| (19 | ) | |
| 2 | |
| Sell | |
BARC | |
International Business Machines Corporation | |
1.00% | |
USD | |
12/20/2027 | |
| 10,000,000 | | |
| 223,065 | | |
| (202,764 | ) | |
| 20,301 | |
| Sell | |
BARC | |
International Business Machines Corporation | |
1.00% | |
USD | |
12/20/2028 | |
| 3,675,000 | | |
| 82,654 | | |
| (81,859 | ) | |
| 795 | |
| Sell | |
BARC | |
NextEra Energy Capital Holdings, Inc. | |
1.00% | |
USD | |
6/20/2028 | |
| 4,306,000 | | |
| 23,100 | | |
| (22,659 | ) | |
| 441 | |
| Sell | |
GSI | |
Pfizer Inc. | |
1.00% | |
USD | |
12/20/2027 | |
| 9,152,000 | | |
| 246,286 | | |
| (220,125 | ) | |
| 26,161 | |
| Sell | |
MSCS | |
Pfizer Inc. | |
1.00% | |
USD | |
12/20/2027 | |
| 7,325,000 | | |
| 197,799 | | |
| (178,314 | ) | |
| 19,485 | |
| Sell | |
GSI | |
Pfizer, Inc. | |
1.00% | |
USD | |
12/20/2028 | |
| 16,839,000 | | |
| 483,626 | | |
| (466,895 | ) | |
| 16,731 | |
| Buy | |
BARC | |
R.R. Donnelley & Sons Company | |
(5.00)% | |
USD | |
12/20/2027 | |
| 1,628,000 | | |
| (55,215 | ) | |
| 222,929 | | |
| 167,714 | |
| Sell | |
GSI | |
Target Corporation | |
1.00% | |
USD | |
12/20/2027 | |
| 10,000,000 | | |
| 220,586 | | |
| (194,677 | ) | |
| 25,909 | |
| Sell | |
MSCS | |
Target Corporation | |
1.00% | |
USD | |
12/20/2027 | |
| 6,078,000 | | |
| 134,072 | | |
| (127,883 | ) | |
| 6,189 | |
| Sell | |
JPM | |
Target Corporation | |
1.00% | |
USD | |
12/20/2027 | |
| 1,110,000 | | |
| 24,485 | | |
| (21,123 | ) | |
| 3,362 | |
| Sell | |
GSI | |
The Home Depot, Inc. | |
1.00% | |
USD | |
12/20/2027 | |
| 5,887,000 | | |
| 167,004 | | |
| (154,684 | ) | |
| 12,320 | |
| Sell | |
MSCS | |
The Home Depot, Inc. | |
1.00% | |
USD | |
12/20/2028 | |
| 645,000 | | |
| 19,905 | | |
| (20,994 | ) | |
| (1,089 | ) |
| Sell | |
GSI | |
The Procter & Gamble Company | |
1.00% | |
USD | |
12/20/2027 | |
| 21,532,000 | | |
| 603,380 | | |
| (545,195 | ) | |
| 58,185 | |
| Sell | |
MSCS | |
The Sherwin-Williams Company | |
1.00% | |
USD | |
12/20/2027 | |
| 2,039,000 | | |
| 32,204 | | |
| (4,375 | ) | |
| 27,829 | |
| Sell | |
MSCS | |
The Southern Company | |
1.00% | |
USD | |
6/20/2026 | |
| 847,000 | | |
| 13,574 | | |
| (14,141 | ) | |
| (567 | ) |
| Buy | |
GSI | |
Transocean Inc. | |
(1.00)% | |
USD | |
6/20/2027 | |
| 1,487,000 | | |
| 177,496 | | |
| (122,678 | ) | |
| 54,818 | |
| Buy | |
BARC | |
Transocean Inc. | |
(1.00)% | |
USD | |
6/20/2027 | |
| 453,000 | | |
| 54,071 | | |
| (47,565 | ) | |
| 6,506 | |
| Buy | |
BARC | |
Unisys Corporation | |
(5.00)% | |
USD | |
6/20/2028 | |
| 286,000 | | |
| 35,491 | | |
| (38,292 | ) | |
| (2,801 | ) |
| Sell | |
MSCS | |
UnitedHealth Group Incorporated | |
1.00% | |
USD | |
12/20/2027 | |
| 16,084,000 | | |
| 403,556 | | |
| (353,749 | ) | |
| 49,807 | |
| Sell | |
MSCS | |
Verizon Communications Inc. | |
1.00% | |
USD | |
6/20/2028 | |
| 3,181,000 | | |
| 2,389 | | |
| (2,900 | ) | |
| (511 | ) |
| Sell | |
MSCS | |
Verizon Communications Inc. | |
1.00% | |
USD | |
12/20/2027 | |
| 7,000,000 | | |
| 22,307 | | |
| 4,885 | | |
| 27,192 | |
| | |
| |
| |
| | |
| |
| |
| | | |
$ | 5,930,883 | | |
$ | (4,909,943 | ) | |
$ | 1,020,940 | |
| Annual Report | October 31, 2023 |
39 |
| Saba Capital Income & Opportunities Fund |
Consolidated Schedule of Investments |
| |
October 31, 2023 |
| (a) | If the Fund is a seller of protection and a credit event occurs, as defined under the terms of that particular swap agreement,
the Fund will either (i) pay to the buyer of protection an amount equal to the notional amount of the swap and take delivery of the referenced
obligation or underlying securities comprising the referenced index or (ii) pay a net settlement amount in the form of cash or securities
equal to the notional amount of the swap less the recovery value of the referenced obligation or underlying securities comprising the
referenced index. |
| (b) | The maximum potential amount the Fund could be required to pay as a seller of credit protection or receive as a buyer of credit
protection if a credit event occurs as defined under the terms of that particular swap agreement. Notional amounts are presented in the
currency indicated in the table. |
TOTAL RETURN SWAP CONTRACTS(a)
| Counterparty | |
Reference Obligations | |
Currency | |
Notional Amount(b) | | |
Termination Date | |
Financing Rate Index | |
Financing Rate Spread Paid/(Received) by Fund | |
Value | | |
Unrealized Appreciation/ (Depreciation) | |
| JPM | |
4imprint Group PLC | |
GBP | |
| (406,477 | ) | |
10/31/2024 | |
SONIA | |
(40) bps | |
$ | (416,432 | ) | |
$ | (9,955 | ) |
| JPM | |
Aberdeen Diversified Income and Growth Trust | |
GBP | |
| 87,794 | | |
10/31/2024 | |
SONIA | |
40 bps | |
| 90,588 | | |
| 2,794 | |
| JPM | |
Aberdeen New India Investment Trust PLC | |
GBP | |
| 587,356 | | |
10/31/2024 | |
SONIA | |
40 bps | |
| 591,521 | | |
| 4,165 | |
| JPM | |
Aberforth Smaller Companies Trust PLC | |
GBP | |
| 2,158,769 | | |
10/31/2024 | |
SONIA | |
40 bps | |
| 2,177,805 | | |
| 19,036 | |
| JPM | |
Abrdn UK Smaller Cos Growth Trust PLC | |
GBP | |
| 1,837,198 | | |
10/31/2024 | |
SONIA | |
40 bps | |
| 1,869,472 | | |
| 32,274 | |
| JPM | |
Alpha Financial Markets Consulting PLC | |
GBP | |
| (4,759 | ) | |
10/31/2024 | |
SONIA | |
(40) bps | |
| (5,168 | ) | |
| (409 | ) |
| JPM | |
Alten SA | |
EUR | |
| (35,015 | ) | |
10/31/2024 | |
ESTRON | |
(40) bps | |
| (35,919 | ) | |
| (904 | ) |
| JPM | |
Auction Technology Group PLC | |
GBP | |
| (2,478 | ) | |
10/31/2024 | |
SONIA | |
(40) bps | |
| (2,482 | ) | |
| (4 | ) |
| JPM | |
Baillie Gifford European Growth Trust PLC | |
GBP | |
| 374,897 | | |
10/31/2024 | |
SONIA | |
40 bps | |
| 380,862 | | |
| 5,965 | |
| JPM | |
Baillie Gifford UK Growth Trust PLC | |
GBP | |
| 3,542,556 | | |
10/31/2024 | |
SONIA | |
40 bps | |
| 3,584,967 | | |
| 42,411 | |
| JPM | |
Baillie Gifford US Growth Trust PLC | |
GBP | |
| 6,261,190 | | |
10/31/2024 | |
SONIA | |
40 bps | |
| 6,325,644 | | |
| 64,454 | |
| JPM | |
Baker Steel Resources Trust, Ltd. | |
GBP | |
| 144,639 | | |
10/31/2024 | |
SONIA | |
40 bps | |
| 144,639 | | |
| - | |
| JPM | |
Balfour Beatty PLC | |
GBP | |
| (57,873 | ) | |
10/31/2024 | |
SONIA | |
(40) bps | |
| (59,808 | ) | |
| (1,935 | ) |
| JPM | |
Barings Emerging EMEA Opportunities PLC | |
GBP | |
| 198,270 | | |
10/31/2024 | |
SONIA | |
40 bps | |
| 199,638 | | |
| 1,368 | |
| JPM | |
Bellway PLC | |
GBP | |
| (4,140 | ) | |
10/31/2024 | |
SONIA | |
(40) bps | |
| (4,213 | ) | |
| (73 | ) |
| JPM | |
Big Technologies PLC | |
GBP | |
| (1,379 | ) | |
10/31/2024 | |
SONIA | |
(40) bps | |
| (1,306 | ) | |
| 73 | |
| JPM | |
BioMerieux | |
EUR | |
| (156,511 | ) | |
10/31/2024 | |
ESTRON | |
(40) bps | |
| (160,012 | ) | |
| (3,501 | ) |
| JPM | |
BlackRock Smaller Companies Trust PLC | |
GBP | |
| 2,299,099 | | |
10/31/2024 | |
SONIA | |
40 bps | |
| 2,327,040 | | |
| 27,941 | |
| JPM | |
Bloomsbury Publishing PLC | |
GBP | |
| (28 | ) | |
10/31/2024 | |
SONIA | |
(40) bps | |
| (29 | ) | |
| (1 | ) |
| JPM | |
Brown Advisory US Smaller Companies PLC | |
GBP | |
| 154,685 | | |
10/31/2024 | |
SONIA | |
40 bps | |
| 154,685 | | |
| - | |
| JPM | |
Bytes Technology Group PLC | |
GBP | |
| (67,071 | ) | |
10/31/2024 | |
SONIA | |
(40) bps | |
| (68,236 | ) | |
| (1,165 | ) |
| JPM | |
Card Factory PLC | |
GBP | |
| (608 | ) | |
10/31/2024 | |
SONIA | |
(40) bps | |
| (633 | ) | |
| (25 | ) |
| JPM | |
Central Asia Metals PLC | |
GBP | |
| (2,314 | ) | |
10/31/2024 | |
SONIA | |
(40) bps | |
| (2,278 | ) | |
| 36 | |
| JPM | |
Chemring Group PLC | |
GBP | |
| (179,962 | ) | |
10/31/2024 | |
SONIA | |
(40) bps | |
| (180,608 | ) | |
| (646 | ) |
| JPM | |
Clarkson PLC | |
GBP | |
| (20,187 | ) | |
10/31/2024 | |
SONIA | |
(40) bps | |
| (20,736 | ) | |
| (549 | ) |
| JPM | |
Computacenter PLC | |
GBP | |
| (68,618 | ) | |
10/31/2024 | |
SONIA | |
(40) bps | |
| (70,205 | ) | |
| (1,587 | ) |
| JPM | |
Conduit Holdings, Ltd. | |
GBP | |
| (12,448 | ) | |
10/31/2024 | |
SONIA | |
(40) bps | |
| (12,606 | ) | |
| (158 | ) |
| JPM | |
CQS Natural Resources Growth and Income PLC | |
GBP | |
| 361,924 | | |
10/31/2024 | |
SONIA | |
40 bps | |
| 366,325 | | |
| 4,401 | |
| JPM | |
Crest Nicholson Holdings PLC | |
GBP | |
| (37,498 | ) | |
10/31/2024 | |
SONIA | |
(40) bps | |
| (37,451 | ) | |
| 47 | |
| JPM | |
CVS Group PLC | |
GBP | |
| (39,755 | ) | |
10/31/2024 | |
SONIA | |
(40) bps | |
| (41,044 | ) | |
| (1,289 | ) |
| JPM | |
Dassault Systemes SE | |
EUR | |
| (186,678 | ) | |
10/31/2024 | |
ESTRON | |
(40) bps | |
| (191,387 | ) | |
| (4,709 | ) |
| JPM | |
Diploma PLC | |
GBP | |
| (323,206 | ) | |
10/31/2024 | |
SONIA | |
(40) bps | |
| (326,191 | ) | |
| (2,985 | ) |
| JPM | |
DiscoverIE Group PLC | |
GBP | |
| (3,768 | ) | |
10/31/2024 | |
SONIA | |
(40) bps | |
| (3,862 | ) | |
| (94 | ) |
| JPM | |
Dunelm Group PLC | |
GBP | |
| (227,619 | ) | |
10/31/2024 | |
SONIA | |
(40) bps | |
| (227,969 | ) | |
| (350 | ) |
| Saba Capital Income & Opportunities Fund |
Consolidated Schedule of Investments |
| |
October 31, 2023 |
TOTAL RETURN SWAP CONTRACTS(a)
| Counterparty | |
Reference Obligations | |
Currency | |
Notional Amount(b) | | |
Termination Date | |
Financing Rate Index | |
Financing Rate Spread Paid/(Received) by Fund | |
Value | | |
Unrealized Appreciation/ (Depreciation) | |
| JPM | |
Edenred | |
EUR | |
| (146,582 | ) | |
10/31/2024 | |
ESTRON | |
(40) bps | |
$ | (147,729 | ) | |
$ | (1,147 | ) |
| JPM | |
Edinburgh Worldwide Investment Trust PLC | |
GBP | |
| 12,601,785 | | |
10/31/2024 | |
SONIA | |
40 bps | |
| 12,848,879 | | |
| 247,094 | |
| JPM | |
Elis SA | |
EUR | |
| (59,981 | ) | |
10/31/2024 | |
ESTRON | |
(40) bps | |
| (60,254 | ) | |
| (273 | ) |
| JPM | |
Ergomed PLC | |
GBP | |
| (43,111 | ) | |
10/31/2024 | |
SONIA | |
(40) bps | |
| (43,111 | ) | |
| - | |
| JPM | |
Esker SA | |
EUR | |
| (3,857 | ) | |
10/31/2024 | |
ESTRON | |
(40) bps | |
| (3,800 | ) | |
| 57 | |
| JPM | |
European Smaller Companies | |
GBP | |
| 3,978,186 | | |
10/31/2024 | |
SONIA | |
40 bps | |
| 4,051,314 | | |
| 73,128 | |
| JPM | |
Experian PLC | |
GBP | |
| (82,384 | ) | |
10/31/2024 | |
SONIA | |
(40) bps | |
| (85,865 | ) | |
| (3,481 | ) |
| JPM | |
Fidelity Emerging Markets, Ltd. | |
GBP | |
| 8,151,587 | | |
10/31/2024 | |
SONIA | |
40 bps | |
| 8,162,970 | | |
| 11,383 | |
| JPM | |
Future PLC | |
GBP | |
| (50,750 | ) | |
10/31/2024 | |
SONIA | |
(40) bps | |
| (53,280 | ) | |
| (2,530 | ) |
| JPM | |
Games Workshop Group PLC | |
GBP | |
| (111,921 | ) | |
10/31/2024 | |
SONIA | |
(40) bps | |
| (111,864 | ) | |
| 57 | |
| JPM | |
Gamma Communications PLC | |
GBP | |
| (2,909 | ) | |
10/31/2024 | |
SONIA | |
(40) bps | |
| (3,000 | ) | |
| (91 | ) |
| JPM | |
Genus PLC | |
GBP | |
| (179,796 | ) | |
10/31/2024 | |
SONIA | |
(40) bps | |
| (182,528 | ) | |
| (2,732 | ) |
| JPM | |
Grafton Group PLC | |
GBP | |
| (106,849 | ) | |
10/31/2024 | |
SONIA | |
(75) bps | |
| (108,026 | ) | |
| (1,177 | ) |
| JPM | |
Grifols SA | |
EUR | |
| (128,406 | ) | |
10/31/2024 | |
ESTRON | |
(40) bps | |
| (134,042 | ) | |
| (5,636 | ) |
| JPM | |
Henderson EuroTrust PLC | |
GBP | |
| 1,116,603 | | |
10/31/2024 | |
SONIA | |
40 bps | |
| 1,134,541 | | |
| 17,938 | |
| JPM | |
Henderson Opportunities Trust PLC | |
GBP | |
| 172,912 | | |
10/31/2024 | |
SONIA | |
40 bps | |
| 174,527 | | |
| 1,615 | |
| JPM | |
Henderson Smaller Companies Inv Trust PLC | |
GBP | |
| 210,136 | | |
10/31/2024 | |
SONIA | |
40 bps | |
| 216,817 | | |
| 6,681 | |
| JPM | |
Herald Investment Trust PLC | |
GBP | |
| 3,899,467 | | |
10/31/2024 | |
SONIA | |
40 bps | |
| 3,943,446 | | |
| 43,979 | |
| JPM | |
Hollywood Bowl Group PLC | |
GBP | |
| (243 | ) | |
10/31/2024 | |
SONIA | |
(40) bps | |
| (243 | ) | |
| - | |
| JPM | |
Hunting PLC | |
GBP | |
| (12,972 | ) | |
10/31/2024 | |
SONIA | |
(40) bps | |
| (13,223 | ) | |
| (251 | ) |
| JPM | |
IMI PLC | |
GBP | |
| (94,968 | ) | |
10/31/2024 | |
SONIA | |
(40) bps | |
| (96,083 | ) | |
| (1,115 | ) |
| JPM | |
Impax Asset Management Group PLC | |
GBP | |
| (3,239 | ) | |
10/31/2024 | |
SONIA | |
(40) bps | |
| (3,299 | ) | |
| (60 | ) |
| JPM | |
Inchcape PLC | |
GBP | |
| (88,955 | ) | |
10/31/2024 | |
SONIA | |
(40) bps | |
| (88,955 | ) | |
| - | |
| JPM | |
Intermediate Capital Group PLC | |
GBP | |
| (184,798 | ) | |
10/31/2024 | |
SONIA | |
(40) bps | |
| (185,795 | ) | |
| (997 | ) |
| JPM | |
Invesco Select Trust PLC | |
GBP | |
| 26,892 | | |
10/31/2024 | |
SONIA | |
40 bps | |
| 26,937 | | |
| 45 | |
| JPM | |
IPSOS | |
EUR | |
| (49,152 | ) | |
10/31/2024 | |
ESTRON | |
(40) bps | |
| (49,980 | ) | |
| (828 | ) |
| JPM | |
JPMorgan European Discovery Trust PLC | |
GBP | |
| 29,167,580 | | |
10/31/2024 | |
SONIA | |
40 bps | |
| 29,414,415 | | |
| 246,835 | |
| JPM | |
JPMorgan Mid Cap Investment Trust PLC | |
GBP | |
| 2,197,838 | | |
10/31/2024 | |
SONIA | |
40 bps | |
| 2,223,165 | | |
| 25,327 | |
| JPM | |
JPMorgan UK Smaller Companies Inv Trust PLC | |
GBP | |
| 221,530 | | |
10/31/2024 | |
SONIA | |
40 bps | |
| 227,309 | | |
| 5,779 | |
| JPM | |
Kainos Group PLC | |
GBP | |
| (15,176 | ) | |
10/31/2024 | |
SONIA | |
(40) bps | |
| (15,437 | ) | |
| (261 | ) |
| JPM | |
Kering SA | |
EUR | |
| (148,922 | ) | |
10/31/2024 | |
ESTRON | |
(40) bps | |
| (148,805 | ) | |
| 117 | |
| JPM | |
Keystone Positive Change Investment Trust PLC | |
GBP | |
| 2,226,471 | | |
10/31/2024 | |
SONIA | |
40 bps | |
| 2,250,738 | | |
| 24,267 | |
| JPM | |
Magellan Global Fund/Close Class | |
AUD | |
| 356,217 | | |
10/31/2024 | |
RBACOR | |
45 bps | |
| 356,217 | | |
| - | |
| JPM | |
Man Group PLC | |
GBP | |
| (137,374 | ) | |
10/31/2024 | |
SONIA | |
(40) bps | |
| (137,061 | ) | |
| 313 | |
| JPM | |
Mercantile Investment Trust PLC | |
GBP | |
| 8,295,585 | | |
10/31/2024 | |
SONIA | |
40 bps | |
| 8,499,956 | | |
| 204,371 | |
| JPM | |
MFF Capital Investments, Ltd. | |
AUD | |
| 634,412 | | |
10/31/2024 | |
RBACOR | |
45 bps | |
| 629,781 | | |
| (4,631 | ) |
| JPM | |
Middlefield Canadian Income PC | |
GBP | |
| 1,486 | | |
10/31/2024 | |
SONIA | |
40 bps | |
| 1,492 | | |
| 6 | |
| JPM | |
Morgan Advanced Materials PLC | |
GBP | |
| (876 | ) | |
10/31/2024 | |
SONIA | |
(40) bps | |
| (902 | ) | |
| (26 | ) |
| JPM | |
Morgan Sindall Group PLC | |
GBP | |
| (12,101 | ) | |
10/31/2024 | |
SONIA | |
(40) bps | |
| (12,271 | ) | |
| (170 | ) |
| JPM | |
NB Global Corporate Income Trust | |
AUD | |
| 384,177 | | |
10/31/2024 | |
RBACOR | |
45 bps | |
| 374,742 | | |
| (9,435 | ) |
| JPM | |
Next Fifteen Communications | |
GBP | |
| (172 | ) | |
10/31/2024 | |
SONIA | |
(40) bps | |
| (169 | ) | |
| 3 | |
| JPM | |
Ocado Group PLC | |
GBP | |
| (156,634 | ) | |
10/31/2024 | |
SONIA | |
(40) bps | |
| (150,956 | ) | |
| 5,678 | |
| JPM | |
Oxford Instruments PLC | |
GBP | |
| (250,219 | ) | |
10/31/2024 | |
SONIA | |
(40) bps | |
| (261,843 | ) | |
| (11,624 | ) |
| Annual Report | October 31, 2023 |
41 |
| Saba Capital Income & Opportunities Fund |
Consolidated Schedule of Investments |
| |
October 31, 2023 |
TOTAL RETURN SWAP CONTRACTS(a)
| Counterparty | |
Reference Obligations | |
Currency | |
Notional Amount(b) | | |
Termination Date | |
Financing Rate Index | |
Financing Rate Spread Paid/(Received) by Fund | |
Value | | |
Unrealized Appreciation/ (Depreciation) | |
| JPM | |
Oxford Nanopore Technologies PLC | |
GBP | |
| (170,920 | ) | |
10/31/2024 | |
SONIA | |
(40) bps | |
$ | (167,304 | ) | |
$ | 3,616 | |
| JPM | |
Pagegroup PLC | |
GBP | |
| (318 | ) | |
10/31/2024 | |
SONIA | |
(40) bps | |
| (324 | ) | |
| (6 | ) |
| JPM | |
Pengana International Equities, Ltd. | |
AUD | |
| 179,660 | | |
10/31/2024 | |
RBACOR | |
45 bps | |
| 182,410 | | |
| 2,750 | |
| JPM | |
Polar Capital Technology Trust PLC | |
GBP | |
| 4,790,794 | | |
10/31/2024 | |
SONIA | |
40 bps | |
| 4,858,748 | | |
| 67,954 | |
| JPM | |
Polestar Automotive Holding UK PLC | |
USD | |
| (1,400,970 | ) | |
10/31/2024 | |
OBFR | |
(700) bps | |
| (1,421,880 | ) | |
| (20,910 | ) |
| JPM | |
QinetiQ Group PLC | |
GBP | |
| (211,258 | ) | |
10/31/2024 | |
SONIA | |
(40) bps | |
| (213,842 | ) | |
| (2,584 | ) |
| JPM | |
Reach PLC | |
GBP | |
| (74 | ) | |
10/31/2024 | |
SONIA | |
(40) bps | |
| (75 | ) | |
| (1 | ) |
| JPM | |
Redrow PLC | |
GBP | |
| (3,979 | ) | |
10/31/2024 | |
SONIA | |
(40) bps | |
| (4,034 | ) | |
| (55 | ) |
| JPM | |
River & Mercantile UK Micro Cap Inv Co Ltd | |
GBP | |
| 783,331 | | |
10/31/2024 | |
SONIA | |
40 bps | |
| 777,634 | | |
| (5,697 | ) |
| JPM | |
Samsung Electronics Co., Ltd. | |
USD | |
| (75,665 | ) | |
10/31/2024 | |
OBFR | |
(40) bps | |
| (76,006 | ) | |
| (341 | ) |
| JPM | |
Schiehallion Fund, Ltd. | |
USD | |
| 44,274 | | |
10/31/2024 | |
OBFR | |
40 bps | |
| 41,507 | | |
| (2,767 | ) |
| JPM | |
Schroder UK Mid Cap Fund PLC | |
GBP | |
| 263,098 | | |
10/31/2024 | |
SONIA | |
40 bps | |
| 270,740 | | |
| 7,642 | |
| JPM | |
Schroders Capital Global | |
GBP | |
| 12,452 | | |
10/31/2024 | |
SONIA | |
40 bps | |
| 12,782 | | |
| 330 | |
| JPM | |
Scottish Mortgage Investment Trust PLC | |
GBP | |
| 11,292,385 | | |
10/31/2024 | |
SONIA | |
40 bps | |
| 11,281,845 | | |
| (10,540 | ) |
| JPM | |
SEB SA | |
EUR | |
| (3,049 | ) | |
10/31/2024 | |
ESTRON | |
(40) bps | |
| (3,055 | ) | |
| (6 | ) |
| JPM | |
Senior PLC | |
GBP | |
| (1,405 | ) | |
10/31/2024 | |
SONIA | |
(40) bps | |
| (1,418 | ) | |
| (13 | ) |
| JPM | |
Soitec | |
EUR | |
| (99,026 | ) | |
10/31/2024 | |
ESTRON | |
(40) bps | |
| (100,348 | ) | |
| (1,322 | ) |
| JPM | |
Spie SA | |
EUR | |
| (59,892 | ) | |
10/31/2024 | |
ESTRON | |
(40) bps | |
| (60,872 | ) | |
| (980 | ) |
| JPM | |
SSP Group PLC | |
GBP | |
| (103 | ) | |
10/31/2024 | |
SONIA | |
(40) bps | |
| (103 | ) | |
| - | |
| JPM | |
Telecom Plus PLC | |
GBP | |
| (44,587 | ) | |
10/31/2024 | |
SONIA | |
(40) bps | |
| (46,203 | ) | |
| (1,616 | ) |
| JPM | |
Templeton EM Investment Trust PLC | |
GBP | |
| 2,480,783 | | |
10/31/2024 | |
SONIA | |
40 bps | |
| 2,473,854 | | |
| (6,929 | ) |
| JPM | |
Verallia SA | |
EUR | |
| (53,364 | ) | |
10/31/2024 | |
ESTRON | |
(40) bps | |
| (53,538 | ) | |
| (174 | ) |
| JPM | |
Vesuvius PLC | |
GBP | |
| (21,687 | ) | |
10/31/2024 | |
SONIA | |
(40) bps | |
| (21,719 | ) | |
| (32 | ) |
| JPM | |
VGI Partners Global Investments, Ltd. | |
AUD | |
| 464,610 | | |
10/31/2024 | |
RBACOR | |
45 bps | |
| 469,063 | | |
| 4,453 | |
| JPM | |
WAM Global, Ltd. | |
AUD | |
| 304,265 | | |
10/31/2024 | |
RBACOR | |
45 bps | |
| 305,946 | | |
| 1,681 | |
| JPM | |
Watches of Switzerland Group PLC | |
GBP | |
| (108,775 | ) | |
10/31/2024 | |
SONIA | |
(40) bps | |
| (108,343 | ) | |
| 432 | |
| JPM | |
WH Smith PLC | |
GBP | |
| (7,374 | ) | |
10/31/2024 | |
SONIA | |
(40) bps | |
| (7,318 | ) | |
| 56 | |
| JPM | |
Wise PLC | |
GBP | |
| (17,862 | ) | |
10/31/2024 | |
SONIA | |
(40) bps | |
| (18,251 | ) | |
| (389 | ) |
| JPM | |
Workspace Group PLC | |
GBP | |
| (107 | ) | |
10/31/2024 | |
SONIA | |
(40) bps | |
| (111 | ) | |
| (4 | ) |
| | |
| |
| |
| | | |
| |
| |
| |
$ | 107,153,121 | | |
$ | 1,077,382 | |
All Reference Obligations shown above for Total Return Swap Contracts
are closed end funds and common stock.
| (a) | The Fund receives monthly payments based on any positive monthly return of the Reference Obligation. The Fund makes payments on
any negative monthly return of such Reference Obligation |
| (b) | Notional amounts are presented in USD equivalent. |
|
Saba Capital Income
& Opportunities Fund |
Consolidated Statement of Assets and Liabilities |
| |
October 31, 2023 |
| ASSETS: | |
| |
| Investments in securities, at fair value (cost $312,899,127) | |
$ | 296,284,022 | |
| Cash | |
| 4,231,218 | |
| Foreign currency, at fair value (cost $7,130,914) | |
| 7,061,084 | |
| Receivables: | |
| | |
| Investment securities sold | |
| 11,544,964 | |
| Collateral posted to Clearing House for centrally cleared derivatives | |
| 12,161,367 | |
| Collateral posted to Secured Party under Tri-Party Arrangement for OTC derivatives | |
| 68,490,602 | |
| Collateral posted to Secured Party under Tri-Party Arrangement for Loan Facility | |
| 666,034 | |
| Collateral posted to Secured Party under Tri-Party Arrangement for securities sold short | |
| 231,523,667 | |
| Dividend | |
| 135,756 | |
| Interest | |
| 1,183,050 | |
| Simple agreement for future equity contracts, at fair value (cost $6,000,000) | |
| 6,429,315 | |
| Unrealized appreciation on forward foreign currency contracts | |
| 60,867 | |
| Unrealized appreciation on futures contracts | |
| 1,047,144 | |
| Centrally cleared credit default swaps, at fair value (net upfront fees paid of $5,093,466) | |
| 1,677,132 | |
| Over the counter credit default swaps, at fair value (net upfront fees paid of $5,132,872) | |
| 5,986,098 | |
| Unrealized appreciation on total return swap contracts | |
| 1,208,552 | |
| Prepaid expenses | |
| 280,847 | |
| Total Assets | |
| 649,971,719 | |
| | |
| | |
| LIABILITIES: | |
| | |
| Securities sold short, at fair value (proceeds $212,389,404) | |
| 207,682,793 | |
| Foreign currency overdraft, at fair value (proceeds $6,581,254) | |
| 6,571,524 | |
| Unrealized depreciation on TBA MBS forward contracts | |
| 2,630,644 | |
| Payables: | |
| | |
| Notes payable (Note 7) | |
| 52,900,000 | |
| Payable for investment securities purchased | |
| 22,611,671 | |
| Accrued interest payable | |
| 1,818,818 | |
| Payable for investment management fees | |
| 362,039 | |
| Payable for trustees fees | |
| 3,620 | |
| Unrealized depreciation on forward foreign currency contracts | |
| 78,687 | |
| Unrealized depreciation on futures contracts | |
| 17,954 | |
| Centrally cleared credit default swaps, at fair value (net upfront fees received of $744,983) | |
| 355,161 | |
| Over the counter credit default swaps, at fair value (net upfront fees received of $222,929) | |
| 55,215 | |
| Unrealized depreciation on total return swap contracts | |
| 131,170 | |
| Other accrued expenses | |
| 885,160 | |
| Total Liabilities | |
| 296,104,456 | |
| Net Assets | |
$ | 353,867,263 | |
| | |
| | |
| COMPOSITION OF NET ASSETS ATTRIBUTABLE TO COMMON SHARES: | |
| | |
| NET ASSETS WERE COMPRISED OF: | |
| | |
| Paid-in capital | |
| 526,384,074 | |
| Total distributable loss | |
| (172,516,811 | ) |
| NET ASSETS | |
$ | 353,867,263 | |
| Net assets value per common share outstanding (net assets divided by 42,529,493 shares of beneficial interest authorized and outstanding, no par value) | |
$ | 8.32 | |
|
Saba Capital Income
& Opportunities Fund |
Consolidated Statement of Operations |
| |
For the Year Ended October 31, 2023 |
| INVESTMENT INCOME: | |
| |
| Interest | |
$ | 18,799,134 | |
| Dividend (net of withholding taxes of $24,722) | |
| 5,711,255 | |
| Other income | |
| 104,689 | |
| Total Investment Income | |
| 24,615,078 | |
| | |
| | |
| EXPENSES: | |
| | |
| Interest expense | |
| 8,471,630 | |
| Investment management fees (Note 4) | |
| 4,797,121 | |
| Dividend expense | |
| 2,642,740 | |
| Professional fees | |
| 546,478 | |
| Custodian fees | |
| 215,639 | |
| Fund administration fees | |
| 194,882 | |
| Registration and filing fees | |
| 184,182 | |
| Insurance expense | |
| 88,647 | |
| Trustees fees | |
| 63,750 | |
| Transfer agent fees | |
| 45,174 | |
| Miscellaneous expenses | |
| 120,763 | |
| Total Expenses | |
| 17,371,006 | |
| Waived and reimbursed fees (Note 5) | |
| (450,898 | ) |
| Net expenses | |
| 16,920,108 | |
| Net Investment Income | |
| 7,694,970 | |
| | |
| | |
| NET REALIZED AND UNREALIZED GAIN/(LOSS): | |
| | |
| Net realized gain/(loss) on: | |
| | |
| Investments in securities | |
| 38,316,965 | |
| Securities sold short | |
| 6,522,684 | |
| Forward foreign currency contracts | |
| (117,085 | ) |
| Futures contracts | |
| (9,058,790 | ) |
| TBA MBS forward contracts | |
| (15,696,857 | ) |
| Credit default swaps | |
| 16,449,190 | |
| Total return swaps | |
| (15,778,655 | ) |
| Foreign currency transactions | |
| 980,175 | |
| Net realized gain: | |
| 21,617,627 | |
| Net change in unrealized appreciation/(depreciation) on: | |
| | |
| Investments in securities | |
| 941,977 | |
| Securities sold short | |
| 4,706,611 | |
| Simple agreement for future equity contracts | |
| 429,315 | |
| Forward foreign currency contracts | |
| (296,112 | ) |
| Futures contracts | |
| 1,029,190 | |
| TBA MBS forward contracts | |
| (2,630,644 | ) |
| Credit default swaps | |
| (4,390,662 | ) |
| Total return swaps | |
| 1,101,105 | |
| Financial instruments | |
| 145,633 | |
| Foreign currency translation | |
| 247,186 | |
| Net change in unrealized appreciation/(depreciation): | |
| 1,283,599 | |
| Net realized and unrealized gain: | |
| 22,901,226 | |
| Net increase in net assets resulting from operations | |
$ | 30,596,196 | |
| Annual Report | October 31, 2023 |
44 |
|
Saba Capital Income
& Opportunities Fund |
Consolidated Statements of Changes in Net Assets |
| | |
For the Year Ended October 31, 2023 | | |
For the Year Ended October 31, 2022 | |
| FROM OPERATIONS: | |
| | | |
| | |
| Net investment income | |
$ | 7,694,970 | | |
$ | 1,944,996 | |
| Net realized gain | |
| 21,617,627 | | |
| 9,130,329 | |
| Net change in unrealized appreciation/(depreciation) | |
| 1,283,599 | | |
| (18,329,380 | ) |
| Net increase/(decrease) in net assets resulting from operations | |
| 30,596,196 | | |
| (7,254,055 | ) |
| | |
| | | |
| | |
| FROM DISTRIBUTIONS TO COMMON SHAREHOLDERS: | |
| | | |
| | |
| Total distributions (excluding return of capital) | |
| (8,594,037 | ) | |
| (13,029,565 | ) |
| Return of capital | |
| (35,594,107 | ) | |
| (31,967,059 | ) |
| Decrease in net assets from distributions to common shareholders | |
| (44,188,144 | ) | |
| (44,996,624 | ) |
| Net decrease in net assets | |
| (13,591,948 | ) | |
| (52,250,679 | ) |
| NET ASSETS: | |
| | | |
| | |
| Net assets, beginning of year | |
| 367,459,211 | | |
| 419,709,890 | |
| Net assets, end of year | |
$ | 353,867,263 | | |
$ | 367,459,211 | |
| Saba Capital Income |
|
| & Opportunities Fund |
Consolidated Statement of Cash Flows |
| |
For the Year Ended October 31, 2023 |
| INCREASE (DECREASE) IN CASH | |
| |
| CASH FLOWS PROVIDED BY (USED IN) OPERATING ACTIVITIES: | |
| |
| Net increase in net assets resulting from operations | |
$ | 30,596,196 | |
| Adjustments to reconcile net increase in net assets resulting from operations to net cash flows provided by operating activities: | |
| | |
| Purchases of investment securities | |
| (2,013,257,665 | ) |
| Proceeds from disposition of investment securities | |
| 2,301,280,645 | |
| Proceeds from disposition of financial instruments | |
| 1,413,910 | |
| Proceeds from securities sold short | |
| 218,810,284 | |
| Net payments on derivative contracts | |
| (42,321,786 | ) |
| Amortization of premium and accretion of discount on investments | |
| (4,824,850 | ) |
| Net realized (gain)/loss on investments in securities | |
| (38,316,965 | ) |
| Net realized (gain)/loss on securities sold short | |
| (6,522,684 | ) |
| Net realized (gain)/loss on forward foreign currency contracts | |
| 117,085 | |
| Net realized (gain)/loss on futures contracts | |
| 9,058,790 | |
| Net realized (gain)/loss on credit default swaps | |
| (16,449,190 | ) |
| Net realized (gain)/loss on total return swaps | |
| 15,778,655 | |
| Net realized (gain)/loss on TBA MBS forward contracts | |
| 15,696,857 | |
| Net realized (gain)/loss on foreign currency transactions | |
| (980,175 | ) |
| Change in unrealized (appreciation)/depreciation on investments in securities | |
| (941,977 | ) |
| Change in unrealized (appreciation)/depreciation on securities sold short | |
| (4,706,611 | ) |
| Change in unrealized (appreciation)/depreciation on simple agreement for future equity contracts | |
| (429,315 | ) |
| Change in unrealized (appreciation)/depreciation on forward foreign currency contracts | |
| 296,112 | |
| Change in unrealized (appreciation)/depreciation on futures contracts | |
| (1,029,190 | ) |
| Change in unrealized (appreciation)/depreciation on credit default swaps | |
| 4,390,662 | |
| Change in unrealized (appreciation)/depreciation on total return swaps | |
| (1,101,105 | ) |
| Change in unrealized (appreciation)/depreciation on TBA MBS forward contracts | |
| 2,630,644 | |
| Change in unrealized (appreciation)/depreciation on financial instruments | |
| (145,633 | ) |
| Change in unrealized (appreciation)/depreciation on foreign currency translation | |
| (247,186 | ) |
| (Increase)/decrease in assets: | |
| | |
| Collateral posted to Clearing House for centrally cleared derivatives | |
| (8,123,192 | ) |
| Collateral posted to Secured Party under Tri-Party Arrangement for OTC derivatives | |
| (64,380,602 | ) |
| Collateral posted to Secured Party under Tri-Party Arrangement for Loan Facility | |
| (666,034 | ) |
| Collateral posted to Secured Party under Tri-Party Arrangement for securities sold short | |
| (231,523,667 | ) |
| Dividend receivable | |
| (135,756 | ) |
| Interest receivable | |
| (225,759 | ) |
| Prepaid expenses | |
| (220,552 | ) |
| Financial instruments, at fair value | |
| 1,268,277 | |
| Increase/(decrease) in liabilities: | |
| | |
| Accrued interest payable | |
| 1,316,478 | |
| Payable for investment management fees | |
| 113,727 | |
| Payable for trustees fees | |
| (14,610 | ) |
| Other accrued expenses | |
| (333,911 | ) |
| Net cash flows provided by operating activities | |
| 165,869,907 | |
| | |
| | |
| CASH FLOWS FROM FINANCING ACTIVITIES: | |
| | |
| Repayments of long-term debt | |
| (227,600,000 | ) |
| Proceeds from long-term debt | |
| 105,000,000 | |
| Cash distributions paid | |
| (44,188,144 | ) |
| Foreign currency overdraft | |
| 6,571,524 | |
| Net cash used in financing activities | |
| (160,216,620 | ) |
| | |
| | |
| Net change in cash & foreign currency | |
| 5,653,287 | |
| Cash & foreign currency, beginning of year | |
$ | 5,639,015 | |
| Cash & foreign currency, end of year | |
$ | 11,292,302 | |
| | |
| | |
| Cash paid for interest on loan during the year was | |
| 7,155,152 | |
| Annual Report | October 31, 2023 |
46 |
| Saba Capital Income & Opportunities Fund |
Financial Highlights |
| For a Share Outstanding Throughout the Periods Presented |
| | |
For the Year Ended October 31, 2023(a) | | |
For the Year Ended October 31, 2022(a) | | |
For the Period Ended October 31, 2021(b)(c) | | |
For the Year Ended February 28, 2021(c) | | |
For the Year Ended February 28, 2020(c) | | |
For the Year Ended February 28, 2019(c) | |
| PER COMMON SHARE OPERATING PERFORMANCE: | |
| | | |
| | | |
| | | |
| | | |
| | | |
| | |
| Net asset value - beginning of period | |
$ | 8.64 | | |
$ | 9.86 | | |
$ | 9.94 | | |
$ | 10.60 | | |
$ | 11.08 | | |
$ | 11.38 | |
| INCOME/(LOSS) FROM INVESTMENT OPERATIONS: | |
| | | |
| | | |
| | | |
| | | |
| | | |
| | |
| Net investment income(d) | |
| 0.18 | | |
| 0.05 | | |
| 0.10 | | |
| 0.32 | | |
| 0.60 | | |
| 0.58 | |
| Net realized and change in unrealized gain/ (loss) on investments and unfunded loan commitments(d) | |
| 0.54 | | |
| (0.21 | ) | |
| 0.16 | | |
| (0.64 | ) | |
| (0.46 | ) | |
| (0.28 | ) |
| Total Income/(Loss) from Investment Operations | |
| 0.72 | | |
| (0.16 | ) | |
| 0.26 | | |
| (0.32 | ) | |
| 0.14 | | |
| 0.30 | |
| | |
| | | |
| | | |
| | | |
| | | |
| | | |
| | |
| DISTRIBUTIONS TO COMMON SHAREHOLDERS: | |
| | | |
| | | |
| | | |
| | | |
| | | |
| | |
| From net investment income(d) | |
| (0.20 | ) | |
| (0.31 | ) | |
| (0.12 | ) | |
| (0.34 | ) | |
| (0.62 | ) | |
| (0.60 | ) |
| From tax return of capital(d) | |
| (0.84 | ) | |
| (0.75 | ) | |
| (0.22 | ) | |
| (0.02 | ) | |
| - | | |
| - | |
| Total Distributions to Common Shareholders | |
| (1.04 | ) | |
| (1.06 | ) | |
| (0.34 | ) | |
| (0.36 | ) | |
| (0.62 | ) | |
| (0.60 | ) |
| | |
| | | |
| | | |
| | | |
| | | |
| | | |
| | |
| Accretion to net asset value resulting from share repurchases and tender offer(d)(e) | |
| - | | |
| - | | |
| - | | |
| 0.02 | | |
| - | | |
| - | |
| Total Capital Share Transactions | |
| - | | |
| - | | |
| - | | |
| 0.02 | | |
| - | | |
| - | |
| Net asset value per common share - end of period | |
| 8.32 | | |
$ | 8.64 | | |
$ | 9.86 | | |
$ | 9.94 | | |
$ | 10.60 | | |
$ | 11.08 | |
| Market price per common share - end of period | |
$ | 7.39 | | |
$ | 7.84 | | |
$ | 9.34 | | |
$ | 9.26 | | |
$ | 9.82 | | |
$ | 9.64 | |
| | |
| | | |
| | | |
| | | |
| | | |
| | | |
| | |
| Total Investment Return - Net Asset Value(f) | |
| 9.63 | % | |
| (0.95 | )% | |
| 2.84 | % | |
| (2.14 | )% | |
| 1.88 | % | |
| 33.37 | % |
| Total Investment Return - Market Price(f) | |
| 7.31 | % | |
| (5.12 | )% | |
| 4.57 | % | |
| (1.59 | )% | |
| 8.48 | % | |
| (1.02 | )% |
| | |
| | | |
| | | |
| | | |
| | | |
| | | |
| | |
| RATIOS AND SUPPLEMENTAL DATA: | |
| | | |
| | | |
| | | |
| | | |
| | | |
| | |
| Net assets attributable to common shares, end of period (000s) | |
$ | 353,867 | | |
$ | 367,459 | | |
$ | 419,710 | | |
$ | 605,535 | | |
$ | 782,813 | | |
$ | 818,100 | |
| Ratio of expenses including waivers to average net assets (h) | |
| 4.61 | % | |
| 2.36 | % | |
| 1.43 | %(g) | |
| 2.26 | % | |
| 2.85 | % | |
| 2.90 | % |
| Ratio of expenses excluding waivers to average net assets | |
| 4.73 | % | |
| 2.75 | % | |
| 1.60 | %(g) | |
| 2.68 | % | |
| 2.86 | % | |
| 2.92 | % |
| Ratio of expenses excluding dividend expense on securities sold short, interest expense and other fees related to revolving credit facility to average net assets | |
| 1.58 | % | |
| 1.67 | % | |
| 1.38 | %(g) | |
| 2.13 | % | |
| 1.62 | % | |
| 1.64 | % |
| Ratio of net investment income including waivers to average net assets | |
| 2.09 | % | |
| 0.49 | % | |
| 1.62 | %(g) | |
| 3.37 | % | |
| 5.29 | % | |
| 5.16 | % |
| Ratios to average net assets plus borrowings: | |
| | | |
| | | |
| | | |
| | | |
| | | |
| | |
| Ratio of expenses including waivers to average net assets | |
| 3.71 | % | |
| 1.79 | % | |
| 1.37 | %(g) | |
| 1.72 | % | |
| 2.05 | % | |
| 2.07 | % |
| Ratio of expenses excluding waivers to average net assets | |
| 3.81 | % | |
| 2.09 | % | |
| 1.54 | %(g) | |
| 2.04 | % | |
| 2.06 | % | |
| 2.08 | % |
| Ratio of expenses excluding dividend expense on securities sold short, interest expense and other fees related to revolving credit facility to average net assets | |
| 1.27 | % | |
| 1.27 | % | |
| 1.32 | %(g) | |
| 1.30 | % | |
| 1.16 | % | |
| 1.16 | % |
| Ratio of net investment income including waivers to average net assets | |
| 1.69 | % | |
| 0.38 | % | |
| 1.56 | % | |
| 2.56 | % | |
| 3.81 | % | |
| 3.68 | % |
| Portfolio turnover rate | |
| 76.16 | % | |
| 99.00 | % | |
| 94.00 | % | |
| 56.00 | % | |
| 53.00 | % | |
| 60.00 | % |
| | |
| | | |
| | | |
| | | |
| | | |
| | | |
| | |
| SUPPLEMENTAL DATA | |
| | | |
| | | |
| | | |
| | | |
| | | |
| | |
| Total shares outstanding (000s)(c) | |
| 42,529 | | |
| 42,529 | | |
| 42,529 | | |
| 60,920 | | |
| 73,894 | | |
| 73,894 | |
| Asset coverage, end of period per $1,000(i) | |
| 6,689 | | |
$ | 3,904 | | |
$ | 9,394 | | |
$ | 27,794 | | |
$ | 3,478 | | |
$ | 3,534 | |
| | |
| | | |
| | | |
| | | |
| | | |
| | | |
| | |
| Aggregate principal amount of borrowings, end of period (000s) | |
| 52,900 | | |
$ | 175,500 | | |
$ | 50,000 | | |
$ | 22,600 | | |
$ | 315,900 | | |
$ | 322,800 | |
| Average borrowings outstanding during the period (000s) | |
| 88,961 | | |
$ | 124,674 | | |
$ | 20,559 | | |
$ | 211,066 | | |
$ | 312,939 | | |
$ | 332,698 | |
| Saba Capital Income & Opportunities Fund |
Financial Highlights |
| For a Share Outstanding Throughout the Periods Presented |
| (a) | Consolidated financials. |
| (b) | With the approval of the Board effective October 31, 2021, the Fund's fiscal year end was changed from
February 28 to October 31. |
| (c) | Reflects a 1 for 2 reverse stock split effective May 20, 2022, see Note 8 in the accompanying Notes
to Consolidated Financial Statements. |
| (d) | Calculated using average common shares outstanding. |
| (e) | Please see Note 8 in the accompanying Notes to Consolidated Financial Statements for additional information. |
| (f) | Total investment return is calculated assuming a purchase of common share at the opening on the first
day and a sale at closing on the last day of each period reported. Dividends and distributions are assumed for purposes of this calculation
to be reinvested at prices obtained under the Fund's dividend reinvestment plan. Total investment returns does not reflect sales load
or brokerage commissions, if any, and are not annualized. |
| (h) | The Investment Adviser (See Note 1 and Note 5) has entered into a written expense limitation agreement
with the Fund under which it will limit the expenses of the Fund (excluding interest, taxes, investor relations services, other investment-related
costs, leverage expenses, extraordinary expenses, other expenses not incurred in the ordinary course of such Fund’s business, and
expenses of any counsel or other persons or services retained by such Fund’s trustees who are not interested persons) subject to
possible recoupment by the Investment Adviser within three years of being incurred. |
| (i) | Asset coverage ratio is presented to represent the coverage available to each $1,000 of borrowings.
The asset coverage ratio per $1,000 of debt is presented to represent the coverage available to each $1,000 of borrowings. Calculated
by subtracting the Fund's total liabilities (excluding the principal amount of the Leverage Facility) from the Fund's total assets and
dividing by the principal amount of the Leverage Facility and then multiplying by $1,000. |
| Annual Report | October 31, 2023 |
48 |
|
Saba Capital Income
& Opportunities Fund |
Notes to Consolidated Financial Statements |
| |
October 31, 2023 |
NOTE 1 — ORGANIZATION
Saba Capital Income & Opportunities Fund (the
“Fund”), a Massachusetts business trust, is registered under the Investment Company Act of 1940, as amended (the “1940
Act”), as a closed-end, management investment company. The common shares of the Fund are listed on the New York Stock Exchange (the
“NYSE”) under the symbol “BRW”. The Fund’s investment objective is to seek to provide shareholders with
a high level of current income, with a secondary goal of capital appreciation. The Fund seeks to achieve this objective by investing globally
in debt and equity securities of public and private companies, which includes, among other things, investing in closed-end funds, special
purpose acquisition companies (“SPAC”), public and private debt instruments, as well as derivatives, including but not limited
to, total return swaps, credit default swaps, options and futures, where the Fund seeks to enhance returns and/or to reduce portfolio
risk. From time to time, in pursuit of its investment objective, the Fund may also invest up to 15% of its total assets in private funds
on a discretionary basis.
Saba Capital Management, L.P. (the “Investment Adviser”), a
Delaware limited partnership, serves as the investment adviser to the Fund.
NOTE 2 — SIGNIFICANT ACCOUNTING POLICIES
These consolidated financial statements have been
prepared in accordance with generally accepted accounting principles in the United States of America (“GAAP”) and are stated
in U.S. dollars. The Fund is considered an investment company under Accounting Standard Codification (“ASC”) 946, “Financial
Services – Investment Companies”, and follows the accounting and reporting guidance therein. The preparation of the consolidated
financial statements requires management to make estimates and assumptions that affect the amounts in the consolidated financial statements
and accompanying notes. Actual results could differ from these estimates and the differences may be material.
The Fund is open for business every day the NYSE opens
for regular trading (each such day, a “Business Day”). The net asset value (“NAV”) per Common Share of the Fund
is determined each Business Day as of the close of the regular trading session (“Market Close”), as determined by the Consolidated
Tape Association (“CTA”), the central distributor of transaction prices for exchange-traded securities (normally 4:00 p.m.
Eastern time unless otherwise designated by the CTA). The data reflected on the consolidated tape provided by the CTA is generated by
various market centers, including all securities exchanges, electronic communications networks, and third-market broker-dealers. The NAV
per Common Share of the Fund is calculated by dividing the value of the Fund’s assets plus all cash and other assets (including
accrued expenses but excluding capital and surplus) attributable to the Common Shares by the number of Common Shares outstanding. The
NAV per Common Share is made available for publication. On days when the Fund is closed for business, Fund shares will not be priced and
the Fund does not transact purchase and redemption orders. To the extent the Fund’s assets are traded in other markets on days when
the Fund does not price its shares, the value of the Fund’s assets will likely change and you will not be able to purchase or sell
shares of the Fund.
A. Financial Instrument Valuation. Investments
for which market quotations are readily available are valued at fair market value. Securities (including common stock, closed end funds,
investment trusts, preferred stock, unit trusts and special purpose acquisition companies) listed or traded on an exchange are valued
at their last sales price or official closing price as of the close of the regular trading session on the exchange where the particular
security at the last sale price as of the Market Close for such security provided by the CTA. Investments in money market funds are valued
at NAV, which approximates fair market value. The private fund investment is valued at the NAV reported by the private fund’s general
partner or investment manager. This is commonly referred to as using NAV as the practical expedient which allows for estimation of the
fair value of an investment in an investment entity based on NAV or its equivalent if the NAV of the investment entity is calculated in
a manner consistent with ASC 946. Because of the inherent uncertainty of valuations of the investments in the private fund, their estimated
values may differ significantly from the values that would have been used had a ready market for the private fund existed, and the differences
could be material. Corporate bonds, convertible corporate bonds, mortgage-backed securities, sovereign debt obligations and senior loans
are valued at mid-level prices provided by independent pricing services. Exchange traded derivatives such as warrants, rights, options
and futures contracts are valued at last sales price on the valuation date or, if such price is not available, the mean between the last
bid and ask prices from the exchange on which they are principally traded. Non-exchange traded derivatives (such as credit default swaps)
are valued by independent pricing services, which use various techniques including industry standard pricing models, to determine the
fair value of those instruments. Investments for which market quotations are not readily available (including common stock, preferred
stock, participation agreements, special purpose acquisition companies and warrants) are valued by third-party valuation specialists or
at cost, which approximates fair market value.
B. Fair Value Measurement. Investments
held by the Fund are recorded at fair value in accordance with ASC 820, “Fair Value Measurements and Disclosures” (“ASC
820”). As defined in ASC 820, fair value is the price that would be received to sell an asset or paid to transfer a liability in
an orderly transaction between market participants at the measurement date. In accordance with Rule 2a-5 promulgated under the 1940 Act,
the Board of Trustees (the “Board”) has appointed the Investment Adviser as the Fund’s valuation designee. In that role,
it has established a Valuation Committee (the “Committee”) that oversees the valuation of the Fund’s investments pursuant
to procedures adopted by the Investment Adviser (the “Valuation Policy”). Under that Rule, the Board has assigned to the Investment
Adviser general responsibility for determining, in accordance with the Valuation Policy, the value of its investments. The Committee is
led by the Investment Adviser’s Chief Financial Officer and is comprised of the Investment Adviser’s Chief Operating Officer/Chief
Compliance Officer, Fund Accounting team, Chief Risk Officer (Fund Trustee), and Director of Operations, all of whom are independent of
the Fund’s portfolio investment decisions. Additionally, Investment Adviser’s Portfolio Managers, whose roles are limited
to providing insight into recent trade activity and overall market performance, are also members of the Committee. The majority of Committee
members are independent of the Fund’s portfolio investment decisions. The Committee meets on a monthly basis and is responsible
for compliance and consistent application of the Valuation Policy.
| Annual Report | October 31, 2023 |
49 |
|
Saba Capital Income
& Opportunities Fund |
Notes to Consolidated Financial Statements |
| |
October 31, 2023 |
ASC 820 establishes a hierarchical disclosure framework
which prioritizes and ranks the level of market price observability of inputs used in measuring investments at fair value. Market price
observability is affected by a number of factors, including the type of investment and the characteristics specific to the investment.
Investments with readily available active quoted prices or for which fair value can be measured from actively quoted prices generally
will have a higher degree of market price observability and a lesser degree of judgment used in measuring fair value. Investments measured
and reported at fair value are classified and disclosed in one of the following categories:
Level 1 – Quoted prices available in
active markets for identical financial instruments as of the reporting date. An active market for the financial instrument is a market
in which transactions for the financial instrument occur with sufficient frequency and volume to provide pricing information on an ongoing
basis, as well as at the reporting date. Investments classified within Level 1 primarily include money market funds, common stock, closed
end funds, investment trusts, preferred stock, unit trusts and special purpose acquisition companies, exchange traded derivatives (including
warrants, rights, options and futures contracts) and certain government bonds. The Investment Adviser does not adjust the quoted price
for such instruments, even in situations where the Fund holds a large position and a sale could reasonably impact the quoted price.
Level 2 – Consists of financial instruments
fair valued using inputs other than quoted prices included within Level 1 that are observable for the financial instrument, either directly
or indirectly. This category includes pricing inputs that are quoted prices for similar financial instruments in active markets or quoted
prices for similar or identical financial instruments in markets that at times may not meet the definition of active. Derivatives are
valued using observable inputs, such as quotations received from third party service providers, counterparties, dealers or brokers, whenever
available and considered reliable. In instances where models are used, the value of a derivative depends upon the contractual terms of,
and specific risks inherent in, the instrument as well as the availability and reliability of observable inputs. Such inputs include market
prices for reference securities, yield curves, credit curves, measures of volatility, prepayment rates and correlations of such inputs.
If inputs are unobservable and significant to the fair value, these investments will be classified as Level 3.
Level 3 – Pricing inputs that are unobservable
for the financial instrument and includes situations where there may be little, if any, market activity for the financial instrument.
The inputs into the determination of fair value could require significant management judgment or estimation. A financial instrument’s
level within the fair value hierarchy is based on the lowest level of any input that is significant to the fair value measurement. However,
the determination of what constitutes “observable” requires significant judgment by the Investment Adviser. The Investment
Adviser considers observable data to be market data, which is readily available, regularly distributed or updated, reliable and verifiable,
not proprietary, and provided by independent sources that are actively involved in the relevant market. The categorization of a financial
instrument within the hierarchy is based upon the pricing transparency of the instrument and does not necessarily correspond to the Investment
Adviser’s perceived risk of that instrument.
|
Saba Capital Income
& Opportunities Fund |
Notes to Consolidated Financial Statements |
| |
October 31, 2023 |
The following table summarizes the valuation of the
Fund’s financial instruments in accordance with the above fair value hierarchy levels as of October 31, 2023. Refer to the portfolio
of investments for additional details.
| Investments in Securities at fair value | |
Level 1 - Quoted Prices | | |
Level 2 - Significant Observable Inputs | | |
Level 3 - Significant Unobservable Inputs | | |
Total | |
| Corporate Bonds | |
$ | - | | |
$ | 36,729,136 | | |
$ | - | | |
$ | 36,729,136 | |
| Senior Loans*** | |
| - | | |
| 35,310,585 | | |
| - | | |
| 35,310,585 | |
| Convertible Corporate Bond | |
| - | | |
| 1,054,208 | | |
| - | | |
| 1,054,208 | |
| Sovereign Debt Obligations** | |
| - | | |
| 10,047,748 | | |
| - | | |
| 10,047,748 | |
| Mortgage-Backed Securities | |
| - | | |
| 3,945,447 | | |
| - | | |
| 3,945,447 | |
| Common Stock*** | |
| 18,389,417 | | |
| 3,865,207 | | |
| - | | |
| 22,254,624 | |
| Closed End Funds | |
| 80,416,011 | | |
| - | | |
| - | | |
| 80,416,011 | |
| Investment Trust | |
| 26,756,928 | | |
| - | | |
| - | | |
| 26,756,928 | |
| Preferred Stock | |
| - | | |
| 4,080 | | |
| 3,067,747 | | |
| 3,071,827 | |
| Participation Agreement | |
| - | | |
| - | | |
| 959,660 | | |
| 959,660 | |
| Private Fund* | |
| - | | |
| - | | |
| - | | |
| 37,398,584 | |
| Unit Trust | |
| 17,722,864 | | |
| - | | |
| - | | |
| 17,722,864 | |
| Special Purpose Acquisition Companies*** | |
| 16,339,613 | | |
| - | | |
| 292,435 | | |
| 16,632,048 | |
| Warrants*** | |
| 425,464 | | |
| 47,603 | | |
| 5,628 | | |
| 478,695 | |
| Rights*** | |
| 158,232 | | |
| - | | |
| - | | |
| 158,232 | |
| Options | |
| 1,098,258 | | |
| - | | |
| - | | |
| 1,098,258 | |
| Short Term Investments | |
| 2,249,167 | | |
| - | | |
| - | | |
| 2,249,167 | |
| Total | |
$ | 163,555,954 | | |
$ | 91,004,014 | | |
$ | 4,325,470 | | |
$ | 296,284,022 | |
| Securities sold short, at fair value | |
Level 1 - Quoted Prices | | |
Level 2 - Significant Observable Inputs | | |
Level 3 - Significant Unobservable Inputs | | |
Total | |
| Sovereign Debt Obligations** | |
$ | 168,488,484 | | |
$ | - | | |
$ | - | | |
$ | 168,488,484 | |
| Common Stock | |
| 23,083,795 | | |
| - | | |
| - | | |
| 23,083,795 | |
| Exchange Traded Funds | |
| 16,065,791 | | |
| - | | |
| - | | |
| 16,065,791 | |
| Preferred Stock | |
| 44,723 | | |
| - | | |
| - | | |
| 44,723 | |
| Total | |
$ | 207,682,793 | | |
$ | - | | |
$ | - | | |
$ | 207,682,793 | |
| Derivative contracts, at fair value | |
Level 1 - Quoted Prices | | |
Level 2 - Significant Observable Inputs | | |
Level 3 - Significant Unobservable Inputs | | |
Total | |
| Assets | |
| | | |
| | | |
| | | |
| | |
| Simple Agreement for Future Equity Contracts | |
$ | - | | |
$ | - | | |
$ | 6,429,315 | | |
$ | 6,429,315 | |
| Forward Foreign Currency Contracts | |
| - | | |
| 60,867 | | |
| - | | |
| 60,867 | |
| Futures Contracts | |
| 1,047,144 | | |
| - | | |
| - | | |
| 1,047,144 | |
| Centrally Cleared Credit Default Swaps | |
| - | | |
| 1,677,132 | | |
| - | | |
| 1,677,132 | |
| Over the Counter Credit Default Swaps | |
| - | | |
| 5,986,098 | | |
| - | | |
| 5,986,098 | |
| Total Return Swaps | |
| - | | |
| 1,208,552 | | |
| - | | |
| 1,208,552 | |
| Total Assets | |
$ | 1,047,144 | | |
$ | 8,932,649 | | |
$ | 6,429,315 | | |
$ | 16,409,108 | |
| | |
| | | |
| | | |
| | | |
| | |
| Liabilities | |
| | | |
| | | |
| | | |
| | |
| Forward foreign currency contracts | |
$ | - | | |
$ | 78,687 | | |
$ | - | | |
$ | 78,687 | |
| Futures Contracts | |
| 17,954 | | |
| - | | |
| - | | |
| 17,954 | |
| TBA MBS forward contracts | |
| - | | |
| 2,630,644 | | |
| - | | |
| 2,630,644 | |
| Centrally Cleared Credit Default Swaps | |
| - | | |
| 355,161 | | |
| - | | |
| 355,161 | |
| Over the Counter Credit Default Swaps | |
| - | | |
| 55,215 | | |
| - | | |
| 55,215 | |
| Total Return Swaps | |
| - | | |
| 131,170 | | |
| - | | |
| 131,170 | |
| Total Assets | |
$ | 17,954 | | |
$ | 3,250,877 | | |
$ | - | | |
$ | 3,268,831 | |
| * | In accordance with ASC 820-10, investments that are measured at fair value using the NAV per share
(or its equivalent) practical expedient have not been classified in the fair value hierarchy. The fair value amounts presented in this
table are intended to permit reconciliation of the fair value hierarchy to the amounts presented in the Consolidated Schedule of Investments
and Consolidated Statement of Assets and Liabilities. |
| ** | Investments classified in Level 1 include sovereign debt obligations issued by G10 countries. All other sovereign debt obligations
are classified as Level 2. |
| *** | The Fund held Level 3 investments that are priced at $0. |
| Annual Report | October 31, 2023 |
51 |
|
Saba Capital Income
& Opportunities Fund |
Notes to Consolidated Financial Statements |
| |
October 31, 2023 |
The following is a reconciliation of the fair value
of investments for which the Fund has used Level 3 unobservable inputs in determining fair value as of October 31, 2023:
| | |
Common Stock | | |
Preferred Stock | | |
Participation Agreement | | |
Special Purpose Acquisition Companies | | |
Warrants | | |
Contingent Forward Purchase Agreements | | |
Simple Agreement for Future Equity (SAFE) Contracts | | |
Total | |
| Balance as of October 31, 2022 | |
$ | 706,222 | | |
$ | 2,099,232 | | |
$ | - | | |
$ | 286,710 | | |
$ | 130,286 | | |
$ | 1,268,277 | | |
$ | - | | |
$ | 4,490,727 | |
| Accrued discount/ premium | |
| - | | |
| - | | |
| - | | |
| - | | |
| - | | |
| - | | |
| - | | |
| - | |
| Realized gain/(goss) | |
| - | | |
| - | | |
| - | | |
| - | | |
| - | | |
| - | | |
| - | | |
| - | |
| Change in unrealized appreciation/(depreciation) | |
| (689,942 | ) | |
| (31,485 | ) | |
| (1,360,340 | ) | |
| 5,725 | | |
| (123,347 | ) | |
| 145,633 | | |
| 429,315 | | |
| (1,624,441 | ) |
| Purchases/commitments | |
| - | | |
| 1,000,000 | | |
| 2,320,000 | | |
| - | | |
| - | | |
| - | | |
| 6,000,000 | | |
| 9,320,000 | |
| Sales proceeds | |
| (16,280 | ) | |
| - | | |
| - | | |
| - | | |
| - | | |
| (1,413,910 | ) | |
| - | | |
| (1,430,190 | ) |
| Transfer into Level 3 | |
| - | | |
| - | | |
| - | | |
| - | | |
| - | | |
| - | | |
| - | | |
| - | |
| Transfer out of Level 3 | |
| - | | |
| - | | |
| - | | |
| - | | |
| (1,311 | ) | |
| - | | |
| - | | |
| (1,311 | ) |
| Balance as of October 31, 2023 | |
$ | - | | |
$ | 3,067,747 | | |
$ | 959,660 | | |
$ | 292,435 | | |
$ | 5,628 | | |
$ | - | | |
$ | 6,429,315 | | |
$ | 10,754,785 | |
| Net change in unrealized appreciation/(depreciation) included in Consolidated Statement of Operations attributable to Level 3 investments held at October 31, 2023 | |
$ | (689,942 | ) | |
$ | (31,485 | ) | |
$ | (1,360,340 | ) | |
$ | 5,725 | | |
$ | (123,347 | ) | |
$ | 145,633 | | |
$ | 429,315 | | |
$ | (1,624,441 | ) |
The following table summarizes the valuation techniques
and significant unobservable inputs used for the Fund’s investments that are categorized in Level 3 of the fair value hierarchy
as of December 31, 2023:
| | |
| | |
| |
| |
Inputs |
| Asset Category: | |
Fair value at October 31, | | |
Valuation technique | |
Unobservable inputs | |
Range | |
Weighted Average |
| Preferred Stock | |
$ | 988,495 | | |
Backsolve Method | |
Volatility | |
70% | |
70% | |
70% |
| | |
$ | 2,079,252 | | |
Market Comparable Technique | |
Comparable Multiple | |
3.8x | |
8.3x | |
6.0x |
| | |
$ | 3,067,747 | | |
| |
| |
| |
| |
|
| | |
| | | |
| |
| |
| |
| |
|
| Participation Agreement | |
$ | 959,660 | | |
Probability Weighted Expected Return Method | |
Probability of Success | |
0% | |
100% | |
44% |
| | |
| | | |
| |
| |
| |
| |
|
| Special Purpose Acquisition Companies | |
$ | 292,435 | | |
Market Approach | |
Discount for lack of marketability | |
13.5% | |
23.0% | |
14.2% |
| | |
| | | |
| |
| |
| |
| |
|
| SAFE Contracts | |
$ | 6,429,315 | | |
Market Comparable Technique | |
Comparable Multiple | |
2.3x | |
6.3x | |
4.3x |
| | |
| | | |
Monte Carlo Analysis | |
Volatility | |
65% | |
70% | |
69% |
| | |
| | | |
Monte Carlo Analysis | |
Discount Rate | |
75% | |
80% | |
78% |
| | |
| | | |
Transaction Price | |
Transaction Price | |
N/A | |
N/A | |
N/A |
All Level 3 investments were valued at October 31, 2023 using unadjusted
prices provided by third-party valuation specialists.
C. Security Transactions and Revenue Recognition.
Investment transactions are recorded on a trade-date basis. Dividend income and expense are recorded on the ex-dividend date. Interest
income and expense are recorded on the accrual basis and include the amortization/accretion of premiums and discounts on fixed income
securities using the effective interest method. Dividend and interest income are recorded net of applicable withholding taxes. Realized
gains and losses from security transactions are computed on the basis of the identified cost of the securities sold or covered. Unrealized
gains and losses are recognized in net change in unrealized appreciation (depreciation) on securities and foreign currency translation
on the Consolidated Statement of Operations. Expenses are recorded on the accrual basis as incurred.
D. Foreign Currency Translation. Assets and liabilities,
including investments, denominated in currencies other than U.S. dollars are translated into U.S. dollars at the closing rates of exchange
on the following basis:
|
Saba Capital Income
& Opportunities Fund |
Notes to Consolidated Financial Statements |
| |
October 31, 2023 |
| (1) | Market value of investment securities, other assets and liabilities — at the exchange rates prevailing
at Market Close. |
| (2) | Purchases and sales of investment securities, income and expenses — at the rates of exchange prevailing
on the respective dates of such transactions. |
Net realized currency translation gains or losses
include the effects of currency movements between trade and settlement dates on investment transactions and the difference between amounts
actually received or paid upon settlement. The Fund does not isolate that portion of the results of operations arising from the changes
in foreign exchange rates from changes in market prices of investments held. Such fluctuations are included in either net realized gains
(losses) on securities and derivative transactions or net change in unrealized appreciation (depreciation) on securities and derivative
transactions in the Consolidated Statement of Operations. Foreign currency translation gains and losses on assets and liabilities (excluding
investments) are included in either net realized gains (losses) on securities transactions or net change in unrealized appreciation (depreciation)
on securities transactions.
E. Derivatives. In seeking to limit
the credit risk associated with transactions in the over-the-counter market (the “OTC”), the Fund conducts business only with
recognized financial institutions, the financial condition of which is monitored by the Investment Advisor.
In compliance with the 1940 Act, the Fund has entered
into third party custodial arrangements with all OTC counterparties whereby initial and variation margin is held in segregated accounts
at the U.S. custodial banks. Such amounts may only be accessed by the counterparties after certain Fund defaults (including bankruptcy)
or following any applicable remedies under the Fund’s International Swaps and Derivative Association (“ISDA”) Master
Agreements.
With cleared swaps, the central counterparty clearinghouses
(“CCPs” or “clearinghouses”), as counterparty to such instruments, guarantees against a possible default. The
clearinghouses stand between the buyer and the seller of the contract; therefore, credit risk is limited to failure of the clearinghouses.
While offset rights may exist under applicable law, the Fund does not have a contractual right of offset against a clearing broker or
clearinghouse in the event of a default (including the bankruptcy or insolvency). Additionally, credit risk exists in cleared swaps with
respect to initial and variation margin that is held in a clearing broker’s customer accounts. While clearing brokers are required
to segregate customer margin from their own assets, in the event that a clearing broker becomes insolvent or goes into bankruptcy and
at that time there is a shortfall in the aggregate amount of margin held by the clearing broker for all its clients, typically the shortfall
would be allocated on a pro rata basis across all the clearing broker’s customers, potentially resulting in losses to the Fund.
In addition, the Fund’s OTC derivative contracts
subject to ISDA Master Agreements which contain provisions that may require the Fund to comply with certain covenants (including minimum
NAV and performance based thresholds) and other provisions (occurrence of a credit event) that may call for early termination and settlement
of the derivative at its then fair value. At October 31, 2023, there are no derivative instruments subject to those covenants and provisions
that are in a net liability position. During the year ended October 31, 2023, the Fund did not trigger covenants related to minimum NAV
and performance based thresholds.
Option Contracts: An option contract
provides its owner the right, but not the obligation, to buy or sell specified amounts of a financial instrument, commodity, or currency,
at a contracted price during a specified period or a specified date.
Simple Agreement for Future Equity (“SAFE”)
Contracts: The Fund has entered into SAFEs with various companies. A SAFE is an agreement between the Fund and a company that
grants the Fund the right to certain shares of the company’s stock subject to certain negotiated terms unique to each contract.
The aggregate cost and fair value are included in the Consolidated Statement of Assets and Liabilities. Unrealized gains and losses are
included in the Consolidated Statement of Operations. During the year ended October 31, 2023, the average quarter-end fair value of SAFEs
was $5,501,303.
Forward Foreign Currency Contracts:
The Fund has entered into forward foreign currency contracts primarily to hedge against foreign currency exchange rate risks on its non-U.S.
dollar denominated investment securities. When entering into a currency forward foreign contract, the Fund agrees to receive or deliver
a fixed quantity of foreign currency for an agreed-upon price on an agreed future date. These contracts are valued daily and the Fund’s
net equity therein, representing unrealized gain or loss on the contracts as measured by the difference between the forward foreign exchange
rates at the dates of entry into the contracts and the forward rates at the reporting date, is included in the Consolidated Statement
of Assets and Liabilities. Realized and unrealized gains and losses are included in the Consolidated Statement of Operations. These instruments
involve market and/or credit risk in excess of the amount recognized in the Consolidated Statement of Assets and Liabilities. Risks arise
from the possible inability of counterparties to meet the terms of their contracts and from movement in currency and securities values
and interest rates. Open forward foreign currency contracts are presented within the respective Consolidated Schedule of Investments.
For the year ended October 31, 2023, the Fund had
an average quarterly contract amount on forward foreign currency contracts to buy and sell of $43,766,667 and $6,845,833, respectively.
| Annual Report | October 31, 2023 |
53 |
|
Saba Capital Income
& Opportunities Fund |
Notes to Consolidated Financial Statements |
| |
October 31, 2023 |
Futures Contracts: A futures contract
represents a commitment for the future purchase or sale of an asset or index at a specified price on a specified date. The purchase and
sale of futures requires margin deposits with a futures commission merchant (“FCM”) equal to a certain percentage of the contract
amount. Subsequent payments of variation margin are made or received by the Fund each day, depending on the daily fluctuations in the
value of the contract. Futures contracts mitigate the Fund’s exposure to counterparty risk since futures contracts are exchange-traded;
and the exchange’s FCM, as the counterparty to all exchange-traded futures, guarantees the futures contracts against default. The
Commodity Exchange Act requires an FCM to segregate all customer transactions and assets from the FCM’s proprietary activities.
A customer’s cash and other equity deposited with an FCM are considered commingled with all other customer funds subject to the
FCM’s segregation requirements. In the event of an FCM’s insolvency, recovery may be limited to the Fund’s pro-rata
share of segregated customer funds available. It is possible that the recovery amount could be less than the total of cash and other equity
deposited.
Credit Default Swaps: The Fund expects
to enter into various swap agreements including, but not limited to credit default swaps (“CDS”), as a part of its investment
strategy. Generally, a swap contract is an agreement that obligates two parties to exchange a series of cash flows at specified intervals
based on or calculated by reference to changes in specified prices or rates for a specified notional amount of the underlying assets.
The payment flows are usually netted against each other, with the difference paid by one party to the other.
The fair value of open swaps reported in the Consolidated
Statement of Assets and Liabilities may differ from that which would be realized if the Fund terminated its position in the contract.
Risks may arise as a result of the failure of the counterparty to the swap contract to comply with the terms of the swap contract. The
loss incurred by the failure of a counterparty is generally limited to the aggregate fair value of swap contracts in an unrealized gain
position and collateral posted with the counterparty. The risk is mitigated by having a master netting arrangement between the Fund and
the counterparty and by the counterparty posting collateral to the Fund to cover the Fund’s exposure to the counterparty. The Fund
considers the creditworthiness of each counterparty to a swap contract in evaluating potential credit risk. Additionally, risks may arise
from unanticipated movements in the fair value of the underlying investments.
Swap agreements may also be centrally cleared through
a clearing house (“cleared swaps”), where immediately following execution of the swap contract, the swap contract is novated
to the CCP and the Fund’s counterparty on the swap agreement becomes the CCP. The Fund is required to interface with the CCP through
the broker. Upon entering into a cleared swap, the Fund is required to deposit initial margin with the broker in the form of cash or securities
in an amount that varies depending on the size and risk profile of the particular swap. Pursuant to the contract, the Fund agrees to receive
from or pay to the broker. Cleared swaps mitigate the Fund’s exposure to counterparty risk since the CCP, as the counterparty to
all cleared swaps, guarantees the swap contracts against default.
CDS contracts involve an arrangement between the Fund
and a counterparty which allows the Fund to protect against losses (when the Fund purchases a CDS) incurred as a result of default by
a specified reference entity. Generally, the Fund pays or receives a premium upfront and continues to pay periodic interest payments while
the counterparty agrees to make a payment to compensate the Fund for losses upon the occurrence of a specified credit event. Alternatively,
when the Fund sells a CDS, it receives premium payments in exchange for assuming the credit risk of the specified reference entity. Generally,
the counterparty pays or receives a premium upfront and continues to pay periodic interest payments while the Fund agrees to make a payment
to compensate the counterparty for losses upon the occurrence of a specified credit event. Although contract-specific, credit events generally
include bankruptcy, failure to pay, and restructuring. Upon the occurrence of a defined credit event, the difference between the value
of the reference obligation and the swap’s notional amount is recorded as realized gain or loss in the Consolidated Statement of
Operations. When the contract is terminated prior to the occurrence of a credit event, the Fund records a realized gain or loss equal
to the difference between the close-out price of the CDS contract and the original contract price. Upfront fees are recorded as components
of the costs or proceeds to the CDS contract and amortized over the life of the contract on a straight line basis. During the year ended
October 31, 2023, the Fund had been both a purchaser and a seller of CDS contracts. For the year ended October 31, 2023, the average quarter-end
USD equivalent notional amount of credit default swaps - protection purchased and protection sold was $306,305,000 and $271,050,608, respectively.
Total Return Swaps: Total return swap
contracts involve the exchange by the Fund and a counterparty of their respective commitments to pay or receive a net amount based on
the change in the fair value of a particular security or index, specified interest rates for fixed rate payments, and the notional amount
of the swap contract. For the year ended October 31, 2023, the average quarterly USD equivalent notional amount of total return swaps
where the Fund was either long or short the underlying asset was $130,576,882 and $5,401,325, respectively.
Offsetting Assets and Liabilities and Counterparty
Risk: In connection with its derivative activities, the Fund generally enters into master netting agreements and collateral agreements
with its counterparties. These agreements provide the Fund with the right, in the event of a default by the counterparty (such as bankruptcy
or a failure to pay or perform), to net a counterparty’s rights and obligations under the agreement and to liquidate and setoff
collateral against any net amount owed by the counterparty. The Fund’s policy is generally to receive cash posted as collateral
(with rights of re-hypothecation), irrespective of the enforceability determination regarding the master netting and collateral agreement.
The following tables present information about the offsetting of OTC derivatives and related collateral amounts.
|
Saba Capital Income
& Opportunities Fund |
Notes to Consolidated Financial Statements |
| |
October 31, 2023 |
Offsetting of Derivative Assets as of October 31, 2023
| | |
| | |
Amounts not offset in the Consolidated Statement of Assets and Liabilities | | |
| |
| Counterparty | |
Gross Amounts of Recognized Assets | | |
Offsetting Liability(a) | | |
Collateral Received(b) | | |
Net Exposure | |
| Barclays Bank PLC | |
$ | 430,692 | | |
$ | (55,215 | ) | |
$ | - | | |
$ | 375,477 | |
| Goldman Sachs International | |
| 4,823,600 | | |
| (17,954 | ) | |
| (1,950,000 | ) | |
| 2,855,646 | |
| JPMorgan Chase Bank, N.A. | |
| 1,456,910 | | |
| (209,857 | ) | |
| - | | |
| 1,247,053 | |
| Morgan Stanley Capital Services | |
| 1,591,459 | | |
| - | | |
| (750,000 | ) | |
| 841,459 | |
| | |
$ | 8,302,661 | | |
$ | (283,026 | ) | |
$ | (2,700,000 | ) | |
$ | 5,319,635 | |
Offsetting of Derivative Liabilities as of October 31, 2023
| | |
| | |
Amounts not offset in the Consolidated Statement of Assets and Liabilities | | |
| |
| Counterparty | |
Gross Amounts of Recognized Liabilities | | |
Offsetting Asset(a) | | |
Collateral Pledged(b) | | |
Net Exposure | |
| Barclays Bank PLC | |
$ | (55,215 | ) | |
$ | 55,215 | | |
| - | | |
$ | - | |
| Goldman Sachs International | |
| (17,954 | ) | |
| 17,954 | | |
| - | | |
| - | |
| JPMorgan Chase Bank, N.A. | |
| (209,857 | ) | |
| 209,857 | | |
| - | | |
| - | |
| Morgan Stanley & Company | |
| (2,630,644 | ) | |
| - | | |
| 2,630,644 | | |
| - | |
| | |
$ | (2,913,670 | ) | |
$ | 283,026 | | |
$ | 2,630,644 | | |
$ | - | |
| (a) | Represents the amount of assets or liabilities that could be offset with
the same counterparty under master netting or similar agreements that management elects not to offset on the Consolidated Statement of
Assets and Liabilities. |
| (b) | Collateral pledged/received is limited to the net outstanding amount
due to/from an individual counterparty. The actual collateral amounts pledged/received may exceed these amounts and may fluctuate in value. |
The following table, grouped by risk exposure, provides information about
the fair value and location of derivatives within the Consolidated Statement of Assets and Liabilities as of October 31, 2023.
| Risk Exposure | |
Consolidated Statement of Assets and Liabilities Location | |
Asset Derivatives Gross Unrealized Appreciation | | |
Liability Derivatives Gross Unrealized Depreciation | |
| Credit Risk | |
| |
| | | |
| | |
| Credit Default Swaps | |
Credit default swaps, at fair value | |
$ | 7,663,230 | | |
$ | 410,376 | |
| Equity/Market Risk | |
| |
| | | |
| | |
| Simple Agreement for Future Equity Contracts | |
Unrealized appreciation/depreciation on simple agreement for future equity contracts | |
| 6,429,315 | | |
| - | |
| Futures Contracts | |
Unrealized appreciation/depreciation on futures contracts | |
| 1,047,144 | | |
| 17,954 | |
| Total Return Swaps | |
Unrealized appreciation/depreciation on total return swap contracts | |
| 1,208,552 | | |
| 131,170 | |
| | |
| |
| | | |
| | |
| Foreign Exchange Risk | |
| |
| | | |
| | |
| Foreign Currency Contracts | |
Unrealized appreciation/depreciation on forward foreign currency contracts | |
| 60,867 | | |
| 78,687 | |
| | |
| |
| | | |
| | |
| Interest Rate Risk | |
| |
| | | |
| | |
| TBA MBS Forward Contracts | |
Unrealized appreciation/depreciation on TBA MBS forward contracts | |
| - | | |
| 2,630,644 | |
| Total | |
| |
$ | 16,409,108 | | |
$ | 3,268,831 | |
| Annual Report | October 31, 2023 |
55 |
|
Saba Capital Income
& Opportunities Fund |
Notes to Consolidated Financial Statements |
| |
October 31, 2023 |
The following table provides information about the effect of derivatives
on the Fund’s Consolidated Statement of Operations for the year ended October 31, 2023.
| Risk Exposure | |
Consolidated Statement of Operations Location | |
Net Realized Gain/(Loss) | | |
Net Change in Unrealized Appreciation/ (Depreciation) | |
| Credit Risk | |
| |
| | | |
| | |
| Credit Default Swaps | |
Net realized gain/(loss) on credit default swaps/ Net change in unrealized appreciation/(depreciation) on credit default swaps | |
$ | 16,449,190 | | |
$ | (4,390,662 | ) |
| Equity/Market Risk | |
| |
| | | |
| | |
| Simple Agreement for Future Equity Contracts | |
Net realized gain/(loss) on simple agreement for future equity contracts/ Net change in unrealized appreciation/(depreciation) on simple agreement for future equity contracts | |
| - | | |
| 429,315 | |
| Futures Contracts | |
Net realized gain/(loss) on futures contracts/ Net change in unrealized appreciation/(depreciation) on futures contracts | |
| (9,058,790 | ) | |
| 1,029,190 | |
| Total Return Swaps | |
Net realized gain/(loss) on total return swaps/ Net change in unrealized appreciation/(depreciation) on total return swaps | |
| (15,778,655 | ) | |
| 1,101,105 | |
| Foreign Exchange Risk | |
| |
| | | |
| | |
| Foreign Currency Contracts | |
Net realized gain/(loss) on forward foreign currency contracts/Net change in unrealized appreciation/(deprecation) on forward foreign currency contracts | |
| (117,085 | ) | |
| (296,112 | ) |
| Interest Rate Risk | |
| |
| | | |
| | |
| TBA MBS Forward Contracts | |
Net realized gain/(loss) on TBA MBS forward contracts/Net change in unrealized appreciation/(deprecation) on TBA MBS forward contracts | |
| (15,696,857 | ) | |
| (2,630,644 | ) |
| Total | |
| |
$ | (24,202,197 | ) | |
$ | (4,757,808 | ) |
F. Financial Instruments. Financial
instruments, at fair value include contingent forward purchase contracts. Such financial instruments represent future commitments to purchase
certain securities to be issued, generally by SPACs or their target companies, at specified terms subject to certain contingencies. These
contingencies allow the Fund and/or counterparties not to settle such contracts if those contingencies do not occur. Contingent forward
purchase contracts may be illiquid and are reflected on the Consolidated Statement of Assets and Liabilities at fair value. The net change
in unrealized gains and losses on contingent forward purchase contracts is reflected in net change in unrealized gain/(loss) on financial
instruments on the Consolidated Statement of Operations. At October 31, 2023, the Fund did not hold any contingent forward purchase contracts.
G. Federal Income Taxes. It is the policy
of the Fund to comply with the requirements of subchapter M of the Internal Revenue Code that are applicable to regulated investment companies
and to distribute substantially all of its net investment income and any net realized capital gains to its shareholders. Therefore, a
federal income tax or excise tax provision is not required. Management has considered the sustainability of the Fund’s tax positions
taken on federal income tax returns for all open tax periods in making this determination. No capital gain distributions shall be made
until the capital loss carryforwards have been fully utilized.
The Fund may utilize equalization accounting for tax
purposes, whereby a portion of redemption payments are treated as distributions of income or gain.
H. Distributions to Common Shareholders.
The Fund made monthly distributions to shareholders at an initial annual minimum fixed rate of 12.00%, based on the average monthly net
asset value of the Fund’s common shares for the period through June 30, 2023. The Fund calculated the average net asset value from
the previous month based on the number of Business Days in that month on which the net asset value was calculated. The distribution was
calculated as 12.00% of the previous month’s average net asset value, divided by twelve.
|
Saba Capital Income
& Opportunities Fund |
Notes to Consolidated Financial Statements |
| |
October 31, 2023 |
Beginning with the distributions for which the declaration
date was June 30, 2023, the Fund calculated the average net asset value of the month of June 2023 and was based on the number of Business
Days in June 2023. The distributions were calculated as 12.00% of the average net asset value of June 2023, divided by twelve.
The Fund will generally distribute amounts necessary
to satisfy the Fund’s plan and the requirements prescribed by excise tax rules and Subchapter M of the Internal Revenue Code. The
plan is intended to provide shareholders with a constant, but not guaranteed, fixed minimum rate of distribution each month and is intended
to narrow the discount between the market price and the net asset value of the Fund’s common shares, but there is no assurance that
the plan will be successful in doing so.
Under the managed distribution plan, to the extent
that sufficient investment income is not available on a monthly basis, the Fund will distribute capital gains and/or return of capital
in order to maintain its managed distribution rate. No conclusions should be drawn about the Fund’s investment performance from
the amount of the Fund’s distributions or from the terms of the Fund’s managed distribution plan. The Board may amend the
terms of the plan or terminate the plan at any time. The amendment or termination of the plan could have an adverse effect on the market
price of the Fund’s common shares. The plan will be subject to the periodic review by the Board, including a yearly review of the
annual minimum fixed rate to determine if an adjustment should be made.
I. Dividend Reinvestments. The Fund
maintains a Shareholder Reinvestment Program (the “Program”) that allows participating shareholders to reinvest all dividends
(“Dividends”) in additional Common Shares of the Fund. Pursuant to the Program, ALPS Fund Services, Inc. (“ALPS”),
the Program administrator, purchases, from time to time, Common Shares on the open market to satisfy Dividend reinvestments. Such Common
Shares are purchased on the open market only when the closing sale or bid price plus commission is less than the NAV per share of the
Fund’s Common Shares on the valuation date. If the market price plus commissions is equal to or exceeds NAV, new Common Shares are
issued by the Fund at the greater of (i) NAV or (ii) the market price of the Common Shares during the pricing period, minus a discount
of 5%. Common Shares issued by the Fund under the Program will be issued without a fee or a commission.
Shareholders may elect to participate in the Program
by submitting a completed participation form to ALPS, the Program administrator. The Program administrator will credit to each participant’s
account funds it receives from Dividends paid on Common Shares of the Fund registered in the participant’s name. Shareholders may
elect to close their account at any time by giving the Transfer Agent written notice. When a participant closes their account, the participant,
upon request, will receive a certificate for full Common Shares in the account. Fractional Common Shares will be held and aggregated with
other fractional Common Shares being liquidated by the Transfer Agent as agent of the Program and paid for by check when actually sold.
Participants will pay a pro rata share of brokerage
commissions with respect to the Program administrator’s open market purchases in connection with the reinvestment of Dividends.
The automatic reinvestment of Dividends does not affect
the tax characterization of the Dividends (i.e., capital gain distributions and income distributions are realized and subject to tax even
though cash is not received). A shareholder whose Dividends are reinvested in Common Shares under the Program will be treated as having
received a Dividend equal to either (i) if Common Shares are issued under the Program directly by the Trust, generally the fair market
value of the Common Shares issued to the shareholder or (ii) if reinvestment is made through open market purchases, the amount of cash
allocated to the shareholder for the purchase of Common Shares on its behalf in the open market.
Additional information about the Program may be obtained
by contacting the Program administrator at 844-460-9411 or BRWSabaCapital@dstsystems.com.
J. Share Offerings. The Fund issues
shares under various shelf registration statements, whereby the net proceeds received by the Fund from share sales may not be less than
the greater of (i) the NAV per share or (ii) 94% of the average daily market price over the relevant pricing period.
K. Indemnifications. In the normal course
of business, the Fund may enter into contracts that provide certain indemnifications. The Fund’s maximum exposure under these arrangements
is dependent on future claims that may be made against the Fund and, therefore, cannot be estimated; however, based on experience, management
considers the risk of loss from such claims remote.
L. Basis of Consolidation. The Fund
invests in certain investments through its investment in BRW SPV I. The BRW SPV I is a Cayman Islands Exempted Company with Limited Liability
and is a wholly-owned subsidiary of the Fund. The accompanying consolidated financial statements include all assets, liabilities, and
results of operations of the Fund and its wholly owned subsidiary. All material intercompany accounts and transactions have been eliminated
upon consolidation. For tax purposes, the Fund is required to increase its net taxable income by its share of the BRW SPV I’s income.
Net taxable losses incurred by the BRW SPV I cannot offset income earned by the Fund and cannot be carried back or forward by the BRW
SPV I to offset income from prior or future years.
| Annual Report | October 31, 2023 |
57 |
|
Saba Capital Income
& Opportunities Fund |
Notes to Consolidated Financial Statements |
| |
October 31, 2023 |
NOTE 3 — INVESTMENTS
For the year ended October 31, 2023, the cost of purchases
and the proceeds from principal repayment and sales of investments, excluding short-term notes, totaled $2,012,627,913 and $2,299,691,986,
respectively. The fair value of these assets is established as set forth in Note 2.
At October 31, 2023, the Fund held senior loans valued
at $35,310,585 representing 9.98% of its total net assets. The senior loans acquired by the Fund typically take the form of a direct lending
relationship with the borrower, and are typically acquired through an assignment of another lender’s interest in a loan. The lead
lender in a typical corporate loan syndicate administers the loan and monitors the collateral securing the loan. In the event that the
lead lender becomes insolvent, enters Federal Deposit Insurance Corporation (“FDIC”) receivership or, if not FDIC insured,
enters into bankruptcy, the Fund may incur certain costs and delays in realizing payment, or may suffer a loss of principal and/or interest.
At October 31, 2023, the Fund held corporate bonds
and sovereign debt obligations valued at $36,729,136 and $10,047,748, respectively, which represent 10.38% and 2.84% of its total net
assets. Changes in short-term market interest rates will directly affect the yield on variable rate notes. If short-term market interest
rates fall, the yield on variable rate notes will also fall. To the extent that the interest rate spreads on loans in the Fund’s
portfolio experience a general decline, the yield on the Common Shares will fall and the value of the Fund’s assets may decrease,
which will cause the Fund’s NAV to decrease. Conversely, when short-term market interest rates rise, because of the lag between
changes in such short-term rates and the resetting of the floating rates on assets in the Fund’s portfolio, the impact of rising
rates will be delayed to the extent of such lag. In the case of inverse securities, the interest rate paid by such securities generally
will decrease when the market rate of interest to which the inverse security is indexed increases. With respect to investments in fixed
rate instruments, a rise in market interest rates generally causes values of such instruments to fall. The values of fixed rate instruments
with longer maturities or duration are more sensitive to changes in market interest rates.
Certain common and preferred stock, and stock purchase
warrants held in the portfolio were acquired in conjunction with loans held by the Fund. Certain stocks and warrants are restricted and
may not be publicly sold without registration under the 1933 Act, or without an exemption under the 1933 Act. In some cases, these restrictions
expire after a designated period of time after issuance of the shares or warrants.
At October 31, 2023, the Fund held SPACs valued at
$16,632,048 representing 4.70% of its total net assets. A SPAC is a publicly traded company formed for the purpose of raising capital
through an initial public offering to fund the acquisition, through a merger, capital stock exchange, asset acquisition or other similar
business combination, of one or more operating businesses that are typically not publicly-listed. Following the acquisition of a target
company, a SPAC’s management team may exercise control over the management of the combined company in an effort to increase its
value. Often now, though, management of the target company will continue to manage the now publicly-traded business subsequent to completion
of its business combination with the SPAC. Capital raised through the initial public offering of securities of a SPAC is typically placed
into a trust account until acquired business combination is completed or a predetermined period of time (typically 24 months) elapses.
Shareholders in a SPAC would receive a return on their investment in the event that a target company is acquired and the combined publicly-traded
company’s shares trade above the SPAC’s initial public offering (“IPO”) price, or alternatively, the market price
at which an investor acquired a SPAC’s shares subsequent to its IPO. In the event that a SPAC is unable to locate and acquire a
target business by the timeframe established at the time of its IPO, the SPAC would be forced to liquidate its assets, which may result
in losses due to the expenses and liabilities of the SPAC, to the extent third-parties are permitted to bring claims against IPO proceeds
held in the SPAC’s trust account.
At October 31, 2023, the Fund held Closed End Mutual
Funds (Globally) valued at $80,416,011 representing 22.72% of its total net assets. A closed-end fund (“CEF”) or closed-ended
fund is a collective investment issuing a fixed number of shares which are not redeemable from the fund. Shares can be purchased and sold
in the market and are subject to market fluctuations.
At October 31, 2023, the Fund held an investment in
an unaffiliated private fund, Stone Ridge Opportunities Fund Feeder LP (“Stone Ridge Feeder Fund”), valued at $37,398,584,
representing 10.57% of its net assets. The Stone Ridge Feeder Fund is a Cayman Islands exempted limited partnership which invests substantially
all of its investable assets in Stone Ridge Reinsurance Opportunities Fund LP (“Stone Ridge Master Fund”). Stone Ridge Master
Fund’s investment objective is to achieve long-term capital appreciation by investing primarily in shares or notes issued in connection
with quota shares and, to a lesser extent, other reinsurance related securities, including shares or notes issued in connection with excess-of-loss,
stop-loss or other non-proportional reinsurance shares or notes issued in connection with industry loss warranties, event-linked or catastrophe
bond, event-linked swaps and/or derivatives linked to any of the foregoing (collectively, “reinsurance-related securities”).
At October 31, 2023, the Fund does not have any outstanding capital commitments to the Stone Ridge Feeder Fund. The Fund may only make
withdrawals from the Stone Ridge Feeder Fund on an annual basis at December 31, subject to notice by October 15 of the year immediately
prior to the year in which the withdrawal request date occurs.
At October 31, 2023, the Fund held warrants valued
at $478,695 representing 0.14% of its net assets. The Fund may purchase warrants issued by domestic and foreign companies to purchase
newly created equity securities consisting of common and preferred stock. Warrants are securities that give the holder the right, but
not the obligation, to purchase equity issues of the company issuing the warrants, or a related company, at a fixed price either on a
certain date or during a set period. The equity security underlying a warrant is authorized at the time the warrant is issued or is issued
together with the warrant. Investing in warrants can provide a greater potential for profit or loss than an equivalent investment in the
underlying security and, thus, can be a speculative investment. At the time of issue, the cost of a warrant is substantially less than
the cost of the underlying security itself, and price movements in the underlying security are generally magnified in the price movements
of the warrant. The leveraging effect enables the investor to gain exposure to the underlying security with a relatively low capital investment.
This leveraging increases an investor’s risk, as a complete loss of the amount invested in the warrant may result in the event of
a decline in the value of the underlying security. In addition, the price of a warrant tends to be more volatile than, and may not correlate
exactly to, the price of the underlying security. If the market price of the underlying security is below the exercise price of the warrant
on its expiration date, the warrant will generally expire without value. The value of a warrant may decline because of a decline in the
value of the underlying security, the passage of time, changes in interest rates or in the dividend or other policies of the company whose
equity underlies the warrant, a change in the perception as to the future price of the underlying security, or any combination thereof.
Warrants generally pay no dividends and confer no voting or other rights other than to purchase the underlying security.
|
Saba Capital Income
& Opportunities Fund |
Notes to Consolidated Financial Statements |
| |
October 31, 2023 |
NOTE 4 — INVESTMENT MANAGEMENT FEES
The Fund has entered into an investment management
agreement (“Management Agreement”) with the Investment Adviser. The Investment Adviser has overall responsibility for the
management of the Fund. The Investment Adviser oversees all investment advisory and portfolio management services for the Fund and assists
in managing and supervising all aspects of the general day-to-day business activities and operations of the Fund, including custodial,
transfer agency, dividend disbursing, accounting, auditing, compliance and related services. This Management Agreement compensates the
Investment Adviser with a fee, computed daily and payable monthly, at an annual rate of 1.05% of the Fund’s managed assets. For
purposes of the Management Agreement, managed assets (“Managed Assets”) are defined as the Fund’s average daily gross
asset value, minus the sum of the Fund’s accrued and unpaid dividends on any outstanding Preferred Shares and accrued liabilities
(other than liabilities for the principal amount of any borrowings incurred, commercial paper or notes issued by the Fund and the liquidation
preference of any outstanding Preferred Shares).
NOTE 5 — EXPENSE LIMITATION AGREEMENT
The Investment Adviser has agreed to limit expenses,
excluding interest, taxes, investor relations services, other investment-related costs, leverage expenses, extraordinary expenses, other
expenses not incurred in the ordinary course of such Fund’s business, and expenses of any counsel or other persons or services retained
by such Fund’s trustees who are not interested persons, to 1.05% of Managed Assets plus 0.15% of average daily net assets for the
period through June 30, 2023, and to 1.05% of Managed Assets plus 0.30% of average daily net assets subsequently from July 1, 2023 onwards.
For the year ended October 31, 2023, $597,873 of fees were waived and reimbursed.
The Investment Adviser may at a later date recoup
from the Fund for fees waived and/or other expenses reimbursed by the Investment Adviser during the previous 36 months, but only if, after
such recoupment, the Fund’s expense ratio does not exceed the percentage described above. For the year ended October 31, 2023, $146,975
of fees waived were recouped.
Waived and reimbursed fees net of any recoupment by
the Investment Adviser of such waived and reimbursed fees are reflected on the accompanying Consolidated Statement of Operations totaling
$450,898. Amounts payable by the Investment Adviser are reflected on the accompanying Consolidated Statement of Assets and Liabilities.
As of October 31, 2023, the amount of waived and/or
reimbursed fees that are subject to recoupment by the Investment Adviser and the related expiration dates are as follows:
| October 31, 2023 | | |
October 31, 2024 | | |
October 31, 2025 | | |
October 31, 2026 | | |
Total | |
| $ | – | | |
$ | 337,052 | | |
$ | 1,374,896 | | |
$ | 597,873 | | |
$ | 2,309,821 | |
The expense limitation agreement is contractual through
July 1, 2024 and shall renew automatically for one-year terms. Termination or modification of this obligation requires approval by the
Board.
NOTE 6 — TRANSACTIONS WITH AFFILIATES AND OTHER PARTIES
At October 31, 2023, entities advised by Saba Capital Management, L.P.
owned approximately 5.46% of the Fund.
| Annual Report | October 31, 2023 |
59 |
|
Saba Capital Income
& Opportunities Fund |
Notes to Consolidated Financial Statements |
| |
October 31, 2023 |
NOTE 7 — GUARANTEES AND COMMITMENTS
Effective July 20, 2021, the Fund has entered into
a revolving credit agreement, collateralized by assets of the Fund. As of October 31,2023, the credit agreement, as subsequently amended,
enables the Fund to borrow up to $200,000,000 and has a final maturity date of November 22, 2023. Borrowing rates under this agreement
are based on a fixed spread over the Federal Funds Effective Rate, and a commitment fee is charged on the unused portion. The amount of
borrowings outstanding at October 31, 2023, was $52,900,000. The weighted average interest rate on outstanding borrowings at October 31,
2023 was 6.13%, excluding fees related to the unused portion of the facilities, and other fees. The amount of borrowings represented 8.13%
of total assets at October 31, 2023. Average borrowings for the year ended October 31, 2023 were $88,960,822 and the average annualized
interest rate was 5.38% excluding other fees related to the unused portion of the facility, and other fees.
In the normal course of trading activities, the Fund
trades and holds certain derivatives which constitute guarantees under ASC 460-10, “Guarantees”. Such contracts include
credit default swaps (index and single name) where the Fund is a provider of credit protection on an underlying instrument The maximum
payouts for such credit default swaps (index and single name) is limited to the notional amounts of each contract and would be offset
by recovery amounts on the underlying reference obligations or if the Fund holds offsetting contracts for the same underlying reference
obligations.
As a part of the Fund’s investment strategy,
the Fund is both a provider and purchaser of credit protection of multiple reference obligations. During periods of market stress, credit
protection that has been purchased may act as a hedge for credit protection that has been provided on different reference obligations.
Similarly, as a part of the Fund’s investment strategy, the Fund may be a provider of credit protection and be short the underlying
reference obligation, which also may reduce the Fund’s exposure. The below table summarizes those CDS for which the Fund is providing
protection and where offsetting contracts on the same reference obligation are held by the Fund at October 31, 2023.
| | |
Notional Amount by Period of Expiration | | |
Notional Amount | | |
Fair Value | |
| Credit Spread on Derivatives (basis points) | |
0-5 Years | | |
5 Years or Greater | | |
Total Written Credit Derivatives | | |
Written Credit Derivatives | |
| Single name credit default swaps | |
| | | |
| | | |
| | | |
| | |
| 0-500 | |
$ | 196,198,000 | | |
$ | 21,159,000 | | |
$ | 217,357,000 | | |
$ | 4,810,470 | |
| Total | |
$ | 196,198,000 | | |
$ | 21,159,000 | | |
$ | 217,357,000 | | |
$ | 4,810,470 | |
NOTE 8 — CAPITAL SHARES
As of October 31, 2023, there were 42,529,493 shares issued and outstanding.
Transactions in capital shares and dollars were as follows:
| Year or |
Shares repurchased |
Shares repurchased in tender offer |
Net increase (decrease) in shares outstanding |
Shares repurchased |
Shares repurchased in tender offer |
Net increase (decrease) |
| period ended |
# |
# |
# |
($) |
($) |
($) |
| 10/31/2023 |
– |
– |
– |
– |
– |
– |
| 10/31/2022 |
– |
– |
– |
– |
– |
– |
| 10/31/2021 |
(164,609) |
(18,226,686) |
(18,391,295) |
(1,536,542) |
(176,835,308) |
(178,371,850) |
Effective May 20, 2022, the Fund completed a reverse
stock split (the “Reverse Split”) of the Fund’s common shares at a ratio of 1-for-2. The Reverse Split reduced the number
of the Fund’s authorized common shares from 85,058,986 shares to 42,529,493 shares.
NOTE 9 — FEDERAL INCOME TAXES
The amount of distributions from net investment income
and net realized capital gains are determined in accordance with federal income tax regulations, which may differ from GAAP for investment
companies. These book/tax differences may be either temporary or permanent. Permanent differences are reclassified within the capital
accounts based on their federal tax-basis treatment; temporary differences are not reclassified. Key differences include the treatment
of foreign currency transactions, capital loss carryforwards, and wash sale deferrals. Distributions in excess of net investment income
and/or net realized capital gains for tax purposes are reported as return of capital.
|
Saba Capital Income
& Opportunities Fund |
Notes to Consolidated Financial Statements |
| |
October 31, 2023 |
Dividends paid by the Fund from net investment income
and distributions of net realized short-term capital gains are, for federal income tax purposes, taxable as ordinary income to shareholders.
The tax character of the distributions paid during the years ended October
31, 2023 and October 31, 2022 were as follows:
| | |
October 31, 2023 | | |
October 31, 2022 | |
| Distributions Paid From: | |
| | | |
| | |
| Ordinary Income | |
$ | 8,594,037 | | |
$ | 13,029,565 | |
| Net Long-Term Capital Gain | |
| – | | |
| – | |
| Return of Capital | |
| 35,594,107 | | |
| 31,967,059 | |
| Total Distributions Paid | |
$ | 44,188,144 | | |
$ | 44,996,624 | |
Components of Distributable Earnings on a Tax Basis:
At October 31, 2023, permanent differences in book and tax accounting were reclassified. These differences had no effect on net assets
and were primarily attributed to differences in the treatment of a wholly owned controlled foreign corporation.
| Fund | |
Increase/(Decrease) Paid-in capital | | |
Increase/(Decrease) Total Distributable Earnings | |
| Saba Capital Income & Opportunities Fund | |
$ | 8,966,377 | | |
$ | (8,966,377 | ) |
As of the year ended October 31, 2023, the components of distributable
earnings (loss) on a tax basis were as follows:
| | |
Saba Capital Income & Opportunities Fund | |
| (Over)/Undistributed Ordinary Income | |
$ | – | |
| Accumulated Capital Gains/(Losses) | |
| (140,775,258 | ) |
| Unrealized Appreciation/Depreciation | |
| (19,993,878 | ) |
| Other Cumulative Effect of Timing Differences | |
| (11,747,675 | ) |
| Total | |
$ | (172,516,811 | ) |
At October 31, 2023, gross unrealized appreciation
and depreciation of investments owned by the Fund, based on cost of investments for federal income tax purposes were as follows:
| | |
Saba Capital Income & Opportunities Fund | |
| Cost of investments for income tax purposes | |
| 322,628,536 | |
| Gross appreciation (excess of value over tax cost) | |
| 505,479,579 | |
| Gross depreciation (excess of tax cost over value) | |
| (524,883,365 | ) |
| Net depreciation of foreign currency and derivatives | |
| (590,092 | ) |
| Net unrealized depreciation | |
$ | (19,993,878 | ) |
The differences between cost amounts for financial
statement and federal income tax purposes is due primarily to timing differences in recognizing certain gains and losses in security transactions.
| Annual Report | October 31, 2023 |
61 |
|
Saba Capital Income
& Opportunities Fund |
Notes to Consolidated Financial Statements |
| |
October 31, 2023 |
As of the year ended October 31, 2023, the Fund had non-expiring accumulated
capital loss carryforwards as follows:
To the extent that a fund may realize future net capital
gains, those gains will be offset by any of its unused capital loss carryforward. Future capital loss carryover utilization in any given
year may be subject to Internal Revenue Code limitations.
| Fund | |
Short Term | | |
Long Term | | |
Total | |
| Saba Capital Income & Opportunities Fund | |
$ | 616,812 | | |
$ | 140,158,446 | | |
| 140,775,258 | |
Capital loss carryovers used during the year ended October 31, 2023, were
$21,911,226.
The Fund’s major tax jurisdictions are U.S. federal and New York
State.
As of October 31, 2023, no provision for income tax
is required in the Fund’s consolidated financial statements as a result of tax positions taken on federal and state income tax returns
for open tax years. The Fund’s federal and state income and federal excise tax returns for tax years for which the applicable statutes
of limitations have not expired are subject to examination by the Internal Revenue Service and state department of revenue. Generally,
the preceding four tax years remain subject to examination by these jurisdictions.
NOTE 10 — SUBSEQUENT EVENTS
Subsequent to October 31, 2023 and through the date
of issuance of the Fund’s consolidated financial statements, the Fund paid the following dividends:
| Per Share Amount |
Declaration Date |
Record Date |
Payable Date |
| $0.085 |
10/31/2023 |
11/09/2023 |
11/30/2023 |
| $0.085 |
11/30/2023 |
12/11/2023 |
12/29/2023 |
Beginning with the distributions for which the declaration
date is December 29, 2023, the Fund will make monthly distributions to shareholders at a fixed amount of $0.085 per share.
The Fund will generally distribute amounts necessary
to satisfy the Fund’s plan and the requirements prescribed by excise tax rules and Subchapter M of the Internal Revenue Code. The
plan is intended to provide shareholders with a constant, but not guaranteed, fixed minimum rate of distribution each month and is intended
to narrow the discount between the market price and the net asset value of the Fund’s common shares, but there is no assurance that
the plan will be successful in doing so.
Under the managed distribution plan, to the extent
that sufficient investment income is not available on a monthly basis, the Fund will distribute capital gains and/or return of capital
in order to maintain its managed distribution rate. No conclusions should be drawn about the Fund’s investment performance from
the amount of the Fund’s distributions or from the terms of the Fund’s managed distribution plan. The Board may amend the
terms of the plan or terminate the plan at any time without prior notice to Fund shareholders; however, at this time there are no reasonably
foreseeable circumstances that might cause the termination of the plan. The amendment or termination of the plan could have an adverse
effect on the market price of the Fund’s common shares. The plan will be subject to the periodic review by the Board, including
a yearly review of the annual minimum fixed rate to determine if an adjustment should be made.
On November 21,2023, the Fund amended its revolving
credit agreement to change the final maturity date to December 21, 2023. On December 21, 2023, the Fund further amended its revolving
credit agreement to change the final maturity date to January 22, 2024.
| Saba Capital Income & Opportunities Fund |
Additional Information |
| |
October 31, 2023 |
PROXY VOTING INFORMATION
The Board has delegated the responsibility to vote
proxies for securities held in the Fund’s portfolio to the Investment Manager. Proxies for the portfolio securities are voted in
accordance with the Investment Manager’s proxy voting policies and procedures. To the extent the Fund invests in investment companies,
it will generally (i) seek instruction from the Fund’s shareholders and vote in accordance with such instructions, (ii) vote the
shares held by the Fund in the same proportion as the vote of all other holders of the securities of the investment company or (iii) elect
to not submit a proxy vote. Information regarding how the Fund voted proxies relating to its portfolio securities during the most recent
12-month period ended October 31 is available without charge on the Fund’s website at www.sabacef.com and (2) on the SEC’s
website at www.sec.gov.
QUARTERLY PORTFOLIO HOLDINGS
The Fund files its complete schedule of portfolio
holdings with the SEC for the first and third quarters of each fiscal year on Form NPORT-P. The Fund’s Forms NPORT-P are available
on the SEC’s website at www.sec.gov. The Fund’s complete schedule of portfolio holdings is available at www.sabacef.com
TAX INFORMATION (UNAUDITED)
Of the distributions paid by the Fund from ordinary
income for the calendar year ended December 31, 2022, the following percentages met the requirements to be treated as qualifying for the
corporate dividends received deduction and qualified dividend income:
| Fund |
Dividend Received Deduction |
Qualified Dividend Income |
| Saba Capital Income & Opportunities Fund |
0.71% |
6.21% |
| Annual Report | October 31, 2023 |
63 |
| Saba Capital Income & Opportunities Fund (Unaudited) |
Trustees and Officers |
| |
October 31, 2023 |
INDEPENDENT TRUSTEES
|
Name, Address1
and Date of Birth |
Position(s) Held with the Fund |
Term of Office and Length of Time Served1 |
Principal Occupation(s) During the Past 5 Years |
Number of Funds in the Fund Complex Overseen by Trustees2 |
Other Board Positions Held by Trustees |
| Independent Nominees |
|
|
|
|
|
Thomas Bumbolow
DOB: 05/17/1976 |
Trustee |
Since January 2021 |
Mr. Bumbolow currently serves as the head of business development at Midwest Holding (MWDT), an insurance company which blends innovative reinsurance capabilities with an elite asset management business. Mr. Bumbolow also serves as advisor to Capital2markets, a tech-based broker/dealer, Limitless Ventures, a venture impact capital fund, and Vchromatix, a private technology company. Mr. Bumbolow is the co-Founder of protoCapital, a merchant bank that operated from 2017-2020. Mr. Bumbolow has 20 years of experience at JPMorgan Chase, where he held various roles in fixed-income sales and trading from 1997-2017. He has been a board member of Stepping Stones Museum for Children since 2018. |
1 |
Stepping Stones Museum |
|
Karen Caldwell
DOB: 01/22/1959 |
Trustee |
Since July 2020 |
Karen Caldwell has served as the Chief Financial Officer of Reform Alliance since 2019. Previously, Ms. Caldwell served as the Chief Financial Officer and Treasurer of the NHP Foundation, a non for profit dedicated to increasing housing affordability, from 2018 to 2019. From 2016 to 2018, Ms. Caldwell served as the Chief Financial Officer and Executive Vice President of the New York City Housing Authority. Prior to such position, she served as the president of Hanseatic Management Services, Inc., an asset management company, from 2015 to 2016. She has been a board member of Templeton Global Income Fund since February 2023. |
1 |
Templeton Global Income Fund |
|
Ketu Desai
DOB: 07/02/1982 |
Trustee |
Since July 2020 |
Ketu Desai has served as the founding partner and Principal of i-squared Wealth Management, Inc., a private wealth investment management firm, since 2016. He has been a board member of Templeton Global Income Fund since February 2023. |
1 |
Templeton Global Income Fund |
|
Kieran Goodwin
DOB: 07/30/1969 |
Trustee |
Since July 2020 |
Kieran Goodwin is the founder of Hidden Truth, a mobile application game. Previously, he served as the co-founder and Portfolio Manager of Panning Capital Management, LLC, a hedge fund with $2.5 billion AUM at its peak, from 2012 to 2019. |
1 |
None |
| 1 | The mailing address for each Independent Trustee is 405 Lexington Avenue, 58th
Floor, New York, NY 10174. |
| Saba Capital Income & Opportunities Fund (Unaudited) |
Trustees and Officers |
| |
October 31, 2023 |
INTERESTED TRUSTEES
|
Name, Address1
and Date of Birth |
Position(s) Held with the Fund |
Term of Office and Length of Time Served1 |
Principal Occupation(s) During the Past 5 Years |
Number of Funds in the Fund Complex Overseen by Trustees2 |
Other Board Positions Held by Trustees |
| Nominee who is an “Interested Person”3 |
|
|
|
|
Aditya Bindal
DOB: 03/10/1976 |
Trustee |
Since July 2020 |
Aditya Bindal has served as Chief Risk Officer of Saba Capital Management, L.P. since 2018, prior to which he served as Chief Risk Officer at Water Island Capital (“Water Island”), an event-driven investment firm with over $2.5 billion in AUM, from 2015 to 2018. He has been a board member of Templeton Global Income Fund since 2021. |
1 |
Templeton Global Income Fund |
Andrew Kellerman
DOB: 09/22/1965 |
Trustee |
Since July 2020 |
Andrew Kellerman has served as Partner, President and Head of Business Development of Saba Capital Management, L.P. since 2018. Prior to joining Saba, Mr. Kellerman served as a Managing Director and Head of Distribution for the Private Institutional Client group within Alex. Brown & Sons where he was responsible for placement of boutique funds and private direct investments from 2017 to 2018. Prior to Alex. Brown, Mr. Kellerman served as a Managing Partner of Measure 8 Venture Partners, a diversified private capital fund focused on opportunities in emerging industries, from January 2017 to November 2017. Previously, Mr. Kellerman served as a Managing Director and Head of Business Development with Vertical Knowledge supplying open source data and analytics for the defense, financial services, and commercial markets from 2014-2016. |
1 |
None |
| 1 | The mailing address for each Interested Trustee is 405 Lexington Avenue, 58th
Floor, New York, NY 10174. |
OFFICERS
| Name, Address1 and Date of Birth |
Position(s) Held with the Fund |
Term of Office and Length of Time Served1 |
Principal Occupation(s) During the Past 5 Years |
|
Boaz Weinstein
DOB: 06/06/1973 |
President |
Since May 2021 |
CIO of Saba Capital |
|
Pierre Weinstein
DOB: 04/04/1975 |
Chief Executive Officer |
Since May 2021 |
Portfolio Manager at Saba Capital |
|
Michael D’Angelo
DOB: 09/08/1978 |
Secretary |
Since May 2021 |
COO and General Counsel at Saba Capital |
|
Patrick Keniston2
DOB: 01/18/1964 |
CCO |
Since June 2021 |
Managing Director, Foreside Fund Services, LLC (since 2008) |
|
Troy Statczar2
DOB: 08/31/1971 |
PFO, Treasurer |
Since June 2021 |
Senior Director, Foreside Treasurer Services since 2020 - Foreside Financial Group; Director of Fund Administration (2017-2019) - Thornburg Investment Management, Inc.; Director of U.S. Operations (2008-2017) - Henderson Global Investors N.A., Inc. |
|
Nitin Sapru
DOB: 12/07/1980 |
VP |
Since May 2021 |
CFO at Saba Capital |
| 1 | Unless otherwise indicated, the mailing address for each officer is 405 Lexington Avenue, 58th
Floor, New York, NY 10174. |
| 2 | Patrick Keniston's and Troy Statczar’s address is Foreside Fund Officer Services, LLC, 3 Canal
Plaza, Suite 100, Portland, ME 04101. |
| Annual Report | October 31, 2023 |
65 |
Page intentionally left blank
Item 2. Code of Ethics.
As of the end of the period covered by
this report, Registrant had adopted a code of ethics, as defined in Item 2 of Form N-CSR, that applies to the Registrant’s principal
executive officer and principal financial officer. There were no amendments to the Code during the period covered by the report. The code
of ethics is filed herewith pursuant to Item 10(a)(1), Ex-99.CODE ETH.
Item 3. Audit Committee Financial Expert.
The Board of Trustees
has determined that Karen Caldwell is the sole Audit Committee Financial Expert, as defined in Item 3 of Form N-CSR. Ms. Caldwell, is
“independent” for purposes of Item 3 of Form N-CSR.
Item 4. Principal Accountant Fees and Services.
Below are the amount of fees that Ernst
& Young LLP (“EY”), the Fund’s current Independent Registered Public Accounting Firm, billed to the Fund during
the Fund’s fiscal year ended October 31, 2023 and the year ended October 31, 2022.
| (a) | Audit Fees: The aggregate fees billed for professional services rendered by EY, the principal accountant
for the audit of the Registrant's annual financial statements or services that are normally provided by the accountant in connection
with statutory and regulatory filings or engagements for those fiscal years were $123,500 for the year ended October 31, 2023 and $102,600 for
the year ended October 31, 2022. |
| (b) | Audit-Related Fees: The aggregate fees billed for assurance and related services by EY that are reasonably
related to the performance of the audit of the Registrant's financial statements and are not reported under paragraph (a) of this
Item were $0 for the year ended October 31, 2023, and $0 for the year ended October 31, 2022. |
| (c) | Tax Fees (1): The aggregate fees billed for professional services rendered by EY for tax compliance, tax
advice, and tax planning were $24,700 for the year ended October 31, 2023 and $23,500 for the year ended October 31, 2022. Such services included
review of excise distribution calculations (if applicable), preparation of the Fund’s federal, state and excise tax returns, tax
services related to mergers, and routine consulting. |
| (d) | All Other Fees: The aggregate fees billed for products and services provided by EY, other than the services
reported in paragraphs (a) through (c) of this Item were $0 for the year ended October 31, 2023 and $0 for the year ended October 31,
2022. |
| (e)(1) | Audit Committee Pre-Approval Policies and Procedures |
Under the Sarbanes-Oxley Act of 2002, as
amended (the “Act”), the Audit Committee is responsible for the appointment, compensation and oversight of the services provided
by the Auditor. As part of this responsibility, the Audit Committee is required to pre-approve the audit and non-audit services performed
by the Auditor in order to assure that these services do not impair the Auditor’s independence. In addition, the Audit Committee
is required to pre-approve non-audit services provided by the Auditor to the Fund where such services provided have a direct impact on
the operations or financial reporting of the Fund as further assurance that such services do not impair the Auditor’s independence.
The Audit and Non-Audit
Services Pre-Approval Policy (the “Policy”), which is intended to comply with Regulation S-X Rule 2-01, sets forth guidelines
and procedures to be followed by the Fund when retaining the Auditor to perform audit-related services, tax services and other non-audit
services under these circumstances, while also maintaining independence.
This Policy follows
two different approaches to pre-approving services: (1) proposed services may be generally pre-approved (“General Pre-Approval”),
or (2) proposed services that require specific pre-approval (“Specific Pre-Approval”). Unless a type of service provided by
the Auditor has received General Pre-Approval, it will require Specific Pre-Approval by the Audit Committee.
| (e)(2) | Percentage of services referred to in 4(b) – (4)(d) that were approved by
the audit committee |
100% of the
services were approved by the audit committee.
| (f) | Percentage of hours expended attributable to work performed by other than full time employees of EY if greater than 50% |
Not applicable.
| (g) | Non-Audit Fees: The following table
presents (i) the aggregate non-audit fees (i.e., fees for audit-related, tax, and other services) billed to each Registrant
by the independent registered public accounting firm for each Registrant’s fiscal year ended October 31, 2023 and the
year ended October 31, 2022; and (ii) the aggregate non-audit fees billed to the investment adviser, or
any of its affiliates that provide ongoing services to the Registrant, by the independent registered public accounting firm for the
same time periods. |
| Registrant/Investment Adviser | |
| 10/31/2023 | | |
| 10/31/2022 | |
| Saba Capital Income & Opportunities Fund | |
$ | 24,700 | | |
$ | 23,500 | |
| Saba Capital Management/Voya Investments, LLC | |
$ | 0 | | |
$ | 0 | |
| (h) | Principal Accountants Independence: The Registrant’s
Audit committee has considered whether the provision of non-audit services that were rendered to the Registrant's investment adviser
and any entity controlling, controlled by, or under common control with the investment adviser that provides ongoing services to the Registrant
that were not pre-approved pursuant to Rule 2-01(c)(7)(ii) of Regulation S-X is compatible with maintaining EY’s independence. |
Item 5. Audit Committee of Listed Registrants
| a. | The Registrant has a separately-designated standing audit committee. The members of the committee are Thomas Bumbolow, Karen L. Caldwell,
and Ketu Desai. |
Item 6. Investments.
Schedule is included as part of the report to shareholders
filed under Item 1 of this Form.
Item 7. Disclosure of Proxy Voting Policies and Procedures
for Closed-End Management Investment Companies.
The SEC adopted Rule 206(4)-6 under the Advisers
Act, requiring registered investment advisers that exercise voting authority over client securities to implement proxy voting policies.
Saba Capital has adopted proxy voting policies and procedures to ensure compliance with the Advisers Act. Saba Capital’s policy
is to vote in a manner that serves the best interests of the clients. Except as set forth below, the firm has engaged BroadRidge Financial
Solutions, Inc. to compile and vote all proxy ballots on behalf of the Saba Capital, using specific guidelines and recommendations provided
by Glass, Lewis & Co., LLC (“Glass Lewis”).
Saba Capital may, from time to time, determine
that it is in the best interests of its clients to either depart from specific Glass Lewis recommendations and/or vote shares held in
the same proportion as the vote of all other holders of the securities. To the extent the Fund invests in investment companies, it will
generally (i) seek instruction from the Fund’s shareholders and vote in accordance with such instructions, (ii) vote the shares
held by the Fund in the same proportion as the vote of all other holders of the securities of the investment company or (iii) elect to
not submit a proxy vote.
Item 8. Portfolio Managers of Closed-End Management Investment
Companies.
(a)(1) Portfolio
Management. The following individuals share responsibility for the day-to-day management of the Trust’s portfolio:
Boaz Weinstein, Founder & CIO, employed
by Saba Capital Management since 2009
Paul Kazarian, Portfolio Manager, employed
by Saba Capital Management since 2013
Pierre Weinstein, Portfolio Manager, employed by Saba Capital Management
since 2009
(a)(2V-iii) Other Accounts
Managed
The following table shows
the number of accounts and total assets in the accounts with respect to which the advisory fee is based on the performance of the account
managed by the portfolio managers of the Fund as of October 31, 2023, unless otherwise indicated.
| Portfolio Managers Name |
Registered Investment Companies |
Other Pooled Investment Vehicles (1) |
Other Accounts(1) |
| Boaz Weinstein |
2 Accounts
$0 Total Assets |
13 Accounts
$3,621,999,409 Total Assets |
6 Accounts
$486,614,177 Total Assets |
| Paul Kazarian |
2 Accounts
$0 Total Assets |
13 Accounts
$3,621,999,409 Total Assets |
4 Accounts
$70,022,958 Total Assets |
| Pierre Weinstein |
2 Accounts
$0 Total Assets |
13 Accounts
$3,621,999,409 Total Assets |
6 Accounts
$486,614,177 Total Assets |
| (1) | The advisory fees are based in part on the performance for each
account. |
(a)(2)(iv) Conflicts of Interest
Saba Capital and its affiliates accept
performance-based fees from certain Clients. In addition, Saba Capital manages another Client account that is only charged sub-advisory
fees and is not charged performance fees. Clients should be aware that performance fee arrangements may create a conflict of interest
for Saba Capital, as they could create an incentive for Saba Capital to make investments that are riskier or more speculative than it
would otherwise make absent a performance fee.
In the allocation of investment opportunities,
performance-based compensation arrangements may also create an incentive to favor accounts from which Saba Capital may receive greater
performance-based compensation over accounts from which Saba Capital may receive less performance-based compensation. Consistent with
its fiduciary obligations, Saba Capital has a policy of allocating investment opportunities on a fair and equitable basis measured over
time.
(a)(3) Compensation
The firm pays a base salary (fixed) and
discretionary bonus (variable) measured by the contributions of the particular employee as well as the success of the firm. The firm also
provides sick days, short term disability, bereavement, jury duty/voting, military leave and medical leave, as well as paid parental (maternity
and paternity) leave. The firm also provides employees with a robust benefits package which includes 100% employer covered health, dental
& vision insurance in addition to other ancillary benefits. Partners of the firm receive compensation based on their level of equity
ownership in the firm which can be increased on a discretionary basis.
(a)(4) Ownership of Securities
The following table shows the dollar range
of shares of the Fund owned by each team member as of October 31, 2023, including investments by their immediate family members and amounts
invested through retirement and deferred compensation plans.
Ownership:
| Portfolio Managers |
Dollar Range of the Registrant’s Securities Owned by the Portfolio Managers |
| Boaz Weinstein |
$10,001 - $50,000 |
|
Paul Kazarian |
None |
|
Pierre Weinstein |
None |
(b) None.
Item 9. Purchases of Equity Securities
by Closed-End Management Investment Company and Affiliated Purchasers.
During
the fiscal year ended October 31, 2023, there were no purchases made by or on behalf of the Registrant or any “affiliated purchaser”,
as defined in Rule 10b-18(a)(3) under the Securities Exchange Act of 1934 (“Exchange Act”), of shares or other units of any
class of the Registrant's equity securities that are registered by the Registrant pursuant to Section 12 of the Exchange Act.
Item 10. Submission of Matters to a Vote of Security Holders.
There have been no material changes to the
procedures by which shareholders may recommend nominees to the Registrant’s Board of Trustees, where those changes were implemented
after the Registrant last provided disclosure in response to the requirements of Item 407(c)(2)(iv) of Regulation S-K, or this Item.
Item 11. Controls and Procedures.
(a) Based
on our evaluation conducted within 90 days of the filing date, hereof, the design and operation of the Registrant's disclosure controls
and procedures are effective to ensure that material information relating to the Registrant is made known to the certifying officers by
others within the appropriate entities, particularly during the period in which Forms N-CSR are being prepared, and the Registrant's
disclosure controls and procedures allow timely preparation and review of the information for the Registrant’s Form N-CSR and the
officer certifications of such Form N-CSR.
(b) There
were no significant changes in the Registrant's internal controls that occurred during the second fiscal quarter of the period covered
by this report that has materially affected, or is reasonably likely to materially affect, the Registrant's internal control over
financial reporting.
Item 12. Disclosure of Securities Lending Activities for
Closed-End Management Investment Companies.
Not
Applicable.
Item 13. Exhibits.
| (a)(3) | Not applicable to this report. |
| (a)(4) | Not applicable to this report. |
SIGNATURES
Pursuant to the requirements of the Securities Exchange Act of 1934 and
the Investment Company Act of 1940, the Registrant has duly caused this report to be signed on its behalf by the undersigned, thereunto
duly authorized.
SABA CAPITAL INCOME & OPPORTUNITIES FUND
| By: |
/s/ Pierre Weinstein |
|
| |
Pierre Weinstein (Principal Executive Officer) |
|
| |
Chief Executive Officer |
|
| |
|
|
| Date: |
January 5, 2024 |
|
Pursuant to the requirements of the Securities Exchange
Act of 1934 and the Investment Company Act of 1940, this report has been signed below by the following persons on behalf of the Registrant
and in the capacities and on the dates indicated.
SABA CAPITAL INCOME & OPPORTUNITIES FUND
| By: |
/s/ Pierre Weinstein |
|
| |
Pierre Weinstein (Principal Executive Officer) |
|
| |
Chief Executive Officer |
|
| |
|
|
| Date: |
January 5, 2024 |
|
| By: |
/s/ Troy Statczar |
|
| |
Troy Statczar (Principal Financial Officer) |
|
| |
Treasurer and Chief Financial Officer |
|
| |
|
|
| Date: |
January 5, 2024 |
|
SABA
CAPITAL INCOME & OPPORTUNITIES FUND CODE OF BUSINESS CONDUCT AND ETHICS FOR PRINCIPAL
EXECUTIVE
AND PRINCIPAL FINANCIAL OFFICERS
Introduction
The
Saba Capital Income & Opportunities Fund Code of Business Conduct and Ethics for Principal Executive and Senior Financial
Officers (this “SOX Code”) applies to the Fund’s PEO and PFO (each, an “Officer”).
The
SOX Code provides guidance on how you, as an Officer, uphold these ethical standards. It applies to your service to the Fund.
The
SOX Code consists of an outline of policies regarding conduct in several key areas: ethical behavior and legal compliance, conflicts
of interest, confidentiality and business practices. You are responsible for reviewing the SOX Code and for acting in compliance
with the SOX Code in your daily activities.
The
SOX Code is not exhaustive; it provides guidance for carrying out your responsibilities on behalf of the Fund and observing the
highest standards of ethical conduct. Because the SOX Code does not address every possible situation that may arise, you are responsible
for exercising good judgment, applying ethical principles, and raising questions when in doubt. Your integrity and good judgment
enhance the Fund’s brand, build the Fund’s reputation, and are the foundation of trust for our shareholder and business
relationships.
The
SOX Code also requires that Officers adhere to the specific information and guidance that is provided in all of the Fund’s
policies and procedures, including the Fund Compliance Policies and Procedures Manual and the Code of Ethics adopted by the Adviser;
publications that address individual conduct; and documents to which you agree as a requirement of your employment, collectively
referred to as “company policies.” Company policies may be published in paper or electronic media.
You
are responsible for reviewing the SOX Code, including company policies, applicable to you, and for acting in compliance with the
SOX Code in your daily activities. You may obtain company policies and forms from the CCO.
Fund
Conduct
The
following general principles guide our Fund’s conduct:
| ■ | We
will act in accordance with applicable laws and regulations and will not tolerate behavior
that is otherwise. |
| ■ | We
will make public disclosures as required by law and regulation and as deemed appropriate
to enable reasonable evaluation of the Fund. |
| ■ | We
will strive to provide an equitable return for our investors. |
| ■ | We
will conduct business fairly, in open competition. |
Individual
Conduct
The
following general principles guide your individual conduct as an Officer:
| ■ | You
will not take any action that will violate any applicable law or regulation. |
| ■ | You
will adhere to the highest standards of ethical conduct. |
| ■ | You
will maintain the confidentiality of all information you obtain in the course of your
employment. |
| ■ | You
will escalate issues which you reasonably believe may place the Fund at risk, and report
any behavior you reasonably believe is wrong. |
| ■ | You
will not abuse or take the Fund’s assets or use them for your personal gain. |
| ■ | You
will not engage in any activities that create a conflict of interest between you and
the Fund. |
| ■ | You
will comport yourself publicly in a manner that does not bring discredit on the Fund. |
| ■ | You
will deal fairly with shareholders of the Fund, colleagues and others. |
| ■ | You
will comply with this SOX Code. |
You
have personal responsibility to conduct the Fund’s business in a manner consistent with these principles, and you cannot
avoid this responsibility by contrary instructions from others or by turning a blind eye. Many of these principles are explained
in more detail below and in the Fund’s other policies and procedures. If you have questions on any of them, you should consult
with the Adviser CCO or the CCO.
Ethical
Behavior
Your
decisions and behavior have far-reaching implications. Standards of ethical and professional conduct reflect on the individual,
on the Fund’s brand, and on the investment industry as a whole. A strong personal sense of ethics should always play a significant
role in guiding you towards a proper course of action.
Escalation
of Concerns
Guidance
is provided throughout the SOX Code on the appropriate means for escalating, disclosing and seeking approvals for activities governed
by the SOX Code. At a minimum, if you know of, or reasonably believe there is, a violation of applicable laws or this SOX Code,
you must report that information immediately to the Adviser CCO. If you believe the person to whom you have reported the violation,
or possible violation, has not taken appropriate action, you must contact the Board. Neither you nor the person to whom you make
a report should conduct preliminary investigations, unless authorized to do so by the Adviser CCO. Anyone who in good faith raises
an issue in accordance with this SOX Code regarding a possible violation of law, regulation or company policy or any suspected
illegal or unethical behavior will be protected from retaliation.
Compliance
with Laws, Rules, Regulations and Policies
The
foundation of the Fund’s ethical standards is compliance with the letter and spirit of the law. You must respect and obey
all of the laws, rules and regulations applicable to our business, including among others, securities and other federal, state
and local laws. You are responsible for being familiar and complying with the Fund’s policies and procedures. Although you
are not expected to know the details of each law governing our business, you are expected to be familiar with and comply with
the Fund’s policies and procedures and, when in doubt, to seek advice from the CCO as outlined in this SOX Code.
Conflicts
of Interest
To
maintain the highest ethical standards in conducting our business, it is important that you do not place yourself in a position
that would cloud your judgment in carrying out the business affairs of the Fund. A “conflict of interest” occurs when
your private interest interferes in any way – or even appears to interfere – with the interests of the Fund. You have
a duty to report any material transaction or relationship that reasonably could be expected to be or to create a conflict of interest
with the Fund. If you have any questions regarding what might constitute a conflict of interest, or to report any transaction
or relationship that you believe has occurred or may occur that might constitute a conflict of interest, contact the CCO.
Certain
conflicts of interest arise out of the relationships between Officers and the Fund and already are subject to conflict of interest
provisions in the 1940 Act, and the Advisers Act. For example, Officers may not individually engage in certain transactions (such
as the purchase or sale of securities or other property) with the Fund because of their status as “affiliated persons”
of the Fund. The Fund’s compliance programs and procedures are designed to prevent, or identify and correct, violations
of these provisions. This SOX Code does not, and is not intended to, repeat or replace these programs and procedures, and such
conflicts fall outside of the parameters of this SOX Code.
Although
typically not presenting an opportunity for improper personal benefit, conflicts arise from, or as a result of, the contractual
relationship between the Fund on the one hand and the Adviser on the other hand. Each Officer may also be an officer or employee
of the Adviser, or its respective affiliates. As a result, this SOX Code recognizes that the Officers will, in the normal course
of their duties (whether formally for the Fund, for the Adviser), be involved in establishing policies and implementing decisions
that will have different effects on the Fund and the Adviser. The participation of the Officers in such activities is inherent
in the contractual relationship between the Fund and the Adviser and is consistent with the performance by the Officers of their
duties as officers of the Fund. Thus, if performed in conformity with the provisions of the 1940 Act and the Advisers Act, such
activities will be deemed to have been handled ethically. In addition, it is recognized by Trustees that the Officers may also
be officers or employees of one or more other investment companies covered by this or other codes.
Outside
Directorships, Outside Employment and Other Outside Activities
Unless
previously approved by the Adviser, your position with the Fund and the Adviser must be your primary business association and
must take precedence over any other employment or business affiliation you may have. We encourage you to accept appropriate directorships
and advisory positions at most non-profit organizations and commercial firms; however, your service as an adviser to, or member
of, the board of a public company, non-profit charitable, civic, social service, religious, professional or trade organization
must be consistent with the provisions for the SOX Code, and not create a conflict of interest with your responsibilities to the
Fund. This includes outside positions and activities that may be misconstrued to be activities of the Fund. Unless you have obtained
prior approval from the Adviser CCO, you may not hold any position, whether paid or unpaid, with any other organization or outside
activity that may interfere with your duties and responsibilities at the Fund. Approval will only be granted where it is clear
that the proposed activity will not interfere with your duties at the Fund or the Adviser and that none of the Fund or the Adviser
will incur any liability or responsibility for such outside activity.
Conflicts
of interest may arise in certain business situations in which you, or a member of your household (or of a relative whose financial
interests you control), participate. Examples include making significant investments in companies that compete with the Fund or
in entities that do business with the Fund. If you or a member of your household intends to hold such an investment, you must
disclose it in writing to, and obtain prior approval for the investment from, the Adviser CCO.
Personal
Investment Accounts and “Inside Information”
You
must disclose any investment accounts maintained by you or any related parties. You must do this at the time you become an Officer,
at the time of any change in such information, and annually thereafter. Officers may not buy, sell, trade or carry securities
or commodities for their personal investment accounts under circumstances that could result in their becoming obligated to any
dealer, broker or client or that could produce or appear to produce conflicts of interest.
You
should avoid circumstances that could introduce a personal financial bias into the handling of shareholder and Fund matters. In
this regard, you should not become over-indebted and should borrow only from banks and other traditional lenders.
A
“corporate opportunity” is an opportunity discovered through the use of Fund property, information or position. Officers
are prohibited from taking corporate opportunities for themselves personally. This rule includes any fee or other compensation
offered or paid by Fund shareholders in connection with routine company activity or for individual service as an executor, trustee,
director or other fiduciary. It covers any other services performed for your benefit because of your role at the Fund, such as
endorsements, lectures, articles, book reviews, compensation received from vendors and compensation paid for participating in
interviews with the media and making radio or television appearances. You may not use Fund property, information or position for
improper personal gain, and you may not compete with the Fund directly or indirectly.
Confidentiality
of Information
As
an investment company, we have particular responsibilities for safeguarding the information of our shareholders and the proprietary
information of the Fund. You should be mindful of this obligation when you use the telephone, fax, e-mail, and other electronic
means of storing and transmitting information. You should not discuss confidential information in public areas where it can be
overheard, read confidential documents in public places, nor leave or discard confidential documents where they can be retrieved
by others.
Confidentiality
of Shareholder Information
Information
concerning the identity of the Fund’s underlying shareholders and their transactions and accounts is confidential. Such
information may not be disclosed to persons working on behalf of the Fund except as they may need to know it in order to fulfill
their responsibilities to the Fund. You may not disclose such information to anyone or any firm outside the Fund unless (i) the
outside firm needs to know the information in order to perform services for the Fund and is bound to maintain its confidentiality;
(ii) when the shareholder has consented or been given an opportunity to request that the information not be shared; (iii) as required
by law; or (iv) as authorized by the Adviser CCO.
Information
regarding shareholder or Fund transactions must not be used in any way to influence trades in personal accounts. Trading ahead
of Fund transactions is known as front running and is prohibited. Following Fund transactions with your trading activity is known
as piggybacking or shadowing and is likewise prohibited. If you reasonably believe improper trading in personal or Fund accounts
has occurred, you must report such conduct to the Adviser CCO.
Privacy
The
Fund is committed to safeguarding customers’ privacy. We do not sell any personally identifiable customer information. Sharing
of such information with third parties is limited to situations related to the processing and servicing of customer accounts,
and to specifically delineated exceptions in the federal privacy law. We share information with our affiliates as allowed by federal
law. You must be familiar with the procedural and systemic safeguards we maintain to protect this information and report any breaches
of these safeguards to the Adviser CCO.
Proprietary
Information of the Fund
You
have the responsibility to safeguard the Fund’s proprietary information. Proprietary information includes intellectual property
(copyrights, trademarks or patents or trade secrets), particular know-how (business or organizational designs, or business, marketing
or service plans or ideas) and sensitive information about the Fund (databases, records, salary information or unpublished financial
reports). If you have any questions about what constitutes proprietary information, or if you believe such information has been
compromised, contact the Adviser CCO
Non-Retaliation
It
is your obligation to report issues regarding possible violations of business regulations or this SOX Code when you suspect in
good faith that a violation may have or might occur. No Officer will be retaliated against for making a good faith complaint or
bringing inappropriate conduct to the Fund’s attention, for assisting another Officer in making a good faith report, for
cooperating in an investigation, or for filing an administrative claim with a state or federal governmental agency. Any employee
who engages in retaliatory conduct in violation of our policies will be subject to disciplinary action, up to and including termination
of employment. If you reasonably believe retaliatory conduct has occurred, you must report such conduct to the Adviser CCO.
Business
Practices
It
is your obligation to report issues regarding possible violations of business regulations or this SOX Code when you suspect in
good faith that a violation may have or might occur. As a financial institution, it is imperative that we operate with efficiency
and with the highest business standards, and that we maintain and provide accurate information.
Financial
Disclosures
The
Fund is committed to providing full, fair, accurate, timely and understandable disclosure in reports and documents that the Fund
files with, or submits to, the SEC and other regulatory agencies and in other public communications made by the Fund. You are
required to comply with Fund policies and procedures to provide such full, fair, accurate, timely and understandable disclosure.
If you have any questions about your duties in supporting the Fund’s financial reporting processes, contact the Adviser
CCO.
Conduct
of Audits
Neither
you nor any other person acting under your direction shall directly or indirectly take any action to fraudulently influence, coerce,
manipulate, or mislead any independent public or certified public accountant engaged in the performance of an audit or review
of the Fund’s financial statements.
Types
of conduct that constitute improper influence include, but are not limited to, directly or indirectly:
| ■ | Offering
or paying bribes or other financial incentives, including offering future employment
or contracts for non-audit services; |
| ■ | Providing
an auditor with inaccurate or misleading legal analysis; |
| ■ | Threatening
to cancel or canceling existing non-audit or audit engagements if the auditor objects
to the issuer’s accounting; |
| ■ | Seeking
to have a partner removed from the audit engagement because the partner objects to the
Fund’s accounting; |
| ■ | Making
physical threats. |
If
you reasonably believe improper influence has occurred, you must report such conduct to the Adviser CCO.
Record-Keeping
We
require honest and accurate recording and reporting of information to maintain the integrity of our business records and to make
responsible business decisions. The Fund’s books, records and accounts must (i) accurately reflect all transactions of the
Fund and all other events that are subject of a specific regulatory record-keeping requirement; (ii) be maintained in reasonable
detail; and (iii) conform both to applicable legal requirements and to the Fund’s system of internal controls. Unrecorded
or “off the books” funds or assets are prohibited unless permitted by applicable law or regulation. Business records
must not contain exaggeration, derogatory remarks, guesswork, or inappropriate characterizations of people and companies. This
applies equally to e-mail, internal memoranda, formal reports, and all other forms of business records. You must be familiar with
the Fund’s record retention policies and always retain or destroy records according to them. In the event of litigation,
governmental investigation or the threat of such action, you should consult the Adviser CCO.
Any
suspected breach of this obligation should be reported immediately to the Adviser CCO.
Cooperating
with Compliance, Audit, Regulatory Authorities and Authorized Investigations
You
must cooperate fully with compliance officers, auditors, examiners and regulatory authorities, and others who are conducting authorized
examinations, investigations or other reviews of the Fund’s records and business practices. Authorized requests for information
and access to the Fund’s records are to be satisfied in a timely, responsive and respectful manner.
Any
Officer who has been convicted of any crime involving dishonesty or a breach of trust must disclose such conviction to the Adviser
CCO promptly, even if that crime did not relate to Fund business.
If
you have any questions related to the appropriateness of providing access to the Fund’s records, you should contact the
Adviser CCO. In the event of litigation or governmental investigation, you should consult the Adviser CCO regarding document production
and record retention.
Competition
and Fair Dealing
We
operate our business fairly and honestly. We seek competitive advantage through performance and dedication to our values and never
through unethical or illegal business practices. It is our policy to comply with anti-trust laws. These laws are complex and not
easily summarized but at a minimum require that there be no agreement or understanding between the Fund and its competitors that
affect prices, terms or conditions of sale or that unreasonably restrain full and fair competition. You must always respect the
rights of and deal fairly with the Fund’s shareholders and competitors. You must never take unfair advantage of anyone through
manipulation, concealment, abuse of privileged information, misrepresentation of material facts, or any other unfair dealing practice.
If you have any question about what constitutes an unfair business practice, you should consult the Adviser CCO.
Vendor
Selection, Brokerage Allocation
The
selection of professional services, including those of brokers, dealers, attorneys or business consultants, should be based on
competitive analysis of quality, price and benefit to the Fund. When transacting business on behalf of the Fund, if you feel that
you may have a potential conflict of interest, you must notify the Adviser CCO of the potential conflict prior to initiating the
transaction.
If
you are in a position to influence the selection of brokers, you are prohibited from having any financial interest in a brokerage
firm (other than those whose shares are traded publicly) and you may not accept gifts or entertainment or any other form of compensation
from the brokerage community except as permitted under this SOX Code.
Prohibition
of Bribery and Kickbacks
Our
policies prohibit bribery or kickbacks of any kind and to anyone in the conduct of our business. The U.S. government has a number
of laws and regulations applicable specifically to business gratuities that may be accepted by U.S. and foreign government personnel.
The promise, offer or delivery to an official or employee of the U.S. government or an official, employee or candidate of a foreign
government of a gift, favor, payment or other gratuity in violation of these rules would not only violate the Fund’s policy
but could also be a criminal offense. Similarly, federal law, as well as the laws of many states, prohibits engaging in “commercial
bribery.” Commercial bribery involves soliciting, demanding or agreeing to accept anything of value from any person intending
to influence or be rewarded in connection with any business or transaction, and prohibits all such behavior, for example, with
respect to vendors, competitors, shareholders, and government employees. If you have any questions or need any guidance, you should
contact the Adviser CCO.
Compliance
Procedures
We
will work together to ensure compliance with the SOX Code and to take prompt action in response to reported violations of the
SOX Code.
Seeking
Guidance
If
you are unsure of what to do in any situation, seek guidance before you act. Use the Fund’s resources, including the Adviser
CCO or CCO. If you feel that it is not appropriate to discuss a matter with the Adviser CCO or CCO, you may contact the Board.
Remember that you must report all incidents of misconduct, and you may do so without fear of retaliation. If you have violated
the SOX Code, however, making a report will not protect you from the consequences of your actions.
Reporting
Conduct that May be in Violation of the SOX Code
You
must report conduct that you believe to be in violation of the SOX Code, the Fund’s policy, law or regulation. Reports should
be escalated in the following manner:
| ■ | If
you have a reasonable belief that a violation has occurred, or may occur, you must report
the conduct to the Adviser CCO. |
| ■ | The
Adviser CCO, in cooperation with the CCO, will take all appropriate action to investigate
any potential violation reported to them and will notify counsel for the Fund’s
independent Trustees and counsel for the Fund of the substance of the potential violation. |
| ■ | If
after investigation, the Adviser CCO and CCO reasonably believe that no violation has
occurred, they are not required to take any further action. |
| ■ | Any
matter that the Adviser CCO or CCO believes is a violation will be reported to the Board. |
| ■ | If
the Board concurs that a violation has occurred, the Board will consider appropriate
action, which may include review of, and appropriate modification to, applicable policies
and procedures; notification to appropriate personnel of the Adviser or its board; or
a recommendation to dismiss the Officer. |
Roles
in Observing Compliance
As
an Officer of the Fund, you have a role in observing compliance with the SOX Code. In general, that includes:
Role
of Officers
| ■ | Read
and be familiar with conduct rules outlined in this SOX Code and periodically review
them. |
| ■ | Affirm
in writing to the Board that the Officer has received, read and understands the SOX Code. |
| ■ | Annually
affirm to the Board that the Officer has complied with the requirements of the SOX Code. |
| ■ | Comply
with the conduct standards outlined in this SOX Code in all dealings and actions, including
those with shareholders, the public and vendors. |
| ■ | Report
in a timely manner to the Adviser CCO any conduct that may constitute a violation of
the SOX Code, the Fund’s policies, or laws, rules and regulations. |
| ■ | Raise
questions or concerns about conduct issues with the Adviser CCO or CCO, and seek advice
when in doubt. |
| ■ | Cooperate
with management during fact-finding investigations and comply with any confidentiality
rules imposed. |
Role
of the Board
| ■ | Review
the SOX Code annually and recommend any changes. |
| ■ | Review
the Officer reports of compliance with the SOX Code. |
Interpretation
of SOX Code and Waivers of the SOX Code
The
CCO is responsible for applying the SOX Code to specific situations in which questions are presented under him and has the authority
to interpret the Code in any particular situation. However, waivers of the SOX Code may be made only by the Board and will be
promptly disclosed publicly as required by law.
Amendments
This
SOX Code may not be amended except in written form, which is specifically approved or ratified by a majority of the Board including
a majority of the independent Trustees, except for an amendment to Exhibit 4, which is attached hereto. Any amendments
will, to the extent required, be disclosed in accordance with law.
Other
Policies and Procedures
This
SOX Code constitutes the sole code of ethics adopted by the Fund for purposes of Section 406 of the Sarbanes-Oxley Act of 2002
and the rules and forms applicable to registered investment companies thereunder. Insofar as other policies or procedures of the
Fund, the Adviser, or other Fund service providers govern or purport to govern the behavior or activities of an Officer who is
subject to this SOX Code, they are superseded by this SOX Code to the extent that they conflict with the provisions of this SOX
Code. The Adviser’s and the Fund’s codes of ethics under Rule 17j-1 pursuant to the Investment Company Act and the
Adviser’s policies and procedures set forth in its compliance manual and elsewhere are separate requirements applying to
the Officers and are not part of this SOX Code.
Confidentiality
All
reports and records prepared or maintained pursuant to this SOX Code will be considered confidential and shall be maintained and
protected accordingly. Except as otherwise required by law or this SOX Code, such matters shall not be disclosed to anyone other
than the Board and their counsel.
Internal
Use
This
SOX Code is intended for internal use by the Fund and does not constitute an admission, by or on behalf of the Fund, as to any
fact, circumstance, or legal conclusion.
Contacts
If
you have further questions about the SOX Code, or about its applicability with respect to a particular matter, please contact
the Adviser CCO or CCO. If you feel that it is not appropriate to discuss a matter with the either CCO, you may contact the Board.
The contact information of the Adviser CCO, CCO, and the Board is attached hereto as Exhibit 4.
Exhibit
4
(Effective
June 5, 2021)
Adviser
CCO:
Michael
D’Angelo (212) 542-4635
CCO:
Patrick
J. Keniston (207) 615-9096
Board:
Aditya
Bindal (212) 542-4644
Thomas
Bumbolow (917) 589-1028
Karen
Caldwell (773) 531-4692
Ketu
Desai (914) 552-4170
Kieran
W. Goodwin (917) 689-3628
Andrew
Kellerman (917) 455-8422
Exhibit 99.Cert.
I, Pierre Weinstein, Chief Executive Officer and Principal Executive Officer
of the Saba Capital Income & Opportunities Fund (the “Registrant”), certify that:
| 1. | I have reviewed this report on Form N-CSR of the Registrant; |
| 2. | Based on my knowledge, this report does not contain any untrue statement of a material fact or omit to
state a material fact necessary to make the statements made, in light of the circumstances under which such statements were made, not
misleading with respect to the period covered by this report; |
| 3. | Based on my knowledge, the financial statements, and other financial information included in this report,
fairly present in all material respects the financial condition, results of operations, changes in net assets, and cash flows (if the
financial statements are required to include a statement of cash flows) of the Registrant as of, and for, the periods presented in this
report; |
| 4. | The Registrant’s other certifying officer(s) and I are responsible for establishing and maintaining
disclosure controls and procedures (as defined in Rule 30a-3(c) under the Investment Company Act of 1940) and internal control over financial
reporting (as defined in Rule 30a-3(d) under the Investment Company Act of 1940) for the Registrant and have: |
| (a) | Designed such disclosure controls and procedures, or caused such disclosure controls and procedures to
be designed under our supervision, to ensure that material information relating to the Registrant, including its consolidated subsidiaries,
is made known to us by others within those entities, particularly during the period in which this report is being prepared; |
| (b) | Designed such internal control over financial reporting, or caused such internal control over financial
reporting to be designed under our supervision, to provide reasonable assurance regarding the reliability of financial reporting and the
preparation of financial statements for external purposes in accordance with generally accepted accounting principles; |
| (c) | Evaluated the effectiveness of the Registrant’s disclosure controls and procedures and presented
in this report our conclusions about the effectiveness of the disclosure controls and procedures, as of a date within 90 days prior to
the filing date of this report based on such evaluation; and |
| (d) | Disclosed in this report any change in the Registrant’s internal control over financial reporting
that occurred during the period covered by this report that has materially affected, or is reasonably likely to materially affect, the
Registrant’s internal control over financial reporting; and |
| 5. | The Registrant’s other certifying officer(s) and I have disclosed to the Registrant's auditors
and the audit committee of the Registrant’s board of directors (or persons performing the equivalent functions): |
| (a) | All significant deficiencies and material weaknesses in the design or operation of internal control over
financial reporting which are reasonably likely to adversely affect the Registrant’s ability to record, process, summarize, and
report financial information; and |
| (b) | Any fraud, whether or not material, that involves management or other employees who have a significant
role in the Registrant’s internal control over financial reporting. |
| By: |
/s/ Pierre Weinstein |
|
| |
Pierre Weinstein (Principal Executive Officer) |
|
| |
Chief Executive Officer |
|
| |
|
|
| Date: |
January 5, 2024 |
|
I, Troy Statczar, Treasurer and Principal Financial Officer of the Saba
Capital Income & Opportunities Fund (the “Registrant”), certify that:
| 6. | I have reviewed this report on Form N-CSR of the Registrant; |
| 7. | Based on my knowledge, this report does not contain any untrue statement of a material fact or omit to
state a material fact necessary to make the statements made, in light of the circumstances under which such statements were made, not
misleading with respect to the period covered by this report; |
| 8. | Based on my knowledge, the financial statements, and other financial information included in this report,
fairly present in all material respects the financial condition, results of operations, changes in net assets, and cash flows (if the
financial statements are required to include a statement of cash flows) of the Registrant as of, and for, the periods presented in this
report; |
| 9. | The Registrant’s other certifying officer(s) and I are responsible for establishing and maintaining
disclosure controls and procedures (as defined in Rule 30a-3(c) under the Investment Company Act of 1940) and internal control over financial
reporting (as defined in Rule 30a-3(d) under the Investment Company Act of 1940) for the Registrant and have: |
| (a) | Designed such disclosure controls and procedures, or caused such disclosure controls and procedures to
be designed under our supervision, to ensure that material information relating to the Registrant, including its consolidated subsidiaries,
is made known to us by others within those entities, particularly during the period in which this report is being prepared; |
| (b) | Designed such internal control over financial reporting, or caused such internal control over financial
reporting to be designed under our supervision, to provide reasonable assurance regarding the reliability of financial reporting and the
preparation of financial statements for external purposes in accordance with generally accepted accounting principles; |
| (c) | Evaluated the effectiveness of the Registrant’s disclosure controls and procedures and presented
in this report our conclusions about the effectiveness of the disclosure controls and procedures, as of a date within 90 days prior to
the filing date of this report based on such evaluation; and |
| (d) | Disclosed in this report any change in the Registrant’s internal control over financial reporting
that occurred during the period covered by this report that has materially affected, or is reasonably likely to materially affect, the
Registrant’s internal control over financial reporting; and |
| 10. | The Registrant’s other certifying officer(s) and I have disclosed to the Registrant's auditors
and the audit committee of the Registrant’s board of directors (or persons performing the equivalent functions): |
| (a) | All significant deficiencies and material weaknesses in the design or operation of internal control over
financial reporting which are reasonably likely to adversely affect the Registrant’s ability to record, process, summarize, and
report financial information; and |
| (b) | Any fraud, whether or not material, that involves management or other employees who have a significant
role in the Registrant’s internal control over financial reporting. |
| By: |
/s/ Troy Statczar |
|
| |
Troy Statczar (Principal Financial Officer) |
|
| |
Treasurer and Chief Financial Officer |
|
| |
|
|
| Date: |
January 5, 2024 |
|
Exhibit 99.906Cert
This certification is furnished pursuant to Section
906 of the Sarbanes-Oxley Act of 2002, 18 U.S.C. § 1350, and accompanies the report on Form N-CSR (the “Report”)
for the period ended October 31, 2023 of the Saba Capital Income & Opportunities Fund (the “Fund”).
I, Pierre Weinstein, the Chief Executive Officer and
Principal Executive Officer of the Fund, certify that:
| (i) | the Report fully complies with the requirements of Section 13(a) or Section 15(d), as applicable,
of the Securities Exchange Act of 1934 (15 U.S.C. 78m or 78o(d)); and |
| (ii) | the information contained in the Report fairly presents, in all material respects, the financial condition
and results of operations of the Fund. |
| Dated: |
January 5, 2024 |
|
| |
|
|
| By: |
/s/ Pierre Weinstein |
|
| |
Pierre Weinstein (Principal Executive Officer) |
|
| |
Chief Executive Officer |
|
This certification is furnished pursuant to Section
906 of the Sarbanes-Oxley Act of 2002, 18 U.S.C. § 1350, and accompanies the report on Form N-CSR (the “Report”)
for the period ended October 31, 2023 of the Saba Capital Income & Opportunities Fund (the “Fund”).
I, Troy Statczar, the Treasurer and Principal Financial
Officer of the Fund, certify that:
| (i) | the Report fully complies with the requirements of Section 13(a) or Section 15(d), as applicable,
of the Securities Exchange Act of 1934 (15 U.S.C. 78m or 78o(d)); and |
| (ii) | the information contained in the Report fairly presents, in all material respects, the financial condition
and results of operations of the Fund. |
| Dated: |
January 5, 2024 |
|
| |
|
|
| By: |
/s/ Troy Statczar |
|
| |
Troy Statczar (Principal Financial Officer) |
|
| |
Treasurer and Chief Financial Officer |
|

November
28, 2022
IMPORTANT
INFORMATION REGARDING MONTHLY DISTRIBUTION
Saba
Capital Income & Opportunities Fund
DISTRIBUTION
NOTICE - We are providing shareholders of Saba Capital Income & Opportunities Fund (the “Fund”) with an estimate of the
source of the Fund’s monthly distribution as required by current securities laws. THIS NOTICE IS FOR INFORMATIONAL PURPOSES ONLY. NO
ACTION IS REQUIRED ON YOUR PART. These estimates may, and likely will, vary over time based on the investment activities of the Fund
and changes in the value of its portfolio investments. The final determination of the source and tax characteristics of all distributions
will be made after December 31, 2022 and reported to you on Form 1099-DIV early in 2023.
The
Fund estimates that the distribution payable on November 30, 2022 is comprised of approximately 100% return of capital.
www.sabacef.com
SEC-19-BRW-10252021
December
28, 2022
IMPORTANT
INFORMATION REGARDING MONTHLY DISTRIBUTION
Saba
Capital Income & Opportunities Fund
DISTRIBUTION
NOTICE - We are providing shareholders of Saba Capital Income & Opportunities Fund (the “Fund”) with an estimate of the
source of the Fund’s monthly distribution as required by current securities laws. THIS NOTICE IS FOR INFORMATIONAL PURPOSES ONLY. NO
ACTION IS REQUIRED ON YOUR PART. These estimates may, and likely will, vary over time based on the investment activities of the Fund
and changes in the value of its portfolio investments. The final determination of the source and tax characteristics of all distributions
will be made after December 31, 2022 and reported to you on Form 1099-DIV early in 2023.
The
Fund estimates that the distribution payable on December 30, 2022 is comprised of approximately 11% net income and 89% return of capital.
www.sabacef.com
SEC-19-BRW-10252021
January
27, 2023
IMPORTANT
INFORMATION REGARDING MONTHLY DISTRIBUTION
Saba
Capital Income & Opportunities Fund
DISTRIBUTION
NOTICE - We are providing shareholders of Saba Capital Income & Opportunities Fund (the “Fund”) with an estimate of the
source of the Fund’s monthly distribution as required by current securities laws. THIS NOTICE IS FOR INFORMATIONAL PURPOSES ONLY.
NO ACTION IS REQUIRED ON YOUR PART. These estimates may, and likely will, vary over time based on the investment activities of the Fund
and changes in the value of its portfolio investments. The final determination of the source and tax characteristics of all distributions
will be made after December 31, 2023 and reported to you on Form 1099-DIV early in 2024.
The
Fund estimates that the distribution payable on January 31, 2023 is comprised of approximately 9% net income and 91% return of capital.
www.sabacef.com
SEC-19-BRW-10252021
February
24, 2023
IMPORTANT
INFORMATION REGARDING MONTHLY DISTRIBUTION
Saba
Capital Income & Opportunities Fund
DISTRIBUTION
NOTICE - We are providing shareholders of Saba Capital Income & Opportunities Fund (the “Fund”) with an estimate of the
source of the Fund’s monthly distribution as required by current securities laws. THIS NOTICE IS FOR INFORMATIONAL PURPOSES ONLY. NO
ACTION IS REQUIRED ON YOUR PART. These estimates may, and likely will, vary over time based on the investment activities of the Fund
and changes in the value of its portfolio investments. The final determination of the source and tax characteristics of all distributions
will be made after December 31, 2023 and reported to you on Form 1099-DIV early in 2024.
The
Fund estimates that the distribution payable on February 28, 2023 is comprised of approximately 33% net income and 67% return of capital.
www.sabacef.com
SEC-19-BRW-10252021
March
29, 2023
IMPORTANT
INFORMATION REGARDING MONTHLY DISTRIBUTION
Saba
Capital Income & Opportunities Fund
DISTRIBUTION
NOTICE - We are providing shareholders of Saba Capital Income & Opportunities Fund (the “Fund”) with an estimate of the
source of the Fund’s monthly distribution as required by current securities laws. THIS NOTICE IS FOR INFORMATIONAL PURPOSES ONLY. NO
ACTION IS REQUIRED ON YOUR PART. These estimates may, and likely will, vary over time based on the investment activities of the Fund
and changes in the value of its portfolio investments. The final determination of the source and tax characteristics of all distributions
will be made after December 31, 2023 and reported to you on Form 1099-DIV early in 2024.
The
Fund estimates that the distribution payable on March 31, 2023 is comprised of approximately 19% net income and 81% return of capital.
www.sabacef.com
SEC-19-BRW-10252021
April
26, 2023
IMPORTANT
INFORMATION REGARDING MONTHLY DISTRIBUTION
Saba
Capital Income & Opportunities Fund
DISTRIBUTION
NOTICE - We are providing shareholders of Saba Capital Income & Opportunities Fund (the “Fund”) with an estimate of the
source of the Fund’s monthly distribution as required by current securities laws. THIS NOTICE IS FOR INFORMATIONAL PURPOSES ONLY. NO
ACTION IS REQUIRED ON YOUR PART. These estimates may, and likely will, vary over time based on the investment activities of the Fund
and changes in the value of its portfolio investments. The final determination of the source and tax characteristics of all distributions
will be made after December 31, 2023 and reported to you on Form 1099-DIV early in 2024.
The
Fund estimates that the distribution payable on April 28, 2023 is comprised of approximately 4% net income and 96% return of capital.
www.sabacef.com
SEC-19-BRW-10252021
May
26, 2023
IMPORTANT
INFORMATION REGARDING MONTHLY DISTRIBUTION
Saba
Capital Income & Opportunities Fund
DISTRIBUTION
NOTICE - We are providing shareholders of Saba Capital Income & Opportunities Fund (the “Fund”) with an estimate of the
source of the Fund’s monthly distribution as required by current securities laws. THIS NOTICE IS FOR INFORMATIONAL PURPOSES ONLY. NO
ACTION IS REQUIRED ON YOUR PART. These estimates may, and likely will, vary over time based on the investment activities of the Fund
and changes in the value of its portfolio investments. The final determination of the source and tax characteristics of all distributions
will be made after December 31, 2023 and reported to you on Form 1099-DIV early in 2024.
The
Fund estimates that the distribution payable on May 31, 2023 is comprised of approximately 4% net income and 96% return of capital.
www.sabacef.com
SEC-19-BRW-10252021
June
28, 2023
IMPORTANT
INFORMATION REGARDING MONTHLY DISTRIBUTION
Saba
Capital Income & Opportunities Fund
DISTRIBUTION
NOTICE - We are providing shareholders of Saba Capital Income & Opportunities Fund (the “Fund”) with an estimate of the
source of the Fund’s monthly distribution as required by current securities laws. THIS NOTICE IS FOR INFORMATIONAL PURPOSES ONLY. NO
ACTION IS REQUIRED ON YOUR PART. These estimates may, and likely will, vary over time based on the investment activities of the Fund
and changes in the value of its portfolio investments. The final determination of the source and tax characteristics of all distributions
will be made after December 31, 2023 and reported to you on Form 1099-DIV early in 2024.
The
Fund estimates that the distribution payable on June 30, 2023 is comprised of approximately 100% return of capital.
www.sabacef.com
SEC-19-BRW-10252021
July
27, 2023
IMPORTANT
INFORMATION REGARDING MONTHLY DISTRIBUTION
Saba
Capital Income & Opportunities Fund
DISTRIBUTION
NOTICE - We are providing shareholders of Saba Capital Income & Opportunities Fund (the “Fund”) with an estimate of the
source of the Fund’s monthly distribution as required by current securities laws. THIS NOTICE IS FOR INFORMATIONAL PURPOSES ONLY. NO
ACTION IS REQUIRED ON YOUR PART. These estimates may, and likely will, vary over time based on the investment activities of the Fund
and changes in the value of its portfolio investments. The final determination of the source and tax characteristics of all distributions
will be made after December 31, 2023 and reported to you on Form 1099-DIV early in 2024.
The
Fund estimates that the distribution payable on July 31, 2023 is comprised of approximately 28% net income and 72% return of capital.
www.sabacef.com
SEC-19-BRW-10252021
August
29, 2023
IMPORTANT
INFORMATION REGARDING MONTHLY DISTRIBUTION
Saba
Capital Income & Opportunities Fund
DISTRIBUTION
NOTICE - We are providing shareholders of Saba Capital Income & Opportunities Fund (the “Fund”) with an estimate of the
source of the Fund’s monthly distribution as required by current securities laws. THIS NOTICE IS FOR INFORMATIONAL PURPOSES ONLY. NO
ACTION IS REQUIRED ON YOUR PART. These estimates may, and likely will, vary over time based on the investment activities of the Fund
and changes in the value of its portfolio investments. The final determination of the source and tax characteristics of all distributions
will be made after December 31, 2023 and reported to you on Form 1099-DIV early in 2024.
The
Fund estimates that the distribution payable on August 31, 2023 is comprised of approximately 100% return of capital
www.sabacef.com
SEC-19-BRW-10252021
September
27, 2023
IMPORTANT
INFORMATION REGARDING MONTHLY DISTRIBUTION
Saba
Capital Income & Opportunities Fund
DISTRIBUTION
NOTICE - We are providing shareholders of Saba Capital Income & Opportunities Fund (the “Fund”) with an estimate of the
source of the Fund’s monthly distribution as required by current securities laws. THIS NOTICE IS FOR INFORMATIONAL PURPOSES ONLY. NO
ACTION IS REQUIRED ON YOUR PART. These estimates may, and likely will, vary over time based on the investment activities of the Fund
and changes in the value of its portfolio investments. The final determination of the source and tax characteristics of all distributions
will be made after December 31, 2023 and reported to you on Form 1099-DIV early in 2024.
The
Fund estimates that the distribution payable on September 29, 2023 is comprised of 100% return of capital
www.sabacef.com
SEC-19-BRW-10252021
October
27, 2023
IMPORTANT
INFORMATION REGARDING MONTHLY DISTRIBUTION
Saba
Capital Income & Opportunities Fund
DISTRIBUTION
NOTICE - We are providing shareholders of Saba Capital Income & Opportunities Fund (the “Fund”) with an estimate of the
source of the Fund’s monthly distribution as required by current securities laws. THIS NOTICE IS FOR INFORMATIONAL PURPOSES ONLY. NO
ACTION IS REQUIRED ON YOUR PART. These estimates may, and likely will, vary over time based on the investment activities of the Fund
and changes in the value of its portfolio investments. The final determination of the source and tax characteristics of all distributions
will be made after December 31, 2023 and reported to you on Form 1099-DIV early in 2024.
The
Fund estimates that the distribution payable on October 31, 2023 is comprised of 100% return of capital
www.sabacef.com
SEC-19-BRW-10252021
Saba Capital Income & Op... (NYSE:BRW)
과거 데이터 주식 차트
부터 5월(5) 2024 으로 6월(6) 2024

Saba Capital Income & Op... (NYSE:BRW)
과거 데이터 주식 차트
부터 6월(6) 2023 으로 6월(6) 2024
