Form 8-K - Current report
17 8월 2023 - 5:15AM
Edgar (US Regulatory)
0001452477
false
0001452477
2023-08-16
2023-08-16
iso4217:USD
xbrli:shares
iso4217:USD
xbrli:shares
UNITED STATES
SECURITIES AND EXCHANGE COMMISSION
Washington, D.C. 20549
FORM 8-K
CURRENT REPORT
Pursuant
to Section 13 or 15(d) of the Securities Exchange Act of 1934
Date
of report (Date of earliest event reported): August 16, 2023
Seven Hills Realty Trust
(Exact name of registrant as specified in
its charter)
| Maryland |
|
001-34383 |
|
20-4649929 |
| (State or other jurisdiction |
|
(Commission File Number) |
|
(IRS Employer |
| of incorporation) |
|
|
|
Identification No.) |
Two Newton Place
255 Washington Street, Suite 300
Newton, MA 02458 |
|
02458-1634 |
| (Address of principal executive offices) |
|
(Zip Code) |
(617)
332-9530
(Registrant’s telephone number, including area code)
Check the appropriate box below if the Form 8-K filing is intended
to simultaneously satisfy the filing obligation of the registrant under any of the following provisions:
| ¨ |
|
Written communications pursuant to Rule 425 under the Securities Act (17 CFR 230.425) |
| |
|
|
| ¨ |
|
Soliciting material pursuant to Rule 14a-12 under the Exchange Act (17 CFR 240.14a-12) |
| |
|
|
| ¨ |
|
Pre-commencement communications pursuant to Rule 14d-2(b) under the Exchange Act (17 CFR 240.14d-2(b)) |
| |
|
|
| ¨ |
|
Pre-commencement communications pursuant to Rule 13e-4(c) under the Exchange Act (17 CFR 240.13e-4(c)) |
Securities registered pursuant to Section 12(b)
of the Act:
|
Titles
of Each Class |
|
Trading
Symbol |
|
Name
of exchange on which
registered |
| Common Shares of Beneficial Interest |
|
SEVN |
|
The Nasdaq Stock Market LLC |
Indicate by check mark whether the registrant is an emerging
growth company as defined in Rule 405 of the Securities Act of 1933 (§230.405 of this chapter) or Rule 12b-2 of
the Securities Exchange Act of 1934 (§240.12b-2 of this chapter).
Emerging growth company ¨
If an emerging growth company, indicate by
check mark if the registrant has elected not to use the extended transition period for complying with any new or revised financial
accounting standards provided pursuant to Section 13(a) of the Exchange Act. ¨
| Item 7.01. | Regulation FD Disclosure. |
On August 16, 2023, Seven Hills Realty Trust posted to its website
an investor presentation, a copy of which is attached hereto as Exhibit 99.1.
| Item 9.01. | Financial Statements and Exhibits. |
(d) Exhibits.
99.1 Investor Presentation dated August 2023. (Furnished herewith.)
104 Cover Page Interactive Data
File. (Embedded within the Inline XBRL document.)
SIGNATURE
Pursuant
to the requirements of the Securities Exchange Act of 1934, the registrant has duly caused this report to be signed on its behalf by the
undersigned hereunto duly authorized.
| |
SEVEN HILLS REALTY TRUST |
| |
|
| |
By: |
/s/
Tiffany R. Sy |
| |
Name: |
Tiffany R. Sy |
| |
Title: |
Chief Financial Officer and Treasurer |
Date: August 16, 2023
Exhibit 99.1

| August 2023
INVESTOR PRESENTATION |

| 2
SEVEN HILLS REALTY TRUST
This presentation contains statements that constitute forward-looking statements within the meaning of the Private Securities Litigation
Reform Act of 1995 and other securities laws. Whenever Seven Hills Realty Trust, or SEVN, uses words such as believe, expect,
anticipate, intend, plan, estimate, will, may and negatives or derivatives of these or similar expressions, SEVN is making forward-looking statements. These forward-looking statements are based upon SEVN’s present intent, beliefs or expectations, but forward-looking
statements are not guaranteed to occur and may not occur. Actual results may differ materially from those contained in or implied by
SEVN’s forward-looking statements. Forward-looking statements involve known and unknown risks, uncertainties and other factors, some
of which are beyond SEVN’s control.
The information contained in SEVN's filings with the Securities and Exchange Commission, or the SEC, including under the heading Risk
Factors in SEVN’s Annual Report on Form 10-K for the year ended December 31, 2022, and its other periodic reports, or incorporated
therein, identifies other important factors that could cause SEVN’s actual results to differ materially from those stated in or implied by
SEVN’s forward-looking statements. SEVN’s filings with the SEC are available on the SEC’s website at www.sec.gov. These factors should
not be construed as exhaustive and should be read in conjunction with the other cautionary statements that are included in this
presentation and in the filings. SEVN assumes no obligation to update or supplement forward‐looking statements that become untrue
because of subsequent events or circumstances, except as required by law. SEVN's manager, Tremont Realty Capital, or Tremont, is
registered with the SEC as an investment adviser. Tremont is owned by The RMR Group (Nasdaq: RMR).
Notes Regarding Certain Information in this Presentation
This presentation contains industry and statistical data that SEVN obtained from various second party sources. Nothing in the data used or
derived from second party sources should be construed as investment advice. Some data and other information presented are also based
on SEVN’s good faith estimates and beliefs derived from its review of internal surveys and independent sources and its experience. SEVN
believes that these external sources, estimates and beliefs are reliable and reasonable, but it has not independently verified them.
Although SEVN is not aware of any misstatements regarding the data presented herein, these estimates and beliefs involve inherent risks
and uncertainties and are based on assumptions that are subject to change. Unless otherwise noted, all data presented are as of or for the
three months ended June 30, 2023.
Non-GAAP Financial Measures
This presentation contains non-GAAP financial measures including Distributable Earnings, Distributable Earnings per common share,
Adjusted Distributable Earnings and Adjusted Distributable Earnings per common share. Please refer to Non-GAAP Financial Measures
and Certain Definitions in the Appendix for terms used throughout this presentation.
WARNING REGARDING FORWARD-LOOKING STATEMENTS |
| 3
SEVEN HILLS REALTY TRUST
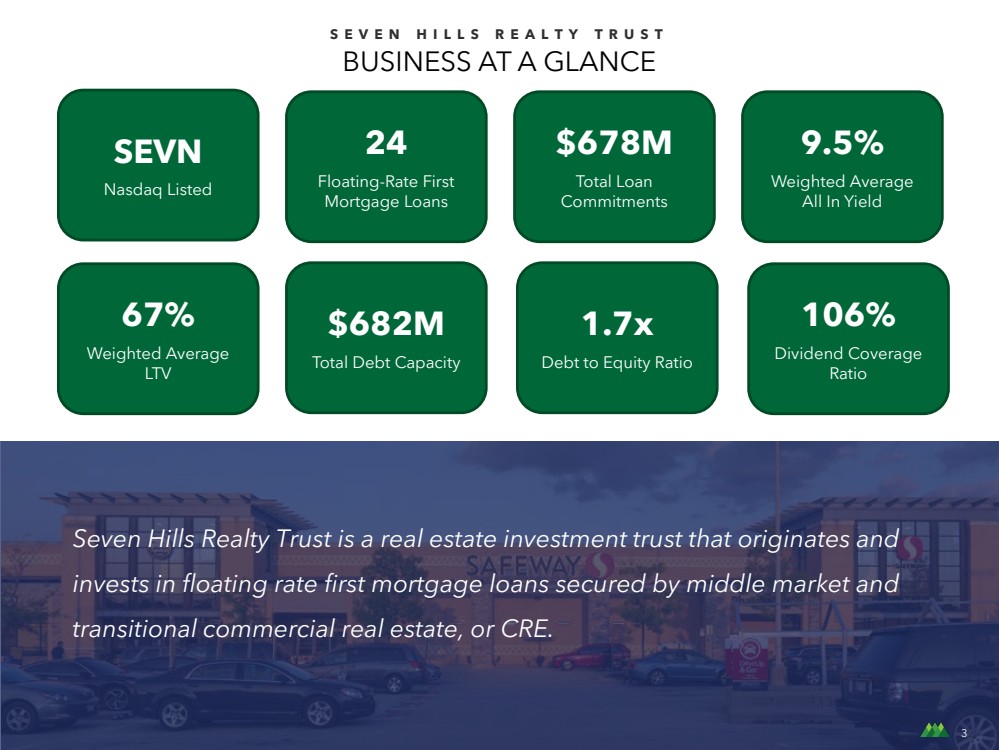
BUSINESS AT A GLANCE
Seven Hills Realty Trust is a real estate investment trust that originates and
invests in floating rate first mortgage loans secured by middle market and
transitional commercial real estate, or CRE.
3
1.7x
Debt to Equity Ratio
106%
Dividend Coverage
Ratio
$682M
Total Debt Capacity
67%
Weighted Average
LTV
9.5%
Weighted Average
All In Yield
$678M
Total Loan
Commitments
24
Floating-Rate First
Mortgage Loans
SEVN
Nasdaq Listed |

| 4
SEVEN HILLS REALTY TRUST
• 100% invested in floating rate first mortgage loans.
• Diversified across geographies, sponsors and property types.
• Emphasis on strong credit, visible cash flow and moderate LTV.
High Quality Portfolio
• Total shareholder returns have significantly outperformed the FTSE Nareit /
Mortgage Commercial Financing Index since the beginning of 2022.
• Well covered dividend with opportunity to enhance valuation as
Distributable Earnings grow.
Strong Return Profile
• Positioned favorably to capitalize on liquidity concerns in the banking
sector and slowdown in the CLO market.
• Growing loan origination pipeline with ample liquidity to take advantage
of enhanced returns.
Attractive Market
Opportunity
• Proven investment professionals averaging over 20 years experience in real
estate lending with deep relationships across the CRE space.
• Differentiated client-focused mortgage origination process.
• Strong shareholder alignment with ~12% ownership of SEVN equity.
Managed by
Tremont Realty Capital
• Approximately $36 billion in assets under management with over 600 real
estate professionals in more than 30 offices across the U.S.
• RMR’s expertise in owning and managing real estate provides unrivaled
real time insight into local market conditions and property sector
performance.
Integrated with
RMR Real Estate Platform
COMPELLING INVESTMENT OPPORTUNITY
Senior secured, diversified loan portfolio managed by an established CRE lender with an
impressive track record and supported by a nationwide real estate platform.
4 |
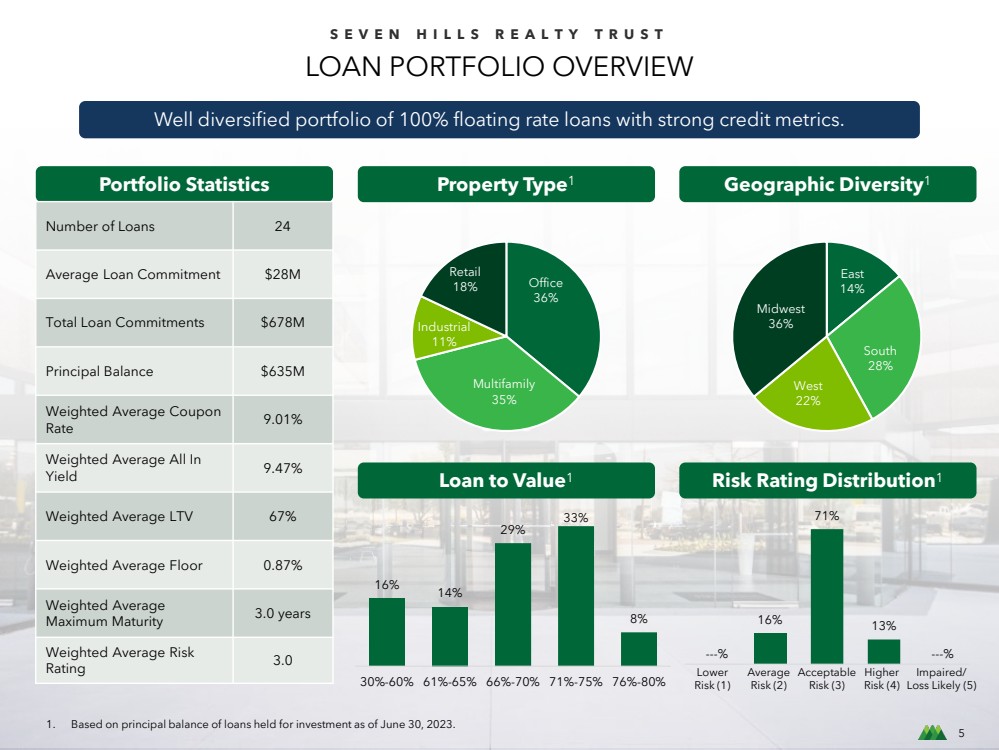
| 5
SEVEN HILLS REALTY TRUST
LOAN PORTFOLIO OVERVIEW
Portfolio Statistics
Number of Loans 24
Average Loan Commitment $28M
Total Loan Commitments $678M
Principal Balance $635M
Weighted Average Coupon
Rate 9.01%
Weighted Average All In
Yield 9.47%
Weighted Average LTV 67%
Weighted Average Floor 0.87%
Weighted Average
Maximum Maturity 3.0 years
Weighted Average Risk
Rating 3.0
Property Type1 Geographic Diversity1
Loan to Value1 Risk Rating Distribution1
Office
36%
Multifamily
35%
Industrial
11%
Retail
18%
East
14%
South
28%
West
22%
Midwest
36%
5
Well diversified portfolio of 100% floating rate loans with strong credit metrics.
16% 14%
29%
33%
8%
30%-60% 61%-65% 66%-70% 71%-75% 76%-80%
16%
71%
13%
1. Based on principal balance of loans held for investment as of June 30, 2023.
Lower
Risk (1)
Average
Risk (2)
Acceptable
Risk (3)
Higher
Risk (4)
Impaired/
Loss Likely (5)
---% ---% |
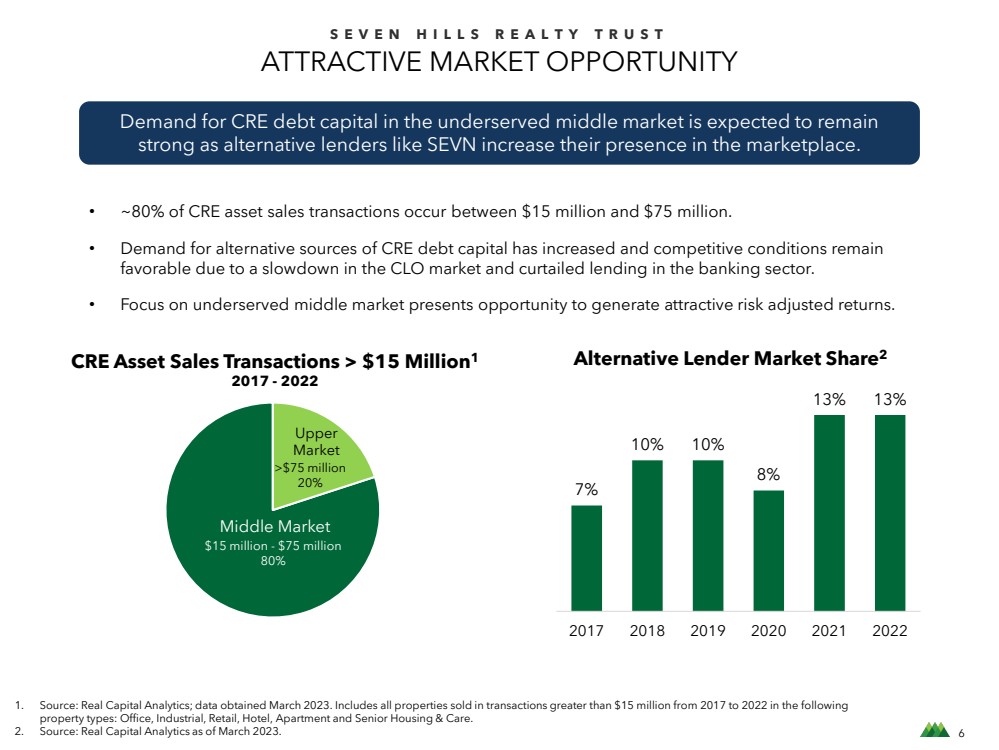
| 6
SEVEN HILLS REALTY TRUST
$15 million - $75 million
80%
>$75 million
20%
ATTRACTIVE MARKET OPPORTUNITY
Demand for CRE debt capital in the underserved middle market is expected to remain
strong as alternative lenders like SEVN increase their presence in the marketplace.
• ~80% of CRE asset sales transactions occur between $15 million and $75 million.
• Demand for alternative sources of CRE debt capital has increased and competitive conditions remain
favorable due to a slowdown in the CLO market and curtailed lending in the banking sector.
• Focus on underserved middle market presents opportunity to generate attractive risk adjusted returns.
Alternative Lender Market Share2 CRE Asset Sales Transactions > $15 Million1
2017 - 2022
1. Source: Real Capital Analytics; data obtained March 2023. Includes all properties sold in transactions greater than $15 million from 2017 to 2022 in the following
property types: Office, Industrial, Retail, Hotel, Apartment and Senior Housing & Care.
2. Source: Real Capital Analytics as of March 2023.
7%
10% 10%
8%
13% 13%
2017 2018 2019 2020 2021 2022
Middle Market
Upper
Market |
| 7
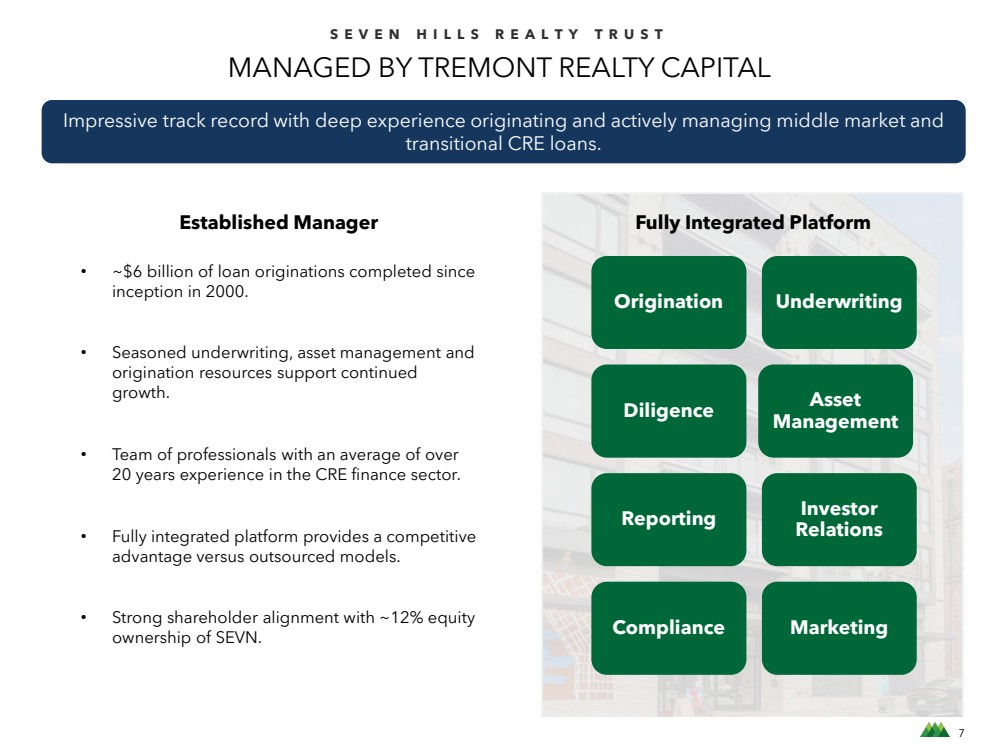
SEVEN HILLS REALTY TRUST
MANAGED BY TREMONT REALTY CAPITAL
Impressive track record with deep experience originating and actively managing middle market and
transitional CRE loans.
• ~$6 billion of loan originations completed since
inception in 2000.
• Seasoned underwriting, asset management and
origination resources support continued
growth.
• Team of professionals with an average of over
20 years experience in the CRE finance sector.
• Fully integrated platform provides a competitive
advantage versus outsourced models.
• Strong shareholder alignment with ~12% equity
ownership of SEVN.
Fully Integrated Platform
Origination Underwriting
Diligence Asset
Management
Reporting Investor
Relations
Compliance Marketing
Established Manager |

| 8
SEVEN HILLS REALTY TRUST
RIGOROUS SCREENING PROCESS
Term Sheets Issued
40 Loans
$1.4 billion
8 Loans
$225 million
3 Loans
$109 million
Tremont employs a rigorous investment screening process with a multidisciplinary review to
select the most compelling loan opportunities.
• Screened over $1 billion per month
in total loans with an average size of
~$37 million.
• Converted 8% of term sheets issued
into closed loans.
• Closed approximately 1% of loans
screened.
• Recently closed a $28 million loan in
July 2023.
417 Loans
$15 billion
Loans Screened
Applications
Closed
8
Production Statistics
June 2023 Trailing Twelve Months |
| 9
SEVEN HILLS REALTY TRUST
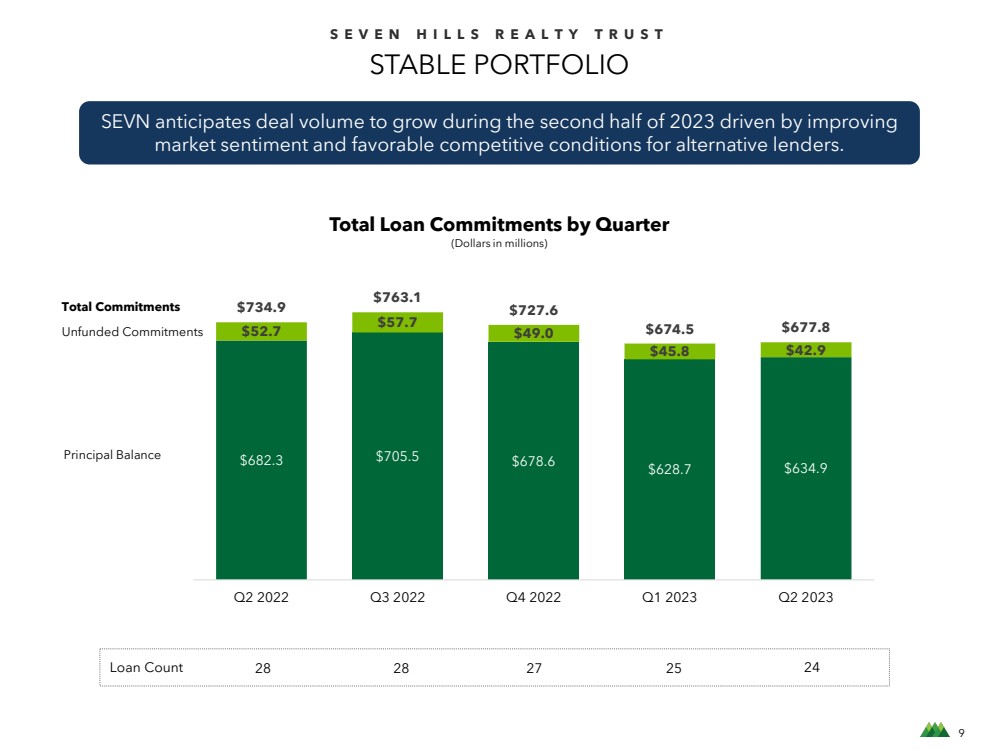
STABLE PORTFOLIO
SEVN anticipates deal volume to grow during the second half of 2023 driven by improving
market sentiment and favorable competitive conditions for alternative lenders.
$682.3 $705.5 $678.6 $628.7 $634.9
$52.7 $57.7 $49.0
$45.8 $42.9
$734.9 $763.1
$727.6
$674.5 $677.8
Q2 2022 Q3 2022 Q4 2022 Q1 2023 Q2 2023
Total Loan Commitments by Quarter
(Dollars in millions)
Total Commitments
Unfunded Commitments
Principal Balance
Loan Count 28 28 27 25 24 |
| 10
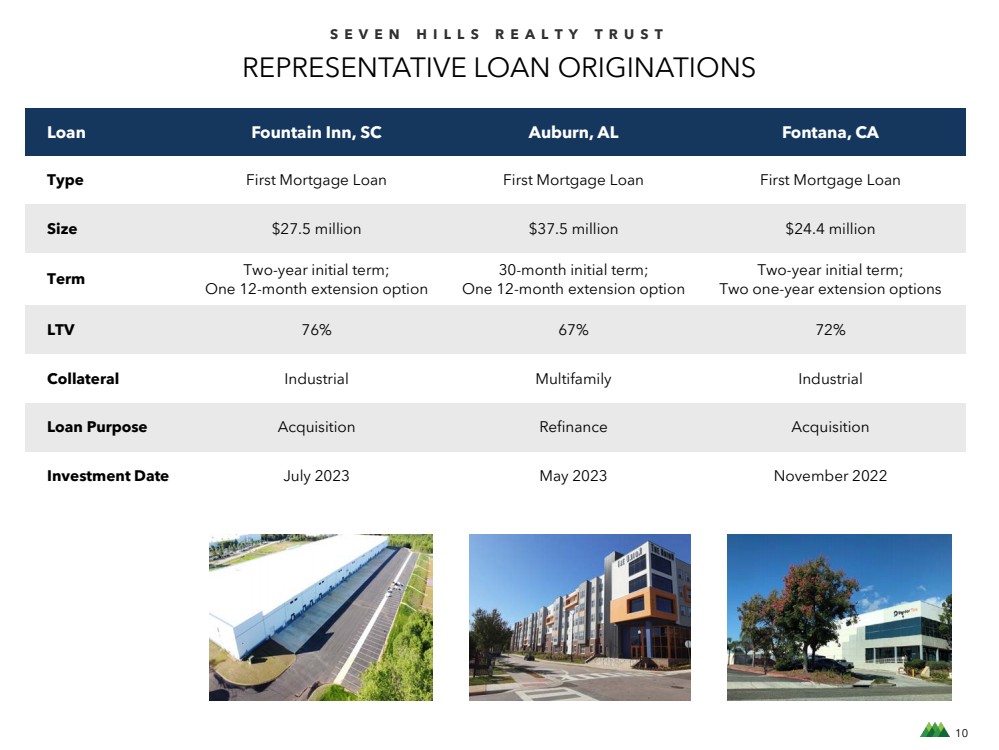
SEVEN HILLS REALTY TRUST
Loan Fountain Inn, SC Auburn, AL Fontana, CA
Type First Mortgage Loan First Mortgage Loan First Mortgage Loan
Size $27.5 million $37.5 million $24.4 million
Term Two-year initial term;
One 12-month extension option
30-month initial term;
One 12-month extension option
Two-year initial term;
Two one-year extension options
LTV 76% 67% 72%
Collateral Industrial Multifamily Industrial
Loan Purpose Acquisition Refinance Acquisition
Investment Date July 2023 May 2023 November 2022
REPRESENTATIVE LOAN ORIGINATIONS |

| 11
SEVEN HILLS REALTY TRUST
SECOND QUARTER PERFORMANCE
• Grew second quarter Adjusted
Distributable Earnings per common
share more than 50% over the prior
year period.
• Closed one loan during the quarter
and another just after quarter end for
total commitments of $65 million
dollars.
• Received $18 million of loan
repayments, demonstrating strong
underwriting and sponsors achieving
their business plans.
• Covered quarterly dividend by 106%.
Strong earnings growth supported by a diversified floating rate portfolio and rising interest rates.
Adjusted Distributable Earnings
per Common Share
Q2 2023 Highlights
$0.24
$0.27
$0.37 $0.39 $0.37
Q2 2022 Q3 2022 Q4 2022 Q1 2023 Q2 2023
Dividend
Coverage 96% 108% 106% 111% 106% |

| 12
SEVEN HILLS REALTY TRUST
12
Dividends per Common Share
$0.15
$0.25 $0.25 $0.25 $0.25
$0.35 $0.35 $0.35
Sep 2021 Feb 2022 May 2022 Aug 2022 Nov 2022 Feb 2023 May 2023 Aug 2023 1
FOCUSED ON CREATING VALUE
Distributable Earnings growth has resulted in meaningful dividend increases and significant
outperformance relative to the industry benchmark.
1. Paid fourth quarter dividend of $0.15 per common share in September 2021 in anticipation of the Merger closing.
2. Source: FactSet. Benchmark refers to FTSE Nareit Mortgage / Commercial Financing Index.
Total Shareholder Return2
Q1 2022 – Q2 2023
16%
-21%
SEVN Benchmark
SEVN Outperformed
Benchmark by 37% |
| 13
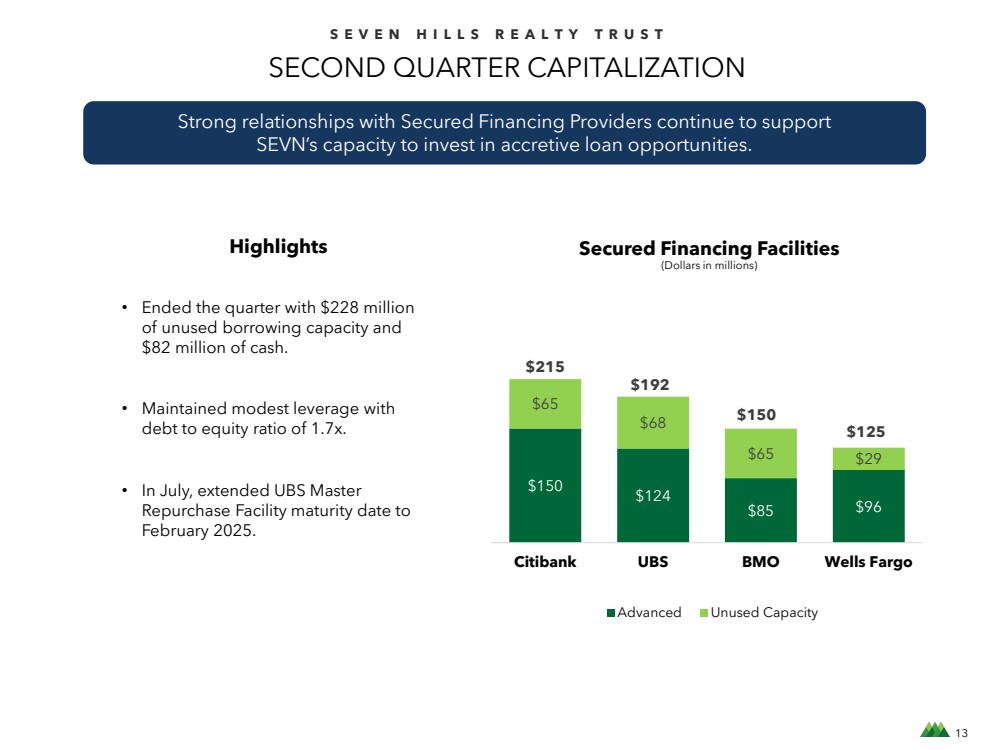
SEVEN HILLS REALTY TRUST
SECOND QUARTER CAPITALIZATION
$150 $124
$85 $96
$65
$68
$65 $29
$215
$192
$150
$125
Citibank UBS BMO Wells Fargo
Advanced Unused Capacity
Secured Financing Facilities
(Dollars in millions)
Strong relationships with Secured Financing Providers continue to support
SEVN’s capacity to invest in accretive loan opportunities.
Highlights
• Ended the quarter with $228 million
of unused borrowing capacity and
$82 million of cash.
• Maintained modest leverage with
debt to equity ratio of 1.7x.
• In July, extended UBS Master
Repurchase Facility maturity date to
February 2025. |

| 14
SEVEN HILLS REALTY TRUST
INTEREST RATE SENSITIVITY
Annualized Impact to Net Interest Income per Share1
As of June 30, 2023
Increases in interest rates benefit SEVN's 100% floating rate loan portfolio, while floors in SEVN's
loan portfolio help to protect it from interest rate declines.
1. The above table illustrates the incremental impact on SEVN’s annual income from investments, net, due to hypothetical increases in SOFR, taking into consideration SEVN’s
borrowers’ interest rate floors as of June 30, 2023. The results in the table above are based on SEVN’s loan portfolio and debt outstanding at June 30, 2023. Any changes to the mix of
SEVN’s investments or debt outstanding could impact the interest rate sensitivity analysis. This illustration is not meant to forecast future results. 14
($0.12)
($0.10)
($0.08)
($0.05)
($0.03)
$0.00
$0.03
$0.06
$0.09
$0.12
$0.15
($0.15)
($0.10)
($0.05)
$0.00
$0.05
$0.10
$0.15
$0.20
-125 bps -100 bps -75 bps -50 bps -25 bps 0 bps +25 bps +50 bps +75 bps +100 bps +125 bps
Interest Rate Changes |
| 15
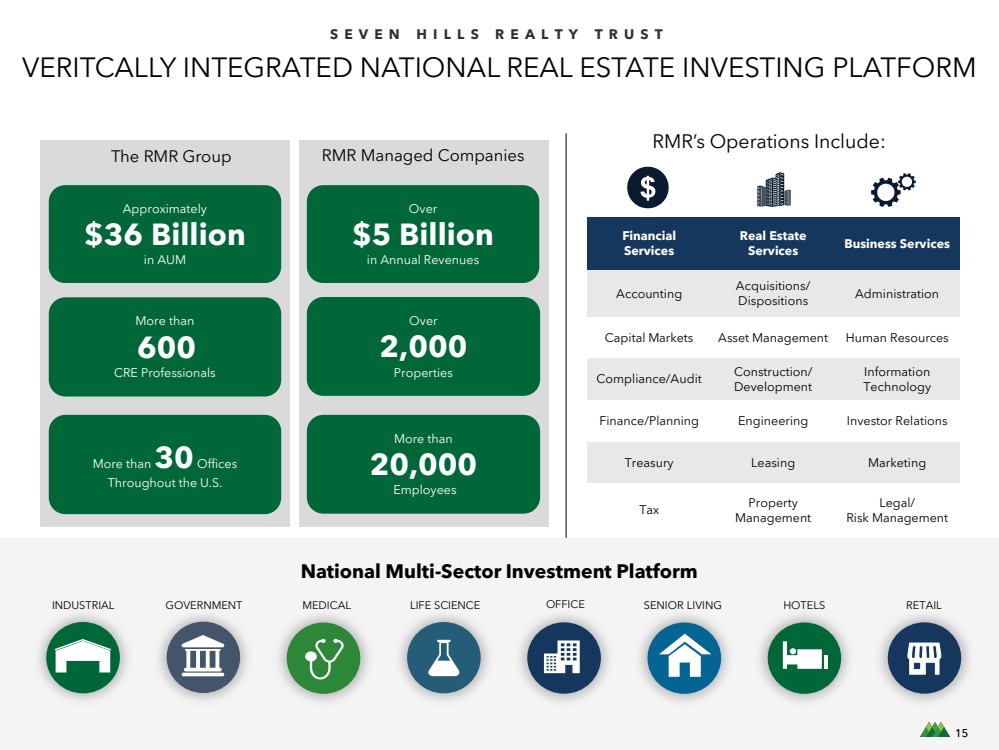
SEVEN HILLS REALTY TRUST
RMR’s Operations Include:
National Multi-Sector Investment Platform
INDUSTRIAL GOVERNMENT MEDICAL LIFE SCIENCE OFFICE SENIOR LIVING HOTELS RETAIL
RMR Managed Companies
More than
20,000
Employees
Over
2,000
Properties
Over
$5 Billion
in Annual Revenues
Approximately
$36 Billion
in AUM
More than
600
CRE Professionals
More than 30 Offices
Throughout the U.S.
Financial
Services
Real Estate
Services Business Services
Accounting Acquisitions/
Dispositions Administration
Capital Markets Asset Management Human Resources
Compliance/Audit Construction/
Development
Information
Technology
Finance/Planning Engineering Investor Relations
Treasury Leasing Marketing
Tax Property
Management
Legal/
Risk Management
VERITCALLY INTEGRATED NATIONAL REAL ESTATE INVESTING PLATFORM
The RMR Group
15 |
| APPENDIX
|
| 17
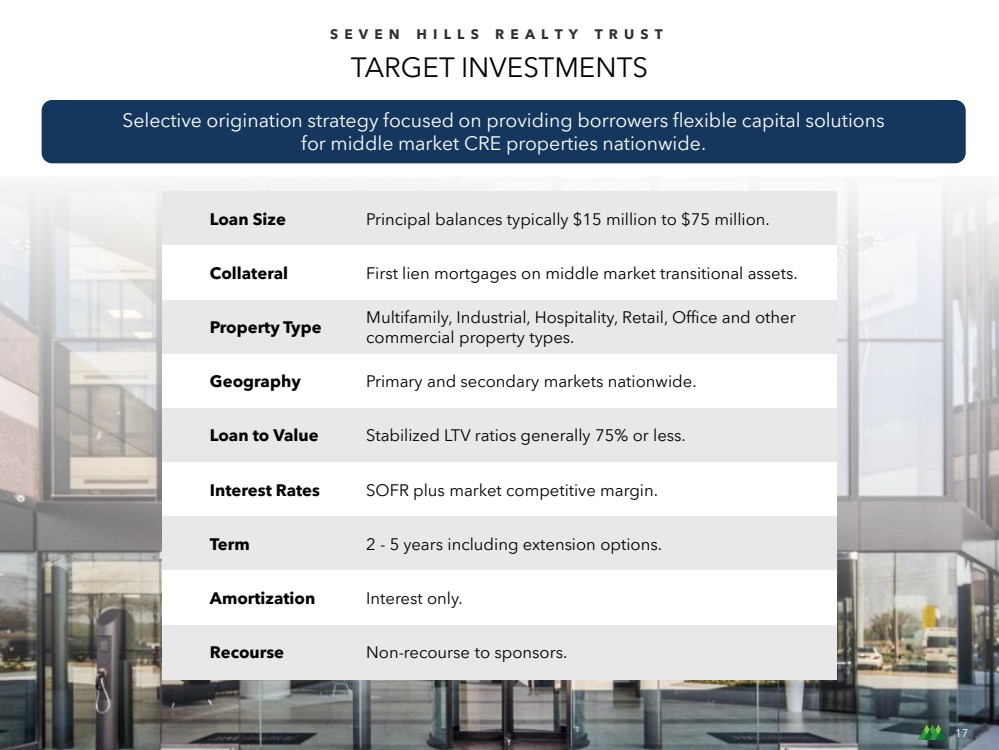
SEVEN HILLS REALTY TRUST
TARGET INVESTMENTS
Selective origination strategy focused on providing borrowers flexible capital solutions
for middle market CRE properties nationwide.
Loan Size Principal balances typically $15 million to $75 million.
Collateral First lien mortgages on middle market transitional assets.
Property Type Multifamily, Industrial, Hospitality, Retail, Office and other
commercial property types.
Geography Primary and secondary markets nationwide.
Loan to Value Stabilized LTV ratios generally 75% or less.
Interest Rates SOFR plus market competitive margin.
Term 2 - 5 years including extension options.
Amortization Interest only.
Recourse Non-recourse to sponsors.
17 |
| 18
SEVEN HILLS REALTY TRUST
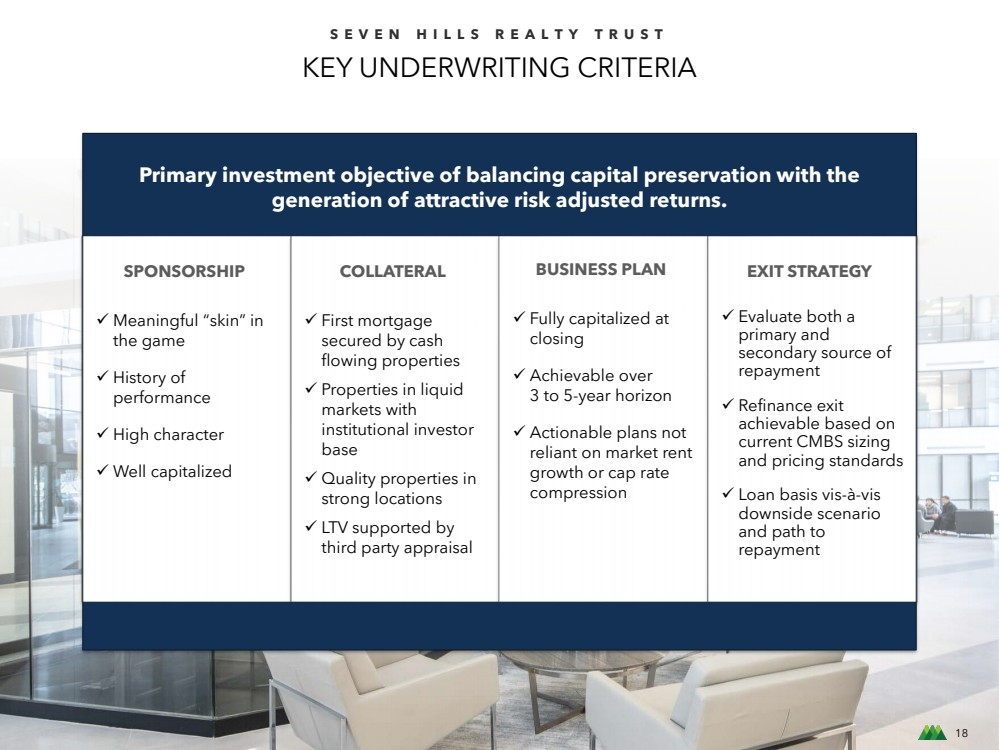
KEY UNDERWRITING CRITERIA
Primary investment objective of balancing capital preservation with the
generation of attractive risk adjusted returns.
SPONSORSHIP
Meaningful skin in
the game
History of
performance
High character
Well capitalized
COLLATERAL
First mortgage
secured by cash
flowing properties
Properties in liquid
markets with
institutional investor
base
Quality properties in
strong locations
LTV supported by
third party appraisal
BUSINESS PLAN
Fully capitalized at
closing
Achievable over
3 to 5-year horizon
Actionable plans not
reliant on market rent
growth or cap rate
compression
EXIT STRATEGY
Evaluate both a
primary and
secondary source of
repayment
Refinance exit
achievable based on
current CMBS sizing
and pricing standards
Loan basis vis-à-vis
downside scenario
and path to
repayment
18 |

| 19
SEVEN HILLS REALTY TRUST
LOAN INVESTMENT DETAILS
(1) (Dollars in thousands)
First mortgage loans as of June 30, 2023:
# Location Property Type
Origination
Date
Committed
Principal
Amount
Principal
Balance
Coupon
Rate
All in
Yield
Maturity
Date
Maximum
Maturity
Date LTV
Risk
Rating
1 Olmsted Falls, OH Multifamily 01/28/2021 $ 54,575 $ 46,085 S + 4.00% S + 4.64% 01/28/2024 01/28/2026 63% 3
2 Dallas, TX Office 08/25/2021 50,000 43,450 S + 3.25% S + 3.61% 08/25/2024 08/25/2026 72% 4
3 Passaic, NJ Industrial 09/08/2022 47,000 38,440 S + 3.85% S + 4.22% 09/08/2025 09/08/2027 69% 3
4 Brandywine, MD Retail 03/29/2022 42,500 42,200 S + 3.85% S + 4.25% 03/29/2025 03/29/2027 62% 2
5 West Bloomfield, MI Retail 12/16/2021 42,500 37,659 S + 3.85% S + 4.66% 12/16/2023 12/16/2024 59% 3
6 Auburn, AL Multifamily 05/11/2023 37,500 37,500 S + 3.25% S + 3.96% 11/11/2025 11/11/2026 67% 3
7 Starkville, MS Multifamily 03/22/2022 37,250 36,918 S + 4.00% S + 4.32% 03/22/2025 03/22/2027 70% 4
8 Farmington Hills, MI Multifamily 05/24/2022 31,520 28,983 S + 3.15% S + 3.50% 05/24/2025 05/24/2027 75% 3
9 Downers Grove, IL Office 09/25/2020 30,000 29,500 S + 4.25% S + 4.69% 11/25/2023 11/25/2024 67% 2
10 Las Vegas, NV Multifamily 06/10/2022 28,950 24,729 S + 3.30% S + 4.03% 06/10/2025 06/10/2027 60% 3
11 Plano, TX Office 07/01/2021 27,385 26,463 S + 4.75% S + 5.16% 07/01/2024 07/01/2026 78% 3
12 Carlsbad, CA Office 10/27/2021 24,750 24,130 S + 3.25% S + 3.58% 10/27/2024 10/27/2026 78% 3
13 Fontana, CA Industrial 11/18/2022 24,355 22,000 S + 3.75% S + 4.28% 11/18/2024 11/18/2026 72% 3
14 St. Louis, MO Office 12/19/2018 23,867 23,867 S + 3.25% S + 3.74% 12/19/2023 12/19/2023 72% 3 |

| 20
SEVEN HILLS REALTY TRUST
LOAN INVESTMENT DETAILS (Continued)
(Dollars in thousands) (1)
First mortgage loans as of June 30, 2023:
# Location Property Type
Origination
Date
Committed
Principal
Amount
Principal
Balance
Coupon
Rate
All in
Yield
Maturity
Date
Maximum
Maturity
Date LTV
Risk
Rating
15 Downers Grove, IL Office 12/09/2021 23,530 23,530 S + 4.25% S + 4.57% 12/09/2024 12/09/2026 72% 3
16 Dublin, OH Office 02/18/2020 22,507 22,507 S + 5.25% S + 5.31% 08/16/2023 08/16/2023 33% 3
17 Bellevue, WA Office 11/05/2021 21,000 20,000 S + 3.85% S + 4.19% 11/05/2024 11/05/2026 68% 3
18 Portland, OR Multifamily 07/09/2021 19,688 19,688 S + 3.57% S + 3.97% 07/09/2024 07/09/2026 75% 3
19 Ames, IA Multifamily 11/15/2021 18,000 17,925 S + 3.80% S + 4.13% 11/15/2024 11/15/2026 71% 2
20 Sandy Springs, GA Retail 09/23/2021 16,488 15,287 S + 3.75% S + 4.10% 09/23/2024 09/23/2026 72% 3
21 Delray Beach, FL Retail 03/18/2022 16,000 15,602 S + 4.25% S + 4.91% 03/18/2024 03/18/2026 56% 3
22 Westminster, CO Office 05/25/2021 15,750 15,750 S + 3.75% S + 4.25% 05/25/2024 05/25/2026 66% 2
23 Portland, OR Multifamily 07/30/2021 13,400 13,400 S + 3.57% S + 3.98% 07/30/2024 07/30/2026 71% 3
24 Allentown, PA Industrial 01/24/2020 9,307 9,307 S + 3.50% S + 4.03% 01/24/2024 01/24/2025 67% 3
Total/weighted average $ 677,822 $ 634,920 S + 3.80% S + 4.26% 67% 3.0 |
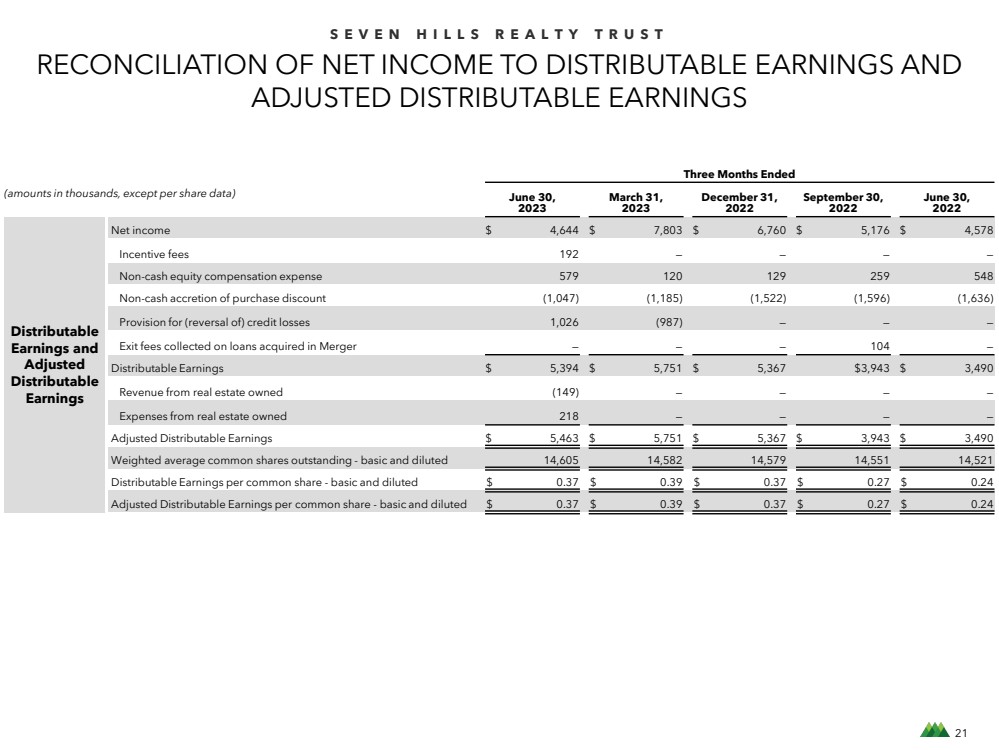
| 21
SEVEN HILLS REALTY TRUST
RECONCILIATION OF NET INCOME TO DISTRIBUTABLE EARNINGS AND
ADJUSTED DISTRIBUTABLE EARNINGS
Three Months Ended
June 30,
2023
March 31,
2023
December 31,
2022
September 30,
2022
June 30,
2022
Distributable
Earnings and
Adjusted
Distributable
Earnings
Net income $ 4,644 $ 7,803 $ 6,760 $ 5,176 $ 4,578
Incentive fees 192 — — — —
Non-cash equity compensation expense 579 120 129 259 548
Non-cash accretion of purchase discount (1,047) (1,185) (1,522) (1,596) (1,636)
Provision for (reversal of) credit losses 1,026 (987) — — —
Exit fees collected on loans acquired in Merger — — — 104 —
Distributable Earnings $ 5,394 $ 5,751 $ 5,367 $3,943 $ 3,490
Revenue from real estate owned (149) — — — —
Expenses from real estate owned 218 — — — —
Adjusted Distributable Earnings $ 5,463 $ 5,751 $ 5,367 $ 3,943 $ 3,490
Weighted average common shares outstanding - basic and diluted 14,605 14,582 14,579 14,551 14,521
Distributable Earnings per common share - basic and diluted $ 0.37 $ 0.39 $ 0.37 $ 0.27 $ 0.24
Adjusted Distributable Earnings per common share - basic and diluted $ 0.37 $ 0.39 $ 0.37 $ 0.27 $ 0.24
(amounts in thousands, except per share data) |
| 22
SEVEN HILLS REALTY TRUST
NON-GAAP FINANCIAL MEASURES AND CERTAIN DEFINITIONS
We present Distributable Earnings, Distributable Earnings per common share, Adjusted Distributable Earnings and Adjusted Distributable Earnings per common share, which are
considered non-GAAP financial measures within the meaning of the applicable SEC rules. These non-GAAP financial measures do not represent net income, net income per common
share or cash generated from operating activities and should not be considered as alternatives to net income or net income per common share determined in accordance with GAAP
or as an indication of our cash flows from operations determined in accordance with GAAP, a measure of our liquidity or operating performance or an indication of funds available for
our cash needs. In addition, our methodologies for calculating these non-GAAP financial measures may differ from the methodologies employed by other companies to calculate the
same or similar supplemental performance measures; therefore, our reported Distributable Earnings, Distributable Earnings per common share, Adjusted Distributable Earnings and
Adjusted Distributable Earnings per common share may not be comparable to distributable earnings, distributable earnings per common share, adjusted distributable earnings and
adjusted distributable earnings per common share as reported by other companies.
In order to maintain our qualification for taxation as a REIT, we are generally required to distribute substantially all of our taxable income, subject to certain adjustments, to our
shareholders. We believe that one of the factors that investors consider important in deciding whether to buy or sell securities of a REIT is its distribution rate. Over time, Distributable
Earnings, Distributable Earnings per common share, Adjusted Distributable Earnings and Adjusted Distributable Earnings per common share may be useful indicators of distributions
to our shareholders and are measures that are considered by our Board of Trustees when determining the amount of distributions. We believe that Distributable Earnings,
Distributable Earnings per common share, Adjusted Distributable Earnings and Adjusted Distributable Earnings per common share provide meaningful information to consider in
addition to net income, net income per common share and cash flows from operating activities determined in accordance with GAAP. These measures help us to evaluate our
performance excluding the effects of certain transactions, the variability of any management incentive fees that may be paid or payable and GAAP adjustments that we believe are not
necessarily indicative of our current loan portfolio and operations. In addition, Distributable Earnings is used in determining the amount of base management and management
incentive fees payable by us to Tremont under our management agreement.
Distributable Earnings:
We calculate Distributable Earnings and Distributable Earnings per common share as net income and net income per common share, respectively, computed in accordance with
GAAP, including realized losses not otherwise included in net income determined in accordance with GAAP, and excluding: (a) the management incentive fees earned by our
Manager, if any; (b) depreciation and amortization of REO and related intangible assets, if any; (c) non-cash equity compensation expense; (d) unrealized gains, losses and other similar
non-cash items that are included in net income for the period of the calculation (regardless of whether such items are included in or deducted from net income or in other
comprehensive income under GAAP), if any; and (e) one-time events pursuant to changes in GAAP and certain non-cash items, if any. Distributable Earnings are reduced for realized
losses on loan investments when amounts are deemed uncollectable. This is generally at the time a loan is repaid, or in the case of foreclosure, when the underlying asset is sold, but
may also be when, in our determination, it is nearly certain that all amounts due will not be collected. The realized loss amount reflected in Distributable Earnings will equal the
difference between the cash received or expected to be received and the carrying value of the asset.
Adjusted Distributable Earnings:
We define Adjusted Distributable Earnings and Adjusted Distributable Earnings per common share as Distributable Earnings and Distributable Earnings per common share,
respectively, excluding the effects of certain non-recurring transactions and revenues and expenses from REO. |
| 23
SEVEN HILLS REALTY TRUST
NON-GAAP FINANCIAL MEASURES AND CERTAIN DEFINITIONS
All In Yield:
All In Yield represents the yield on a loan, including amortization of deferred fees over the initial term of the loan and excluding any purchase
discount accretion.
CLO:
CLO refers to collateralized loan obligations.
CMBS:
CMBS refers to commercial mortgage-backed securities.
GAAP:
GAAP refers to generally accepted accounting principles.
AUM:
AUM refers to assets under management.
LTV:
Loan to value ratio, or LTV, represents the initial loan amount divided by the underwritten in-place value of the underlying collateral at closing.
Master Repurchase Facilities:
Collectively, we refer to the master repurchase facilities with UBS AG, or UBS, Citibank, N.A., or Citibank, and Wells Fargo, National Association, or
Wells Fargo, as our Master Repurchase Facilities.
Maximum Maturity:
Maximum Maturity assumes all borrower loan extension options have been exercised, which options are subject to the borrower meeting certain
conditions.
Merger:
On September 30, 2021, TRMT merged with and into us. We refer to this transaction as the Merger.
REO:
REO refers to real estate owned.
Secured Financing Facilities:
Secured Financing Facilities refer to the Master Repurchase Facilities and our BMO Facility. Amounts advanced under the facility loan agreements
are pursuant to separate facility agreements and the security agreement with BMO Harris Bank N.A., or BMO, that we refer to as our BMO Facility.
SOFR:
SOFR refers to the Secured Overnight Financing Rate.
TRMT:
TRMT refers to Tremont Mortgage Trust. |

| TWO NEWTON PLACE | 255 WASHINGTON STREET,
SUITE 300 | NEWTON, MASSACHUSETTS 02458
SEVNREIT.COM |
| X |
- DefinitionBoolean flag that is true when the XBRL content amends previously-filed or accepted submission.
| Name: |
dei_AmendmentFlag |
| Namespace Prefix: |
dei_ |
| Data Type: |
xbrli:booleanItemType |
| Balance Type: |
na |
| Period Type: |
duration |
|
| X |
- DefinitionFor the EDGAR submission types of Form 8-K: the date of the report, the date of the earliest event reported; for the EDGAR submission types of Form N-1A: the filing date; for all other submission types: the end of the reporting or transition period. The format of the date is YYYY-MM-DD.
| Name: |
dei_DocumentPeriodEndDate |
| Namespace Prefix: |
dei_ |
| Data Type: |
xbrli:dateItemType |
| Balance Type: |
na |
| Period Type: |
duration |
|
| X |
- DefinitionThe type of document being provided (such as 10-K, 10-Q, 485BPOS, etc). The document type is limited to the same value as the supporting SEC submission type, or the word 'Other'.
| Name: |
dei_DocumentType |
| Namespace Prefix: |
dei_ |
| Data Type: |
dei:submissionTypeItemType |
| Balance Type: |
na |
| Period Type: |
duration |
|
| X |
- DefinitionAddress Line 1 such as Attn, Building Name, Street Name
| Name: |
dei_EntityAddressAddressLine1 |
| Namespace Prefix: |
dei_ |
| Data Type: |
xbrli:normalizedStringItemType |
| Balance Type: |
na |
| Period Type: |
duration |
|
| X |
- DefinitionAddress Line 2 such as Street or Suite number
| Name: |
dei_EntityAddressAddressLine2 |
| Namespace Prefix: |
dei_ |
| Data Type: |
xbrli:normalizedStringItemType |
| Balance Type: |
na |
| Period Type: |
duration |
|
| X |
- DefinitionAddress Line 3 such as an Office Park
| Name: |
dei_EntityAddressAddressLine3 |
| Namespace Prefix: |
dei_ |
| Data Type: |
xbrli:normalizedStringItemType |
| Balance Type: |
na |
| Period Type: |
duration |
|
| X |
- Definition
+ References
+ Details
| Name: |
dei_EntityAddressCityOrTown |
| Namespace Prefix: |
dei_ |
| Data Type: |
xbrli:normalizedStringItemType |
| Balance Type: |
na |
| Period Type: |
duration |
|
| X |
- DefinitionCode for the postal or zip code
| Name: |
dei_EntityAddressPostalZipCode |
| Namespace Prefix: |
dei_ |
| Data Type: |
xbrli:normalizedStringItemType |
| Balance Type: |
na |
| Period Type: |
duration |
|
| X |
- DefinitionName of the state or province.
| Name: |
dei_EntityAddressStateOrProvince |
| Namespace Prefix: |
dei_ |
| Data Type: |
dei:stateOrProvinceItemType |
| Balance Type: |
na |
| Period Type: |
duration |
|
| X |
- DefinitionA unique 10-digit SEC-issued value to identify entities that have filed disclosures with the SEC. It is commonly abbreviated as CIK. Reference 1: http://www.xbrl.org/2003/role/presentationRef
-Publisher SEC
-Name Exchange Act
-Number 240
-Section 12
-Subsection b-2
| Name: |
dei_EntityCentralIndexKey |
| Namespace Prefix: |
dei_ |
| Data Type: |
dei:centralIndexKeyItemType |
| Balance Type: |
na |
| Period Type: |
duration |
|
| X |
- DefinitionIndicate if registrant meets the emerging growth company criteria. Reference 1: http://www.xbrl.org/2003/role/presentationRef
-Publisher SEC
-Name Exchange Act
-Number 240
-Section 12
-Subsection b-2
| Name: |
dei_EntityEmergingGrowthCompany |
| Namespace Prefix: |
dei_ |
| Data Type: |
xbrli:booleanItemType |
| Balance Type: |
na |
| Period Type: |
duration |
|
| X |
- DefinitionCommission file number. The field allows up to 17 characters. The prefix may contain 1-3 digits, the sequence number may contain 1-8 digits, the optional suffix may contain 1-4 characters, and the fields are separated with a hyphen.
| Name: |
dei_EntityFileNumber |
| Namespace Prefix: |
dei_ |
| Data Type: |
dei:fileNumberItemType |
| Balance Type: |
na |
| Period Type: |
duration |
|
| X |
- DefinitionTwo-character EDGAR code representing the state or country of incorporation.
| Name: |
dei_EntityIncorporationStateCountryCode |
| Namespace Prefix: |
dei_ |
| Data Type: |
dei:edgarStateCountryItemType |
| Balance Type: |
na |
| Period Type: |
duration |
|
| X |
- DefinitionThe exact name of the entity filing the report as specified in its charter, which is required by forms filed with the SEC. Reference 1: http://www.xbrl.org/2003/role/presentationRef
-Publisher SEC
-Name Exchange Act
-Number 240
-Section 12
-Subsection b-2
| Name: |
dei_EntityRegistrantName |
| Namespace Prefix: |
dei_ |
| Data Type: |
xbrli:normalizedStringItemType |
| Balance Type: |
na |
| Period Type: |
duration |
|
| X |
- DefinitionThe Tax Identification Number (TIN), also known as an Employer Identification Number (EIN), is a unique 9-digit value assigned by the IRS. Reference 1: http://www.xbrl.org/2003/role/presentationRef
-Publisher SEC
-Name Exchange Act
-Number 240
-Section 12
-Subsection b-2
| Name: |
dei_EntityTaxIdentificationNumber |
| Namespace Prefix: |
dei_ |
| Data Type: |
dei:employerIdItemType |
| Balance Type: |
na |
| Period Type: |
duration |
|
| X |
- DefinitionLocal phone number for entity.
| Name: |
dei_LocalPhoneNumber |
| Namespace Prefix: |
dei_ |
| Data Type: |
xbrli:normalizedStringItemType |
| Balance Type: |
na |
| Period Type: |
duration |
|
| X |
- DefinitionBoolean flag that is true when the Form 8-K filing is intended to satisfy the filing obligation of the registrant as pre-commencement communications pursuant to Rule 13e-4(c) under the Exchange Act. Reference 1: http://www.xbrl.org/2003/role/presentationRef
-Publisher SEC
-Name Exchange Act
-Number 240
-Section 13e
-Subsection 4c
| Name: |
dei_PreCommencementIssuerTenderOffer |
| Namespace Prefix: |
dei_ |
| Data Type: |
xbrli:booleanItemType |
| Balance Type: |
na |
| Period Type: |
duration |
|
| X |
- DefinitionBoolean flag that is true when the Form 8-K filing is intended to satisfy the filing obligation of the registrant as pre-commencement communications pursuant to Rule 14d-2(b) under the Exchange Act. Reference 1: http://www.xbrl.org/2003/role/presentationRef
-Publisher SEC
-Name Exchange Act
-Number 240
-Section 14d
-Subsection 2b
| Name: |
dei_PreCommencementTenderOffer |
| Namespace Prefix: |
dei_ |
| Data Type: |
xbrli:booleanItemType |
| Balance Type: |
na |
| Period Type: |
duration |
|
| X |
- DefinitionTitle of a 12(b) registered security. Reference 1: http://www.xbrl.org/2003/role/presentationRef
-Publisher SEC
-Name Exchange Act
-Number 240
-Section 12
-Subsection b
| Name: |
dei_Security12bTitle |
| Namespace Prefix: |
dei_ |
| Data Type: |
dei:securityTitleItemType |
| Balance Type: |
na |
| Period Type: |
duration |
|
| X |
- DefinitionName of the Exchange on which a security is registered. Reference 1: http://www.xbrl.org/2003/role/presentationRef
-Publisher SEC
-Name Exchange Act
-Number 240
-Section 12
-Subsection d1-1
| Name: |
dei_SecurityExchangeName |
| Namespace Prefix: |
dei_ |
| Data Type: |
dei:edgarExchangeCodeItemType |
| Balance Type: |
na |
| Period Type: |
duration |
|
| X |
- DefinitionBoolean flag that is true when the Form 8-K filing is intended to satisfy the filing obligation of the registrant as soliciting material pursuant to Rule 14a-12 under the Exchange Act. Reference 1: http://www.xbrl.org/2003/role/presentationRef
-Publisher SEC
-Name Exchange Act
-Section 14a
-Number 240
-Subsection 12
| Name: |
dei_SolicitingMaterial |
| Namespace Prefix: |
dei_ |
| Data Type: |
xbrli:booleanItemType |
| Balance Type: |
na |
| Period Type: |
duration |
|
| X |
- DefinitionTrading symbol of an instrument as listed on an exchange.
| Name: |
dei_TradingSymbol |
| Namespace Prefix: |
dei_ |
| Data Type: |
dei:tradingSymbolItemType |
| Balance Type: |
na |
| Period Type: |
duration |
|
| X |
- DefinitionBoolean flag that is true when the Form 8-K filing is intended to satisfy the filing obligation of the registrant as written communications pursuant to Rule 425 under the Securities Act. Reference 1: http://www.xbrl.org/2003/role/presentationRef
-Publisher SEC
-Name Securities Act
-Number 230
-Section 425
| Name: |
dei_WrittenCommunications |
| Namespace Prefix: |
dei_ |
| Data Type: |
xbrli:booleanItemType |
| Balance Type: |
na |
| Period Type: |
duration |
|
Seven Hills Realty (NASDAQ:SEVN)
과거 데이터 주식 차트
부터 4월(4) 2024 으로 5월(5) 2024

Seven Hills Realty (NASDAQ:SEVN)
과거 데이터 주식 차트
부터 5월(5) 2023 으로 5월(5) 2024
