Form 8-K - Current report
02 8월 2023 - 5:03AM
Edgar (US Regulatory)
false 0001376339 0001376339 2023-08-01 2023-08-01
UNITED STATES
SECURITIES AND EXCHANGE COMMISSION
WASHINGTON, DC 20549
FORM 8-K
CURRENT REPORT
PURSUANT TO SECTION 13 OR 15(d)
OF THE SECURITIES EXCHANGE ACT OF 1934
Date of Report (Date of earliest event reported): August 1, 2023
MIMEDX GROUP, INC.
(Exact name of registrant as specified in charter)
|
|
|
|
|
| Florida |
|
001-35887 |
|
26-2792552 |
| (State or other jurisdiction of incorporation) |
|
(Commission File Number) |
|
(IRS Employer Identification No.) |
1775 West Oak Commons Ct., NE, Marietta GA 30062
(Address of principal executive offices) (Zip Code)
Registrant’s telephone number, including area code: (770) 651-9100
Check the appropriate box below if the Form 8-K filing is intended to simultaneously satisfy the filing obligation of the registrant under any of the following provisions (see General Instruction A.2. below):
| ☐ |
Written communications pursuant to Rule 425 under the Securities Act (17 CFR 230.425) |
| ☐ |
Soliciting material pursuant to Rule 14a-12 under the Exchange Act (17 CFR 240.14a-12) |
| ☐ |
Pre-commencement communications pursuant to Rule 14d-2(b) under the Exchange Act (17 CFR 240.14d-2(b)) |
| ☐ |
Pre-commencement communications pursuant to Rule 13e-4(c) under the Exchange Act (17 CFR 240.13e-4(c)) |
Securities registered pursuant to Section 12(b) of the Act:
|
|
|
|
|
| Title of each class |
|
Trading
Symbol(s) |
|
Name of each exchange on which registered |
| Common Stock, $0.001 par value per share |
|
MDXG |
|
The Nasdaq Stock Market LLC |
Indicate by check mark whether the registrant is an emerging growth company as defined in Rule 405 of the Securities Act of 1933 (§ 230.405 of this chapter) or Rule 12b-2 of the Securities Exchange Act of 1934 (§ 240.12b-2 of this chapter).
Emerging growth company ☐
If an emerging growth company, indicate by check mark if the registrant has elected not to use the extended transition period for complying with any new or revised financial accounting standards provided pursuant to Section 13(a) of the Exchange Act. ☐
Important Cautionary Statement
This report includes forward-looking statements. Statements regarding: (i) future sales or sales growth; (ii) our 2023 financial goals and expectations for future financial results, including levels of Adjusted EBITDA margin, contribution margin and corporate expenses; (iii) our expectations regarding the timing and impact of new product launches; and (iv) the effectiveness of amniotic tissue as a therapy for any particular indication or condition. Additional forward-looking statements may be identified by words such as “believe,” “expect,” “may,” “plan,” “goal,” “outlook,” “potential,” “will,” “preliminary,” and similar expressions, and are based on management’s current beliefs and expectations.
Forward-looking statements are subject to risks and uncertainties, and the Company cautions investors against placing undue reliance on such statements. Actual results may differ materially from those set forth in the forward-looking statements. Factors that could cause actual results to differ from expectations include: (i) future sales are uncertain and are affected by competition, access to customers, patient access to healthcare providers, the reimbursement environment, and many other factors; (ii) the Company may change its plans due to unforeseen circumstances; (iii) our access to hospitals and health care provider facilities could be restricted as a result of any public health emergencies, like COVID-19 or other factors; (iv) the results of scientific research are uncertain and may have little or no value; (v) our ability to sell our products in other countries depends on a number of factors including adequate levels of reimbursement, market acceptance of novel therapies, and our ability to build and manage a direct sales force or third- party distribution relationship; (vi) the effectiveness of amniotic tissue as a therapy for particular indications or conditions is the subject of further scientific and clinical studies; and (vii) we may alter the timing and amount of planned expenditures for research and development based on the results regulatory developments. The Company describes additional risks and uncertainties in the Risk Factors section of its most recent annual report and quarterly reports filed with the Securities and Exchange Commission. Any forward-looking statements speak only as of the date of this report and the Company assumes no obligation to update any forward-looking statement.
| Item 2.02 |
Results of Operations and Financial Condition. |
On August 1, 2023, MiMedx Group, Inc. (the “Company”), issued a press release (the “Earnings Press Release”) announcing its results for the second quarter ended June 30, 2023. A copy of the Earnings Press Release is attached hereto as Exhibit 99.1 and is incorporated herein by reference.
The foregoing information is furnished pursuant to Item 2.02, “Results of Operations and Financial Condition”, including Exhibit 99.1 attached hereto, and shall not be deemed “filed” for purposes of Section 18 of the Securities Exchange Act of 1934, as amended (the “Exchange Act”), or otherwise subject to the liabilities of that section. It may only be incorporated by reference into another filing under the Exchange Act or Securities Act of 1933, as amended (the “Securities Act”), if such subsequent filing specifically references this Form 8-K. All information in the Earnings Press Release speaks as of the date thereof and the Company does not assume any obligation to update said information in the future. In addition, the Company disclaims any inference regarding the materiality of such information which otherwise may arise as a result of its furnishing such information under Item 2.02 of this report on Form 8-K.
| Item 7.01 |
Regulation FD Disclosure. |
On August 1, 2023, at 5 p.m. Eastern Daylight Time, the Company intends to host a conference call and webcast (the “Earnings Call”) to discuss its financial and operating results for the second quarter ended June 30, 2023. A copy of the slide presentation to be used by the Company in connection with the Earnings Call is attached hereto as Exhibit 99.2 and is incorporated herein by reference.
The foregoing information is furnished pursuant to Item 7.01, including Exhibit 99.2 attached hereto, and shall not be deemed “filed” for purposes of Section 18 of the Exchange Act, or otherwise subject to the liabilities of that section. It may only be incorporated by reference into another filing under the Exchange Act or Securities Act, if such subsequent filing specifically references this Form 8-K.
| Item 9.01 |
Financial Statements and Exhibits. |
(d) Exhibits.
SIGNATURES
Pursuant to the requirements of the Exchange Act, the Registrant has duly caused this report to be signed on its behalf by the undersigned hereunto duly authorized.
|
|
|
|
|
|
|
|
|
|
|
|
|
MIMEDX GROUP, INC. |
|
|
|
|
| August 1, 2023 |
|
|
|
By: |
|
/s/ Doug Rice |
|
|
|
|
|
|
Doug Rice Chief Financial Officer |
Exhibit 99.1
MIMEDX Announces Second Quarter 2023 Operating and Financial Results
Records Second Quarter Net Sales of $81.3 Million; an Increase of 21.5% Over the Prior Year Period
Increases Full-Year 2023 Guidance for Net Sales Growth
Welcomes Highly Successful MedTech Executive as Chief Financial Officer
Management to Host Conference Call on Tuesday, August 1, 2023, at 5:00 PM ET
MARIETTA, GA., August 1, 2023 — MiMedx Group, Inc. (Nasdaq: MDXG) (“MIMEDX” or the “Company”), today
announced operating and financial results for the second quarter 2023, which ended June 30, 2023, including net sales of $81.3 million, net income of $1.2 million and Adjusted
EBITDA1 of $14.1 million.
Joseph H. Capper, MIMEDX Chief Executive Officer, commented,
“Our second quarter results demonstrate excellent momentum in the business, as we continue to see increasing demand for our products across all sites of service. The Company’s 21.5% top-line growth
was driven by solid execution on the part of our commercial team, which continues to out-perform the market. Our Operations team also deserves tremendous credit for not only ensuring production levels to meet
this increasing demand, but to do so in a highly efficient manner, resulting in an improved gross margin percentage.
“We were also excited to record
a much improved second quarter Adjusted EBITDA of $14.1 million, representing 17.4% of net sales. With the elimination of the expenses that were associated with our knee osteoarthritis (“KOA”) development project, we now expect our
Adjusted EBITDA margin in the second half of 2023 to be above 20%, demonstrating excellent leverage as the business scales.
“As a result of our
progress to date, we are increasing guidance for our full-year 2023 net sales percentage growth rate to be in the mid to high teens.
“Finally, we
could not be more pleased with the arrival of Doug Rice, who has joined MIMEDX as our new CFO, rounding out a team of highly accomplished and seasoned healthcare executives, capable of taking the Company to new heights.”
Recent Operating and Financial Highlights:
| |
• |
|
Announced strategic realignment; increasing focus on Wound & Surgical businesses and positioning the
Company with opportunity to significantly improve profitability. |
| |
• |
|
Appointed Doug Rice as Chief Financial Officer. |
| |
• |
|
Announced favorable appellate court ruling affirming dismissal of putative securities class action case.
|
| |
• |
|
Second quarter 2023 net sales of $81.3 million, an increase of 21.5% over second quarter 2022.
|
| 1 |
EBITDA, Adjusted EBITDA, Free Cash Flow and related margins are
non-GAAP financial measures. See “Reconciliation of Non-GAAP Measures” for a reconciliation of EBITDA, Adjusted EBITDA and Free Cash Flow to GAAP financial
measures, located in “Selected Unaudited Financial Information” of this release. |
| |
• |
|
GAAP net income of $1.2 million for second quarter 2023, compared to a net loss of $10.9 million for
the prior year period. |
| |
• |
|
Adjusted EBITDA of $14.1 million for second quarter 2023, compared to an Adjusted EBITDA loss of
$1.0 million for the prior year period and $5.5 million in Adjusted EBITDA during the first quarter 2023. |
|
|
|
|
|
|
|
|
|
| |
|
Three Months Ended June 30, |
|
| |
|
(in thousands) |
|
| |
|
2023 |
|
|
2022 |
|
| Net sales |
|
$ |
81,257 |
|
|
$ |
66,883 |
|
| GAAP Net income (loss) |
|
|
1,200 |
|
|
|
(10,868 |
) |
| EBITDA |
|
|
3,634 |
|
|
|
(8,605 |
) |
| Adjusted EBITDA |
|
|
14,102 |
|
|
|
(959 |
) |
| GAAP Net loss per common share - basic |
|
$ |
(0.00 |
) |
|
$ |
(0.11 |
) |
| GAAP Net loss per common share - diluted |
|
$ |
(0.00 |
) |
|
$ |
(0.11 |
) |
Segment Information
MIMEDX’s second quarter results are summarized using the Company’s two reportable segments: Wound & Surgical and Regenerative Medicine.
Following the announced strategic realignment in June 2023, the Company anticipates it will present its financial results as one segment prospectively. A summary of the Company’s performance for the three months ended June 30, 2023 and
three months ended June 30, 2022 by segment is included below (amounts in thousands):
Three Months Ended June 30, 2023
|
|
|
|
|
|
|
|
|
|
|
|
|
|
|
|
|
| |
|
Wound & Surgical |
|
|
Regenerative
Medicine |
|
|
Corporate &
Other |
|
|
Consolidated |
|
| Net sales |
|
$ |
80,461 |
|
|
$ |
— |
|
|
$ |
796 |
|
|
$ |
81,257 |
|
| Cost of sales |
|
|
12,736 |
|
|
|
— |
|
|
|
847 |
|
|
|
13,583 |
|
| Selling, general and administrative expense |
|
|
38,500 |
|
|
|
— |
|
|
|
13,425 |
|
|
|
51,925 |
|
| Research and development expense |
|
|
1,632 |
|
|
|
6,865 |
|
|
|
— |
|
|
|
8,497 |
|
| Restructuring |
|
|
— |
|
|
|
3,256 |
|
|
|
— |
|
|
|
3,256 |
|
| Impairment of Goodwill |
|
|
— |
|
|
|
— |
|
|
|
— |
|
|
|
— |
|
| Amortization of intangible assets |
|
|
— |
|
|
|
— |
|
|
|
191 |
|
|
|
191 |
|
|
|
|
|
|
|
|
|
|
|
|
|
|
|
|
|
|
| Segment contribution |
|
$ |
27,593 |
|
|
$ |
(10,121 |
) |
|
|
|
|
|
|
|
|
| Investigation, restatement and related expense |
|
|
|
|
|
|
|
|
|
|
|
|
|
|
1,017 |
|
|
|
|
|
|
|
|
|
|
|
|
|
|
|
|
|
|
| Operating income |
|
|
|
|
|
|
|
|
|
|
|
|
|
$ |
2,788 |
|
Note: Net sales in Corporate & Other reflect the Company’s only sales of Dental products, from a contract
under which sales will terminate in 2023.
Three Months Ended June 30, 2022
|
|
|
|
|
|
|
|
|
|
|
|
|
|
|
|
|
| |
|
Wound &
Surgical |
|
|
Regenerative
Medicine |
|
|
Corporate &
Other |
|
|
Consolidated |
|
| Net sales |
|
$ |
66,094 |
|
|
$ |
— |
|
|
$ |
789 |
|
|
$ |
66,883 |
|
| Cost of sales |
|
|
10,838 |
|
|
|
— |
|
|
|
985 |
|
|
|
11,823 |
|
| Selling, general and administrative expense |
|
|
38,681 |
|
|
|
— |
|
|
|
17,112 |
|
|
|
55,793 |
|
| Research and development expense |
|
|
2,408 |
|
|
|
3,104 |
|
|
|
— |
|
|
|
5,512 |
|
| Amortization of intangible assets |
|
|
38,681 |
|
|
|
— |
|
|
|
17,112 |
|
|
|
55,793 |
|
|
|
|
|
|
|
|
|
|
|
|
|
|
|
|
|
|
| Segment contribution |
|
$ |
14,167 |
|
|
$ |
(3,104 |
) |
|
|
|
|
|
|
|
|
| Investigation, restatement and related expense |
|
|
|
|
|
|
|
|
|
|
|
|
|
|
3,218 |
|
|
|
|
|
|
|
|
|
|
|
|
|
|
|
|
|
|
| Operating loss |
|
|
|
|
|
|
|
|
|
|
|
|
|
$ |
(9,636 |
) |
Note: Net sales in Corporate & Other reflect the Company’s only sales of Dental products, from a contract
under which sales will terminate in 2023.
Net Sales
MIMEDX reported net sales for the three months ended June 30, 2023 of $81.3 million, compared to $66.9 million for the three months ended
June 30, 2022, an increase of 21.5%. Net sales growth benefited from strong demand for the Company’s Wound & Surgical product offering across all of its
sites-of-service and continued uptake of new products launched in the last twelve months.
Gross Profit and Margin
Gross profit for the three
months ended June 30, 2023, was $67.7 million an increase of $12.6 million, as compared to the prior year period.
Gross margin for the
three months ended June 30, 2023, was 83.3% compared to 82.3% for the three months ended June 30, 2022. The year-over-year improvement in gross margins was driven by continued execution on yield improvement projects as well as favorable
product mix, with increased sales in higher margin care settings.
Operating Expenses
Selling, general and administrative expenses for the three months ended June 30, 2023, were $51.9 million compared to $55.8 million for the
three months ended June 30, 2022. The decrease primarily reflects continued focus on expense management, more than offsetting higher commissions associated with increased sales.
Research and development expenses were $8.5 million for the three months ended June 30, 2023 compared to $5.5 million for the three months
ended June 30, 2022. The increase was primarily driven by clinical trial costs as well as severance expense associated with the Company’s strategic realignment announced in June 2023.
Restructuring expense for the three months ended June 30, 2023 were $3.3 million, reflecting certain charges related to the disbanding of our
Regenerative Medicine business unit, including write-downs of prepaid clinical trial costs and other wind-down activities.
Investigation, restatement and related expenses for the three months ended June 30, 2023 were
$1.0 million compared to $3.2 million for the three months ended June 30, 2022.
Net income for the three months ended June 30, 2023,
was $1.2 million compared to a net loss of $10.9 million for the three months ended June 30, 2022.
Liquidity
As of June 30, 2023, the Company had $68.7 million of cash and cash equivalents compared to $61.2 million as of March 31, 2023 and
$66.0 million as of December 31, 2022. Also as of June 30, 2023, the Company had $48.8 million in long term debt, essentially flat versus the prior year period.
For the second quarter 2023, the Company generated operating cash flows of $7.8 million, compared operating cash flow usage of $3.0 million in the
prior year period. Also, for the second quarter 2023, the Company generated Free Cash Flow2 of $7.5 million, compared to negative Free Cash Flow of $3.4 million in the prior year period.
Financial Goals
Based upon the strong commercial
momentum in the business on a year-to-date basis, MIMEDX expects full year 2023 net sales growth in the
mid-to-upper teens as a percentage, driven by continued demand for the Company’s Wound & Surgical product offering across its sites of service, and ongoing
uptake of new products launched in the last twelve months.
Additionally, based in part on the financial benefits associated with the Company’s
recently announced strategic realignment, Adjusted EBITDA margin in the second half of 2023 is expected to exceed 20%.
Conference Call and Webcast
MIMEDX will host a conference call and webcast to review its second quarter 2023 results on Tuesday, August 1, 2023, beginning at 5:00 p.m.,
Eastern Time. The call can be accessed using the following information:
Webcast: Click here
U.S. Investors: 877-407-6184
International Investors: 201-389-0877
Conference ID: 13739125
| 2 |
Free Cash Flow is a Non-GAAP financial measure. See
“Reconciliation of Non-GAAP Measures” for a reconciliation of Free Cash Flow to cash flows provided by (used in) operating activities, located in “Selected Unaudited Financial Information”
of this release. |
A replay of the webcast will be available for approximately 30 days on the Company’s website at
www.mimedx.com following the conclusion of the event.
Important Cautionary Statement
This press release includes forward-looking statements. Statements regarding: (i) future sales or sales growth; (ii) our 2023 financial goals and
expectations for future financial results, including levels of Adjusted EBITDA, Adjusted EBITDA margin, contribution margin and corporate expenses; (iii) our expectations regarding the timing and impact of new product launches; and
(iv) the effectiveness of amniotic tissue as a therapy for any particular indication or condition. Additional forward-looking statements may be identified by words such as “believe,” “expect,” “may,”
“plan,” “goal,” “outlook,” “potential,” “will,” “preliminary,” and similar expressions, and are based on management’s current beliefs and expectations.
Forward-looking statements are subject to risks and uncertainties, and the Company cautions investors against placing undue reliance on such statements.
Actual results may differ materially from those set forth in the forward-looking statements. Factors that could cause actual results to differ from expectations include: (i) future sales are uncertain and are affected by competition, access to
customers, patient access to healthcare providers, the reimbursement environment and many other factors; (ii) the Company may change its plans due to unforeseen circumstances; (iii) our access to hospitals and health care provider
facilities could be restricted as a result of any public health emergencies, such as COVID-19, or other factors; (iv) the results of scientific research are uncertain and may have little or no value;
(v) our ability to sell our products in other countries depends on a number of factors including adequate levels of reimbursement, market acceptance of novel therapies, and our ability to build and manage a direct sales force or third party
distribution relationship; (vi) the effectiveness of amniotic tissue as a therapy for particular indications or conditions is the subject of further scientific and clinical studies; and (vii) we may alter the timing and amount of planned
expenditures for research and development based on the results of clinical trials and other regulatory developments. The Company describes additional risks and uncertainties in the Risk Factors section of its most recent annual report and quarterly
reports filed with the Securities and Exchange Commission. Any forward-looking statements speak only as of the date of this press release and the Company assumes no obligation to update any forward-looking statement.
About MIMEDX
MIMEDX is a pioneer and leader focused on
helping humans heal. With more than a decade of helping clinicians manage chronic and other hard-to-heal wounds, MIMEDX is dedicated to providing a leading portfolio of
products for applications in the wound care, burn, and surgical sectors of healthcare. The Company’s vision is to be the leading global provider of healing solutions through relentless innovation to restore quality of life. For additional
information, please visit www.mimedx.com.
Contact:
Matt Notarianni
Investor Relations
470.304.7291
mnotarianni@mimedx.com
Selected Unaudited Financial Information
MiMedx Group, Inc.
Condensed Consolidated Balance Sheets
(in thousands) Unaudited
|
|
|
|
|
|
|
|
|
| |
|
June 30,
2023 |
|
|
December 31,
2022 |
|
| ASSETS |
|
|
|
|
|
|
|
|
| Current assets: |
|
|
|
|
|
|
|
|
| Cash and cash equivalents |
|
$ |
68,652 |
|
|
$ |
65,950 |
|
| Accounts receivable, net |
|
|
48,963 |
|
|
|
43,084 |
|
| Inventory |
|
|
16,815 |
|
|
|
13,183 |
|
| Prepaid expenses |
|
|
3,683 |
|
|
|
8,646 |
|
| Other current assets |
|
|
3,110 |
|
|
|
3,335 |
|
|
|
|
|
|
|
|
|
|
| Total current assets |
|
|
141,223 |
|
|
|
134,198 |
|
| Property and equipment, net |
|
|
7,261 |
|
|
|
7,856 |
|
| Right of use asset |
|
|
2,742 |
|
|
|
3,400 |
|
| Goodwill |
|
|
19,441 |
|
|
|
19,976 |
|
| Intangible assets, net |
|
|
5,565 |
|
|
|
5,852 |
|
| Other assets |
|
|
146 |
|
|
|
148 |
|
|
|
|
|
|
|
|
|
|
| Total assets |
|
$ |
176,378 |
|
|
$ |
171,430 |
|
|
|
|
|
|
|
|
|
|
| LIABILITIES, CONVERTIBLE PREFERRED STOCK, AND STOCKHOLDERS’ DEFICIT |
|
|
|
|
|
|
|
|
| Current liabilities: |
|
|
|
|
|
|
|
|
| Accounts payable |
|
$ |
8,150 |
|
|
$ |
8,847 |
|
| Accrued compensation |
|
|
21,602 |
|
|
|
21,852 |
|
| Accrued expenses |
|
|
12,645 |
|
|
|
11,024 |
|
| Other current liabilities |
|
|
2,063 |
|
|
|
1,834 |
|
|
|
|
|
|
|
|
|
|
| Total current liabilities |
|
|
44,460 |
|
|
|
43,557 |
|
| Long term debt, net |
|
|
48,838 |
|
|
|
48,594 |
|
| Other liabilities |
|
|
3,252 |
|
|
|
4,773 |
|
|
|
|
|
|
|
|
|
|
| Total liabilities |
|
|
96,550 |
|
|
|
96,924 |
|
| Convertible preferred stock |
|
|
92,494 |
|
|
|
92,494 |
|
| Total stockholders’ (deficit) equity |
|
|
(12,666 |
) |
|
|
(17,988 |
) |
|
|
|
|
|
|
|
|
|
| Total liabilities, convertible preferred stock, and stockholders’ (deficit) equity |
|
$ |
176,378 |
|
|
$ |
171,430 |
|
|
|
|
|
|
|
|
|
|
MiMedx Group, Inc.
Condensed Consolidated Statements of Operations
(in thousands) Unaudited
|
|
|
|
|
|
|
|
|
|
|
|
|
|
|
|
|
| |
|
Three Months Ended June 30, |
|
|
Six Months Ended June 30, |
|
| |
|
2023 |
|
|
2022 |
|
|
2023 |
|
|
2022 |
|
| Net sales |
|
$ |
81,257 |
|
|
$ |
66,883 |
|
|
$ |
152,933 |
|
|
$ |
125,777 |
|
| Cost of sales |
|
|
13,583 |
|
|
|
11,823 |
|
|
|
26,002 |
|
|
|
21,759 |
|
|
|
|
|
|
|
|
|
|
|
|
|
|
|
|
|
|
| Gross profit |
|
|
67,674 |
|
|
|
55,060 |
|
|
|
126,931 |
|
|
|
104,018 |
|
|
|
|
|
|
| Operating expenses: |
|
|
|
|
|
|
|
|
|
|
|
|
|
|
|
|
| Selling, general and administrative |
|
|
51,925 |
|
|
|
55,793 |
|
|
|
104,202 |
|
|
|
105,363 |
|
| Research and development |
|
|
8,497 |
|
|
|
5,512 |
|
|
|
14,993 |
|
|
|
11,476 |
|
| Restructuring |
|
|
3,256 |
|
|
|
— |
|
|
|
3,256 |
|
|
|
— |
|
| Investigation, restatement and related |
|
|
1,017 |
|
|
|
3,218 |
|
|
|
4,690 |
|
|
|
5,770 |
|
| Amortization of intangible assets |
|
|
191 |
|
|
|
173 |
|
|
|
380 |
|
|
|
345 |
|
|
|
|
|
|
|
|
|
|
|
|
|
|
|
|
|
|
| Operating income (loss) |
|
|
2,788 |
|
|
|
(9,636 |
) |
|
|
(590 |
) |
|
|
(18,936 |
) |
|
|
|
|
|
| Other expense, net |
|
|
|
|
|
|
|
|
|
|
|
|
|
|
|
|
| Interest expense, net |
|
|
(1,630 |
) |
|
|
(1,170 |
) |
|
|
(3,184 |
) |
|
|
(2,295 |
) |
| Other expense, net |
|
|
(32 |
) |
|
|
— |
|
|
|
(32 |
) |
|
|
(1 |
) |
|
|
|
|
|
|
|
|
|
|
|
|
|
|
|
|
|
| Income (loss) before income tax provision |
|
|
1,126 |
|
|
|
(10,806 |
) |
|
|
(3,806 |
) |
|
|
(21,232 |
) |
| Income tax provision expense |
|
|
74 |
|
|
|
(62 |
) |
|
|
23 |
|
|
|
(125 |
) |
|
|
|
|
|
|
|
|
|
|
|
|
|
|
|
|
|
| Net income (loss) |
|
$ |
1,200 |
|
|
$ |
(10,868 |
) |
|
$ |
(3,783 |
) |
|
$ |
(21,357 |
) |
|
|
|
|
|
|
|
|
|
|
|
|
|
|
|
|
|
| Net loss available to common shareholders |
|
$ |
(528 |
) |
|
$ |
(12,496 |
) |
|
$ |
(7,194 |
) |
|
$ |
(24,571 |
) |
|
|
|
|
|
|
|
|
|
|
|
|
|
|
|
|
|
| Net loss per common share - basic |
|
$ |
(0.00 |
) |
|
$ |
(0.11 |
) |
|
$ |
(0.06 |
) |
|
$ |
(0.22 |
) |
| Net loss per common share - diluted |
|
$ |
(0.00 |
) |
|
$ |
(0.11 |
) |
|
$ |
(0.06 |
) |
|
$ |
(0.22 |
) |
|
|
|
|
|
| Weighted average common shares outstanding - basic |
|
|
115,866,371 |
|
|
|
112,867,912 |
|
|
|
115,136,646 |
|
|
|
112,245,334 |
|
| Weighted average common shares outstanding - diluted |
|
|
115,866,371 |
|
|
|
112,867,912 |
|
|
|
115,136,646 |
|
|
|
112,245,334 |
|
MiMedx Group, Inc.
Condensed Consolidated Statements of Cash Flows
(in thousands) Unaudited
|
|
|
|
|
|
|
|
|
| |
|
Six Months Ended June 30, |
|
| |
|
2023 |
|
|
2022 |
|
| Net cash flows provided by (used in) operating activities |
|
|
3,727 |
|
|
|
(13,228 |
) |
| Net cash flows used in investing activities |
|
|
(1,025 |
) |
|
|
(577 |
) |
| Net cash flows used in financing activities |
|
|
— |
|
|
|
(776 |
) |
|
|
|
|
|
|
|
|
|
| Net change in cash |
|
|
2,702 |
|
|
|
(14,581 |
) |
Reconciliation of Non-GAAP Measures
In addition to our GAAP results, we provide certain non-GAAP metrics including Earnings Before Interest, Taxes,
Depreciation and Amortization (“EBITDA”), Adjusted EBITDA, Free Cash Flow and related margins. We believe that the presentation of these measures provides important supplemental information to management and investors regarding our
performance. These measurements are not a substitute for GAAP measurements. Company management uses these Non-GAAP measurements as aids in monitoring our ongoing financial performance from quarter-to-quarter and year-to-year on a regular basis and for benchmarking against comparable
companies.
EBITDA, Adjusted EBITDA and Adjusted EBITDA margin
EBITDA is intended to provide a measure of the Company’s operating performance as it eliminates the effects of financing and capital expenditures. EBITDA
consists of GAAP net loss excluding: (i) depreciation, (ii) amortization of intangibles, (iii) interest expense, net, and (iv) income tax provision. Adjusted EBITDA is intended to provide a normalized view of EBITDA and our broader
business operations that we expect to experience on an ongoing basis by removing certain non-cash items and items that may be irregular, one-time, or non-recurring from EBITDA. This enables us to identify underlying trends in our business that could otherwise be masked by such items. Adjusted EBITDA consists of GAAP net loss excluding: (i) depreciation, (ii)
amortization of intangibles, (iii) interest expense, net, (iv) income tax provision, (v) investigation, restatement and related expenses, (vi) expenses related to disbanding of the Regenerative Medicine business unit and
(vii) share-based compensation.
A reconciliation of GAAP net income (loss) to EBITDA and Adjusted EBITDA appears in the table below (in
thousands):
|
|
|
|
|
|
|
|
|
|
|
|
|
|
|
|
|
| |
|
Three Months Ended June 30, |
|
|
Six Months Ended June 30, |
|
| |
|
2023 |
|
|
2022 |
|
|
2023 |
|
|
2022 |
|
| Net income (loss) |
|
$ |
1,200 |
|
|
$ |
(10,868 |
) |
|
$ |
(3,783 |
) |
|
$ |
(21,357 |
) |
|
|
|
|
|
| Net margin |
|
|
1.5 |
% |
|
|
(16.2 |
)% |
|
|
(2.5 |
)% |
|
|
(17.0 |
)% |
| Non-GAAP Adjustments: |
|
|
|
|
|
|
|
|
|
|
|
|
|
|
|
|
| Depreciation expense |
|
|
687 |
|
|
|
858 |
|
|
|
1,401 |
|
|
|
1,718 |
|
| Amortization of intangible assets |
|
|
191 |
|
|
|
173 |
|
|
|
380 |
|
|
|
345 |
|
| Interest expense, net |
|
|
1,630 |
|
|
|
1,170 |
|
|
|
3,184 |
|
|
|
2,295 |
|
| Income tax provision (benefit) expense |
|
|
(74 |
) |
|
|
62 |
|
|
|
(23 |
) |
|
|
125 |
|
|
|
|
|
|
|
|
|
|
|
|
|
|
|
|
|
|
| EBITDA |
|
|
3,634 |
|
|
|
(8,605 |
) |
|
|
1,159 |
|
|
|
(16,874 |
) |
|
|
|
|
|
|
|
|
|
|
|
|
|
|
|
|
|
| EBITDA margin |
|
|
4.5 |
% |
|
|
(12.9 |
)% |
|
|
0.8 |
% |
|
|
(13.4 |
)% |
|
|
|
|
|
| Additional Non-GAAP Adjustments |
|
|
|
|
|
|
|
|
|
|
|
|
|
|
|
|
| Costs incurred in connection with Audit Committee Investigation and Restatement |
|
|
1,017 |
|
|
|
3,218 |
|
|
|
4,690 |
|
|
|
5,770 |
|
| Share-based compensation |
|
|
4,060 |
|
|
|
4,428 |
|
|
|
8,405 |
|
|
|
8,426 |
|
| Expenses related to disbanding of Regenerative Medicine business unit |
|
$ |
5,391 |
|
|
$ |
— |
|
|
$ |
5,391 |
|
|
$ |
— |
|
|
|
|
|
|
|
|
|
|
|
|
|
|
|
|
|
|
| Adjusted EBITDA |
|
$ |
14,102 |
|
|
$ |
(959 |
) |
|
$ |
19,645 |
|
|
$ |
(2,678 |
) |
|
|
|
|
|
|
|
|
|
|
|
|
|
|
|
|
|
| Adjusted EBITDA margin |
|
|
17.4 |
% |
|
|
(1.4 |
)% |
|
|
12.8 |
% |
|
|
(2.1 |
)% |
We are not able to provide a reconciliation of our Adjusted EBITDA margin expectation to the corresponding GAAP measure
without unreasonable effort because of the uncertainty and variability of the nature and amount of the non-recurring and other items that are excluded from such non-GAAP
financial measures. Such adjustments in future periods are generally expected to be similar to the kinds of charges excluded from such non-GAAP financial measures in prior periods. The exclusion of these
charges and costs in future periods could have a significant impact on our non-GAAP financial measures.
Free Cash Flow
Free Cash Flow is intended to provide a measure of our ability to generate cash in excess of capital investments. It provides management with a view of cash
flows which can be used to finance operational and strategic investments.
Free Cash Flow is defined as net cash provided by (used in) operating
activities less capital expenditures, including purchases of equipment.
A reconciliation of GAAP net cash provided by (used in) operating activities to
Free Cash Flow appears in the table below (in thousands):
|
|
|
|
|
|
|
|
|
|
|
|
|
|
|
|
|
| |
|
Three Months Ended June 30, |
|
|
Six Months Ended June 30, |
|
| |
|
2023 |
|
|
2022 |
|
|
2023 |
|
|
2022 |
|
| Net cash flows provided by (used in) operating activities |
|
$ |
7,775 |
|
|
$ |
(3,005 |
) |
|
$ |
3,727 |
|
|
$ |
(13,228 |
) |
| Purchases of equipment |
|
|
(299 |
) |
|
|
(380 |
) |
|
|
(932 |
) |
|
|
(498 |
) |
|
|
|
|
|
|
|
|
|
|
|
|
|
|
|
|
|
| Free Cash Flow |
|
$ |
7,476 |
|
|
$ |
(3,385 |
) |
|
$ |
2,795 |
|
|
$ |
(13,726 |
) |
|
|
|
|
|
|
|
|
|
|
|
|
|
|
|
|
|

Exhibit 99.2 Q2:23 Results Conference Call August 1, 2023 H E L P I N G
H U M A N S H E A L

Disclaimer & Cautionary Statements This presentation includes
forward-looking statements. Forward-looking statements are subject to risks and uncertainties, and the Company cautions investors against placing undue reliance on such statements. Actual results may differ materially from those set forth in the
forward-looking statements. Such forward-looking statements include statements regarding: • Future sales or sales growth; • Estimates of potential market size for the Company’s current and future products; • Plans for
expansion outside of the U.S.; • The effectiveness of amniotic tissue as a therapy for any particular indication or condition; • Expected spending on research and development; • The Company’s long-term strategy and goals for
value creation, the status of its pipeline products, expectations for future products, and expectations for future growth and profitability 2
Disclaimer & Cautionary Statements Additional forward-looking
statements may be identified by words such as believe, expect, may, plan, potential, will, preliminary, and similar expressions, and are based on management's current beliefs and expectations. Forward-looking statements are subject to risks and
uncertainties, and the Company cautions investors against placing undue reliance on such statements. Actual results may differ materially from those set forth in the forward-looking statements. Factors that could cause actual results to differ from
expectations include: • Future sales are uncertain and are affected by competition, access to customers, patient access to healthcare providers, and many other factors; • The future market for the Company’s products can depend on
regulatory approval of such products, which might not occur at all or when expected, and is based in part on assumptions regarding the number of patients who elect less acute and more acute treatment than the Company’s products, market
acceptance of the Company’s products, and adequate reimbursement for such therapies; • The process of obtaining regulatory clearances or approvals to market a biological product or medical device from the FDA or similar regulatory
authorities outside of the U.S. is costly and time consuming, and such clearances or approvals may not be granted on a timely basis, or at all, and the ability to obtain the rights to market additional, suitable products depends on negotiations with
third parties which may not be forthcoming; • Whether there is full access to hospitals and healthcare provider facilities, as a continuation or escalation of access restrictions or lockdown orders resulting from the ongoing COVID-19 pandemic;
and • The Company describes additional risks and uncertainties in the Risk Factors section of its most recent annual report and quarterly reports filed with the Securities and Exchange Commission. Any forward-looking statements speak only as
of the date of this press release and the Company assumes no obligation to update any forward- looking statement. 3

Joe Capper Chief Executive Officer
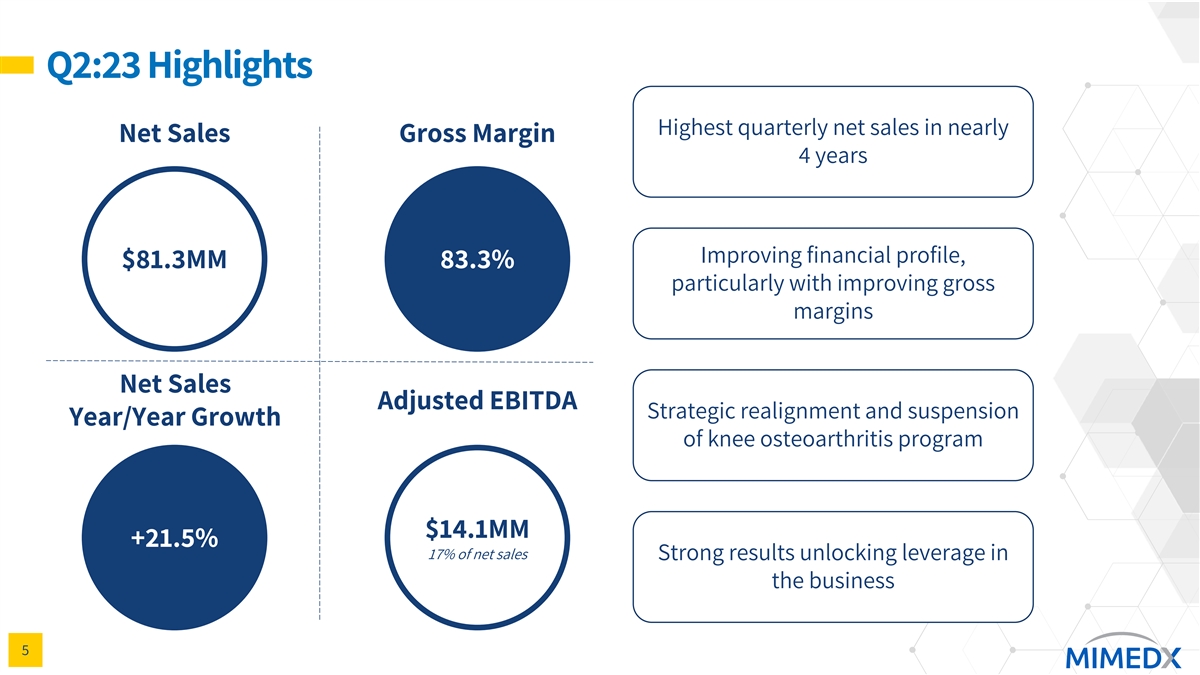
Q2:23 Highlights Highest quarterly net sales in nearly Net Sales Gross
Margin 4 years Improving financial profile, $81.3MM 83.3% particularly with improving gross margins Net Sales Adjusted EBITDA Strategic realignment and suspension Year/Year Growth of knee osteoarthritis program $14.1MM +21.5% 17% of net sales Strong
results unlocking leverage in the business 5
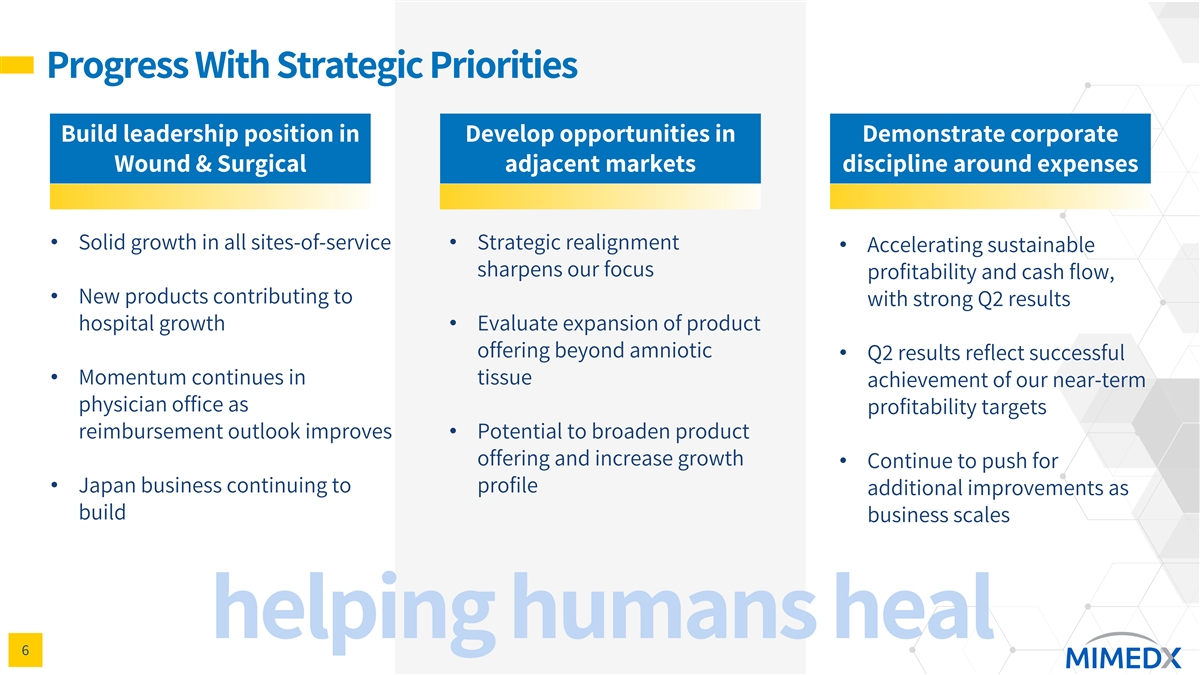
Progress With Strategic Priorities Build leadership position in Develop
opportunities in Demonstrate corporate Wound & Surgical adjacent markets discipline around expenses • Solid growth in all sites-of-service• Strategic realignment • Accelerating sustainable sharpens our focus profitability and
cash flow, • New products contributing to with strong Q2 results hospital growth• Evaluate expansion of product offering beyond amniotic • Q2 results reflect successful • Momentum continues in tissue achievement of our
near-term physician office as profitability targets reimbursement outlook improves• Potential to broaden product offering and increase growth • Continue to push for • Japan business continuing to profile additional improvements as
build business scales helping humans heal 6

Doug Rice Chief Financial Officer
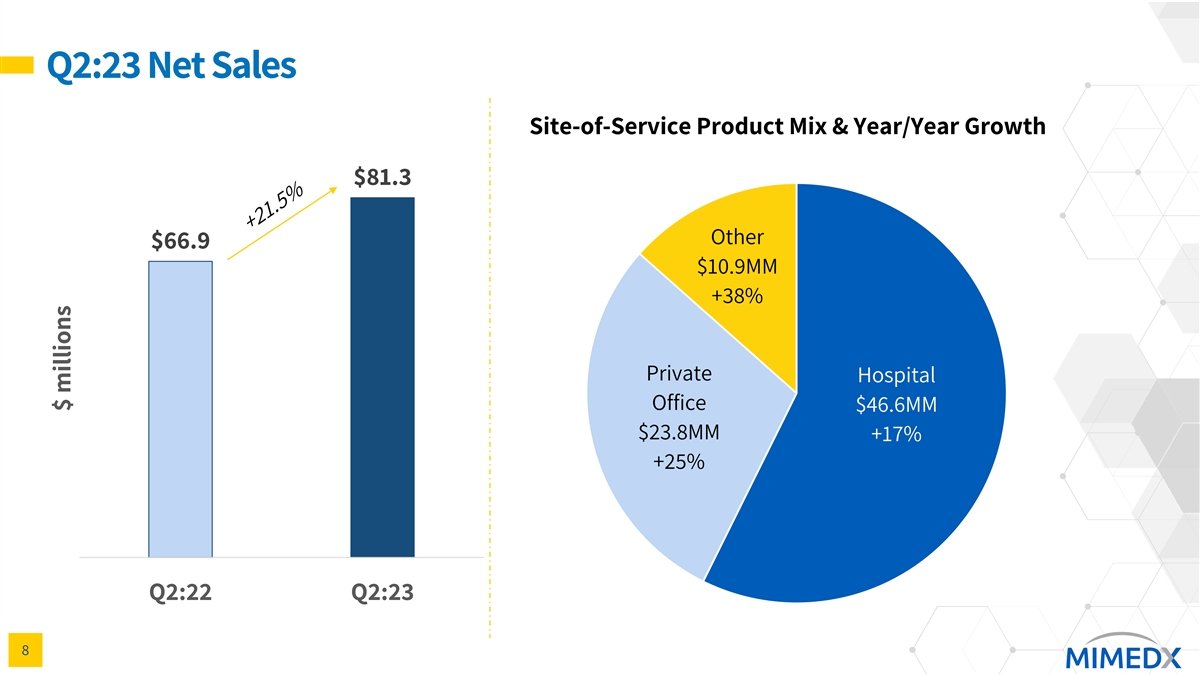
Q2:23 Net Sales Site-of-Service Product Mix & Year/Year Growth $81.3
Other $66.9 $10.9MM +38% Private Hospital Office $46.6MM $23.8MM +17% +25% Q2:22 Q2:23 8 $ millions
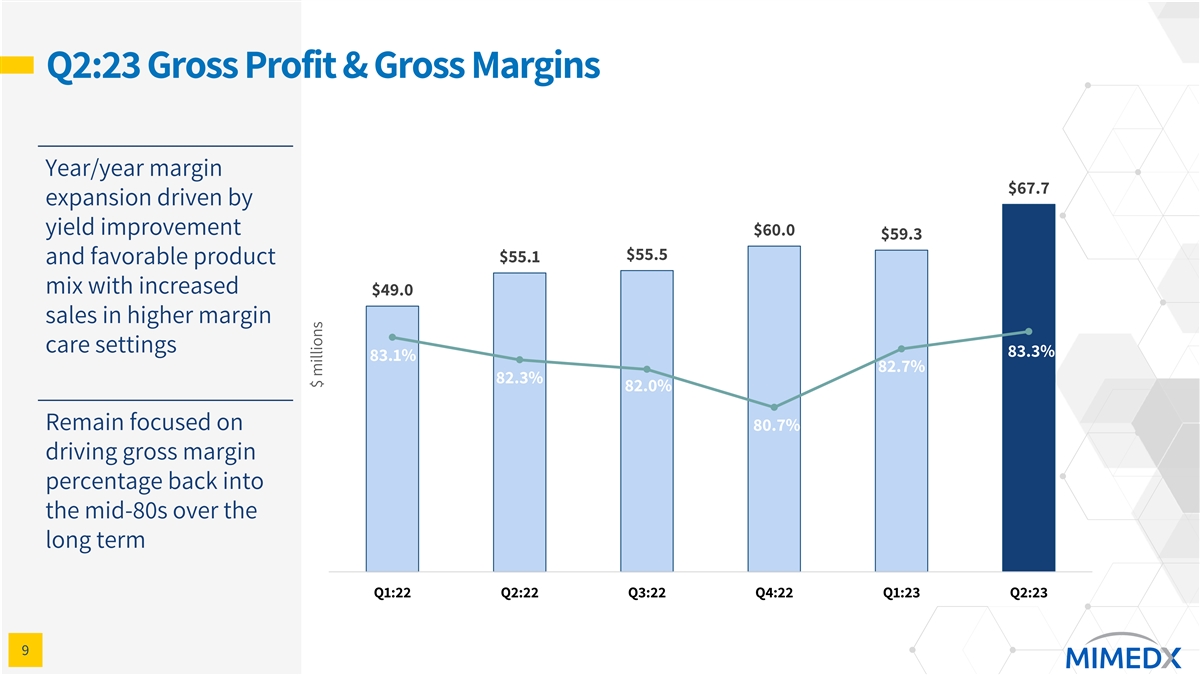
Q2:23 Gross Profit & Gross Margins Year/year margin $67.7 expansion
driven by yield improvement $60.0 $59.3 $55.5 $55.1 and favorable product mix with increased $49.0 sales in higher margin care settings 83.3% 83.1% 82.7% 82.3% 82.0% Remain focused on 80.7% driving gross margin percentage back into the mid-80s over
the long term Q1:22 Q2:22 Q3:22 Q4:22 Q1:23 Q2:23 9 9 $ millions

Q2:23 Operating Expenses Q2:22 $55.8 $51.9 Q2:23 Expense discipline
more than offset higher commissions to drive strong improvement in Adjusted $8.5 $5.5 EBITDA % of net sales 83% 64% 8% 11% R&D SG&A $14.1 Restructuring charge associated with strategic $1.2 realignment more than offset meaningful reduction
-$1.0 in Investigation, Restatement & Related -$10.9 Expense -1% % of net sales -16% 2% 17% Adjusted EBITDA Net Income/Loss 10 $ millions $ millions
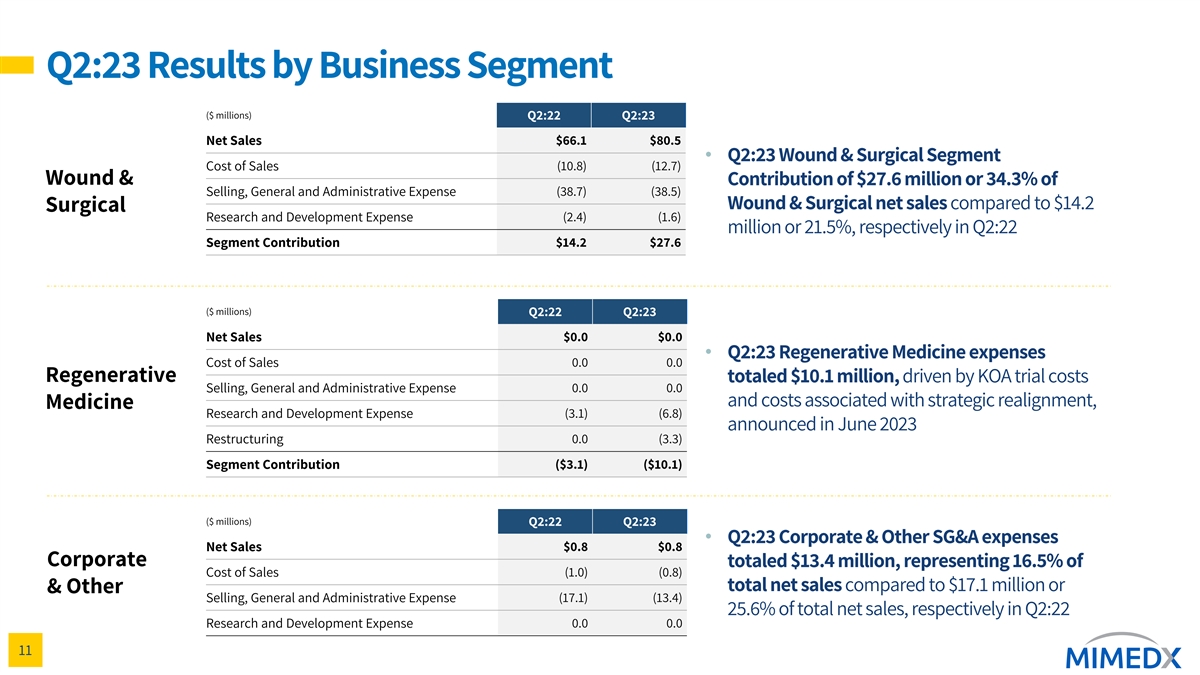
Q2:23 Results by Business Segment ($ millions) Q2:22 Q2:23 Net Sales
$66.1 $80.5 • Q2:23 Wound & Surgical Segment (10.8) (12.7) Cost of Sales Wound & Contribution of $27.6 million or 34.3% of Selling, General and Administrative Expense (38.7) (38.5) Wound & Surgical net sales compared to $14.2
Surgical Research and Development Expense (2.4) (1.6) million or 21.5%, respectively in Q2:22 Segment Contribution $14.2 $27.6 ($ millions) Q2:22 Q2:23 Net Sales $0.0 $0.0 • Q2:23 Regenerative Medicine expenses Cost of Sales 0.0 0.0
Regenerative totaled $10.1 million, driven by KOA trial costs Selling, General and Administrative Expense 0.0 0.0 and costs associated with strategic realignment, Medicine (3.1) (6.8) Research and Development Expense announced in June 2023
Restructuring 0.0 (3.3) Segment Contribution ($3.1) ($10.1) ($ millions) Q2:22 Q2:23 • Q2:23 Corporate & Other SG&A expenses Net Sales $0.8 $0.8 Corporate totaled $13.4 million, representing 16.5% of (1.0) (0.8) Cost of Sales total net
sales compared to $17.1 million or & Other Selling, General and Administrative Expense (17.1) (13.4) 25.6% of total net sales, respectively in Q2:22 Research and Development Expense 0.0 0.0 11

Liquidity Highlights $68.7MM $7.8MM Cash & Equivalents Operating
Cash Flow Cash & Debt Q2:23 at June 30, 2023 Cash Flows $48.8MM $7.5MM Long-Term Debt Free Cash Flow 12

Joe Capper Chief Executive Officer
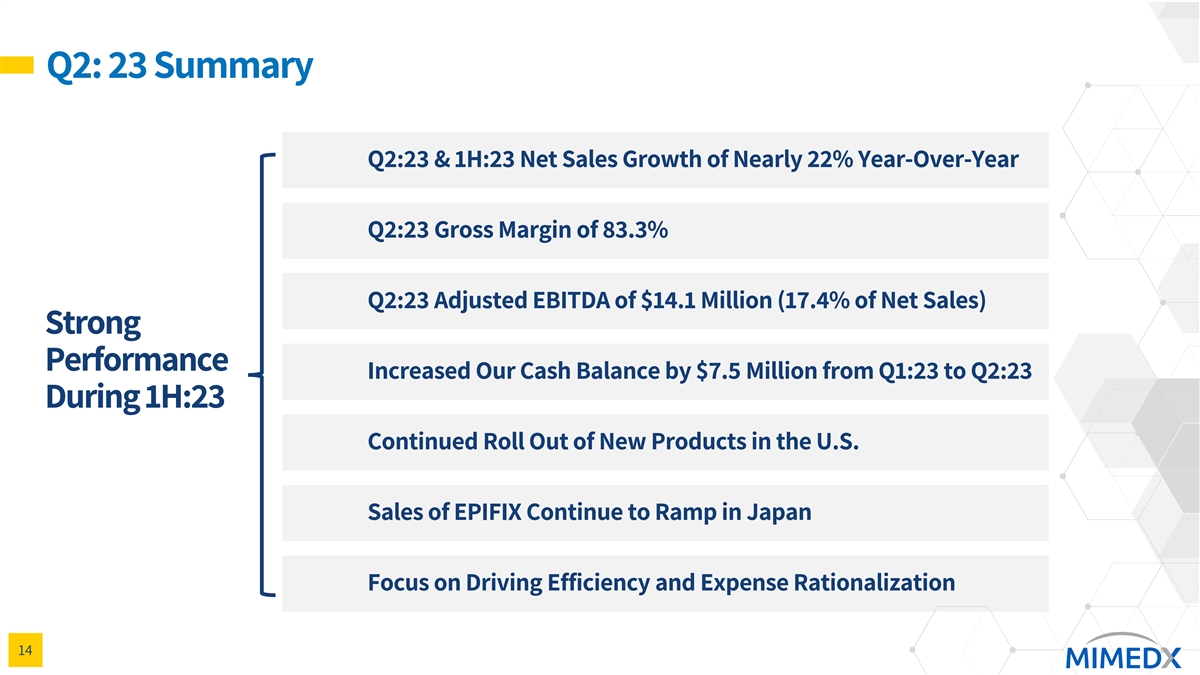
Q2: 23 Summary Q2:23 & 1H:23 Net Sales Growth of Nearly 22%
Year-Over-Year Q2:23 Gross Margin of 83.3% Q2:23 Adjusted EBITDA of $14.1 Million (17.4% of Net Sales) Strong Performance Increased Our Cash Balance by $7.5 Million from Q1:23 to Q2:23 During 1H:23 Continued Roll Out of New Products in the U.S.
Sales of EPIFIX Continue to Ramp in Japan Focus on Driving Efficiency and Expense Rationalization 14

* 2023 Outlook 2023 Continues to Shape Up to be a Strong Year for
MIMEDX Anticipate Full Year 2023 Potential to Build Cash Expect Adjusted EBITDA Revenue Growth Balance to $90+ Million Margin in 2H:23 Above Percentage in the Mid- by Year End 2023 20%, Driving Leverage to-High Teens as the Business Scales Revenue
Growth Profitability Cash Generation *2023 Outlook provided as of August 1, 2023. Actual results may differ. We are not able to provide a reconciliation of our Adjusted EBITDA margin expectation to the corresponding GAAP measure without unreasonable
effort because of the uncertainty and variability of the nature and amount of the non-recurring and other items that are excluded from such non-GAAP financial measures. Such adjustments 15 in future periods are generally expected to be similar to
the kinds of charges excluded from such non-GAAP financial measures in prior periods. The exclusion of these charges and costs in future periods could have a significant impact on our non-GAAP financial measures.

Helping Humans Heal Closing Remarks & Q&A
v3.23.2
| X |
- DefinitionBoolean flag that is true when the XBRL content amends previously-filed or accepted submission.
| Name: |
dei_AmendmentFlag |
| Namespace Prefix: |
dei_ |
| Data Type: |
xbrli:booleanItemType |
| Balance Type: |
na |
| Period Type: |
duration |
|
| X |
- DefinitionFor the EDGAR submission types of Form 8-K: the date of the report, the date of the earliest event reported; for the EDGAR submission types of Form N-1A: the filing date; for all other submission types: the end of the reporting or transition period. The format of the date is YYYY-MM-DD.
| Name: |
dei_DocumentPeriodEndDate |
| Namespace Prefix: |
dei_ |
| Data Type: |
xbrli:dateItemType |
| Balance Type: |
na |
| Period Type: |
duration |
|
| X |
- DefinitionThe type of document being provided (such as 10-K, 10-Q, 485BPOS, etc). The document type is limited to the same value as the supporting SEC submission type, or the word 'Other'.
| Name: |
dei_DocumentType |
| Namespace Prefix: |
dei_ |
| Data Type: |
dei:submissionTypeItemType |
| Balance Type: |
na |
| Period Type: |
duration |
|
| X |
- DefinitionAddress Line 1 such as Attn, Building Name, Street Name
| Name: |
dei_EntityAddressAddressLine1 |
| Namespace Prefix: |
dei_ |
| Data Type: |
xbrli:normalizedStringItemType |
| Balance Type: |
na |
| Period Type: |
duration |
|
| X |
- Definition
+ References
+ Details
| Name: |
dei_EntityAddressCityOrTown |
| Namespace Prefix: |
dei_ |
| Data Type: |
xbrli:normalizedStringItemType |
| Balance Type: |
na |
| Period Type: |
duration |
|
| X |
- DefinitionCode for the postal or zip code
| Name: |
dei_EntityAddressPostalZipCode |
| Namespace Prefix: |
dei_ |
| Data Type: |
xbrli:normalizedStringItemType |
| Balance Type: |
na |
| Period Type: |
duration |
|
| X |
- DefinitionName of the state or province.
| Name: |
dei_EntityAddressStateOrProvince |
| Namespace Prefix: |
dei_ |
| Data Type: |
dei:stateOrProvinceItemType |
| Balance Type: |
na |
| Period Type: |
duration |
|
| X |
- DefinitionA unique 10-digit SEC-issued value to identify entities that have filed disclosures with the SEC. It is commonly abbreviated as CIK. Reference 1: http://www.xbrl.org/2003/role/presentationRef
-Publisher SEC
-Name Exchange Act
-Number 240
-Section 12
-Subsection b-2
| Name: |
dei_EntityCentralIndexKey |
| Namespace Prefix: |
dei_ |
| Data Type: |
dei:centralIndexKeyItemType |
| Balance Type: |
na |
| Period Type: |
duration |
|
| X |
- DefinitionIndicate if registrant meets the emerging growth company criteria. Reference 1: http://www.xbrl.org/2003/role/presentationRef
-Publisher SEC
-Name Exchange Act
-Number 240
-Section 12
-Subsection b-2
| Name: |
dei_EntityEmergingGrowthCompany |
| Namespace Prefix: |
dei_ |
| Data Type: |
xbrli:booleanItemType |
| Balance Type: |
na |
| Period Type: |
duration |
|
| X |
- DefinitionCommission file number. The field allows up to 17 characters. The prefix may contain 1-3 digits, the sequence number may contain 1-8 digits, the optional suffix may contain 1-4 characters, and the fields are separated with a hyphen.
| Name: |
dei_EntityFileNumber |
| Namespace Prefix: |
dei_ |
| Data Type: |
dei:fileNumberItemType |
| Balance Type: |
na |
| Period Type: |
duration |
|
| X |
- DefinitionTwo-character EDGAR code representing the state or country of incorporation.
| Name: |
dei_EntityIncorporationStateCountryCode |
| Namespace Prefix: |
dei_ |
| Data Type: |
dei:edgarStateCountryItemType |
| Balance Type: |
na |
| Period Type: |
duration |
|
| X |
- DefinitionThe exact name of the entity filing the report as specified in its charter, which is required by forms filed with the SEC. Reference 1: http://www.xbrl.org/2003/role/presentationRef
-Publisher SEC
-Name Exchange Act
-Number 240
-Section 12
-Subsection b-2
| Name: |
dei_EntityRegistrantName |
| Namespace Prefix: |
dei_ |
| Data Type: |
xbrli:normalizedStringItemType |
| Balance Type: |
na |
| Period Type: |
duration |
|
| X |
- DefinitionThe Tax Identification Number (TIN), also known as an Employer Identification Number (EIN), is a unique 9-digit value assigned by the IRS. Reference 1: http://www.xbrl.org/2003/role/presentationRef
-Publisher SEC
-Name Exchange Act
-Number 240
-Section 12
-Subsection b-2
| Name: |
dei_EntityTaxIdentificationNumber |
| Namespace Prefix: |
dei_ |
| Data Type: |
dei:employerIdItemType |
| Balance Type: |
na |
| Period Type: |
duration |
|
| X |
- DefinitionLocal phone number for entity.
| Name: |
dei_LocalPhoneNumber |
| Namespace Prefix: |
dei_ |
| Data Type: |
xbrli:normalizedStringItemType |
| Balance Type: |
na |
| Period Type: |
duration |
|
| X |
- DefinitionBoolean flag that is true when the Form 8-K filing is intended to satisfy the filing obligation of the registrant as pre-commencement communications pursuant to Rule 13e-4(c) under the Exchange Act. Reference 1: http://www.xbrl.org/2003/role/presentationRef
-Publisher SEC
-Name Exchange Act
-Number 240
-Section 13e
-Subsection 4c
| Name: |
dei_PreCommencementIssuerTenderOffer |
| Namespace Prefix: |
dei_ |
| Data Type: |
xbrli:booleanItemType |
| Balance Type: |
na |
| Period Type: |
duration |
|
| X |
- DefinitionBoolean flag that is true when the Form 8-K filing is intended to satisfy the filing obligation of the registrant as pre-commencement communications pursuant to Rule 14d-2(b) under the Exchange Act. Reference 1: http://www.xbrl.org/2003/role/presentationRef
-Publisher SEC
-Name Exchange Act
-Number 240
-Section 14d
-Subsection 2b
| Name: |
dei_PreCommencementTenderOffer |
| Namespace Prefix: |
dei_ |
| Data Type: |
xbrli:booleanItemType |
| Balance Type: |
na |
| Period Type: |
duration |
|
| X |
- DefinitionTitle of a 12(b) registered security. Reference 1: http://www.xbrl.org/2003/role/presentationRef
-Publisher SEC
-Name Exchange Act
-Number 240
-Section 12
-Subsection b
| Name: |
dei_Security12bTitle |
| Namespace Prefix: |
dei_ |
| Data Type: |
dei:securityTitleItemType |
| Balance Type: |
na |
| Period Type: |
duration |
|
| X |
- DefinitionName of the Exchange on which a security is registered. Reference 1: http://www.xbrl.org/2003/role/presentationRef
-Publisher SEC
-Name Exchange Act
-Number 240
-Section 12
-Subsection d1-1
| Name: |
dei_SecurityExchangeName |
| Namespace Prefix: |
dei_ |
| Data Type: |
dei:edgarExchangeCodeItemType |
| Balance Type: |
na |
| Period Type: |
duration |
|
| X |
- DefinitionBoolean flag that is true when the Form 8-K filing is intended to satisfy the filing obligation of the registrant as soliciting material pursuant to Rule 14a-12 under the Exchange Act. Reference 1: http://www.xbrl.org/2003/role/presentationRef
-Publisher SEC
-Name Exchange Act
-Section 14a
-Number 240
-Subsection 12
| Name: |
dei_SolicitingMaterial |
| Namespace Prefix: |
dei_ |
| Data Type: |
xbrli:booleanItemType |
| Balance Type: |
na |
| Period Type: |
duration |
|
| X |
- DefinitionTrading symbol of an instrument as listed on an exchange.
| Name: |
dei_TradingSymbol |
| Namespace Prefix: |
dei_ |
| Data Type: |
dei:tradingSymbolItemType |
| Balance Type: |
na |
| Period Type: |
duration |
|
| X |
- DefinitionBoolean flag that is true when the Form 8-K filing is intended to satisfy the filing obligation of the registrant as written communications pursuant to Rule 425 under the Securities Act. Reference 1: http://www.xbrl.org/2003/role/presentationRef
-Publisher SEC
-Name Securities Act
-Number 230
-Section 425
| Name: |
dei_WrittenCommunications |
| Namespace Prefix: |
dei_ |
| Data Type: |
xbrli:booleanItemType |
| Balance Type: |
na |
| Period Type: |
duration |
|
MiMedx (NASDAQ:MDXG)
과거 데이터 주식 차트
부터 4월(4) 2024 으로 5월(5) 2024

MiMedx (NASDAQ:MDXG)
과거 데이터 주식 차트
부터 5월(5) 2023 으로 5월(5) 2024
