false 0001736035 0001736035 2024-08-07 2024-08-07
UNITED STATES
SECURITIES AND EXCHANGE COMMISSION
WASHINGTON, D.C. 20549
FORM 8-K
CURRENT REPORT
PURSUANT TO SECTION 13 OR 15(d)
OF THE SECURITIES EXCHANGE ACT OF 1934
Date of Report (Date of earliest event reported): August 7, 2024
Blackstone Secured Lending Fund
(Exact name of registrant as specified in its charter)
|
|
|
|
|
| Delaware |
|
814-01299 |
|
82-7020632 |
| (State or Other Jurisdiction of Incorporation) |
|
(Commission File Number) |
|
(I.R.S. Employer Identification No.) |
|
| 345 Park Avenue, 31st Floor |
| New York, New York 10154 |
| (Address of Principal Executive Offices) (Zip Code) |
Registrant’s telephone number, including area code: (212) 503-2100
Not Applicable
(Former Name or Address, if Changed Since Last Report)
Check the appropriate box below if the Form 8-K filing is intended to simultaneously satisfy the filing obligation of the registrant under any of the following provisions:
| ☐ |
Written communications pursuant to Rule 425 under the Securities Act (17 CFR 230.425) |
| ☐ |
Soliciting material pursuant to Rule 14a-12 under the Exchange Act (17 CFR 240.14a-12) |
| ☐ |
Pre-commencement communications pursuant to Rule 14d-2(b) under the Exchange Act (17 CFR 240.14d-2(b)) |
| ☐ |
Pre-commencement communications pursuant to Rule 13e-4(c) under the Exchange Act (17 CFR 240.13e-4(c)) |
Securities registered pursuant to Section 12(b) of the Act:
|
|
|
|
|
| Title of each class |
|
Trading Symbol(s) |
|
Name of each exchange on which registered |
| Common Shares of Beneficial Interest, $0.001 par value per share |
|
BXSL |
|
New York Stock Exchange |
Indicate by check mark whether the registrant is an emerging growth company as defined in Rule 405 of the Securities Act of 1933 (§230.405 of this chapter) or Rule 12b-2 of the Securities Exchange Act of 1934 (§240.12b-2 of this chapter).
Emerging growth company ☐
If an emerging growth company, indicate by check mark if the registrant has elected not to use the extended transition period for complying with any new or revised financial accounting standards provided pursuant to Section 13(a) of the Exchange Act. ☐
| Item 2.02 |
Results of Operations and Financial Condition |
On August 7, 2024, Blackstone Secured Lending Fund issued a press release and detailed presentation announcing its financial results for the second quarter ended June 30, 2024. The press release with the detailed presentation is furnished as Exhibit 99.1 to this Current Report on Form 8-K and is incorporated herein by reference.
In accordance with General Instruction B.2 of Form 8-K, the information contained under Item 2.02 in this Current Report on Form 8-K, including Exhibit 99.1, is being furnished and shall not be deemed to be “filed” for purposes of Section 18 of the Securities Exchange Act of 1934, as amended (the “Exchange Act”), or otherwise subject to the liabilities of that section, and will not be incorporated by reference into any registration statement or other document filed under the Securities Act of 1933, as amended, or the Exchange Act, except as expressly set forth by specific reference in such filing.
| Item 9.01 |
Financial Statements and Exhibits |
(d) Exhibits.
SIGNATURE
Pursuant to the requirements of the Securities Exchange Act of 1934, the registrant has duly caused this report to be signed on its behalf by the undersigned hereunto duly authorized.
|
|
|
|
|
|
|
|
|
|
|
BLACKSTONE SECURED LENDING FUND |
|
|
|
|
| Date: August 7, 2024 |
|
|
|
By: |
|
/s/ Teddy Desloge |
|
|
|
|
Name: |
|
Teddy Desloge |
|
|
|
|
Title: |
|
Chief Financial Officer |
Exhibit 99.1 Blackstone Secured Lending Fund Reports Second Quarter 2024
Results NEW YORK — August 7, 2024 — Blackstone Secured Lending Fund (NYSE: BXSL, or the “Company”) today reported its second quarter 2024 results. Brad Marshall and Jonathan Bock, Co-Chief Executive Officers of Blackstone
Secured Lending Fund, said, “BXSL reported the best quarterly earnings on a dollar basis, the highest net asset value per share, and the most active quarter for originations since our IPO in 2021. Credit performance remains strong, underpinned
by what we believe is a defensive portfolio that is 98.6% first lien, senior secured debt, reflecting a loan-to-value ratio of approximately 47%. We are confident in BXSL’s positioning and our ability to deploy capital effectively in a dynamic
market environment.“ Blackstone Secured Lending Fund issued a full detailed presentation of its second quarter 2024 results, which can be viewed at www.bxsl.com. Dividend Declaration The Company's Board of Trustees has declared a third quarter
2024 dividend of $0.77 per share to shareholders of record as of September 30, 2024, payable on or about October 25, 2024. Quarterly Investor Call Details Blackstone Secured Lending Fund will host its conference call today at 9:30 a.m. ET to discuss
results. To register for the webcast, please use the following link: https://event.webcasts.com/starthere.jsp?ei=1680432&tp_key=d231aae495 Blackstone Secured Lending Fund 345 Park Avenue New York, NY 10154 1 T 212 583 5000
For those unable to listen to the live broadcast, there will be a
webcast replay on the Shareholders section of BXSL’s website at https://ir.bxsl.com. About Blackstone Secured Lending Fund Blackstone Secured Lending Fund (NYSE: BXSL) is a specialty finance company that invests primarily in the debt of
private U.S. companies. As of June 30, 2024, BXSL’s fair value of investments was approximately $11.3 billion. BXSL has elected to be regulated as a business development company under the Investment Company Act of 1940, as amended. BXSL is
externally managed by Blackstone Credit BDC Advisors LLC, an SEC- registered investment adviser that is an affiliate of Blackstone Inc. Blackstone Inc., together with its subsidiaries, is the world’s largest alternative investment firm with
over $1.1 trillion of assets under management as of June 30, 2024. Forward-Looking Statements and Other Matters Certain information contained in this communication constitutes “forward-looking statements” within the meaning of the
federal securities laws. These forward-looking statements can be identified by the use of forward-looking terminology, such as “outlook,” “indicator,” “believes,” “expects,” “potential,”
“continues,” “may,” “can,” “will,” “should,” “seeks,” “approximately,” “predicts,” “intends,” “plans,” “estimates,”
“anticipates”, “confident,” “conviction,” “identified” or the negative versions of these words or other comparable words thereof. These may include BXSL’s financial estimates and their underlying
assumptions, statements about plans, statements regarding pending transactions, objectives and expectations with respect to future operations, statements regarding future performance, statements regarding economic and market trends and statements
regarding identified but not yet closed investments. Such forward-looking statements are subject to various risks and uncertainties. Accordingly, there are or will be important factors that could cause actual outcomes or results to differ materially
from those indicated in such statements. BXSL believes these factors include but are not limited to those described under the section entitled “Risk Factors” in its prospectus and annual report for the most recent fiscal year, and any
such updated factors included in its periodic filings with the Securities and Exchange Commission (the “SEC”), which are accessible on the SEC’s website at www.sec.gov. These factors should not be construed as exhaustive and should
be read in conjunction with the other cautionary statements that are included in this document (or BXSL’s prospectus and other filings). Except as otherwise required by federal securities laws, BXSL undertakes no obligation to publicly update
or revise any forward-looking statements, whether as a result of new information, future developments or otherwise. Contacts Investors Media Stacy Wang, Head of Stakeholder Relations Thomas Clements Blackstoneshareholderrelations@blackstone.com
Thomas.Clements@blackstone.com 2 +1 888-756-8443 +1 646-482-6088

Blackstone Secured Lending Fund Second Quarter 2024 Results AUGUST 7,
2024 This presentation should be read in conjunction with BXSL’s latest quarterly report filed on Form 10-Q for the period ended June 30, 2024. Numbers are approximate and may not add up due to rounding.
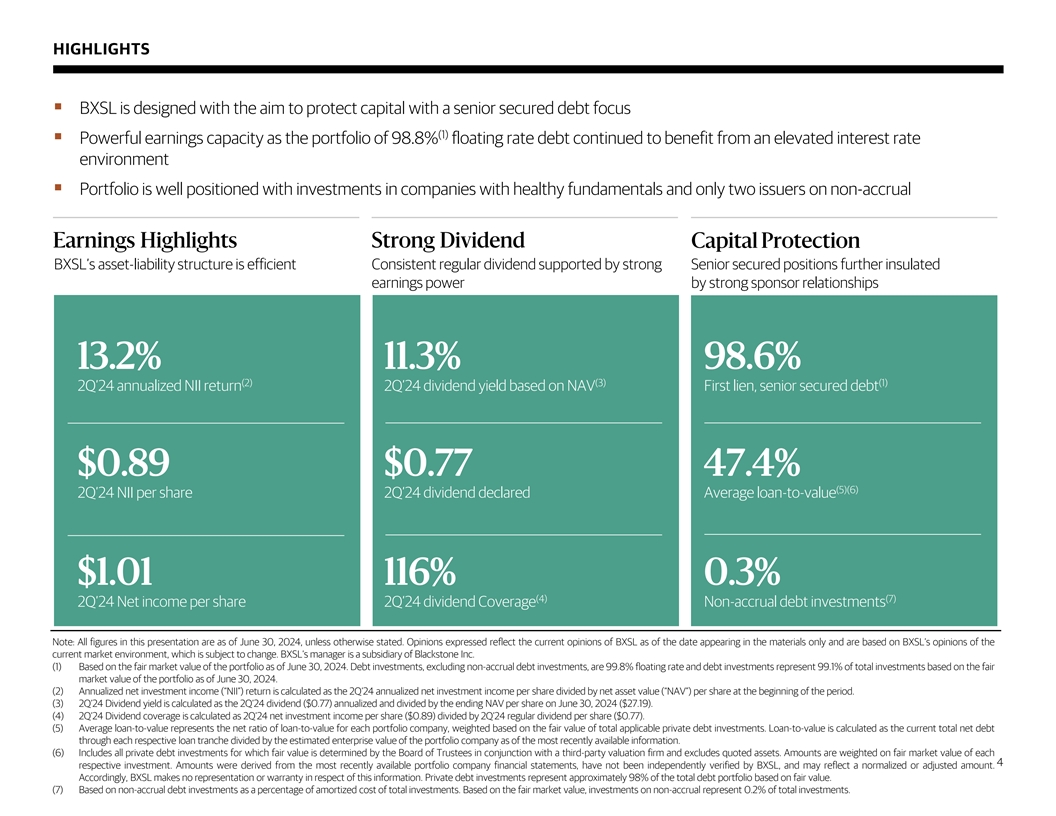
HIGHLIGHTS § BXSL is designed with the aim to protect capital with
a senior secured debt focus (1) § Powerful earnings capacity as the portfolio of 98.8% floating rate debt continued to benefit from an elevated interest rate environment § Portfolio is well positioned with investments in companies with
healthy fundamentals and only two issuers on non-accrual Earnings Highlights Strong Dividend Capital Protection BXSL’s asset-liability structure is efficient Consistent regular dividend supported by strong Senior secured positions further
insulated earnings power by strong sponsor relationships 13.2% 11.3% 98.6% (2) (3) (1) 2Q’24 annualized NII return 2Q’24 dividend yield based on NAV First lien, senior secured debt $0.89 $0.77 47.4% (5)(6) 2Q’24 NII per share
2Q’24 dividend declared Average loan-to-value Consistent, disciplined focus on low-leverage loans to strong sponsors $1.01 116% 0.3% (4) (7) 2Q’24 Net income per share 2Q’24 dividend Coverage Non-accrual debt investments Note: All
figures in this presentation are as of June 30, 2024, unless otherwise stated. Opinions expressed reflect the current opinions of BXSL as of the date appearing in the materials only and are based on BXSL’s opinions of the current market
environment, which is subject to change. BXSL’s manager is a subsidiary of Blackstone Inc. (1) Based on the fair market value of the portfolio as of June 30, 2024. Debt investments, excluding non-accrual debt investments, are 99.8% floating
rate and debt investments represent 99.1% of total investments based on the fair market value of the portfolio as of June 30, 2024. (2) Annualized net investment income (“NII”) return is calculated as the 2Q’24 annualized net
investment income per share divided by net asset value (“NAV”) per share at the beginning of the period. (3) 2Q’24 Dividend yield is calculated as the 2Q’24 dividend ($0.77) annualized and divided by the ending NAV per share
on June 30, 2024 ($27.19). (4) 2Q’24 Dividend coverage is calculated as 2Q’24 net investment income per share ($0.89) divided by 2Q’24 regular dividend per share ($0.77). (5) Average loan-to-value represents the net ratio of
loan-to-value for each portfolio company, weighted based on the fair value of total applicable private debt investments. Loan-to-value is calculated as the current total net debt through each respective loan tranche divided by the estimated
enterprise value of the portfolio company as of the most recently available information. (6) Includes all private debt investments for which fair value is determined by the Board of Trustees in conjunction with a third-party valuation firm and
excludes quoted assets. Amounts are weighted on fair market value of each 4 respective investment. Amounts were derived from the most recently available portfolio company financial statements, have not been independently verified by BXSL, and may
reflect a normalized or adjusted amount. Accordingly, BXSL makes no representation or warranty in respect of this information. Private debt investments represent approximately 98% of the total debt portfolio based on fair value. (7) Based on
non-accrual debt investments as a percentage of amortized cost of total investments. Based on the fair market value, investments on non-accrual represent 0.2% of total investments.
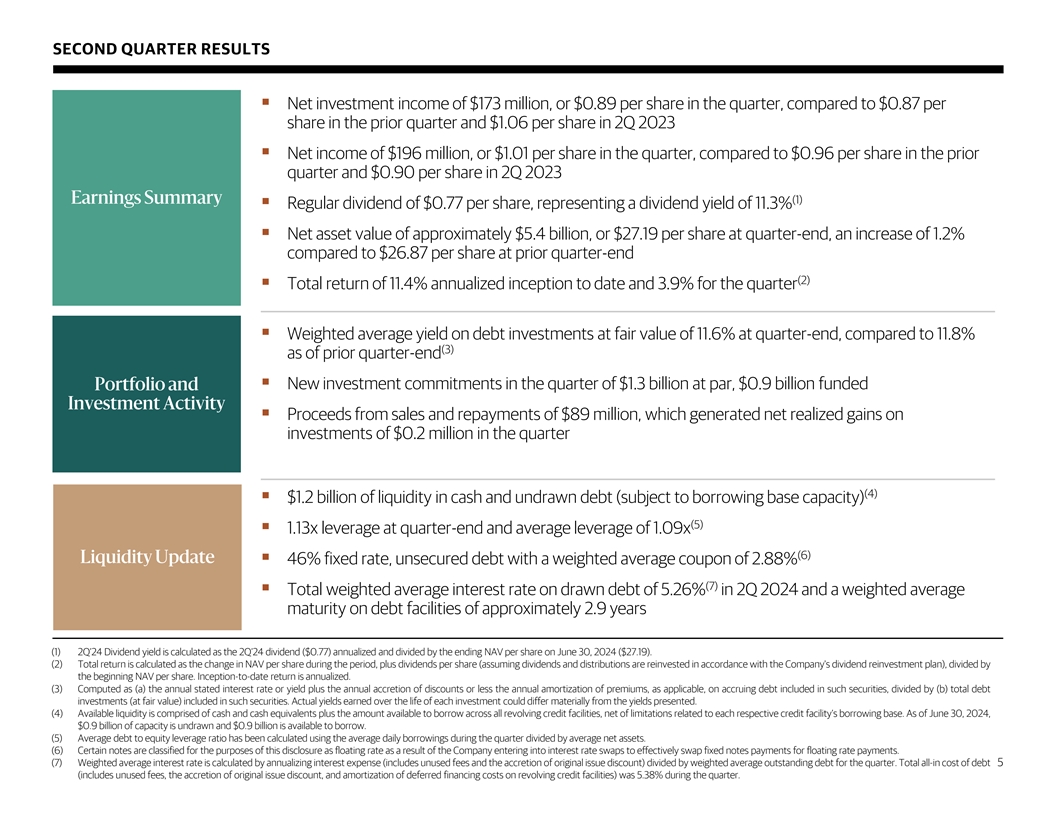
SECOND QUARTER RESULTS § Net investment income of $173 million, or
$0.89 per share in the quarter, compared to $0.87 per share in the prior quarter and $1.06 per share in 2Q 2023 § Net income of $196 million, or $1.01 per share in the quarter, compared to $0.96 per share in the prior quarter and $0.90 per
share in 2Q 2023 Earnings Summary (1) § Regular dividend of $0.77 per share, representing a dividend yield of 11.3% § Net asset value of approximately $5.4 billion, or $27.19 per share at quarter-end, an increase of 1.2% compared to $26.87
per share at prior quarter-end (2) § Total return of 11.4% annualized inception to date and 3.9% for the quarter § Weighted average yield on debt investments at fair value of 11.6% at quarter-end, compared to 11.8% (3) as of prior
quarter-end § New investment commitments in the quarter of $1.3 billion at par, $0.9 billion funded Portfolio and Investment Activity § Proceeds from sales and repayments of $89 million, which generated net realized gains on investments of
$0.2 million in the quarter (4) § $1.2 billion of liquidity in cash and undrawn debt (subject to borrowing base capacity) (5) § 1.13x leverage at quarter-end and average leverage of 1.09x (6) Liquidity Update § 46% fixed rate,
unsecured debt with a weighted average coupon of 2.88% (7) § Total weighted average interest rate on drawn debt of 5.26% in 2Q 2024 and a weighted average maturity on debt facilities of approximately 2.9 years (1) 2Q’24 Dividend yield is
calculated as the 2Q’24 dividend ($0.77) annualized and divided by the ending NAV per share on June 30, 2024 ($27.19). (2) Total return is calculated as the change in NAV per share during the period, plus dividends per share (assuming
dividends and distributions are reinvested in accordance with the Company's dividend reinvestment plan), divided by the beginning NAV per share. Inception-to-date return is annualized. (3) Computed as (a) the annual stated interest rate or yield
plus the annual accretion of discounts or less the annual amortization of premiums, as applicable, on accruing debt included in such securities, divided by (b) total debt investments (at fair value) included in such securities. Actual yields earned
over the life of each investment could differ materially from the yieldspresented. (4) Available liquidity is comprised of cash and cash equivalents plus the amount available to borrow across all revolving credit facilities, net of limitations
related to each respective credit facility’s borrowing base. As of June 30, 2024, $0.9 billion of capacity is undrawn and $0.9 billion is available to borrow. (5) Average debt to equity leverage ratio has been calculated using the average
daily borrowings during the quarter divided by average net assets. (6) Certain notes are classified for the purposes of this disclosure as floating rate as a result of the Company entering into interest rate swaps to effectively swap fixed notes
payments for floating rate payments. (7) Weighted average interest rate is calculated by annualizing interest expense (includes unused fees and the accretion of original issue discount) divided by weighted average outstanding debt for the quarter.
Total all-in cost of debt 5 (includes unused fees, the accretion of original issue discount, and amortization of deferred financing costs on revolving credit facilities) was 5.38% during the quarter.
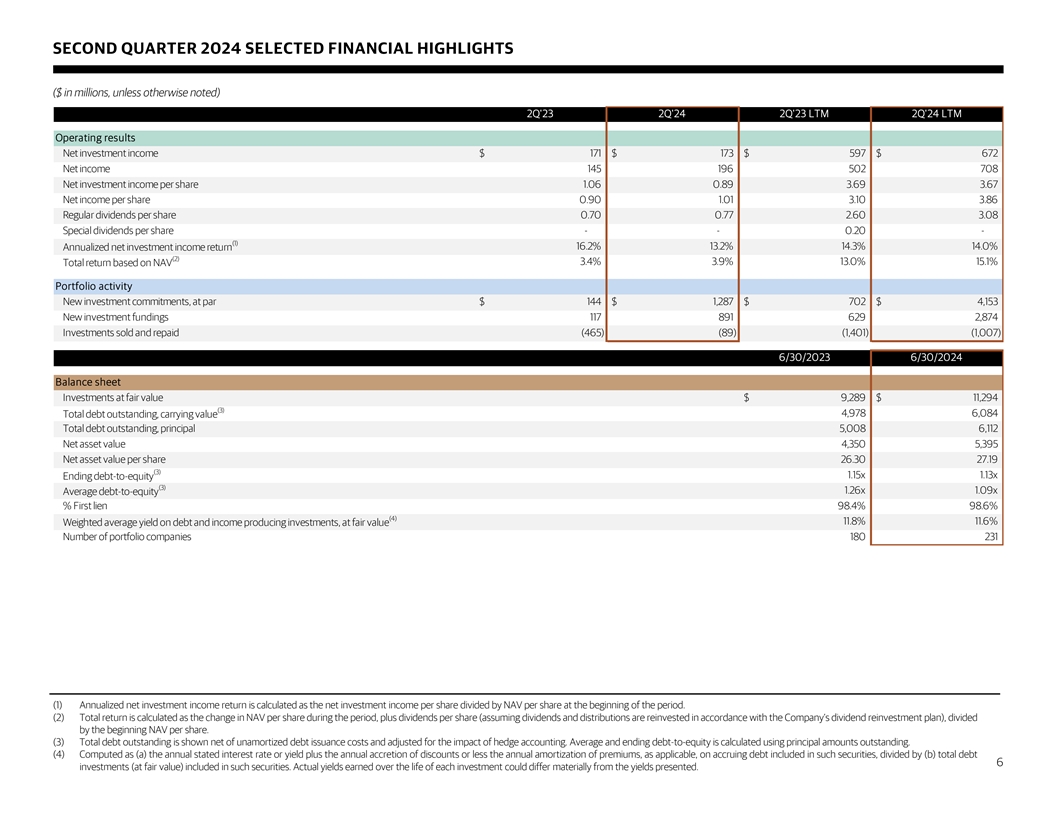
SECOND QUARTER 2024 SELECTED FINANCIAL HIGHLIGHTS ($ in millions, unless
otherwise noted) 2Q'23 2Q'24 2Q'23 LTM 2Q'24 LTM Operating results Net investment income $ 171 $ 173 $ 597 $ 672 Net income 145 196 502 708 Net investment income per share 1.06 0.89 3.69 3.67 Net income per share 0.90 1.01 3.10 3.86 Regular
dividends per share 0.70 0.77 2.60 3.08 Special dividends per share - - 0.20 - (1) 16.2% 13.2% 14.3% 14.0% Annualized net investment income return (2) 3.4% 3.9% 13.0% 15.1% Total return based on NAV Portfolio activity New investment commitments, at
par $ 144 $ 1,287 $ 702 $ 4,153 New investment fundings 117 891 629 2,874 Investments sold and repaid (465) (89) (1,401) (1,007) 6/30/2023 6/30/2024 Balance sheet Investments at fair value $ 9,289 $ 11,294 (3) Total debt outstanding, carrying value
4,978 6,084 Total debt outstanding, principal 5,008 6,112 Net asset value 4,350 5,395 Net asset value per share 26.30 27.19 (3) 1.15x 1.13x Ending debt-to-equity (3) Average debt-to-equity 1.26x 1.09x % First lien 98.4% 98.6% (4) 11.8% 11.6%
Weighted average yield on debt and income producing investments, at fair value Number of portfolio companies 180 231 (1) Annualized net investment income return is calculated as the net investment income per share divided by NAV per share at the
beginning of the period. (2) Total return is calculated as the change in NAV per share during the period, plus dividends per share (assuming dividends and distributions are reinvested in accordance with the Company’s dividend reinvestment
plan), divided by the beginning NAV per share. (3) Total debt outstanding is shown net of unamortized debt issuance costs and adjusted for the impact of hedge accounting. Average and ending debt-to-equity is calculated using principal amounts
outstanding. (4) Computed as (a) the annual stated interest rate or yield plus the annual accretion of discounts or less the annual amortization of premiums, as applicable, on accruing debt included in such securities, divided by (b) total debt 6
investments (at fair value) included in such securities. Actual yields earned over the life of each investment could differ materially from the yieldspresented.
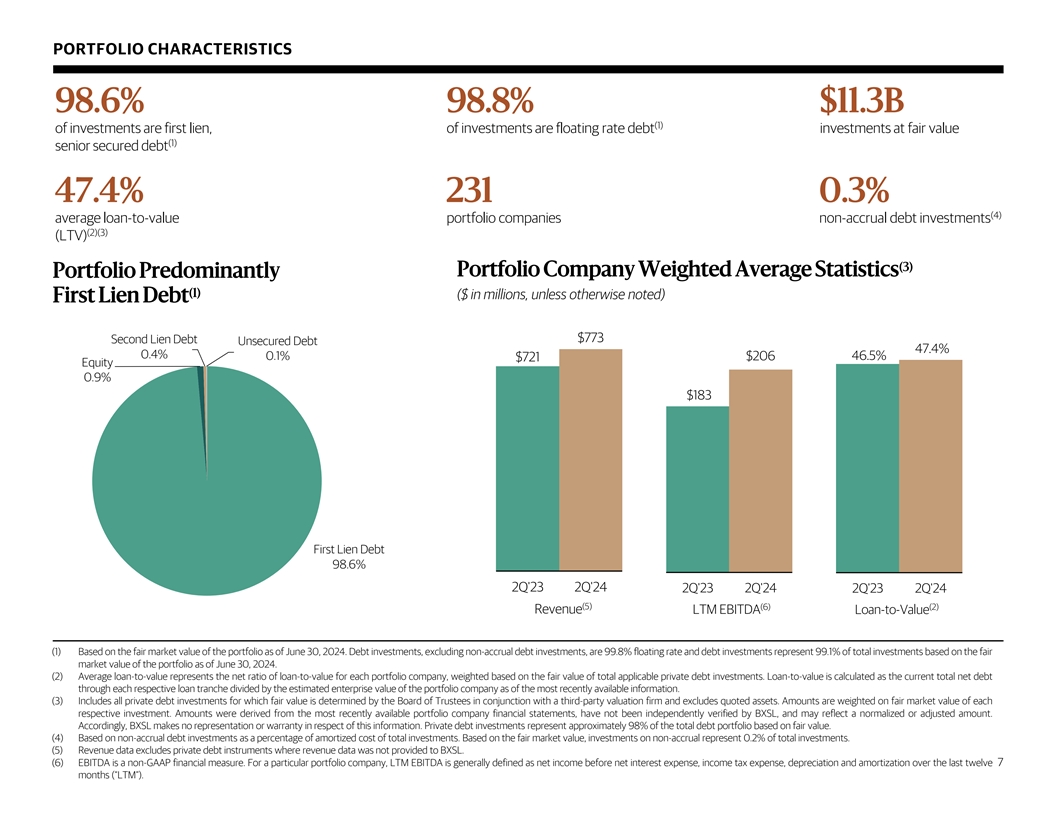
PORTFOLIO CHARACTERISTICS 98.6% 98.8% $11.3B (1) of investments are
first lien, of investments are floating rate debt investments at fair value (1) senior secured debt 47.4% 231 0.3% (4) average loan-to-value portfolio companies non-accrual debt investments (2)(3) (LTV) (3) Portfolio Company Weighted Average
Statistics Portfolio Predominantly (1) ($ in millions, unless otherwise noted) First Lien Debt $773 Second Lien Debt Unsecured Debt 47.4% 0.4% 0.1% $206 46.5% $721 Equity 0.9% $183 First Lien Debt 98.6% 2Q'23 2Q'24 2Q'23 2Q'24 2Q'23 2Q'24 (5) (6)
(2) Revenue LTM EBITDA Loan-to-Value (1) Based on the fair market value of the portfolio as of June 30, 2024. Debt investments, excluding non-accrual debt investments, are 99.8% floating rate and debt investments represent 99.1% of total investments
based on the fair market value of the portfolio as of June 30, 2024. (2) Average loan-to-value represents the net ratio of loan-to-value for each portfolio company, weighted based on the fair value of total applicable private debt investments.
Loan-to-value is calculated as the current total net debt through each respective loan tranche divided by the estimated enterprise value of the portfolio company as of the most recently available information. (3) Includes all private debt
investments for which fair value is determined by the Board of Trustees in conjunction with a third-party valuation firm and excludes quoted assets. Amounts are weighted on fair market value of each respective investment. Amounts were derived from
the most recently available portfolio company financial statements, have not been independently verified by BXSL, and may reflect a normalized or adjusted amount. Accordingly, BXSL makes no representation or warranty in respect of this information.
Private debt investments represent approximately 98% of the total debt portfolio based on fair value. (4) Based on non-accrual debt investments as a percentage of amortized cost of total investments. Based on the fair market value, investments on
non-accrual represent 0.2% of total investments. (5) Revenue data excludes private debt instruments where revenue data was not provided to BXSL. (6) EBITDA is a non-GAAP financial measure. For a particular portfolio company, LTM EBITDA is generally
defined as net income before net interest expense, income tax expense, depreciation and amortization over the last twelve 7 months (“LTM”).
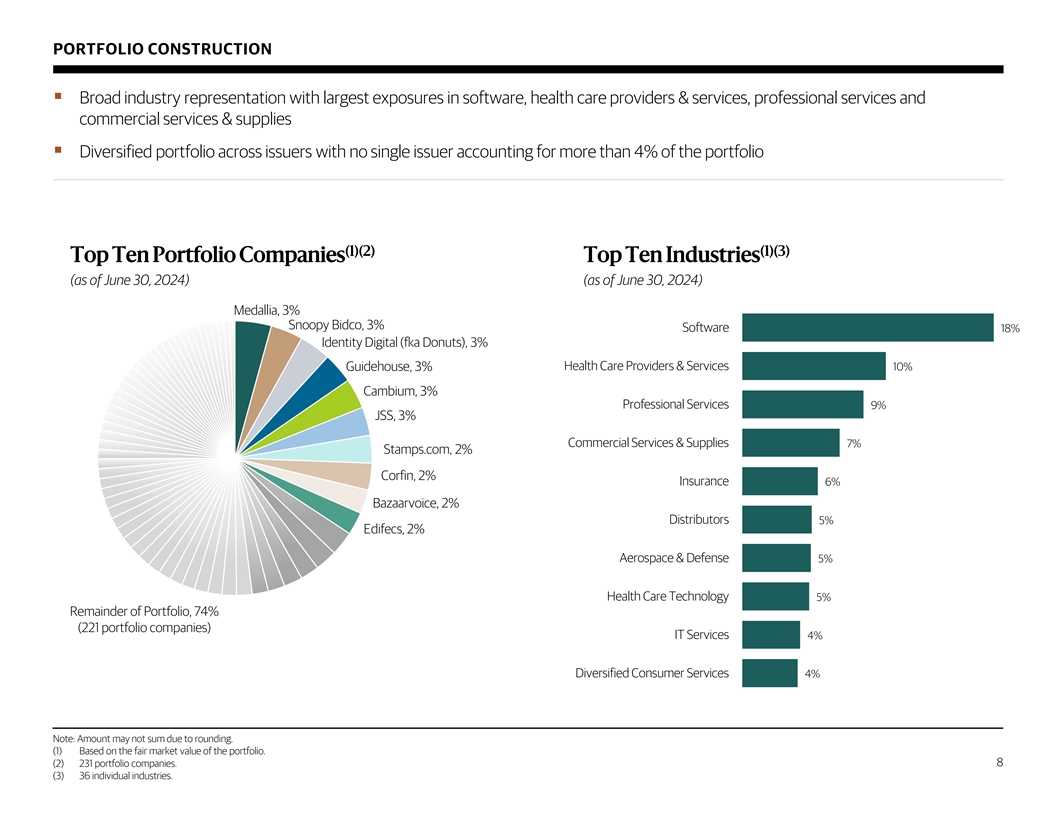
PORTFOLIO CONSTRUCTION § Broad industry representation with largest
exposures in software, health care providers & services, professional services and commercial services & supplies § Diversified portfolio across issuers with no single issuer accounting for more than 4% of the portfolio (1)(2) (1)(3)
Top Ten Portfolio Companies Top Ten Industries (as of June 30, 2024) (as of June 30, 2024) Medallia, 3% Snoopy Bidco, 3% Software 18% Identity Digital (fka Donuts), 3% Guidehouse, 3% Health Care Providers & Services 10% Cambium, 3% Professional
Services 9% JSS, 3% Commercial Services & Supplies 7% Stamps.com, 2% Corfin, 2% Insurance 6% Bazaarvoice, 2% Distributors 5% Edifecs, 2% Aerospace & Defense 5% Health Care Technology 5% Remainder of Portfolio, 74% (221 portfolio companies)
IT Services 4% Diversified Consumer Services 4% Note: Amount may not sum due to rounding. (1) Based on the fair market value of the portfolio. (2) 231 portfolio companies. 8 (3) 36 individual industries.
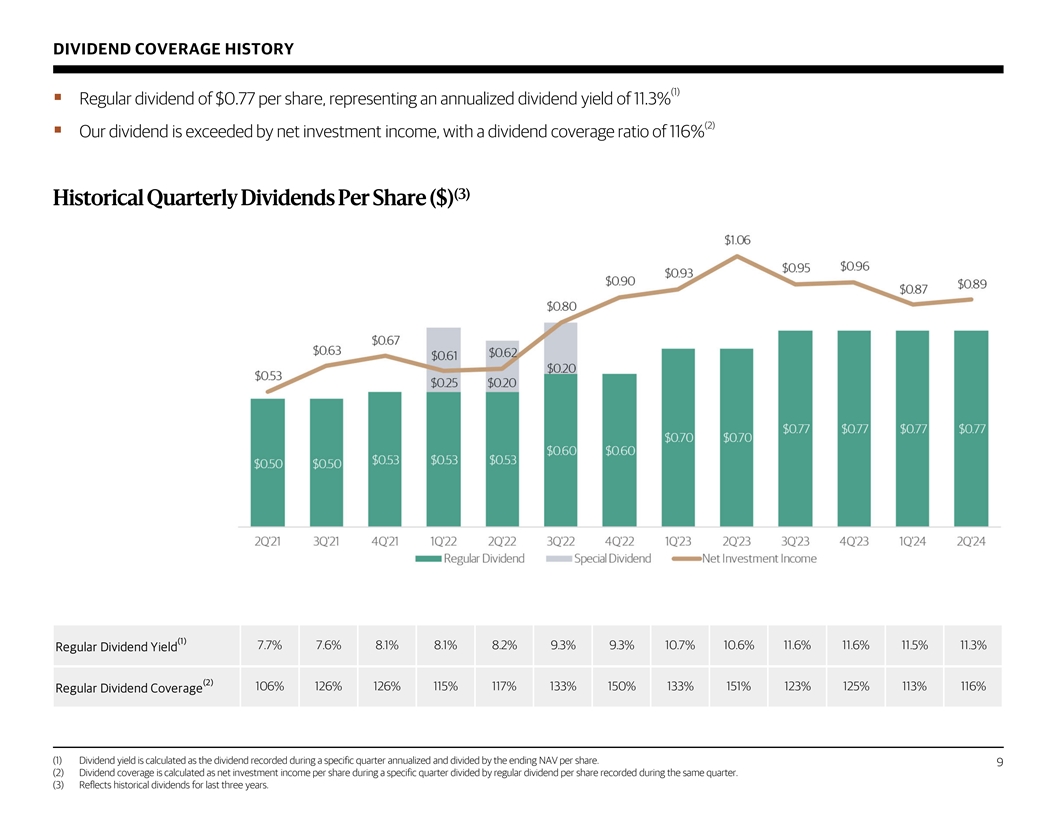
DIVIDEND COVERAGE HISTORY (1) § Regular dividend of $0.77 per
share, representing an annualized dividend yield of 11.3% (2) § Our dividend is exceeded by net investment income, with a dividend coverage ratio of 116% (3) Historical Quarterly Dividends Per Share ($) (1) 7.7% 7.6% 8.1% 8.1% 8.2% 9.3% 9.3%
10.7% 10.6% 11.6% 11.6% 11.5% 11.3% Regular Dividend Yield (2) 106% 126% 126% 115% 117% 133% 150% 133% 151% 123% 125% 113% 116% Regular Dividend Coverage (1) Dividend yield is calculated as the dividend recorded during a specific quarter annualized
and divided by the ending NAV per share. 9 (2) Dividend coverage is calculated as net investment income per share during a specific quarter divided by regular dividend per share recorded during the same quarter. (3) Reflects historical dividends for
last three years.
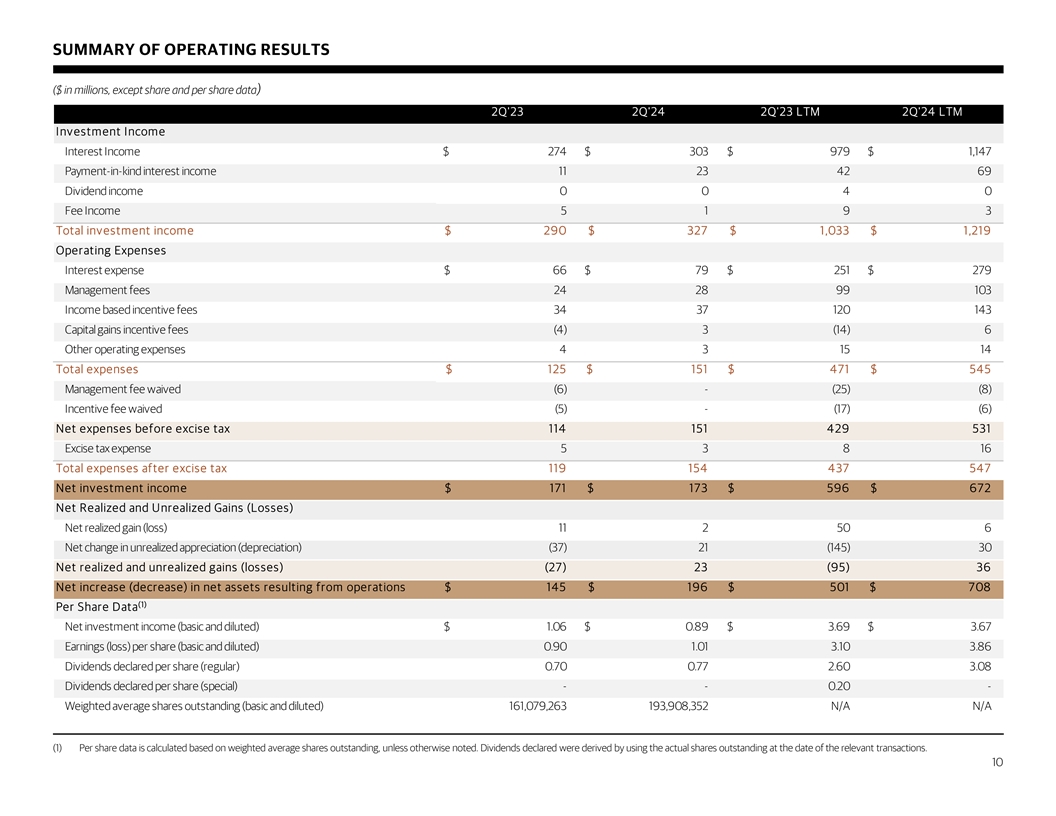
SUMMARY OF OPERATING RESULTS ($ in millions, except share and per share
data) 2Q'23 2Q'24 2Q'23 LTM 2Q'24 LTM Investment Income Interest Income $ 274 $ 303 $ 979 $ 1,147 Payment-in-kind interest income 11 23 42 69 Dividend income 0 0 4 0 Fee Income 5 1 9 3 Total investment income $ 290 $ 327 $ 1,033 $ 1,219 Operating
Expenses Interest expense $ 66 $ 79 $ 251 $ 279 Management fees 24 28 99 103 Income based incentive fees 34 37 120 143 Capital gains incentive fees (4) 3 (14) 6 Other operating expenses 4 3 15 14 Total expenses $ 125 $ 151 $ 471 $ 545 Management fee
waived (6) - (25) (8) Incentive fee waived (5) - (17) (6) Net expenses before excise tax 114 151 429 531 Excise tax expense 5 3 8 16 Total expenses after excise tax 119 154 437 547 Net investment income $ 171 $ 173 $ 596 $ 672 Net Realized and
Unrealized Gains (Losses) Net realized gain (loss) 11 2 50 6 Net change in unrealized appreciation (depreciation) (37) 21 (145) 30 Net realized and unrealized gains (losses) (27) 23 (95) 36 Net increase (decrease) in net assets resulting from
operations $ 145 $ 196 $ 501 $ 708 (1) Per Share Data Net investment income (basic and diluted) $ 1.06 $ 0.89 $ 3.69 $ 3.67 Earnings (loss) per share (basic and diluted) 0.90 1.01 3.10 3.86 Dividends declared per share (regular) 0.70 0.77 2.60 3.08
Dividends declared per share (special) - - 0.20 - Weighted average shares outstanding (basic and diluted) 161,079,263 193,908,352 N/A N/A (1) Per share data is calculated based on weighted average shares outstanding, unless otherwise noted.
Dividends declared were derived by using the actual shares outstanding at the date of the relevant transactions. 10
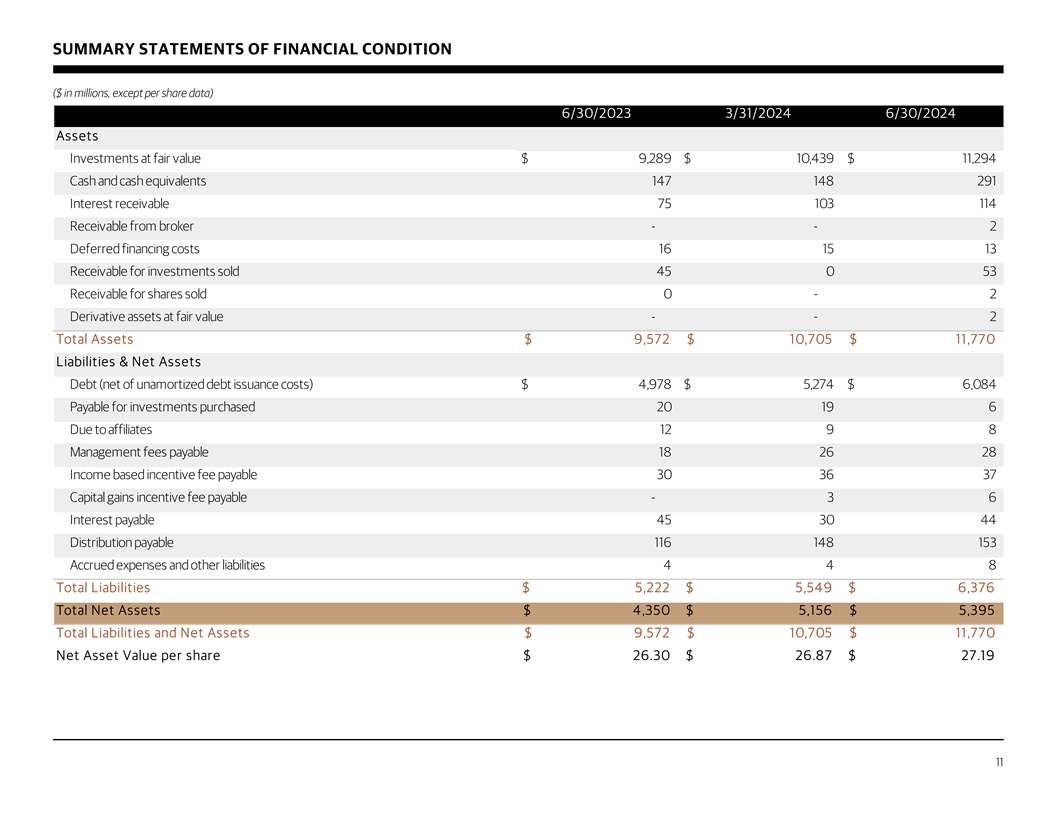
SUMMARY STATEMENTS OF FINANCIAL CONDITION ($ in millions, except per
share data) 6/30/2023 3/31/2024 6/30/2024 Assets Investments at fair value $ 9,289 $ 10,439 $ 11,294 Cash and cash equivalents 147 148 2 91 Interest receivable 75 103 114 Receivable from broker - - 2 Deferred financing costs 16 15 13 Receivable for
investments sold 45 0 53 Receivable for shares sold 0 - 2 Derivative assets at fair value - - 2 Total Assets $ 9, 572 $ 10,705 $ 1 1,770 Liabilities & Net Assets Debt (net of unamortized debt issuance costs) $ 4,978 $ 5,274 $ 6,084 Payable for
investments purchased 20 19 6 Due to affiliates 12 9 8 Management fees payable 18 26 28 Income based incentive fee payable 30 36 37 Capital gains incentive fee payable - 3 6 Interest payable 45 30 44 Distribution payable 11 6 148 153 Accrued
expenses and other liabilities 4 4 8 Total Liabilities $ 5,222 $ 5,549 $ 6 ,376 Total Net Assets $ 4, 350 $ 5,156 $ 5,395 Total Liabilities and Net Assets $ 9,572 $ 10,705 $ 11,770 Net Asset Value per share $ 26.30 $ 26.87 $ 27.19 11
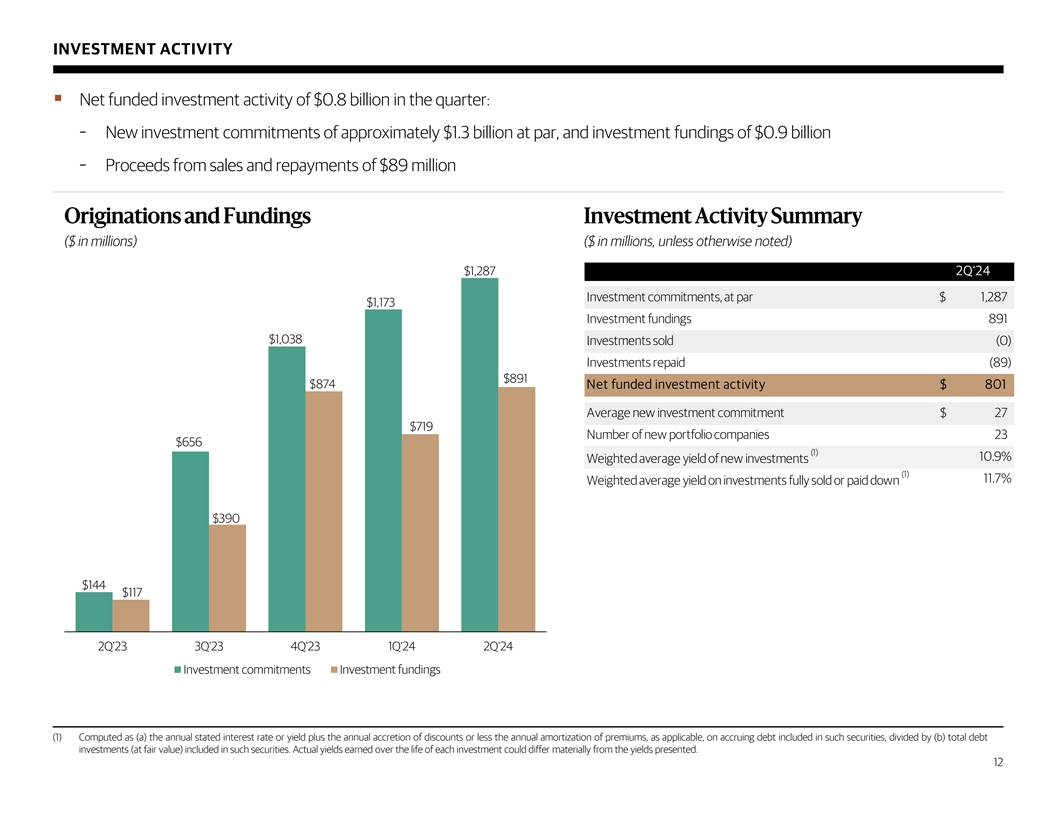
INVESTMENT ACTIVITY § Net funded investment activity of $0.8
billion in the quarter: – New investment commitments of approximately $1.3 billion at par, and investment fundings of $0.9 billion – Proceeds from sales and repayments of $89 million Originations and Fundings Investment Activity Summary
($ in millions) ($ in millions, unless otherwise noted) 2Q'24 $1,287 Investment commitments, at par $ 1,287 $1,173 Investment fundings 891 $1,038 Investments sold (0) Investments repaid (89) $891 $874 Net funded investment activity $ 801 Average new
investment commitment $ 27 $719 Number of new portfolio companies 23 $656 (1) 10.9% Weighted average yield of new investments (1) 11.7% Weighted average yield on investments fully sold or paid down $390 $144 $117 2Q'23 3Q'23 4Q'23 1Q'24 2Q'24
Investment commitments Investment fundings (1) Computed as (a) the annual stated interest rate or yield plus the annual accretion of discounts or less the annual amortization of premiums, as applicable, on accruing debt included in such securities,
divided by (b) total debt investments (at fair value) included in such securities. Actual yields earned over the life of each investment could differ materially from the yieldspresented. 12
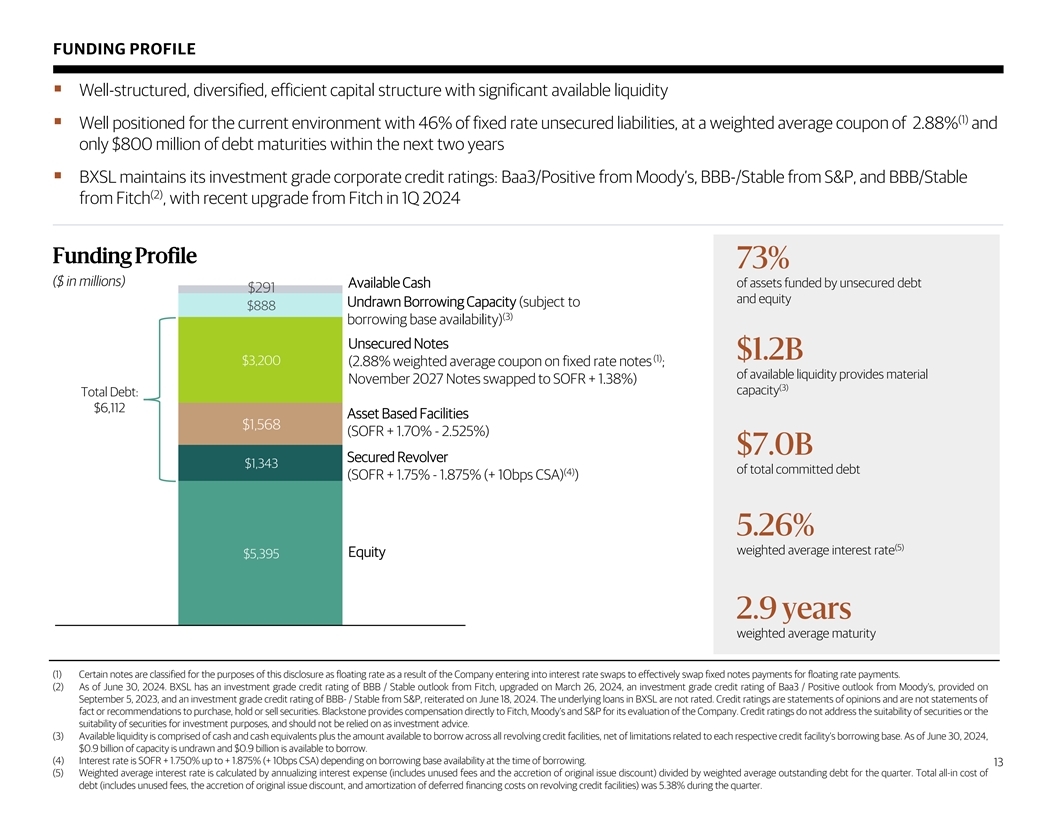
FUNDING PROFILE § Well-structured, diversified, efficient capital
structure with significant available liquidity (1) § Well positioned for the current environment with 46% of fixed rate unsecured liabilities, at a weighted average coupon of 2.88% and only $800 million of debt maturities within the next two
years § BXSL maintains its investment grade corporate credit ratings: Baa3/Positive from Moody’s, BBB-/Stable from S&P, and BBB/Stable (2) from Fitch , with recent upgrade from Fitch in 1Q 2024 Funding Profile 73% ($ in millions)
Available Cash of assets funded by unsecured debt $291 and equity Undrawn Borrowing Capacity (subject to $888 (3) borrowing base availability) Unsecured Notes $1.2B (1) $3,200 (2.88% weighted average coupon on fixed rate notes ; of available
liquidity provides material November 2027 Notes swapped to SOFR + 1.38%) (3) capacity Total Debt: $6,112 Asset Based Facilities $1,568 (SOFR + 1.70% - 2.525%) $7.0B Secured Revolver $1,343 of total committed debt (4) (SOFR + 1.75% - 1.875% (+ 10bps
CSA) ) 5.26% (5) weighted average interest rate Equity $5,395 2.9 years weighted average maturity 1 (1) Certain notes are classified for the purposes of this disclosure as floating rate as a result of the Company entering into interest rate swaps to
effectively swap fixed notes payments for floating rate payments. (2) As of June 30, 2024. BXSL has an investment grade credit rating of BBB / Stable outlook from Fitch, upgraded on March 26, 2024, an investment grade credit rating of Baa3 /
Positive outlook from Moody’s, provided on September 5, 2023, and an investment grade credit rating of BBB- / Stable from S&P, reiterated on June 18, 2024. The underlying loans in BXSL are not rated. Credit ratings are statements of
opinions and are not statements of fact or recommendations to purchase, hold or sell securities. Blackstone provides compensation directly to Fitch, Moody’s and S&P for its evaluation of the Company. Credit ratings do not address the
suitability of securities or the suitability of securities for investment purposes, and should not be relied on as investment advice. (3) Available liquidity is comprised of cash and cash equivalents plus the amount available to borrow across all
revolving credit facilities, net of limitations related to each respective credit facility’s borrowing base. As of June 30, 2024, $0.9 billion of capacity is undrawn and $0.9 billion is available to borrow. (4) Interest rate is SOFR + 1.750%
up to + 1.875% (+ 10bps CSA) depending on borrowing base availability at the time of borrowing. 13 (5) Weighted average interest rate is calculated by annualizing interest expense (includes unused fees and the accretion of original issue discount)
divided by weighted average outstanding debt for the quarter. Total all-in cost of debt (includes unused fees, the accretion of original issue discount, and amortization of deferred financing costs on revolving credit facilities) was 5.38% during
the quarter.

Supplemental Details 14
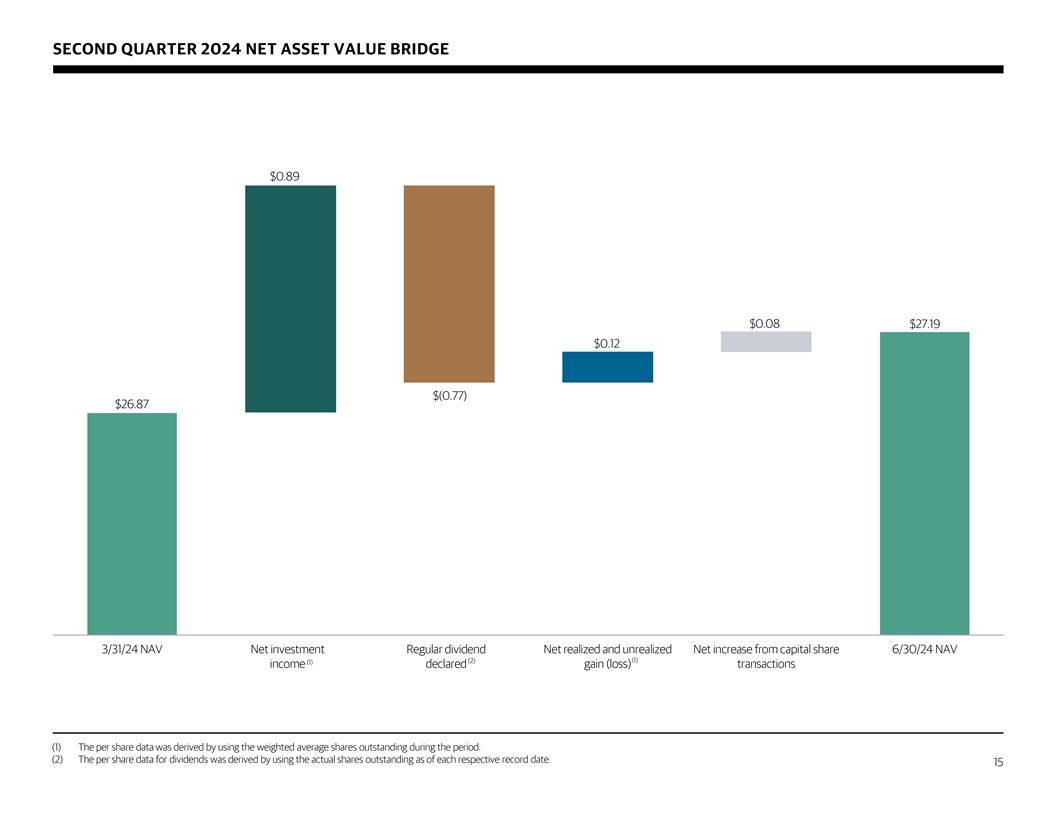
SECOND QUARTER 2024 NET ASSET VALUE BRIDGE $0.89 $0.08 $27.19 $0.12
$(0.77) $26.87 3/31/24 NAV Net investment Regular dividend Net realized and unrealized Net increase from capital share 6/30/24 NAV (2) (1) (1) income declared gain (loss) transactions (1) The per share data was derived by using the weighted average
shares outstanding during the period. (2) The per share data for dividends was derived by using the actual shares outstanding as of each respective record date. 15
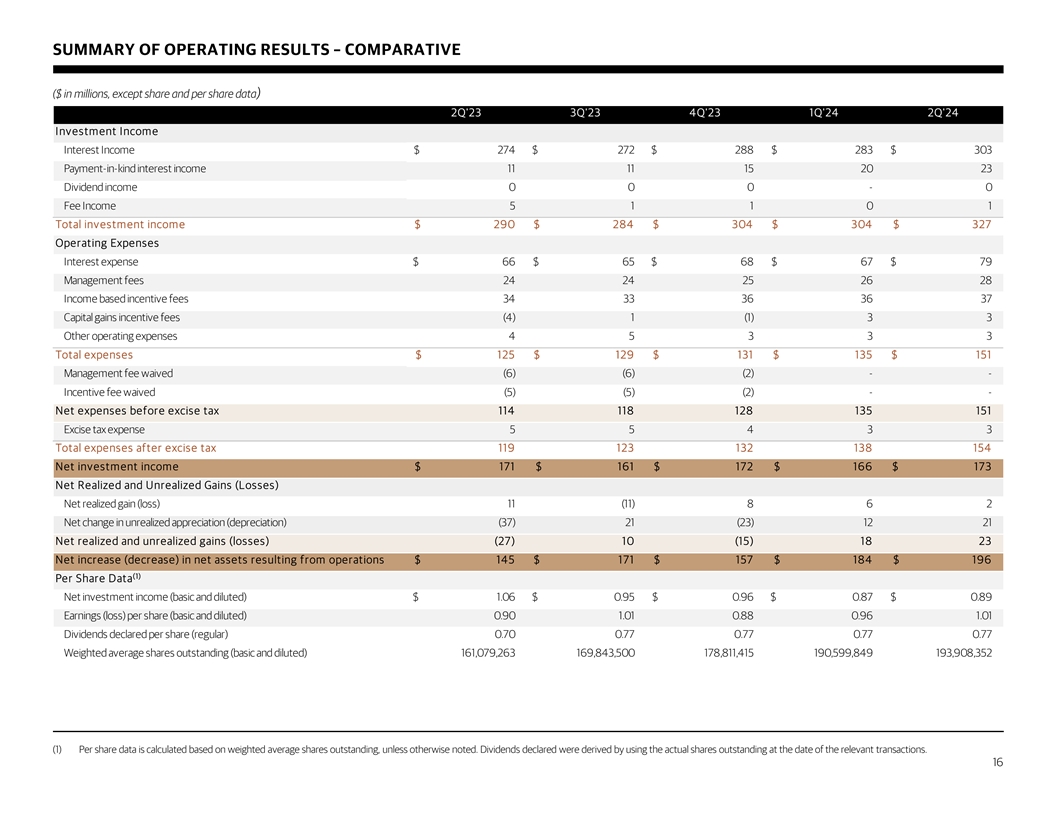
SUMMARY OF OPERATING RESULTS – COMPARATIVE ($ in millions, except
share and per share data) 2Q'23 3Q'23 4Q'23 1Q'24 2Q'24 Investment Income Interest Income $ 274 $ 272 $ 288 $ 283 $ 303 Payment-in-kind interest income 11 11 15 20 23 Dividend income 0 0 0 - 0 Fee Income 5 1 1 0 1 Total investment income $ 290 $ 284
$ 304 $ 304 $ 327 Operating Expenses Interest expense $ 66 $ 65 $ 68 $ 67 $ 79 Management fees 24 24 25 26 28 Income based incentive fees 34 33 36 36 37 Capital gains incentive fees (4) 1 (1) 3 3 Other operating expenses 4 5 3 3 3 Total expenses $
125 $ 129 $ 131 $ 135 $ 151 Management fee waived (6) (6) (2) - - Incentive fee waived (5) (5) (2) - - Net expenses before excise tax 114 118 128 135 151 Excise tax expense 5 5 4 3 3 Total expenses after excise tax 119 123 132 138 154 Net investment
income $ 171 $ 161 $ 172 $ 166 $ 173 Net Realized and Unrealized Gains (Losses) Net realized gain (loss) 11 (11) 8 6 2 Net change in unrealized appreciation (depreciation) (37) 21 (23) 12 21 Net realized and unrealized gains (losses) (27) 10 (15) 18
23 Net increase (decrease) in net assets resulting f rom operations $ 145 $ 171 $ 157 $ 184 $ 196 (1) Per Share Data Net investment income (basic and diluted) $ 1.06 $ 0.95 $ 0.96 $ 0.87 $ 0.89 Earnings (loss) per share (basic and diluted) 0.90 1.01
0.88 0.96 1.01 Dividends declared per share (regular) 0.70 0.77 0.77 0.77 0.77 Weighted average shares outstanding (basic and diluted) 161,079,263 169,843,500 178,811,415 190,599,849 193,908,352 (1) Per share data is calculated based on weighted
average shares outstanding, unless otherwise noted. Dividends declared were derived by using the actual shares outstanding at the date of the relevant transactions. 16
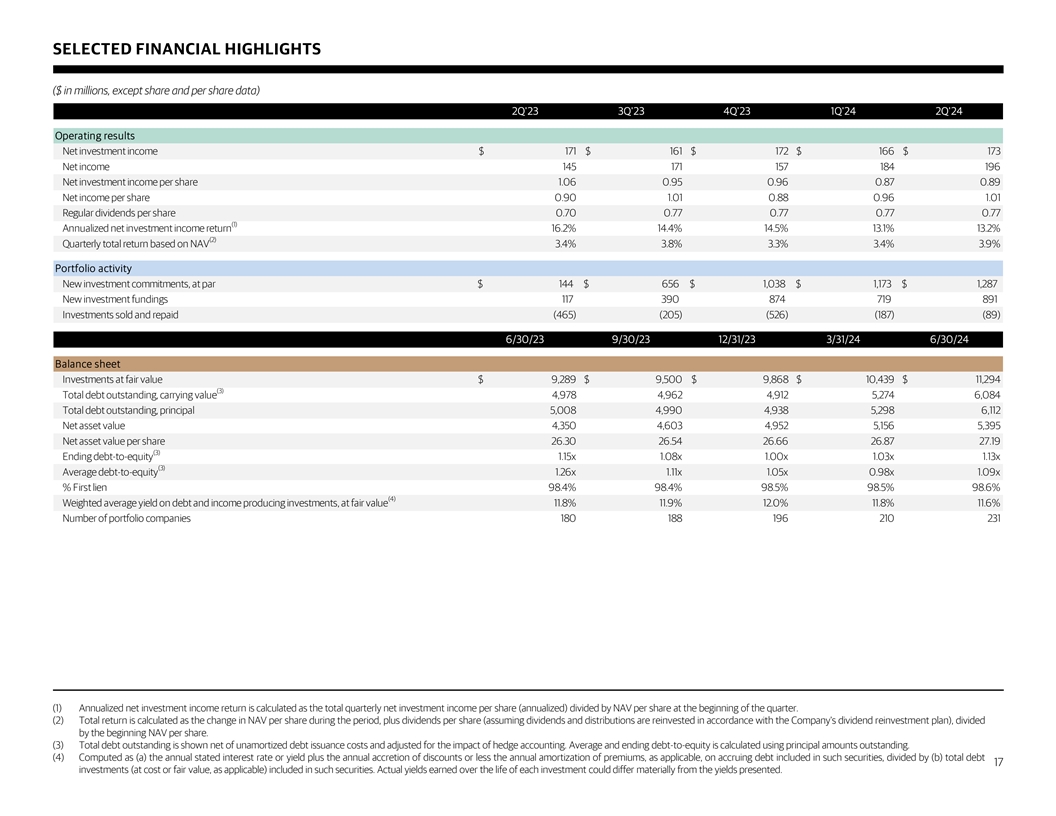
SELECTED FINANCIAL HIGHLIGHTS ($ in millions, except share and per
share data) 2Q'23 3Q'23 4Q'23 1Q'24 2Q'24 Operating results Net investment income $ 171 $ 161 $ 172 $ 166 $ 173 Net income 145 171 157 184 196 Net investment income per share 1.06 0.95 0.96 0.87 0.89 Net income per share 0.90 1.01 0.88 0.96 1.01
Regular dividends per share 0.70 0.77 0.77 0.77 0.77 (1) Annualized net investment income return 16.2% 14.4% 14.5% 13.1% 13.2% (2) Quarterly total return based on NAV 3.4% 3.8% 3.3% 3.4% 3.9% Portfolio activity New investment commitments, at par $
144 $ 656 $ 1,038 $ 1,173 $ 1 ,287 New investment fundings 117 390 874 719 891 Investments sold and repaid (465) (205) (526) (187) (89) 6/30/23 9/30/23 12/31/23 3/31/24 6/30/24 Balance sheet Investments at fair value $ 9,289 $ 9,500 $ 9,868 $ 10,439
$ 11,294 (3) Total debt outstanding, carrying value 4,978 4,962 4,912 5,274 6,084 Total debt outstanding, principal 5,008 4,990 4,938 5,298 6,112 Net asset value 4,350 4,603 4,952 5,156 5,395 Net asset value per share 26.30 26.54 26.66 26.87 27.19
(3) Ending debt-to-equity 1.15x 1.08x 1.00x 1.03x 1.13x (3) Average debt-to-equity 1.26x 1.11x 1.05x 0.98x 1.09x % First lien 98.4% 98.4% 98.5% 98.5% 98.6% (4) Weighted average yield on debt and income producing investments, at fair value 11.8%
11.9% 12.0% 11.8% 11.6% Number of portfolio companies 180 188 196 210 231 (1) Annualized net investment income return is calculated as the total quarterly net investment income per share (annualized) divided by NAV per share at the beginning of the
quarter. (2) Total return is calculated as the change in NAV per share during the period, plus dividends per share (assuming dividends and distributions are reinvested in accordance with the Company's dividend reinvestment plan), divided by the
beginning NAV per share. (3) Total debt outstanding is shown net of unamortized debt issuance costs and adjusted for the impact of hedge accounting. Average and ending debt-to-equity is calculated using principal amounts outstanding. (4) Computed as
(a) the annual stated interest rate or yield plus the annual accretion of discounts or less the annual amortization of premiums, as applicable, on accruing debt included in such securities, divided by (b) total debt 17 investments (at cost or fair
value, as applicable) included in such securities. Actual yields earned over the life of each investment could differ materially from the yields presented.
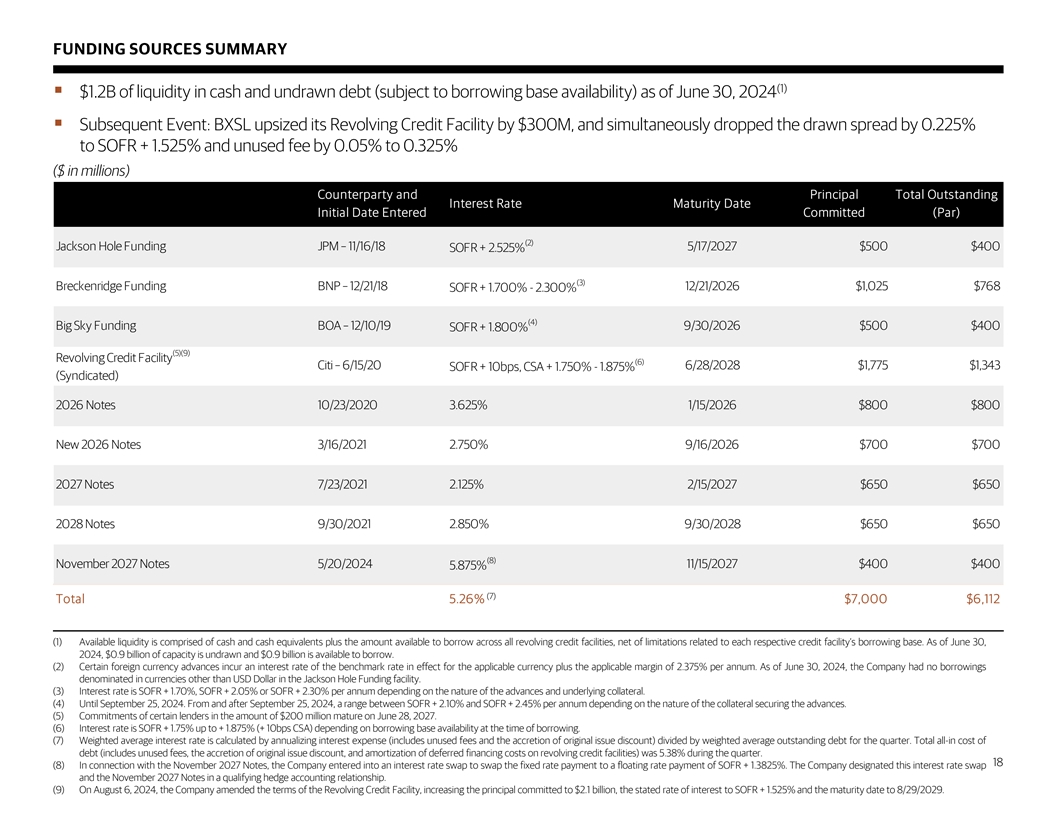
FUNDING SOURCES SUMMARY (1) § $1.2B of liquidity in cash and
undrawn debt (subject to borrowing base availability) as of June 30, 2024 § Subsequent Event: BXSL upsized its Revolving Credit Facility by $300M, and simultaneously dropped the drawn spread by 0.225% to SOFR + 1.525% and unused fee by 0.05% to
0.325% ($ in millions) Counterparty and Principal Total Outstanding Interest Rate Maturity Date Initial Date Entered Committed (Par) (2) Jackson Hole Funding JPM – 11/16/18 5/17/2027 $500 $400 SOFR + 2.525% (3) Breckenridge Funding BNP –
12/21/18 12/21/2026 $1,025 $768 SOFR + 1.700% - 2.300% (4) Big Sky Funding BOA – 12/10/19 9/30/2026 $500 $400 SOFR + 1.800% (5)(9) Revolving Credit Facility (6) Citi – 6/15/20 6/28/2028 $1,775 $1,343 SOFR + 10bps, CSA + 1.750% - 1.875%
(Syndicated) 2026 Notes 10/23/2020 3.625% 1/15/2026 $800 $800 New 2026 Notes 3/16/2021 2.750% 9/16/2026 $700 $700 2027 Notes 7/23/2021 2.125% 2/15/2027 $650 $650 2028 Notes 9/30/2021 2.850% 9/30/2028 $650 $650 (8) November 2027 Notes 5/20/2024
11/15/2027 $400 $400 5.875% (7) Total 5.26% $7,000 $6,112 (1) Available liquidity is comprised of cash and cash equivalents plus the amount available to borrow across all revolving credit facilities, net of limitations related to each respective
credit facility’s borrowing base. As of June 30, 2024, $0.9 billion of capacity is undrawn and $0.9 billion is available to borrow. (2) Certain foreign currency advances incur an interest rate of the benchmark rate in effect for the applicable
currency plus the applicable margin of 2.375% per annum. As of June 30, 2024, the Company had no borrowings denominated in currencies other than USD Dollar in the Jackson Hole Funding facility. (3) Interest rate is SOFR + 1.70%, SOFR + 2.05% or SOFR
+ 2.30% per annum depending on the nature of the advances and underlying collateral. (4) Until September 25, 2024. From and after September 25, 2024, a range between SOFR + 2.10% and SOFR + 2.45% per annum depending on the nature of the collateral
securing the advances. (5) Commitments of certain lenders in the amount of $200 million mature on June 28, 2027. (6) Interest rate is SOFR + 1.75% up to + 1.875% (+ 10bps CSA) depending on borrowing base availability at the time of borrowing. (7)
Weighted average interest rate is calculated by annualizing interest expense (includes unused fees and the accretion of original issue discount) divided by weighted average outstanding debt for the quarter. Total all-in cost of debt (includes unused
fees, the accretion of original issue discount, and amortization of deferred financing costs on revolving credit facilities) was 5.38% during the quarter. 18 (8) In connection with the November 2027 Notes, the Company entered into an interest rate
swap to swap the fixed rate payment to a floating rate payment of SOFR + 1.3825%. The Company designated this interest rate swap and the November 2027 Notes in a qualifying hedge accounting relationship. (9) On August 6, 2024, the Company amended
the terms of the Revolving Credit Facility, increasing the principal committed to $2.1 billion, the stated rate of interest to SOFR + 1.525% and the maturity date to 8/29/2029.

Important Disclosure Information 19
FORWARD LOOKING STATEMENTS Certain information contained in this
communication constitutes “forward-looking statements” within the meaning of the federal securities laws. These forward-looking statements can be identified by the use of forward-looking terminology, such as “outlook,”
“indicator,” “believes,” “expects,” “potential,” “continues,” “may,” “can,” “will,” “should,” “seeks,”
“approximately,” “predicts,” “intends,” “plans,” “estimates,” “anticipates”, “confident,” “conviction,” “identified” or thenegative versions
of thesewords or othercomparablewords thereof. Thesemay include BXSL’sfinancial estimatesand theirunderlyingassumptions, statements about plans, statements regarding pending transactions, objectives and expectations with respect to future
operations, statements regarding future performance, statements regarding economic and market trends and statements regarding identified but not yet closed investments. Such forward-looking statements are subject to various risks and uncertainties.
Accordingly, there are or will be important factors that could cause actual outcomes or results to differ materially from those indicated in such statements. BXSL believes these factors include but are not limited to those described under the
section entitled “Risk Factors” in its prospectus and annual report for the most recent fiscal year, and any such updated factors included in its periodic filings with the Securities and Exchange Commission (the “SEC”), which
are accessible on the SEC’s website at www.sec.gov. These factors should not be construed as exhaustive and should be read in conjunction with the other cautionary statements that are included in this document (or BXSL’s prospectus and
other filings). Except as otherwiserequiredbyfederalsecurities laws, BXSLundertakesnoobligationtopubliclyupdate or revise anyforward-looking statements,whetheras a result of new information, future developments or otherwise. 20
v3.24.2.u1
| X |
- DefinitionBoolean flag that is true when the XBRL content amends previously-filed or accepted submission.
| Name: |
dei_AmendmentFlag |
| Namespace Prefix: |
dei_ |
| Data Type: |
xbrli:booleanItemType |
| Balance Type: |
na |
| Period Type: |
duration |
|
| X |
- DefinitionFor the EDGAR submission types of Form 8-K: the date of the report, the date of the earliest event reported; for the EDGAR submission types of Form N-1A: the filing date; for all other submission types: the end of the reporting or transition period. The format of the date is YYYY-MM-DD.
| Name: |
dei_DocumentPeriodEndDate |
| Namespace Prefix: |
dei_ |
| Data Type: |
xbrli:dateItemType |
| Balance Type: |
na |
| Period Type: |
duration |
|
| X |
- DefinitionThe type of document being provided (such as 10-K, 10-Q, 485BPOS, etc). The document type is limited to the same value as the supporting SEC submission type, or the word 'Other'.
| Name: |
dei_DocumentType |
| Namespace Prefix: |
dei_ |
| Data Type: |
dei:submissionTypeItemType |
| Balance Type: |
na |
| Period Type: |
duration |
|
| X |
- DefinitionAddress Line 1 such as Attn, Building Name, Street Name
| Name: |
dei_EntityAddressAddressLine1 |
| Namespace Prefix: |
dei_ |
| Data Type: |
xbrli:normalizedStringItemType |
| Balance Type: |
na |
| Period Type: |
duration |
|
| X |
- DefinitionAddress Line 2 such as Street or Suite number
| Name: |
dei_EntityAddressAddressLine2 |
| Namespace Prefix: |
dei_ |
| Data Type: |
xbrli:normalizedStringItemType |
| Balance Type: |
na |
| Period Type: |
duration |
|
| X |
- Definition
+ References
+ Details
| Name: |
dei_EntityAddressCityOrTown |
| Namespace Prefix: |
dei_ |
| Data Type: |
xbrli:normalizedStringItemType |
| Balance Type: |
na |
| Period Type: |
duration |
|
| X |
- DefinitionCode for the postal or zip code
| Name: |
dei_EntityAddressPostalZipCode |
| Namespace Prefix: |
dei_ |
| Data Type: |
xbrli:normalizedStringItemType |
| Balance Type: |
na |
| Period Type: |
duration |
|
| X |
- DefinitionName of the state or province.
| Name: |
dei_EntityAddressStateOrProvince |
| Namespace Prefix: |
dei_ |
| Data Type: |
dei:stateOrProvinceItemType |
| Balance Type: |
na |
| Period Type: |
duration |
|
| X |
- DefinitionA unique 10-digit SEC-issued value to identify entities that have filed disclosures with the SEC. It is commonly abbreviated as CIK. Reference 1: http://www.xbrl.org/2003/role/presentationRef
-Publisher SEC
-Name Exchange Act
-Number 240
-Section 12
-Subsection b-2
| Name: |
dei_EntityCentralIndexKey |
| Namespace Prefix: |
dei_ |
| Data Type: |
dei:centralIndexKeyItemType |
| Balance Type: |
na |
| Period Type: |
duration |
|
| X |
- DefinitionIndicate if registrant meets the emerging growth company criteria. Reference 1: http://www.xbrl.org/2003/role/presentationRef
-Publisher SEC
-Name Exchange Act
-Number 240
-Section 12
-Subsection b-2
| Name: |
dei_EntityEmergingGrowthCompany |
| Namespace Prefix: |
dei_ |
| Data Type: |
xbrli:booleanItemType |
| Balance Type: |
na |
| Period Type: |
duration |
|
| X |
- DefinitionCommission file number. The field allows up to 17 characters. The prefix may contain 1-3 digits, the sequence number may contain 1-8 digits, the optional suffix may contain 1-4 characters, and the fields are separated with a hyphen.
| Name: |
dei_EntityFileNumber |
| Namespace Prefix: |
dei_ |
| Data Type: |
dei:fileNumberItemType |
| Balance Type: |
na |
| Period Type: |
duration |
|
| X |
- DefinitionTwo-character EDGAR code representing the state or country of incorporation.
| Name: |
dei_EntityIncorporationStateCountryCode |
| Namespace Prefix: |
dei_ |
| Data Type: |
dei:edgarStateCountryItemType |
| Balance Type: |
na |
| Period Type: |
duration |
|
| X |
- DefinitionThe exact name of the entity filing the report as specified in its charter, which is required by forms filed with the SEC. Reference 1: http://www.xbrl.org/2003/role/presentationRef
-Publisher SEC
-Name Exchange Act
-Number 240
-Section 12
-Subsection b-2
| Name: |
dei_EntityRegistrantName |
| Namespace Prefix: |
dei_ |
| Data Type: |
xbrli:normalizedStringItemType |
| Balance Type: |
na |
| Period Type: |
duration |
|
| X |
- DefinitionThe Tax Identification Number (TIN), also known as an Employer Identification Number (EIN), is a unique 9-digit value assigned by the IRS. Reference 1: http://www.xbrl.org/2003/role/presentationRef
-Publisher SEC
-Name Exchange Act
-Number 240
-Section 12
-Subsection b-2
| Name: |
dei_EntityTaxIdentificationNumber |
| Namespace Prefix: |
dei_ |
| Data Type: |
dei:employerIdItemType |
| Balance Type: |
na |
| Period Type: |
duration |
|
| X |
- DefinitionLocal phone number for entity.
| Name: |
dei_LocalPhoneNumber |
| Namespace Prefix: |
dei_ |
| Data Type: |
xbrli:normalizedStringItemType |
| Balance Type: |
na |
| Period Type: |
duration |
|
| X |
- DefinitionBoolean flag that is true when the Form 8-K filing is intended to satisfy the filing obligation of the registrant as pre-commencement communications pursuant to Rule 13e-4(c) under the Exchange Act. Reference 1: http://www.xbrl.org/2003/role/presentationRef
-Publisher SEC
-Name Exchange Act
-Number 240
-Section 13e
-Subsection 4c
| Name: |
dei_PreCommencementIssuerTenderOffer |
| Namespace Prefix: |
dei_ |
| Data Type: |
xbrli:booleanItemType |
| Balance Type: |
na |
| Period Type: |
duration |
|
| X |
- DefinitionBoolean flag that is true when the Form 8-K filing is intended to satisfy the filing obligation of the registrant as pre-commencement communications pursuant to Rule 14d-2(b) under the Exchange Act. Reference 1: http://www.xbrl.org/2003/role/presentationRef
-Publisher SEC
-Name Exchange Act
-Number 240
-Section 14d
-Subsection 2b
| Name: |
dei_PreCommencementTenderOffer |
| Namespace Prefix: |
dei_ |
| Data Type: |
xbrli:booleanItemType |
| Balance Type: |
na |
| Period Type: |
duration |
|
| X |
- DefinitionTitle of a 12(b) registered security. Reference 1: http://www.xbrl.org/2003/role/presentationRef
-Publisher SEC
-Name Exchange Act
-Number 240
-Section 12
-Subsection b
| Name: |
dei_Security12bTitle |
| Namespace Prefix: |
dei_ |
| Data Type: |
dei:securityTitleItemType |
| Balance Type: |
na |
| Period Type: |
duration |
|
| X |
- DefinitionName of the Exchange on which a security is registered. Reference 1: http://www.xbrl.org/2003/role/presentationRef
-Publisher SEC
-Name Exchange Act
-Number 240
-Section 12
-Subsection d1-1
| Name: |
dei_SecurityExchangeName |
| Namespace Prefix: |
dei_ |
| Data Type: |
dei:edgarExchangeCodeItemType |
| Balance Type: |
na |
| Period Type: |
duration |
|
| X |
- DefinitionBoolean flag that is true when the Form 8-K filing is intended to satisfy the filing obligation of the registrant as soliciting material pursuant to Rule 14a-12 under the Exchange Act. Reference 1: http://www.xbrl.org/2003/role/presentationRef
-Publisher SEC
-Name Exchange Act
-Section 14a
-Number 240
-Subsection 12
| Name: |
dei_SolicitingMaterial |
| Namespace Prefix: |
dei_ |
| Data Type: |
xbrli:booleanItemType |
| Balance Type: |
na |
| Period Type: |
duration |
|
| X |
- DefinitionTrading symbol of an instrument as listed on an exchange.
| Name: |
dei_TradingSymbol |
| Namespace Prefix: |
dei_ |
| Data Type: |
dei:tradingSymbolItemType |
| Balance Type: |
na |
| Period Type: |
duration |
|
| X |
- DefinitionBoolean flag that is true when the Form 8-K filing is intended to satisfy the filing obligation of the registrant as written communications pursuant to Rule 425 under the Securities Act. Reference 1: http://www.xbrl.org/2003/role/presentationRef
-Publisher SEC
-Name Securities Act
-Number 230
-Section 425
| Name: |
dei_WrittenCommunications |
| Namespace Prefix: |
dei_ |
| Data Type: |
xbrli:booleanItemType |
| Balance Type: |
na |
| Period Type: |
duration |
|
Blackstone Secured Lending (NYSE:BXSL)
과거 데이터 주식 차트
부터 8월(8) 2024 으로 9월(9) 2024

Blackstone Secured Lending (NYSE:BXSL)
과거 데이터 주식 차트
부터 9월(9) 2023 으로 9월(9) 2024
